Attached files
| file | filename |
|---|---|
| 8-K - 8-K - CF Industries Holdings, Inc. | a18-18113_18k.htm |
2017 2T0h1ir8dFQirusat rHtearlf FFininaanncciaial lRReessuultlsts November 1, 2017 August 1, 2018 NYSE: CF NYSE: CF 1

Safe harbor statement All statements in this communication by CF Industries Holdings, Inc. (together with its subsidiaries, the “Company”), other than those relating to historical facts, are forward-looking statements. Forward-looking statements can generally be identified by their use of terms such as “anticipate,” “believe,” “could,” “estimate,” “expect,” “intend,” “may,” “plan,” “predict,” “project,” “will” or “would” and similar terms and phrases, including references to assumptions. Forward-looking statements are not guarantees of future performance and are subject to a number of assumptions, risks and uncertainties, many of which are beyond the Company’s control, which could cause actual results to differ materially from such statements. These statements may include, but are not limited to, statements about strategic plans and statements about future financial and operating results. Important factors that could cause actual results to differ materially from those in the forward-looking statements include, among others, the cyclical nature of the Company’s business and the agricultural sector; the global commodity nature of the Company’s fertilizer products, the impact of global supply and demand on the Company’s selling prices, and the intense global competition from other fertilizer producers; conditions in the U.S. and European agricultural industry; the volatility of natural gas prices in North America and Europe; difficulties in securing the supply and delivery of raw materials, increases in their costs or delays or interruptions in their delivery; reliance on third party providers of transportation services and equipment; the significant risks and hazards involved in producing and handling the Company’s products against which the Company may not be fully insured; the Company’s ability to manage its indebtedness; operating and financial restrictions imposed on the Company by the agreements governing the Company’s senior secured indebtedness; risks associated with the Company’s incurrence of additional indebtedness; the Company's ability to maintain compliance with covenants under the agreements governing its indebtedness; downgrades of the Company’s credit ratings; risks associated with cyber security; weather conditions; risks associated with changes in tax laws and disagreements with taxing authorities; the Company’s reliance on a limited number of key facilities; potential liabilities and expenditures related to environmental, health and safety laws and regulations and permitting requirements; future regulatory restrictions and requirements related to greenhouse gas emissions; risks associated with expansions of the Company’s business, including unanticipated adverse consequences and the significant resources that could be required; the seasonality of the fertilizer business; the impact of changing market conditions on the Company’s forward sales programs; risks involving derivatives and the effectiveness of the Company’s risk measurement and hedging activities; risks associated with the operation or management of the strategic venture with CHS Inc. (the "CHS Strategic Venture"), risks and uncertainties relating to the market prices of the fertilizer products that are the subject of the supply agreement with CHS Inc. over the life of the supply agreement and the risk that any challenges related to the CHS Strategic Venture will harm the Company's other business relationships; risks associated with the Company’s Point Lisas Nitrogen Limited joint venture; acts of terrorism and regulations to combat terrorism; risks associated with international operations; and deterioration of global market and economic conditions. More detailed information about factors that may affect the Company’s performance and could cause actual results to differ materially from those in any forward-looking statements may be found in CF Industries Holdings, Inc.’s filings with the Securities and Exchange Commission, including CF Industries Holdings, Inc.’s most recent annual and quarterly reports on Form 10-K and Form 10-Q, which are available in the Investor Relations section of the Company’s website. Forward-looking statements are given only as of the date of this presentation and the Company disclaims any obligation to update or revise the forward-looking statements, whether as a result of new information, future events or otherwise, except as required by law. 2
Note regarding non-GAAP financial measures The company reports its financial results in accordance with U.S. generally accepted accounting principles (GAAP). Management believes that EBITDA and adjusted EBITDA which are non-GAAP financial measures, provide additional meaningful information regarding the company's performance and financial strength. Non-GAAP financial measures should be viewed in addition to, and not as an alternative for, the company's reported results prepared in accordance with GAAP. In addition, because not all companies use identical calculations, EBITDA and adjusted EBITDA included in this presentation may not be comparable to similarly titled measures of other companies. Reconciliations of EBITDA and adjusted EBITDA to the most directly comparable GAAP measures are provided in the tables accompanying this presentation. EBITDA is defined as net earnings (loss) attributable to common stockholders plus interest expense - net, income taxes, and depreciation and amortization. Other adjustments include the elimination of loan fee amortization that is included in both interest and amortization, and the portion of depreciation that is included in noncontrolling interests. The company has presented EBITDA because management uses the measure to track performance and believes that it is frequently used by securities analysts, investors and other interested parties in the evaluation of companies in the industry. Adjusted EBITDA is defined as EBITDA adjusted with the selected items included in EBITDA as summarized in the tables accompanying this presentation. The company has presented adjusted EBITDA because management uses adjusted EBITDA, and believes it is useful to investors, as a supplemental financial measure in the comparison of year-over-year performance. 3
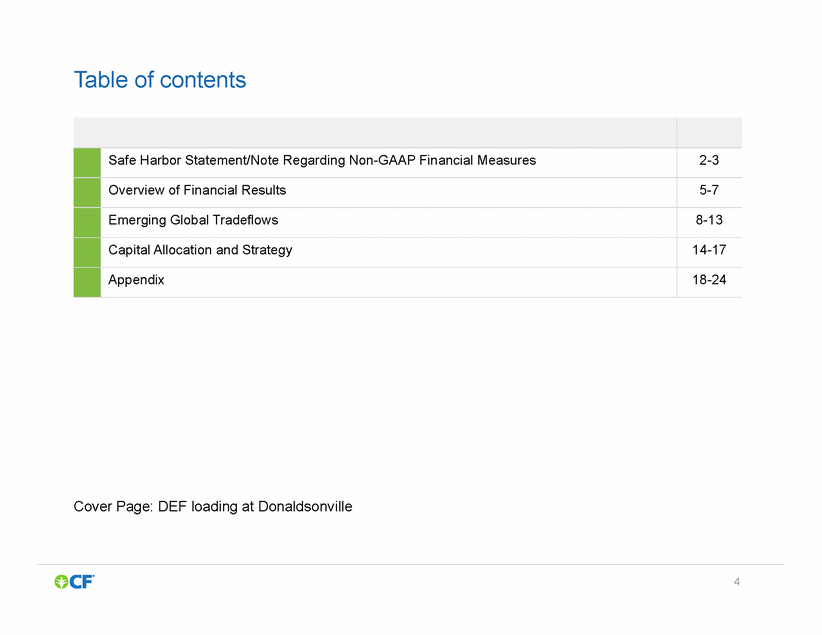
Table of contents Cover Page: DEF loading at Donaldsonville 4 Safe Harbor Statement/Note Regarding Non-GAAP Financial Measures 2-3 Overview of Financial Results 5-7 Emerging Global Tradeflows 8-13 Capital Allocation and Strategy 14-17 Appendix 18-24
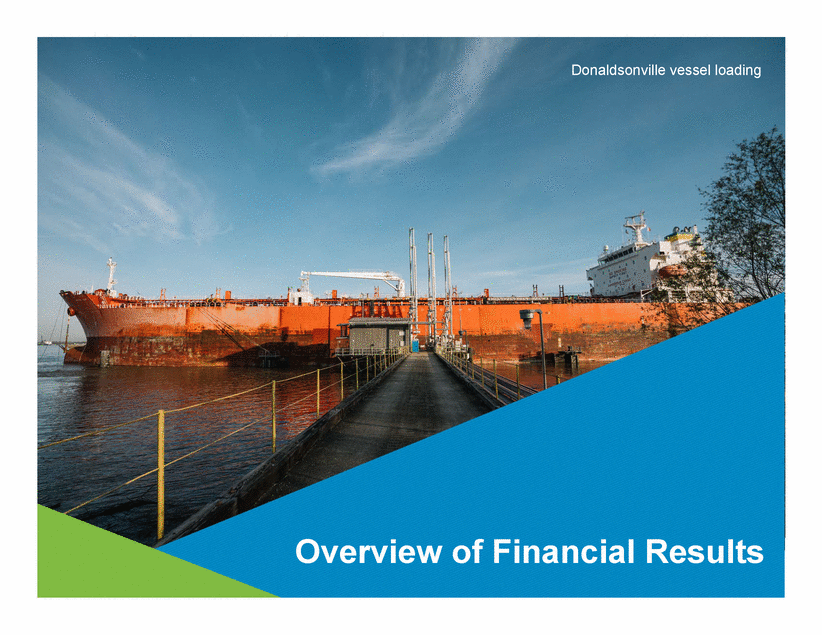
Donaldsonville vessel loading Overview of Financial Results
First half 2018 results • First half 2018 net earnings of $211 million, or $0.90 per diluted share; first half EBITDA(1) of $772 million and adjusted EBITDA(1) of $764 million Q2 net earnings of $148 million, or $0.63 per diluted share; Q2 EBITDA(1) of $470 million and adjusted EBITDA(1) of $468 million First half 2018 sales volumes slightly exceed first half 2017; record 5.5 million tons in second quarter 2018 Announced $500 million share repurchase authorization through June 2020; reaffirmed commitment to repay remaining $500 million Public Senior Notes on or before May 2020 Net sales in Q2 2018 were $1,300 million compared to $1,124 million in Q2 2017 due to higher average selling prices across all segments and higher sales volumes across most segments; net sales in 1H 2018 were $2,257 million from $2,161 million in 1H 2017 Total sales volume for Q2 2018 was higher compared to Q2 2017 due to carry-over demand from Q1 to Q2 as a result of unfavorable weather earlier in the year delaying the spring application season Total sales volumes for the first half of 2018 were similar to the first half of 2017; this reflects that CF’s extensive system of production, storage and transportation assets is set up to accommodate changes in timing of fertilizer applications Average selling prices for the second quarter and first half 2018 were higher year-over-year across all segments as higher energy prices in other producing regions and enforcement of environmental regulations in China reduced global nitrogen production, tightening the global nitrogen supply and demand balance For the first six months of 2018 the average cost of natural gas reflected in cost of sales was $3.11 per MMBtu, compared to $3.51 per MMBtu in the first six months of 2017 • • • • • • • • • As of June 30, 2018, the 12-month rolling average recordable incident rate was 0.64 incidents per 200,000 work hours, well below industry averages Gross ammonia production during the second quarter was approximately 2.5 million tons, and for the first half of 2018 was approximately 5.0 million tons • (1) See appendix for reconciliation of EBITDA and adjusted EBITDA 6 Safe and Efficient Operations Commercial Environment Financial Overview
Financial results - second quarter and first half 2018 3 211 (20) 148 stockholders 18 (8) 71 (5) natural gas derivatives (1) Depreciation and amortization was $241 million and $434 million for the three and six months ended June 30, 2018, respectively, and $217 million and $422 million for the three and six months ended June 30, 2017, respectively (2) See appendix for reconciliation of EBITDA and adjusted EBITDA (3) (4) Includes the cost of natural gas that is included in cost of sales during the period under the first-in, first-out inventory cost method Includes realized gains and losses on natural gas derivatives settled during the period. Excludes unrealized mark-to-market gains and losses on natural gas derivatives 7 $ in millions, except percentages, per MMBtu and EPS Q2 2018 Q2 2017 First Half 2018 First Half 2017 Net sales$1,300$1,124$2,257$2,161 Gross margin(1)312173502280 - As percentage of net sales24.0%15.4%22.2%13.0% Net earnings (loss) attributable to common Net earnings (loss) per diluted share0.630.010.90(0.09) EBITDA(2)470275772493 Adjusted EBITDA(2)468303764575 Diluted average shares outstanding234.9233.7234.8233.2 Natural gas (per MMBtu): Natural gas costs in cost of sales(3)$2.92$3.35$3.08$3.50 Realized derivatives loss(4)0.030.040.030.01 Cost of natural gas in cost of sales2.953.393.113.51 Unrealized net mark-to-market (gain) loss on
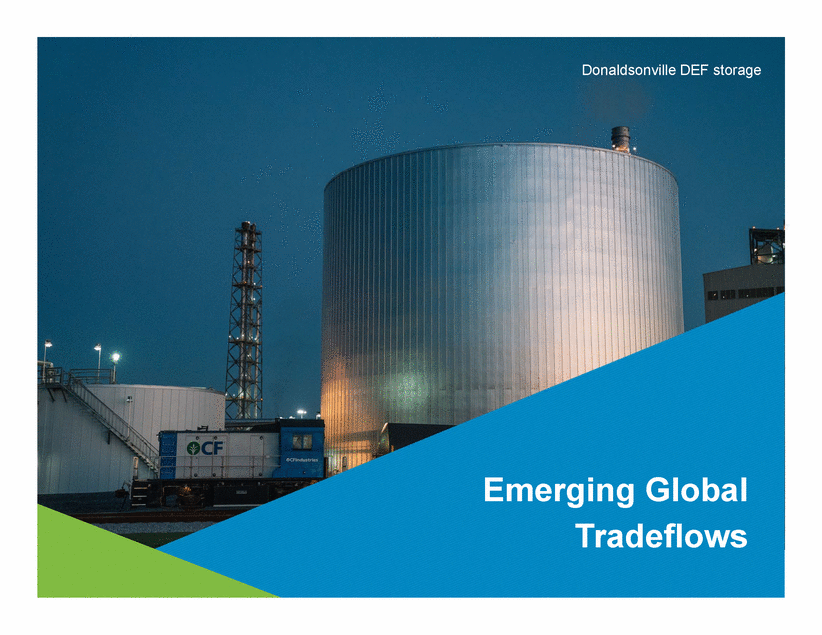
Donaldsonville DEF storage Emerging Global Tradeflows
Market overview • Increased production costs, particularly for producers in Europe and China, have raised and flattened the upper half of the global cost curve, supporting higher prices Natural gas per MMBtu at Dutch TTF hub was 53% higher in June 2018 than June 2017; TTF forward curve suggests continued European price increases into 2019 Price per metric ton of anthracite coal is 32% higher in May 2018 compared to May 2017 CF believes demand in Brazil and India will support nitrogen prices through 2018 • • • • Several plants in Ukraine and Central Europe were idled in Q2 due to high energy costs, with additional facilities remaining in operation by using imported ammonia In addition to higher coal prices, enforcement of environmental regulations in China continues to result in closures, dramatically reducing urea available for export; exports were 74% less January through June 2018 than the same period in 2017 CF expects increased Brazilian imports in 2H 2018 due to 25% lower imports in 1H compared to 1H 2017 and announced closure of Petrobras urea plants in August 2018 CF projects 4.3M metric tons nameplate urea capacity to start-up in 2018, more than offset by 7.1M metric tons nameplate urea capacity closure during the year in China, Brazil, and Kuwait • • • • CF expects global supply/demand balance will tighten further, with net global urea supply growth well below historical nitrogen demand annual growth rate of ~2% Forward prices for Brent crude oil and European natural gas are increasing into 2019 while Henry Hub prices stay relatively flat – reinforcing the enduring structural advantage of CF’s access to North American natural gas • 9 Longer-term Outlook Near-term Outlook Global Pricing Dynamics
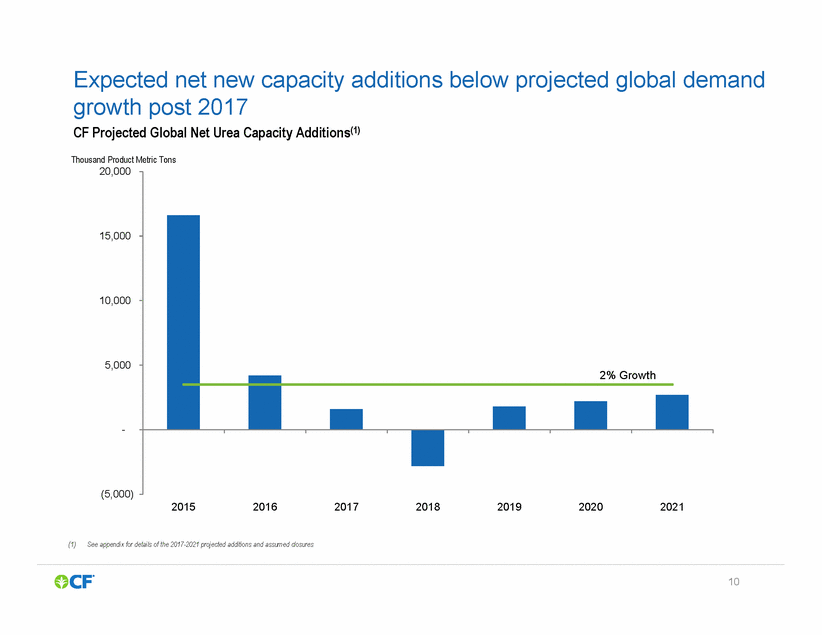
Expected net new capacity additions growth post 2017 CF Projected Global Net Urea Capacity Additions(1) Thousand Product Metric Tons below projected global demand 20,000 15,000 10,000 5,000 2% Growth - (5,000) 2015 2016 2017 2018 2019 2020 2021 (1)See appendix for details of the 2017-2021 projected additions and assumed closures 10
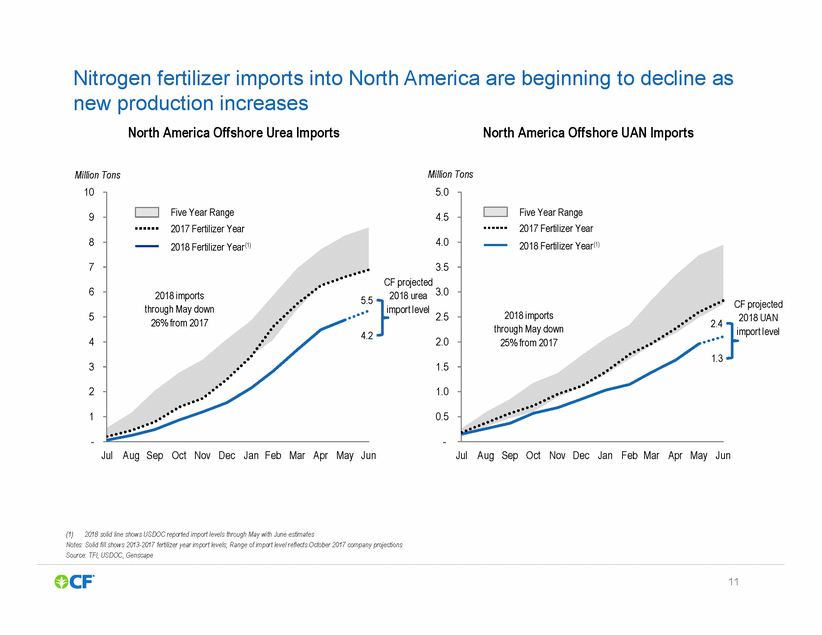
Nitrogen fertilizer imports into new production increases North America Offshore Urea Imports North America are beginning to decline as North America Offshore UAN Imports Million Tons Million Tons 10 5.0 9 4.5 8 4.0 7 3.5 CF projected 2018 urea import level 6 3.0 5.5 CF projected 2018 UAN import level 5 2.5 4.2 4 2.0 3 1.5 2 1.0 1 0.5 - - Jul Aug Sep Oct Nov Dec Jan Feb Mar Apr May Jun Jul Aug Sep Oct Nov Dec Jan Feb Mar Apr May Jun (1)2018 solid line shows USDOC reported import levels through May with June estimates Notes: Solid fill shows 2013-2017 fertilizer year import levels; Range of import level reflects October 2017 company projections Source: TFI, USDOC, Genscape 11 Five Year Range 2017 Fertilizer Year 2018 Fertilizer Year(1) 2018 imports2.4 through May down 25% from 2017 1.3 Five Year Range 2017 Fertilizer Year 2018 Fertilizer Year(1) 2018 imports through May down 26% from 2017
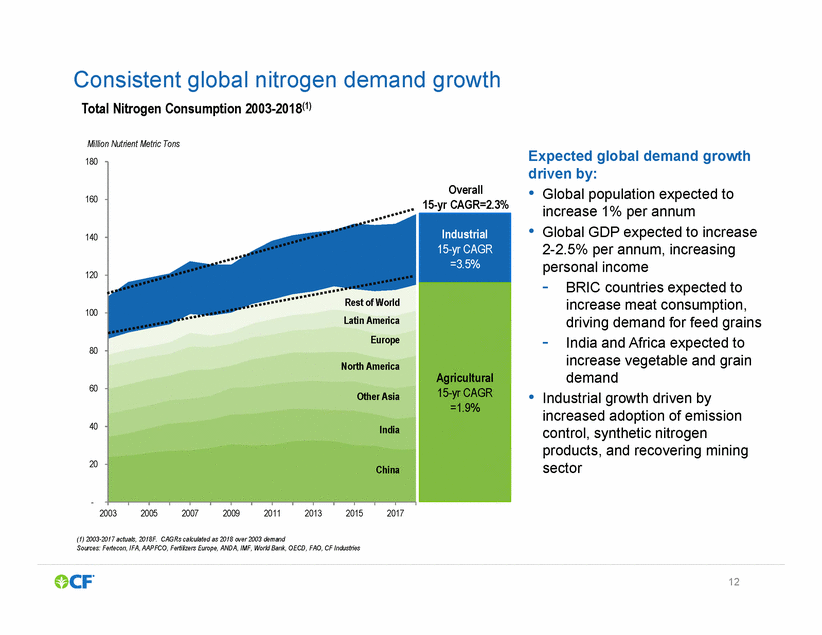
Consistent global nitrogen Total Nitrogen Consumption 2003-2018(1) demand growth Million Nutrient Metric Tons Expected global demand growth driven by: 180 • Global population expected to increase 1% per annum Global GDP expected to increase 2-2.5% per annum, increasing personal income 160 • 140 120 - BRIC countries expected to increase meat consumption, driving demand for feed grains India and Africa expected to increase vegetable and grain demand 100 - 80 60 • Industrial growth driven by increased adoption of emission control, synthetic nitrogen products, and recovering mining sector 40 20 - 2003 2005 2007 2009 2011 2013 2015 2017 (1) 2003-2017 actuals, 2018F. CAGRs calculated as 2018 over 2003 demand Sources: Fertecon, IFA, AAPFCO, Fertilizers Europe, ANDA, IMF, World Bank, OECD, FAO, CF Industries 12 Overall 15-yr CAGR=2.3% Rest of World Latin America Europe North America Other Asia India China Industrial 15-yr CAGR =3.5% Agricultural 15-yr CAGR =1.9%
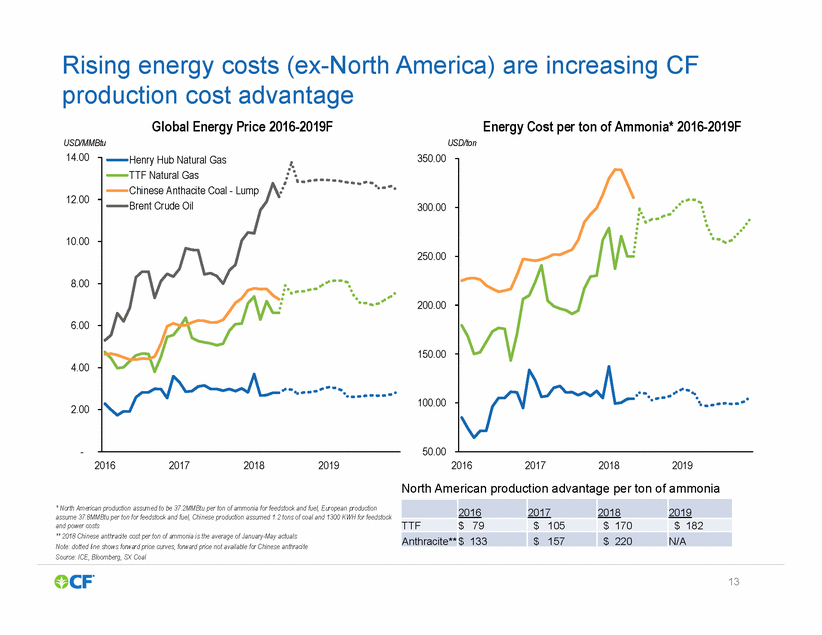
Rising energy costs (ex-North production cost advantage Global Energy Price 2016-2019F USD/MMBtu America) are increasing CF Energy Cost per ton of Ammonia* 2016-2019F USD/ton 14.00 350.00 12.00 300.00 10.00 250.00 8.00 200.00 6.00 150.00 4.00 100.00 2.00 - 50.00 2016 2017 2018 2019 2016 2017 2018 2019 North American production advantage per ton of ammonia * North American production assumed to be 37.2MMBtu per ton of ammonia for feedstock and fuel, European production assume 37.8MMBtu per ton for feedstock and fuel, Chinese production assumed 1.2 tons of coal and 1300 KWH for feedstock and power costs ** 2018 Chinese anthracite cost per ton of ammonia is the average of January-May actuals Note: dotted line shows forward price curves, forward price not available for Chinese anthracite Source: ICE, Bloomberg, SX Coal 13 2016 2017 2018 2019 TTF $ 79 $ 105 $ 170 $ 182 Anthracite** $ 133 $ 157 $ 220 N/A Henry Hub Natural Gas TTF Natural Gas Chinese Anthacite Coal - Lump Brent Crude Oil
Donaldsonville urea storage Capital Allocation and Strategy
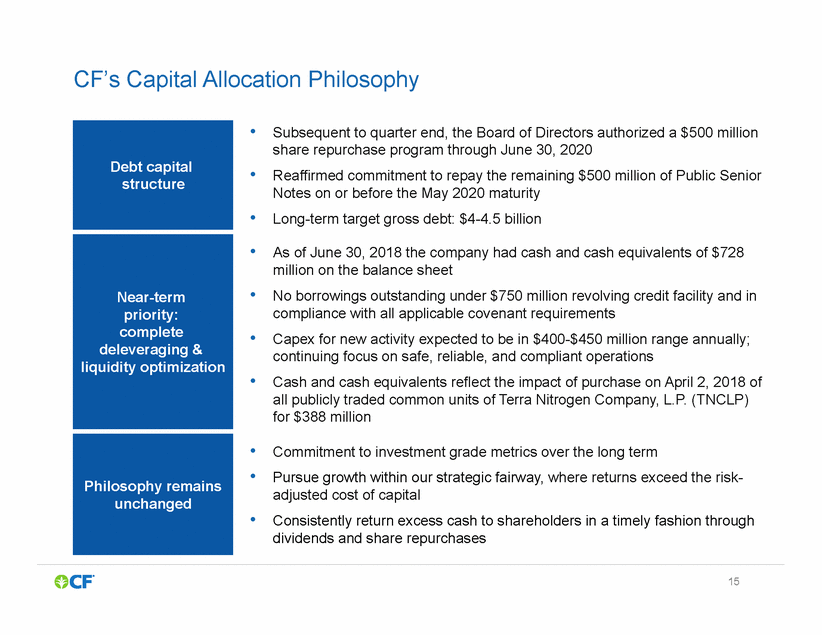
CF’s Capital Allocation Philosophy • Subsequent to quarter end, the Board of Directors authorized a $500 million share repurchase program through June 30, 2020 Reaffirmed commitment to repay the remaining $500 million of Public Senior Notes on or before the May 2020 maturity Long-term target gross debt: $4-4.5 billion • • • As of June 30, 2018 the company had cash and cash equivalents of $728 million on the balance sheet No borrowings outstanding under $750 million revolving credit facility and in compliance with all applicable covenant requirements Capex for new activity expected to be in $400-$450 million range annually; continuing focus on safe, reliable, and compliant operations Cash and cash equivalents reflect the impact of purchase on April 2, 2018 of all publicly traded common units of Terra Nitrogen Company, L.P. (TNCLP) for $388 million • • • • • Commitment to investment grade metrics over the long term Pursue growth within our strategic fairway, where returns exceed the risk-adjusted cost of capital Consistently return excess cash to shareholders in a timely fashion through dividends and share repurchases • 15 Philosophy remains unchanged Near-term priority: complete deleveraging & liquidity optimization Debt capital structure
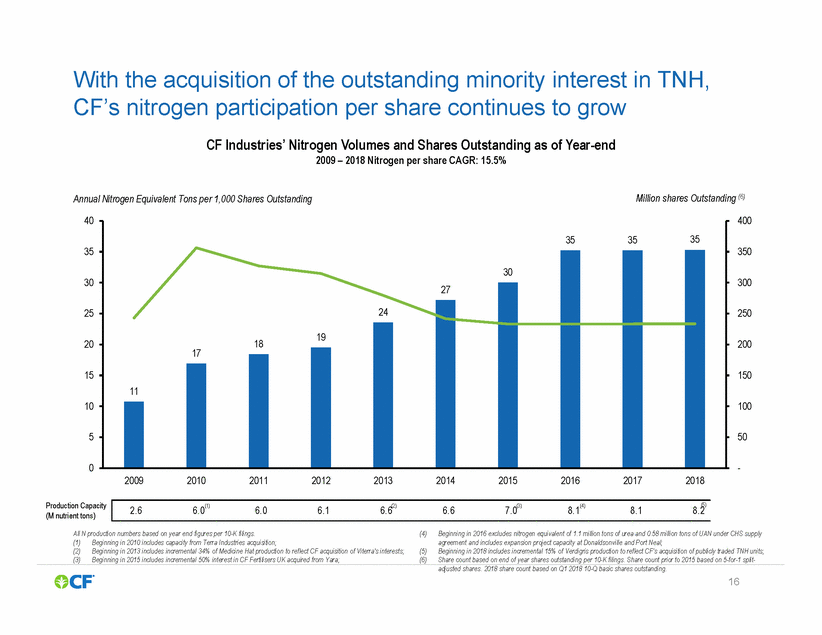
With the acquisition of the outstanding minority interest CF’s nitrogen participation per share continues to grow CF Industries’ Nitrogen Volumes and Shares Outstanding as of Year-end 2009 – 2018 Nitrogen per share CAGR: 15.5% in TNH, Million shares Outstanding (6) Annual Nitrogen Equivalent Tons per 1,000 Shares Outstanding 40 400 35 350 30 300 25 250 20 200 17 15 150 10 100 5 50 0 - 2009 2010 2011 2012 2013 2014 2015 2016 2017 2018 Production Capacity (M nutrient tons) (5) All N production numbers based on year end figures per 10-K filings. (4) Beginning in 2016 excludes nitrogen equivalent of 1.1 million tons of urea and 0.58 million tons of UAN under CHS supply agreement and includes expansion project capacity at Donaldsonville and Port Neal; Beginning in 2018 includes incremental 15% of Verdigris production to reflect CF’s acquisition of publicly traded TNH units; Share count based on end of year shares outstanding per 10-K filings. Share count prior to 2015 based on 5-for-1 split-(1) (2) (3) Beginning in 2010 includes capacity from Terra Industries acquisition; Beginning in 2013 includes incremental 34% of Medicine Hat production to reflect CF acquisition of Viterra's interests; Beginning in 2015 includes incremental 50% interest in CF Fertilisers UK acquired from Yara; (5) (6) adjusted shares. 2018 share count based on Q1 2018 10-Q basic shares outstanding. 16 2.66.0(1) 6.06.16.6(2) 6.67.0(3) 8.1(4) 8.18.2 353535 30 27 24 1819 11
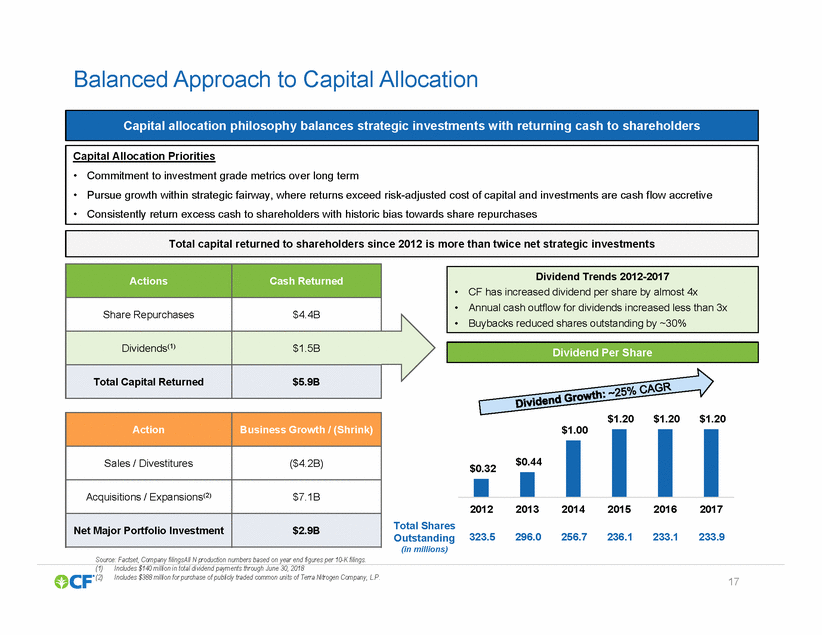
Balanced Approach to Capital Allocation $1.20 $1.20 $1.20 $1.00 2012 2013 2014 2015 2016 2017 Total Shares Outstanding (in millions) 323.5 296.0 256.7 236.1 233.1 233.9 Source: Factset, Company filingsAll N production numbers based on year end figures per 10-K filings. (1)Includes $140 million in total dividend payments through June 30, 2018 (2)Includes $388 million for purchase of publicly traded common units of Terra Nitrogen Company, L.P. 17 $0.32$0.44 Action Business Growth / (Shrink) Sales / Divestitures ($4.2B) Acquisitions / Expansions(2) $7.1B Net Major Portfolio Investment $2.9B Dividend Per Share Dividend Trends 2012-2017 •CF has increased dividend per share by almost 4x •Annual cash outflow for dividends increased less than 3x •Buybacks reduced shares outstanding by ~30% Actions Cash Returned Share Repurchases $4.4B Dividends(1) $1.5B Total Capital Returned $5.9B Total capital returned to shareholders since 2012 is more than twice net strategic investments Capital Allocation Priorities • Commitment to investment grade metrics over long term • Pursue growth within strategic fairway, where returns exceed risk-adjusted cost of capital and investments are cash flow accretive • Consistently return excess cash to shareholders with historic bias towards share repurchases Capital allocation philosophy balances strategic investments with returning cash to shareholders
Yazoo City control room Appendix
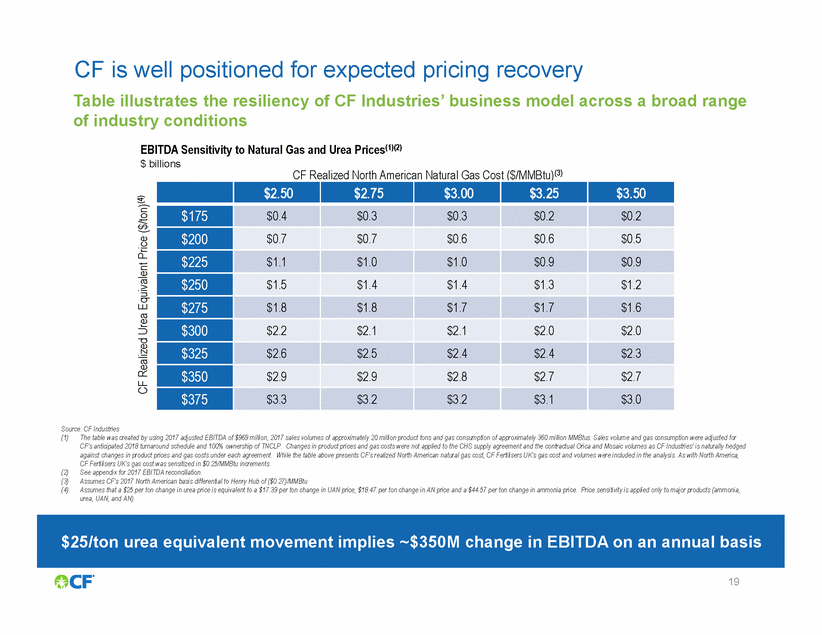
CF is well positioned for expected pricing recovery Table illustrates the resiliency of CF Industries’ business model across a broad range of industry conditions EBITDA Sensitivity to Natural Gas and Urea Prices(1)(2) $ billions CF Realized North American Natural Gas Cost ($/MMBtu)(3) Source: CF Industries (1) The table was created by using 2017 adjusted EBITDA of $969 million, 2017 sales volumes of approximately 20 million product tons and gas consumption of approximately 360 million MMBtus. Sales volume and gas consumption were adjusted for CF’s anticipated 2018 turnaround schedule and 100% ownership of TNCLP. Changes in product prices and gas costs were not applied to the CHS supply agreement and the contractual Orica and Mosaic volumes as CF Industries’ is naturally hedged against changes in product prices and gas costs under each agreement. While the table above presents CF’s realized North American natural gas cost, CF Fertilisers UK’s gas cost and volumes were included in the analysis. As with North America, CF Fertilisers UK’s gas cost was sensitized in $0.25/MMBtu increments. See appendix for 2017 EBITDA reconciliation. Assumes CF’s 2017 North American basis differential to Henry Hub of ($0.27)/MMBtu Assumes that a $25 per ton change in urea price is equivalent to a $17.39 per ton change in UAN price, $18.47 per ton change in AN price and a $44.57 per ton change in ammonia price. Price sensitivity is applied only to major products (ammonia, urea, UAN, and AN). (2) (3) (4) 19 CF Realized Urea Equivalent Price ($/ton)(4) $25/ton urea equivalent movement implies ~$350M change in EBITDA on an annual basis $2.50 $2.75 $3.00 $3.25 $3.50 $175 $0.4 $0.3 $0.3 $0.2 $0.2 $200 $0.7 $0.7 $0.6 $0.6 $0.5 $225 $1.1 $1.0 $1.0 $0.9 $0.9 $250 $1.5 $1.4 $1.4 $1.3 $1.2 $275 $1.8 $1.8 $1.7 $1.7 $1.6 $300 $2.2 $2.1 $2.1 $2.0 $2.0 $325 $2.6 $2.5 $2.4 $2.4 $2.3 $350 $2.9 $2.9 $2.8 $2.7 $2.7 $375 $3.3 $3.2 $3.2 $3.1 $3.0
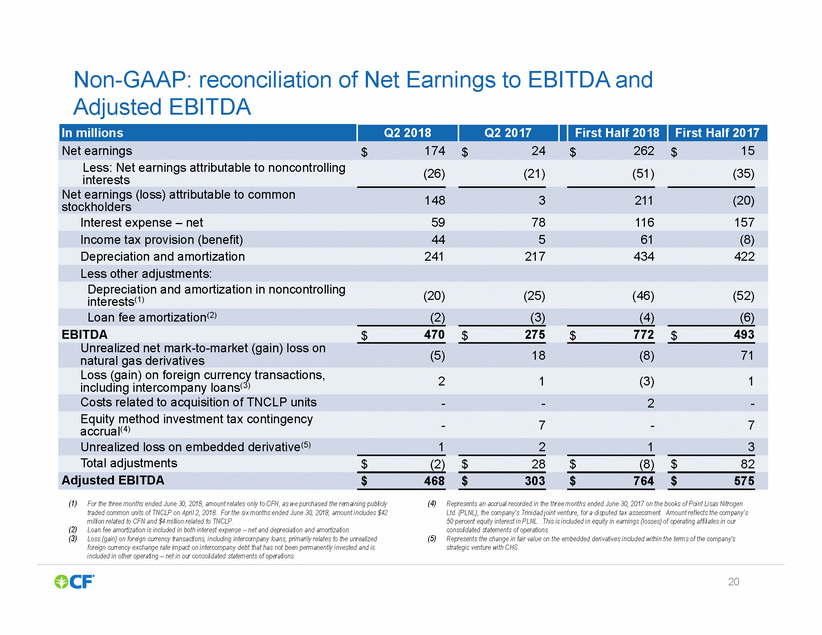
Non-GAAP: reconciliation of Net Earnings to EBITDA and Adjusted EBITDA (26) (21) (51) (35) interests 148 3 211 (20) stockholders (20) (25) (46) (52) interests(1) (5) 18 (8) 71 natural gas derivatives 2 1 (3) 1 including intercompany loans(3) - 7 - 7 accrual(4) (1) (4) For the three months ended June 30, 2018, amount relates only to CFN, as we purchased the remaining publicly traded common units of TNCLP on April 2, 2018. For the six months ended June 30, 2018, amount includes $42 million related to CFN and $4 million related to TNCLP. Loan fee amortization is included in both interest expense – net and depreciation and amortization. Loss (gain) on foreign currency transactions, including intercompany loans, primarily relates to the unrealized foreign currency exchange rate impact on intercompany debt that has not been permanently invested and is included in other operating – net in our consolidated statements of operations. Represents an accrual recorded in the three months ended June 30, 2017 on the books of Point Lisas Nitrogen Ltd. (PLNL), the company’s Trinidad joint venture, for a disputed tax assessment. Amount reflects the company’s 50 percent equity interest in PLNL. This is included in equity in earnings (losses) of operating affiliates in our consolidated statements of operations. Represents the change in fair value on the embedded derivatives included within the terms of the company’s strategic venture with CHS. (2) (3) (5) 20 In millions Q2 2018 Q2 2017 First Half 2018 First Half 2017 Net earnings$174$24$262$15 Less: Net earnings attributable to noncontrolling Net earnings (loss) attributable to common Interest expense – net5978116157 Income tax provision (benefit)44561(8) Depreciation and amortization241217434422 Less other adjustments: Depreciation and amortization in noncontrolling Loan fee amortization(2)(2)(3)(4)(6) EBITDA$470$275$772$493 Unrealized net mark-to-market (gain) loss on Loss (gain) on foreign currency transactions, Costs related to acquisition of TNCLP units--2-Equity method investment tax contingency Unrealized loss on embedded derivative(5)1213 Total adjustments$(2)$28$(8)$82 Adjusted EBITDA$468$303$764$575
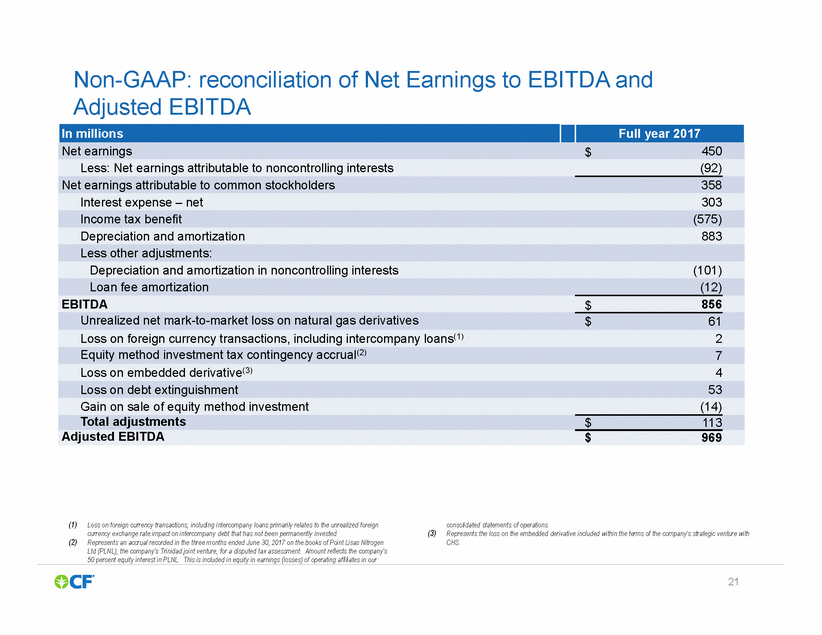
Non-GAAP: reconciliation of Net Earnings to EBITDA and Adjusted EBITDA (1)Loss on foreign currency transactions, including intercompany loans primarily relates to the unrealized foreign currency exchange rate impact on intercompany debt that has not been permanently invested (2)Represents an accrual recorded in the three months ended June 30, 2017 on the books of Point Lisas Nitrogen Ltd (PLNL), the company’s Trinidad joint venture, for a disputed tax assessment. Amount reflects the company’s 50 percent equity interest in PLNL. This is included in equity in earnings (losses) of operating affiliates in our consolidated statements of operations. (3)Represents the loss on the embedded derivative included within the terms of the company’s strategic venture with CHS. 21 In millions Full year 2017 Net earnings$450 Less: Net earnings attributable to noncontrolling interests(92) Net earnings attributable to common stockholders358 Interest expense – net303 Income tax benefit(575) Depreciation and amortization883 Less other adjustments: Depreciation and amortization in noncontrolling interests(101) Loan fee amortization(12) EBITDA$856 Unrealized net mark-to-market loss on natural gas derivatives$61 Loss on foreign currency transactions, including intercompany loans(1)2 Equity method investment tax contingency accrual(2)7 Loss on embedded derivative(3)4 Loss on debt extinguishment53 Gain on sale of equity method investment(14) Total adjustments$113 Adjusted EBITDA$969
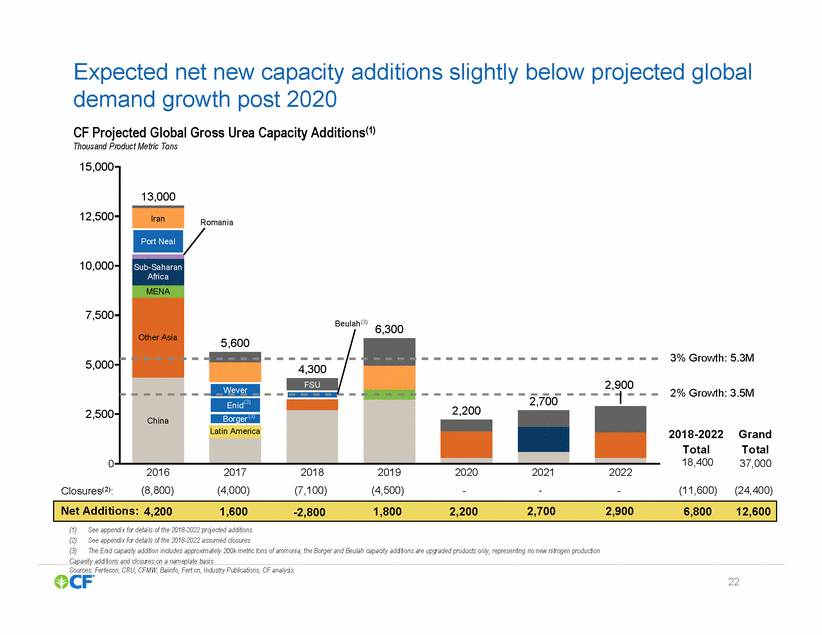
Expected net new capacity additions demand growth post 2020 CF Projected Global Gross Urea Capacity Additions(1) Thousand Product Metric Tons slightly below projected global 15,000 12,500 10,000 7,500 3% Growth: 5.3M 5,000 2% Growth: 3.5M 2,500 Borger 2018-2022 Total 18,400 Grand Total 37,000 0 2016 (8,800) 2017 (4,000) 2018 (7,100) 2019 (4,500) 2020 - 2021 - 2022 - Closures(2): (11,600) (24,400) (1) (2) (3) See appendix for details of the 2018-2022 projected additions See appendix for details of the 2018-2022 assumed closures The Enid capacity addition includes approximately 200k metric tons of ammonia; the Borger and Beulah capacity additions are upgraded products only, representing no new nitrogen production Capacity additions and closures on a nameplate basis Sources: Fertecon, CRU, CFMW, Baiinfo, Fert.cn, Industry Publications, CF analysis 22 Net Additions: 4,2001,600-2,8001,8002,2002,7002,9006,80012,600 13,000 Romania Sub-Saharan Africa Beulah(3) 6,300 MENA Other Asia 5,600 4,300 2,900 FSU Wever China Enid(3) 2,700 2,200 (3) Latin America Iran Port Neal
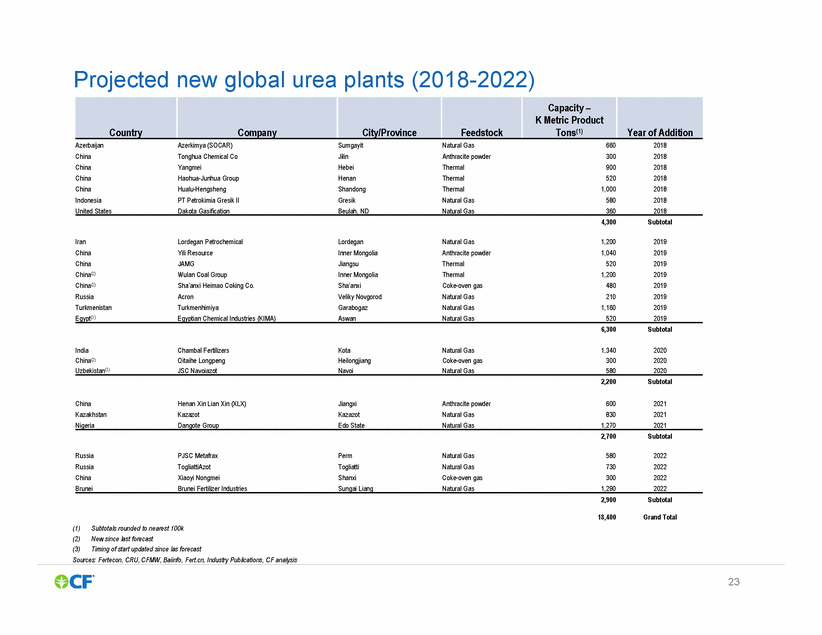
Projected new global urea plants (2018-2022) Russia Russia China PJSC Metafrax TogliattiAzot Xiaoyi Nongmei Perm Togliatti Shanxi Natural Gas Natural Gas Coke-oven gas 580 730 300 2022 2022 2022 2,900 Subtotal 18,400 Grand Total (1) (2) (3) Subtotals rounded to nearest 100k New since last forecast Timing of start updated since las forecast Sources: Fertecon, CRU, CFMW, Baiinfo, Fert.cn, Industry Publications, CF analysis 23 Brunei Brunei Fertilizer Industries Sungai Liang Natural Gas 1,290 2022 Country Company City/Province Feedstock Capacity – K Metric Product Tons(1) Year of Addition Azerbaijan Azerkimya (SOCAR) Sumgayit Natural Gas 660 2018 China Tonghua Chemical Co Jilin Anthracite powder 300 2018 China Yangmei Hebei Thermal 900 2018 China Haohua-Junhua Group Henan Thermal 520 2018 China Hualu-Hengsheng Shandong Thermal 1,000 2018 Indonesia PT Petrokimia Gresik II Gresik Natural Gas 580 2018 United States Dakota Gasification Beulah, ND Natural Gas 360 2018 4,300 Subtotal Iran Lordegan Petrochemical Lordegan Natural Gas 1,200 2019 China Yili Resource Inner Mongolia Anthracite powder 1,040 2019 China JAMG Jiangsu Thermal 520 2019 China(2) Wulan Coal Group Inner Mongolia Thermal 1,200 2019 China(2) Sha’anxi Heimao Coking Co. Sha’anxi Coke-oven gas 480 2019 Russia Acron Veliky Novgorod Natural Gas 210 2019 Turkmenistan Turkmenhimiya Garabogaz Natural Gas 1,160 2019 Egypt(3) Egyptian Chemical Industries (KIMA) Aswan Natural Gas 520 2019 6,300 Subtotal India Chambal Fertilizers Kota Natural Gas 1,340 2020 China(2) Qitaihe Longpeng Heilongjiang Coke-oven gas 300 2020 Uzbekistan(3) JSC Navoiazot Navoi Natural Gas 580 2020 2,200 Subtotal China Henan Xin Lian Xin (XLX) Jiangxi Anthracite powder 600 2021 Kazakhstan Kazazot Kazazot Natural Gas 830 2021 Nigeria Dangote Group Edo State Natural Gas 1,270 2021 2,700 Subtotal
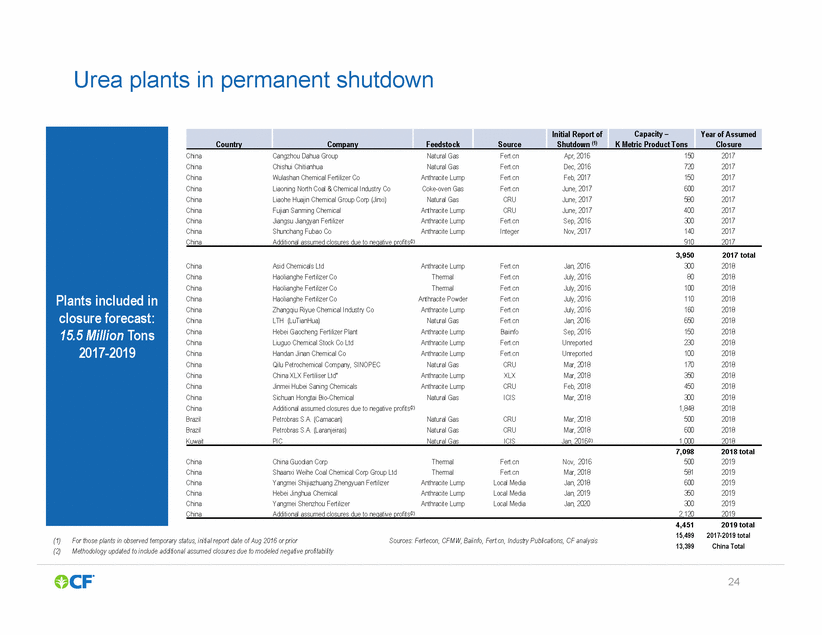
Urea plants in permanent shutdown China Shunchang Fubao Co Anthracite Lump Integer Nov, 2017 140 2017 China Zhangqiu Riyue Chemical Industry Co Anthracite Lump Fert.cn July, 2016 160 2018 China Liuguo Chemical Stock Co Ltd Anthracite Lump Fert.cn Unreported 230 2018 China Brazil Brazil Kuwait Additional assumed closures due to negative profits(2) Petrobras S.A. (Camacari) Petrobras S.A. (Laranjeiras) PIC 1,848 500 600 1,000 2018 2018 2018 2018 Natural Gas Natural Gas Natural Gas CRU CRU ICIS Mar, 2018 Mar, 2018 Jan, 2016(3) China China China China China China Guodian Corp Shaanxi Weihe Coal Chemical Corp Group Ltd Yangmei Shijiazhuang Zhengyuan Fertilizer Hebei Jinghua Chemical Yangmei Shenzhou Fertilizer Thermal Thermal Anthracite Lump Anthracite Lump Anthracite Lump Fert.cn Fert.cn Local Media Local Media Local Media Nov, 2016 Mar, 2018 Jan, 2018 Jan, 2019 Jan, 2020 500 581 600 350 300 2019 2019 2019 2019 2019 (1)For those plants in observed temporary status, initial report date of Aug 2016 or prior (2)Methodology updated to include additional assumed closures due to modeled negative profitability Sources: Fertecon, CFMW, Baiinfo, Fert.cn, Industry Publications, CF analysis 13,399 China Total 24 ChinaAdditional assumed closures due to negative profits(2) 2,1202019 4,4512019 total 15,4992017-2019 total 7,0982018 total ChinaAdditional assumed closures due to negative profits(2) 9102017 3,9502017 total ChinaAsid Chemicals LtdAnthracite LumpFert.cnJan, 20163002018 ChinaHaolianghe Fertilizer CoThermalFert.cnJuly, 2016802018 ChinaHaolianghe Fertilizer CoThermalFert.cnJuly, 20161002018 ChinaHaolianghe Fertilizer CoAnthracite PowderFert.cnJuly, 20161102018 ChinaLTH (LuTianHua)Natural GasFert.cnJan, 20166502018 ChinaHebei Gaocheng Fertilizer PlantAnthracite LumpBaiinfoSep, 20161502018 ChinaHandan Jinan Chemical CoAnthracite LumpFert.cnUnreported1002018 ChinaQilu Petrochemical Company, SINOPECNatural GasCRUMar, 20181702018 ChinaChina XLX Fertiliser Ltd*Anthracite LumpXLXMar, 20183502018 ChinaJinmei Hubei Saning ChemicalsAnthracite LumpCRUFeb, 20184502018 ChinaSichuan Hongtai Bio-ChemicalNatural GasICISMar, 20183002018 Plants included in closure forecast: 15.5 Million Tons 2017-2019 Country Company Feedstock Source Initial Report of Shutdown (1) Capacity – K Metric Product Tons Year of Assumed Closure China Cangzhou Dahua Group Natural Gas Fert.cn Apr, 2016 150 2017 China Chishui Chitianhua Natural Gas Fert.cn Dec, 2016 720 2017 ChinaWulashan Chemical Fertilizer CoAnthracite LumpFert.cnFeb, 2017 ChinaLiaoning North Coal & Chemical Industry CoCoke-oven GasFert.cnJune, 2017 ChinaLiaohe Huajin Chemical Group Corp (Jinxi)Natural GasCRUJune, 2017 ChinaFujian Sanming ChemicalAnthracite LumpCRUJune, 2017 150 2017 600 580 400 2017 2017 2017 ChinaJiangsu Jiangyan FertilizerAnthracite LumpFert.cnSep, 2016300 2017