Attached files
| file | filename |
|---|---|
| EX-99.1 - EX-99.1 - NUVASIVE INC | nuva-ex991_8.htm |
| 8-K - 8-K - NUVASIVE INC | nuva-8k_20180731.htm |
Q2 2018 Results Supplemental Presentation to Earnings Press Release July 31, 2018 Exhibit 99.2
NuVasive, Inc. (“NuVasive,” “NUVA” or the “Company”) cautions you that statements included in this presentation that are not a description of historical facts are forward-looking statements that involve risks, uncertainties, assumptions and other factors which, if they do not materialize or prove correct, could cause the Company's results to differ materially from historical results or those expressed or implied by such forward-looking statements. In addition, this presentation contains selected financial results from the second quarter 2018, as well as projections for 2018 finance guidance and longer-term financial and business goals. The Company’s projections for 2018 financial guidance and longer-term financial performance goals represent current estimates, including initial estimates of the potential benefits, synergies and cost savings associated with acquisitions, which are subject to the risk of being inaccurate because of the preliminary nature of the forecasts, the risk of further adjustment, or unanticipated difficulty in selling products or generating expected profitability. The potential risks and uncertainties that could cause actual growth and results to differ materially include, but are not limited to: the risk that NuVasive’s financial guidance and expectations may turn out to be inaccurate because of the preliminary nature of the Company’s forecasts and projections; the risk of further adjustment to financial results or future financial expectations; unanticipated difficulty in selling products, generating revenue or producing expected growth and profitability; the risk that acquisitions will not be integrated successfully or that the benefits and synergies from the acquisition may not be fully realized or may take longer to realize than expected; the loss of key employees; unexpected variations in market growth and demand for the Company’s products and technologies; and those other risks and uncertainties more fully described in the Company’s news releases and periodic filings with the Securities and Exchange Commission. NuVasive’s public filings with the Securities and Exchange Commission are available at www.sec.gov. The forward-looking statements contained herein are based on the current expectations and assumptions of NuVasive and not on historical facts. NuVasive assumes no obligation to update any forward-looking statement to reflect events or circumstances arising after the date on which it was made. Forward-Looking Statements
Management uses certain non-GAAP financial measures such as non-GAAP earnings per share, non-GAAP net income, non-GAAP operating expenses and non-GAAP operating profit margin, which exclude amortization of intangible assets, business transition costs, one-time restructuring and related items in connection with acquisitions, investments and divestitures, non-recurring consulting fees, certain litigation expenses and settlements, and non-cash interest expense (excluding debt issuance cost) and or losses on convertible notes. Management also uses certain non-GAAP measures which are intended to exclude the impact of foreign exchange currency fluctuations. The measure constant currency is the use of an exchange rate that eliminates fluctuations when calculating financial performance numbers. The Company also uses measures such as free cash flow, which represents cash flow from operations less cash used in the acquisition and disposition of capital. Additionally, the Company uses an adjusted EBITDA measure which represents earnings before interest, taxes, depreciation and amortization and excludes the impact of stock-based compensation, business transition costs, one-time restructuring and related items in connection with acquisitions, investments and divestitures, non-recurring consulting fees, certain litigation expenses and settlements, and other significant one-time items. Management calculates the non-GAAP financial measures provided in this presentation excluding these costs and uses these non-GAAP financial measures to enable it to further and more consistently analyze the period-to-period financial performance of its core business operations. Management believes that providing investors with these non-GAAP measures gives them additional information to enable them to assess, in the same way management assesses, the Company’s current and future continuing operations. These non-GAAP measures are not in accordance with, or an alternative for, GAAP, and may be different from non-GAAP measures used by other companies. Set forth below are reconciliations of the non-GAAP financial measures to the comparable GAAP financial measure. During the quarter ended June 30, 2018, the Company began excluding from its non-GAAP financial results certain litigation related expenses, in addition to litigation charges associated with significant legal settlements. As previously disclosed, the Company is pursuing various legal claims against a former member of the Company’s Board of Directors for violations of his contractual obligations to the Company and breach of his fiduciary duties. The Company has also filed lawsuits against his current employer for tort claims and intellectual property infringement. The Company began excluding litigation expenses associated with these and related legal matters in the quarter ended June 30, 2018. Expenses for these legal matters significantly increased during the quarter ended June 30, 2018, and based on developments in these legal matters, expenses are expected to be significant throughout 2018. The Company believes that these litigation expenses are unusual in nature and not reflective of the Company’s normal course of business or the financial performance of the Company’s core business operations. These expenses are included in the line item “Litigation related expenses and settlements” in the non-GAAP reconciliations provided in this presentation. For consistency and comparability, the Company has re-casted its non-GAAP financial results for each of the quarters ended December 31, 2017 and March 31, 2018 to exclude these litigation expenses in such periods, which were $0.4 million and $0.6 million, respectively. For reconciliations of non-GAAP financial measures to the comparable GAAP financial measure, please refer to the supplemental financial information posted on the Investor Relations section of the Company’s corporate website at www.nuvasive.com. Non-GAAP Financial Measures Accounting Standards Codification 606 The Company adopted Accounting Standards Codification 606 Revenue from Contracts with Customers (“ASC 606”) as of January 1, 2018, electing full retrospective method of adoption, which resulted in a change in its accounting policy for revenue recognition and related adjustments to the Company’s consolidated financial statements. Financial information included in this presentation for prior periods has been re-casted and presented based on the full retrospective method of adoption of ASC 606. For more information regarding the Company’s adoption of ASC 606, please see the Company’s Quarterly Report on Form 10-Q for the quarter ended June 30, 2018.
Q2 2018 Financial Performance GAAP diluted earnings per share increase of 5% to $0.22 and non-GAAP diluted earnings per share of $0.58, up 29% despite flat U.S. market GAAP operating profit margin of 10.1% and non-GAAP operating profit margin of 16.3% Total revenue increased to $281.6 million, up 8.5% over prior year International revenue growth of 21% GAAP net income of $11.5 million and non-GAAP net income of $30.3 million
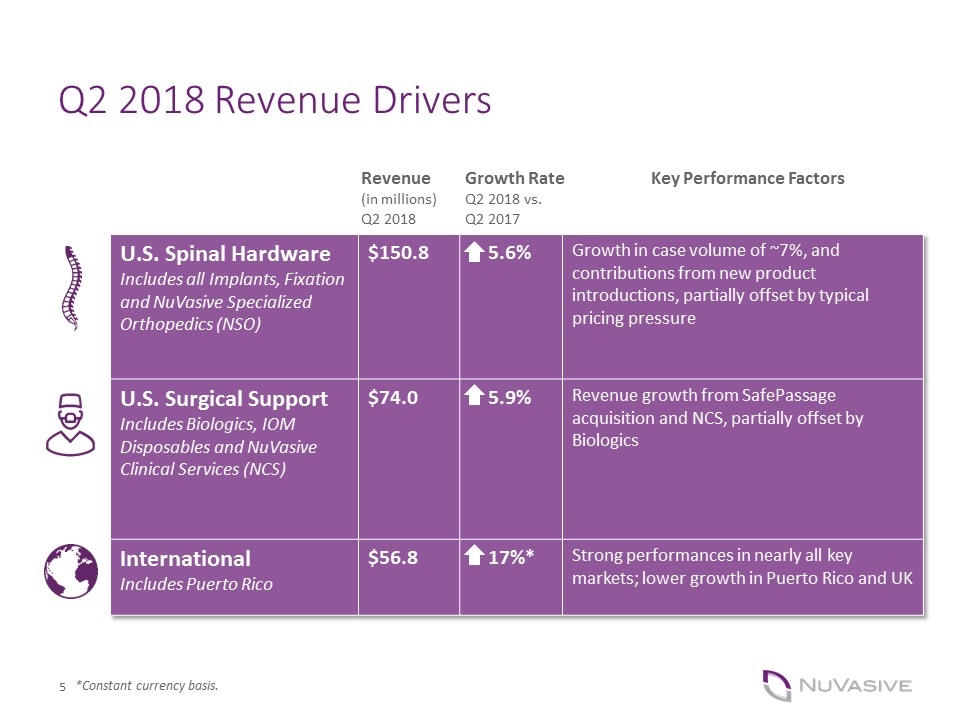
Q2 2018 Revenue Drivers U.S. Spinal Hardware Includes all Implants, Fixation and NuVasive Specialized Orthopedics (NSO) $150.8 5.6% Growth in case volume of ~7%, and contributions from new product introductions, partially offset by typical pricing pressure U.S. Surgical Support Includes Biologics, IOM Disposables and NuVasive Clinical Services (NCS) $74.0 5.9% Revenue growth from SafePassage acquisition and NCS, partially offset by Biologics International Includes Puerto Rico $56.8 17%* Strong performances in nearly all key markets; lower growth in Puerto Rico and UK *Constant currency basis. Key Performance Factors Growth Rate Q2 2018 vs. Q2 2017 Revenue (in millions) Q2 2018
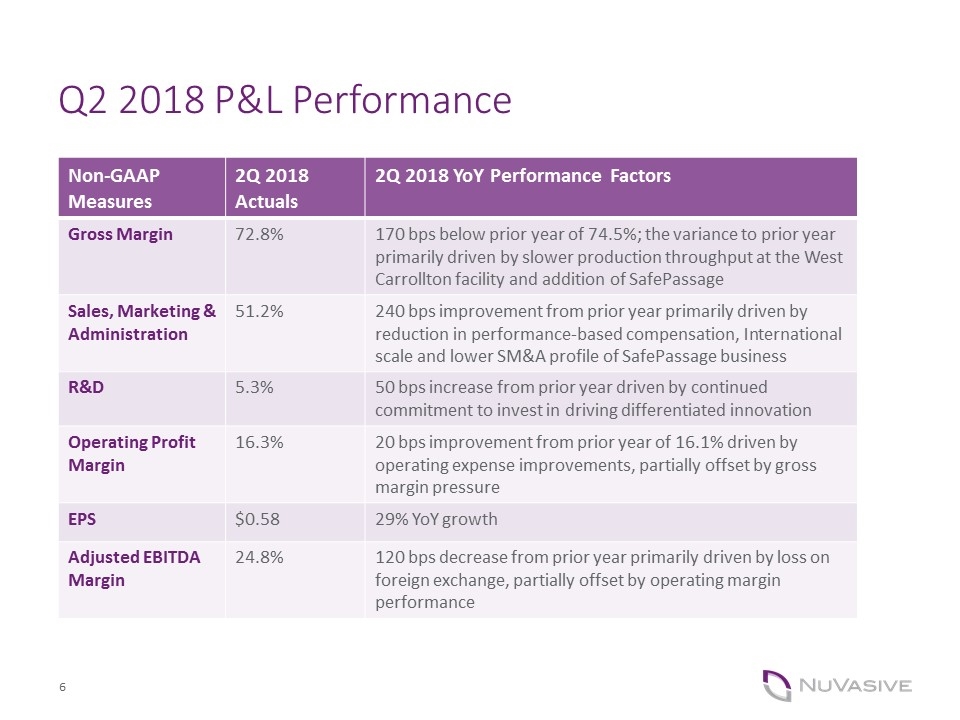
Q2 2018 P&L Performance Non-GAAP Measures 2Q 2018 Actuals 2Q 2018 YoY Performance Factors Gross Margin 72.8% 170 bps below prior year of 74.5%; the variance to prior year primarily driven by slower production throughput at the West Carrollton facility and addition of SafePassage Sales, Marketing & Administration 51.2% 240 bps improvement from prior year primarily driven by reduction in performance-based compensation, International scale and lower SM&A profile of SafePassage business R&D 5.3% 50 bps increase from prior year driven by continued commitment to invest in driving differentiated innovation Operating Profit Margin 16.3% 20 bps improvement from prior year of 16.1% driven by operating expense improvements, partially offset by gross margin pressure EPS $0.58 29% YoY growth Adjusted EBITDA Margin 24.8% 120 bps decrease from prior year primarily driven by loss on foreign exchange, partially offset by operating margin performance
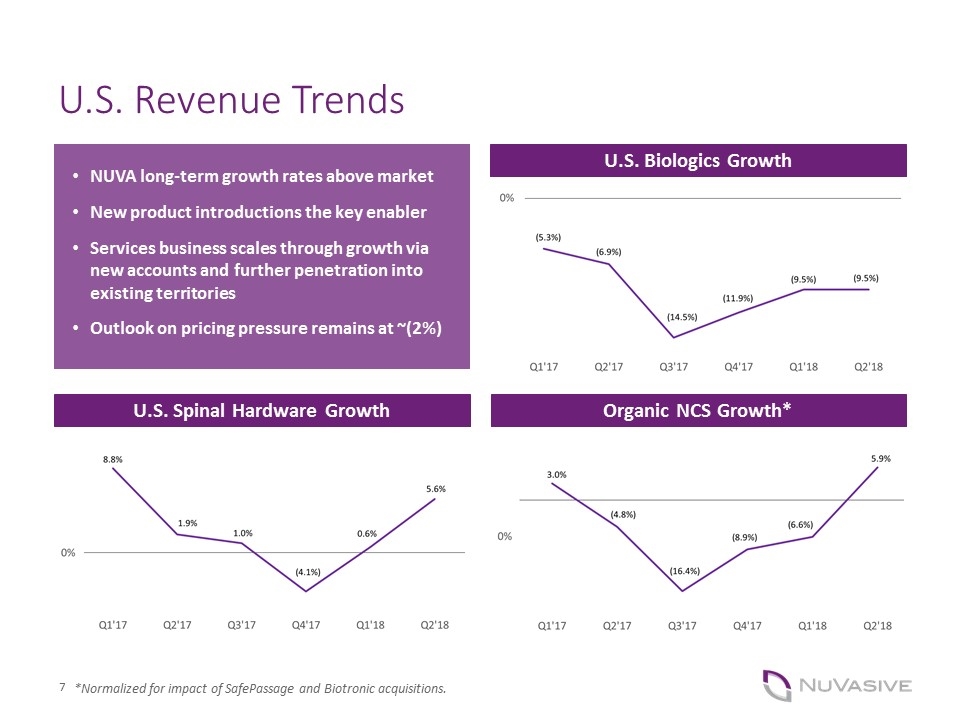
U.S. Revenue Trends U.S. Spinal Hardware Growth U.S. Biologics Growth *Normalized for impact of SafePassage and Biotronic acquisitions. Organic NCS Growth* NUVA long-term growth rates above market New product introductions the key enabler Services business scales through growth via new accounts and further penetration into existing territories Outlook on pricing pressure remains at ~(2%)
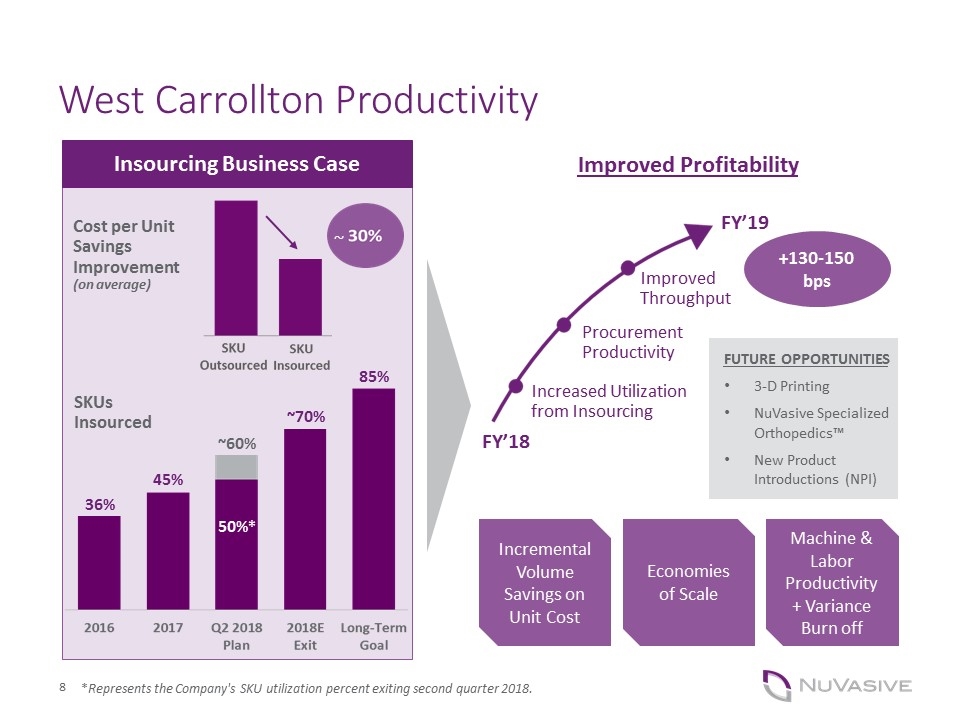
West Carrollton Productivity Cost per Unit Savings Improvement (on average) Insourcing Business Case SKUs Insourced Improved Profitability Increased Utilization from Insourcing Procurement Productivity Improved Throughput FY’19 FY’18 Incremental Volume Savings on Unit Cost +130-150 bps Economies of Scale Machine & Labor Productivity + Variance Burn off FUTURE OPPORTUNITIES 3-D Printing NuVasive Specialized Orthopedics™ New Product Introductions (NPI) 45% 36% ~60% ~70% 50%* *Represents the Company's SKU utilization percent exiting second quarter 2018. ~ 85%
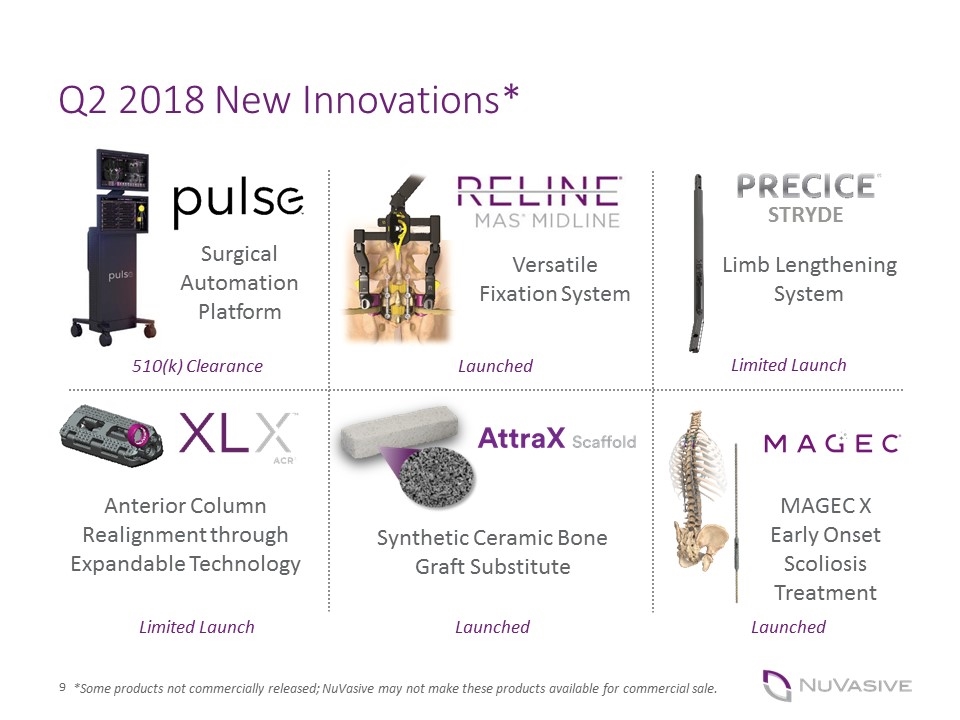
Q2 2018 New Innovations* *Some products not commercially released; NuVasive may not make these products available for commercial sale. STRYDE Surgical Automation Platform Versatile Fixation System Limb Lengthening System Anterior Column Realignment through Expandable Technology MAGEC X Early Onset Scoliosis Treatment Synthetic Ceramic Bone Graft Substitute Launched Limited Launch Limited Launch Launched Launched 510(k) Clearance
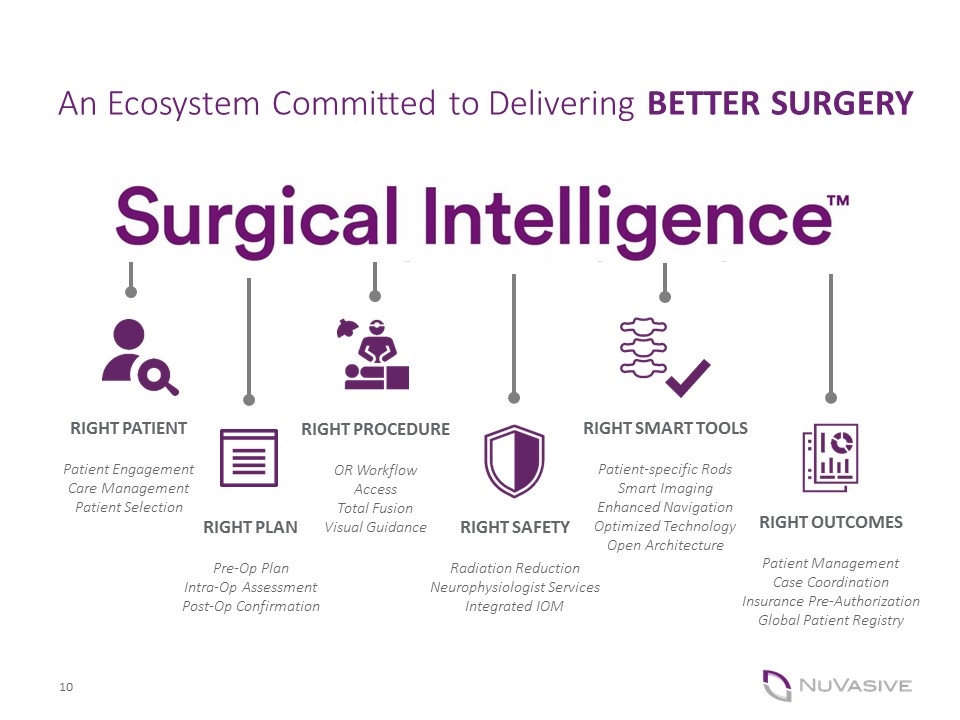
RIGHT PATIENT Patient Engagement Care Management Patient Selection RIGHT PLAN Pre-Op Plan Intra-Op Assessment Post-Op Confirmation RIGHT PROCEDURE OR Workflow Access Total Fusion Visual Guidance RIGHT SAFETY Radiation Reduction Neurophysiologist Services Integrated IOM RIGHT SMART TOOLS Patient-specific Rods Smart Imaging Enhanced Navigation Optimized Technology Open Architecture RIGHT OUTCOMES Patient Management Case Coordination Insurance Pre-Authorization Global Patient Registry An Ecosystem Committed to Delivering BETTER SURGERY
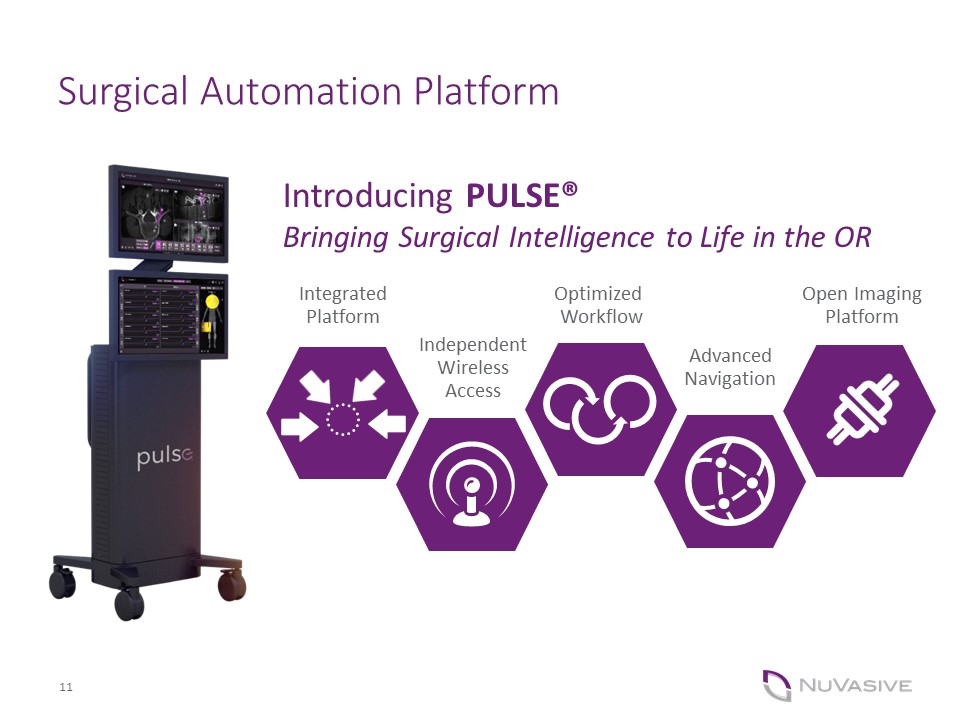
Integrated Platform Independent Wireless Access Optimized Workflow Advanced Navigation Open Imaging Platform Introducing PULSE® Bringing Surgical Intelligence to Life in the OR Surgical Automation Platform
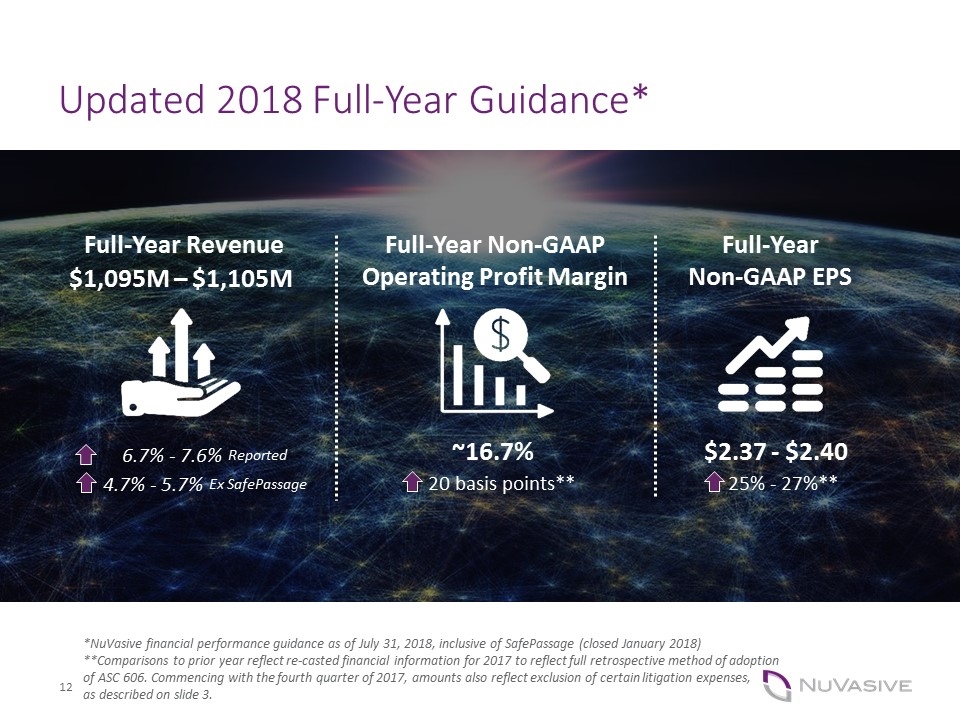
Updated 2018 Full-Year Guidance* *NuVasive financial performance guidance as of July 31, 2018, inclusive of SafePassage (closed January 2018) **Comparisons to prior year reflect re-casted financial information for 2017 to reflect full retrospective method of adoption of ASC 606. Commencing with the fourth quarter of 2017, amounts also reflect exclusion of certain litigation expenses, as described on slide 3. $1,095M – $1,105M Full-Year Non-GAAP Operating Profit Margin Full-Year Revenue ~16.7% Full-Year Non-GAAP EPS $2.37 - $2.40 6.7% - 7.6% Reported 4.7% - 5.7% Ex SafePassage 25% - 27%** 20 basis points**
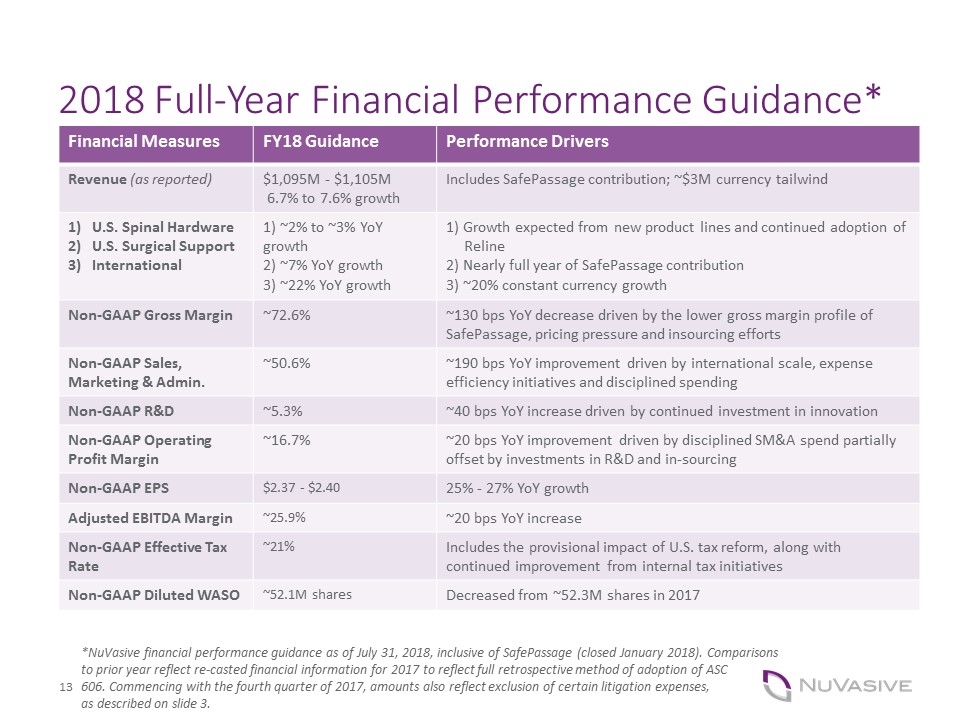
2018 Full-Year Financial Performance Guidance* Financial Measures FY18 Guidance Performance Drivers Revenue (as reported) $1,095M - $1,105M 6.7% to 7.6% growth Includes SafePassage contribution; ~$3M currency tailwind U.S. Spinal Hardware U.S. Surgical Support International 1) ~2% to ~3% YoY growth 2) ~7% YoY growth 3) ~22% YoY growth 1) Growth expected from new product lines and continued adoption of Reline 2) Nearly full year of SafePassage contribution 3) ~20% constant currency growth Non-GAAP Gross Margin ~72.6% ~130 bps YoY decrease driven by the lower gross margin profile of SafePassage, pricing pressure and insourcing efforts Non-GAAP Sales, Marketing & Admin. ~50.6% ~190 bps YoY improvement driven by international scale, expense efficiency initiatives and disciplined spending Non-GAAP R&D ~5.3% ~40 bps YoY increase driven by continued investment in innovation Non-GAAP Operating Profit Margin ~16.7% ~20 bps YoY improvement driven by disciplined SM&A spend partially offset by investments in R&D and in-sourcing Non-GAAP EPS $2.37 - $2.40 25% - 27% YoY growth Adjusted EBITDA Margin ~25.9% ~20 bps YoY increase Non-GAAP Effective Tax Rate ~21% Includes the provisional impact of U.S. tax reform, along with continued improvement from internal tax initiatives Non-GAAP Diluted WASO ~52.1M shares Decreased from ~52.3M shares in 2017 *NuVasive financial performance guidance as of July 31, 2018, inclusive of SafePassage (closed January 2018). Comparisons to prior year reflect re-casted financial information for 2017 to reflect full retrospective method of adoption of ASC 606. Commencing with the fourth quarter of 2017, amounts also reflect exclusion of certain litigation expenses, as described on slide 3.
For questions, contact investorrelations@nuvasive.com.
