Attached files
| file | filename |
|---|---|
| EX-99.1 - EXHIBIT 99.1 - COLUMBUS MCKINNON CORP | exhibit99107312018.htm |
| 8-K - 8-K - COLUMBUS MCKINNON CORP | a8k07312018.htm |

Q1 Fiscal Year 2019 JulySept 31, Investor Presentation 20182017 Financial Results Conference Call Mark D. Morelli President and Chief Executive Officer Gregory P. Rustowicz Vice President – Finance & Chief Financial Officer

Safe Harbor Statement These slides contain (and the accompanying oral discussion will contain) “forward-looking statements” within the meaning of the Private Securities Litigation Reform Act of 1995. Such statements involve known and unknown risks, uncertainties and other factors that could cause the actual results of the Company to differ materially from the results expressed or implied by such statements, including general economic and business conditions, conditions affecting the industries served by the Company and its subsidiaries, conditions affecting the Company’s customers and suppliers, competitor responses to the Company’s products and services, the overall market acceptance of such products and services, the integration of acquisitions and other factors disclosed in the Company’s periodic reports filed with the Securities and Exchange Commission. Consequently such forward looking statements should be regarded as the Company’s current plans, estimates and beliefs. The Company does not undertake and specifically declines any obligation to publicly release the results of any revisions to these forward-looking statements that may be made to reflect any future events or circumstances after the date of such statements or to reflect the occurrence of anticipated or unanticipated events. This presentation will discuss some non-GAAP financial measures, which we believe are useful in evaluating our performance. You should not consider the presentation of this additional information in isolation or as a substitute for results compared in accordance with GAAP. We have provided reconciliations of comparable GAAP to non-GAAP measures in tables found in the Supplemental Information portion of this presentation. © 2018 Columbus McKinnon Corporation 2

Q1FY19 Results Provide Evidence of Progress Blueprint 2021 strategy is working . Diluted EPS was $0.33; Adjusted Diluted EPS was $0.74, up 35% . Record adjusted EBITDA margin* of 15.7% E-PAS™ (Earnings Power Acceleration System) . Capitalizing on continued operating system deployment Leveraging our leading market positions . Automotive . Oil and Gas . Metals Processing, Steel and Aerospace . Entertainment, Utilities and Mining . General construction, Pulp & Paper, Elevators, Government and Rail * Adjusted EBITDA is a non-GAAP financial measure. Please see supplemental slides for a reconciliation from GAAP net income to Adjusted EBITDA and other important disclosures regarding the use of non-GAAP financial measures. © 2018 Columbus McKinnon Corporation 3

Tracking Blueprint 2021 Phase II Progress Simplify the Business . Streamlining products and focusing on profitable revenue . Wire rope hoist platform simplification • Launched initial offering; savings of $1.5 million in FY19 . Divesting three non-core businesses Improve Productivity . Demonstrated in gross margin expansion . Material and labor productivity Ramp the Growth Engine . New product launches and expansion of digital platform . Added Mario Ramos to team as VP, New Product Development Transform the Culture . Building momentum © 2018 Columbus McKinnon Corporation 4

Quarter Record for Net Sales ($ in millions) Growth driven by broad based demand in Y/Y the U.S. and Europe + 10.4% 7.8% Q1 organic growth (FX adjusted) $225.0 . Strong organic growth in U.S.: 8.2% . Non-U.S. organic growth of 7.5%: $214.1 $212.8 • EMEA 10.3%, Canada 7.2% $208.7 Pricing increased 100 basis points $203.7 Sales Bridge Q1 FY19 Q1 FY18 Q2 FY18 Q3 FY18 Q4 FY18 Q1 FY19 Q1 FY18 net sales $ 203.7 Volume 14.0 6.8% Foreign currency translation 5.3 2.6% Pricing 2.0 1.0% Q1 FY19 net sales $ 225.0 © 2018 Columbus McKinnon Corporation 5

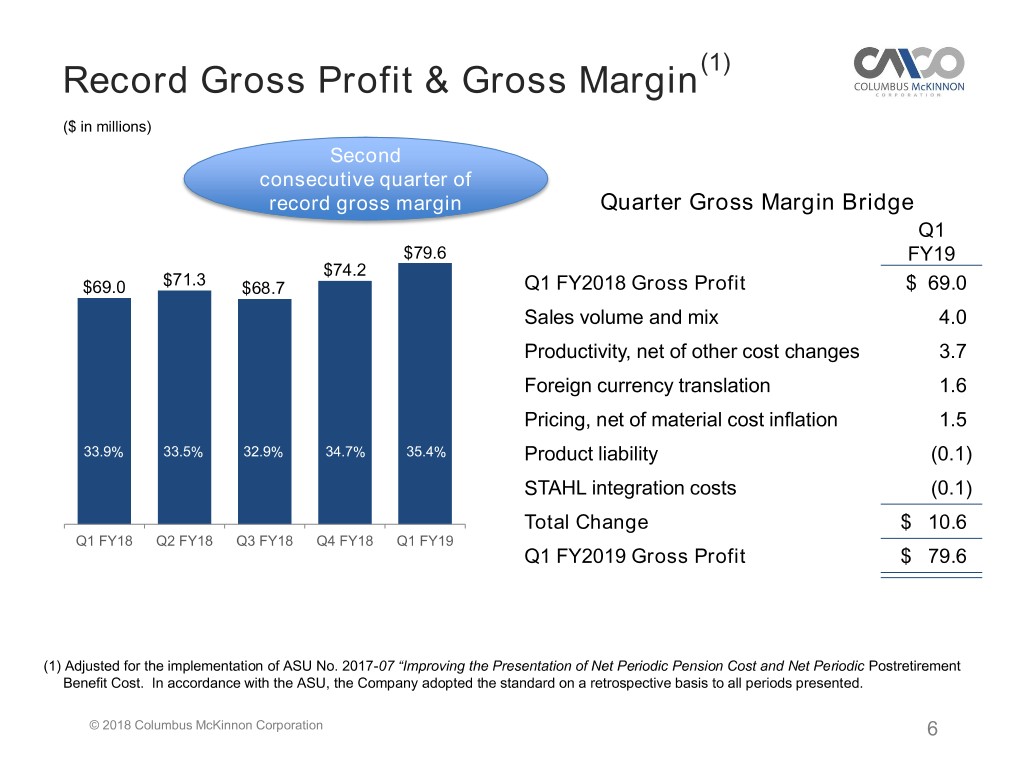
(1) Record Gross Profit & Gross Margin ($ in millions) Second consecutive quarter of record gross margin Quarter Gross Margin Bridge Q1 $79.6 FY19 $74.2 $69.0 $71.3 $68.7 Q1 FY2018 Gross Profit $ 69.0 Sales volume and mix 4.0 Productivity, net of other cost changes 3.7 Foreign currency translation 1.6 Pricing, net of material cost inflation 1.5 33.9% 33.5% 32.9% 34.7% 35.4% Product liability (0.1) STAHL integration costs (0.1) Total Change $ 10.6 Q1 FY18 Q2 FY18 Q3 FY18 Q4 FY18 Q1 FY19 Q1 FY2019 Gross Profit $ 79.6 (1) Adjusted for the implementation of ASU No. 2017-07 “Improving the Presentation of Net Periodic Pension Cost and Net Periodic Postretirement Benefit Cost. In accordance with the ASU, the Company adopted the standard on a retrospective basis to all periods presented. © 2018 Columbus McKinnon Corporation 6

(1) RSG&A ($ in millions) RSG&A at 22.0% of sales ex STAHL integration costs . R&D up with ramp of new product engine $54.4 $51.1 $51.1 . $48.2 Selling expenses increased on higher volume, $45.7 $3.8 $3.3 $3.7 FX and STAHL integration costs $3.7 $2.9 . G&A up due to: $23.0 $19.0 $19.5 $22.3 $21.8 • FX and STAHL integration costs: $0.4M • Benefit costs up $1.0 million, included higher bonus accruals $23.8 $25.0 $25.5 $27.6 $25.6 • Remainder largely due to environmental and Q1 FY18 Q2 FY18 Q3 FY18 Q4 FY18 Q1 FY19 bad debt accruals Selling G&A R & D Slight increase to FY19 RSG&A estimate: $48 to $49 million per quarter (excludes pro-forma items) (1) Adjusted for the implementation of ASU No. 2017-07 “Improving the Presentation of Net Periodic Pension Cost and . Increasing R&D investments Net Periodic Postretirement Benefit Cost. In accordance with the ASU, the Company adopted the standard on a retrospective . Higher incentive compensation on improved basis to all periods presented. performance © 2018 Columbus McKinnon Corporation 7

(1)(2) Operating Income & Non-GAAP Margin ($ in millions) Q1 FY19 adjusted operating income grows 26% YOY $26.5 Operating margin of 11.8% reaches $13.0 highest level in 10 years $21.0 $19.9 $20.1 $17.8 . $1.4 $4.3 Excludes $11.1 million asset held for $0.7 $4.0 sale impairment charge and $1.9 million in STAHL integration costs $19.6 $19.2 Achieved $8.3 million in STAHL $15.8 $13.7 $13.5 synergies against $14 million target for FY19 10.3%* 9.3%* 8.5%* 9.4%* 11.8%* Q1 FY18 Q2 FY18 Q3 FY18 Q4 FY18 Q1 FY19 Income from Operations Non-GAAP Adjustments * Non-GAAP operating income as % of sales. (1) Adjusted operating income is a non-GAAP financial measure. Please see supplemental slides for a reconciliation from GAAP operating income to non-GAAP operating income and other important disclosures regarding the use of non-GAAP financial measures. (2) Adjusted for the implementation of ASU No. 2017-07 “Improving the Presentation of Net Periodic Pension Cost and Net Periodic Postretirement Benefit Cost. In accordance with the ASU, the Company adopted the standard on a retrospective basis to all periods presented. © 2018 Columbus McKinnon Corporation 8

Quarterly Earnings Per Share ($ in millions) GAAP Diluted EPS Net income: $7.7 million, or $0.33 per diluted share $0.51 $0.54 $0.36 $0.33 . Effective tax rate for quarter was 19% Non-GAAP adjusted net income(1): $17.5 million . ($0.46) 39% increase over Q1’18 Q1 FY18 Q2 FY18 Q3 FY18 Q4 FY18 Q1 FY19 $0.74 per diluted share Non-GAAP Adjusted EPS(1) . 35% increase over Q1’18 (1) $0.74 Record 15.7% adjusted EBITDA margin 2 $0.55 $0.51 $0.51 Fiscal 2019 tax rate expected to be $0.44 in the range of 21% to 23% Q1 FY18 Q2 FY18 Q3 FY18 Q4 FY18 Q1 FY19 (1) Adjusted net income, adjusted diluted earnings per share (EPS) and adjusted EBITDA are non-GAAP financial measures. Please see supplemental slides for a reconciliation from GAAP net income and diluted EPS to non-GAAP adjusted net income, adjusted diluted EPS and adjusted EBITDA, and other important disclosures regarding the use of non-GAAP financial measures. (2) Tax rate guidance provided July 31, 2018 © 2018 Columbus McKinnon Corporation 9

Working Capital Working Capital Working capital as % of sales increased as a Percent of Sales 40 bps from prior year period to 19.4% . Prior year period excluded STAHL 19.4% 19.0% . 18.5% Accounts receivable increased 130 bps due 17.9% 17.4% to higher DSO’s for STAHL Sequential increase due to decline in (1) (1) 6/30/17 (1) 9/30/17 12/31/17 3/31/18 6/31/18 accrued liabilities as a result of bonus payments Inventory Turns Inventory turns of 3.7x . Inventory increased for strong demand 4.1x 4.0x . 3.9x Tightening in the supply chain 3.7x 3.7x 6/30/17 9/30/17 12/31/2017 3/31/18 6/30/2018 (1) Excludes the impact of STAHL which was acquired on January 31, 2017 © 2018 Columbus McKinnon Corporation 10

Cash Flow Three Months Ended Note: Components may not add to totals due to rounding June 30, 2018 2017 Net cash provided by operating activities $ 8.1 $ 14.4 Capital expenditures (CapEx) (2.3) (1.9) Operating free cash flow $ 5.8 $ 12.5 Generated $8.1 million in cash from operations . Represents low point for quarterly Operating free cash flow . Paid $9 million of incremental cash bonuses in June . FY 2019 expected CapEx: ~ $15 million to $20 million(1) (1) Capital expenditure guidance provided July 31, 2018 © 2018 Columbus McKinnon Corporation 11

De-levering Balance Sheet CAPITALIZATION Debt reduction continues . June 30, March 31, Paid down $10 million in debt 2018 2018 . Net Debt/ Adjusted TTM EBITDA(1) Cash and cash equivalents $ 57.1 $ 63.0 • Further reduced to 2.4x Total debt 353.8 363.3 On track for $60 million debt reduction in FY19 Total net debt 296.7 300.3 Shareholders’ equity 409.6 408.2 Capital priorities: . Organic growth Total capitalization $ 763.4 $ 771.5 . Acquisitions Debt/total capitalization 46.3% 47.1% . Dividend / Buyback Net debt/net total 42.0% 42.4% capitalization (1) Adjusted EBITDA is a non-GAAP financial measure. Please see supplemental slides for a reconciliation from GAAP net income to non-GAAP adjusted EBITDA and other important disclosures regarding the use of non-GAAP financial measures. © 2018 Columbus McKinnon Corporation 12

Continue to Advance Blueprint 2021 Committed to delivering higher performance business: . Our strategy is working - changes are sustainable through cycles . Strong start to fiscal 2019: delivering stronger earnings and margins Outlook . Focus on quality revenue; shedding approximately 1% in Q2 FY19 . Results in expected Q2 growth rate of about 2% to 3% . Managing material and labor costs . Strong order pipeline for new projects Expanding EBITDA margin, improving ROIC and strengthening earnings power © 2018 Columbus McKinnon Corporation 13

Supplemental Information © 2018 Columbus McKinnon Corporation 14

Conference Call Playback Info Replay Number: 412-317-6671 passcode: 13680955 Telephone replay available through August 7, 2018 Webcast / PowerPoint / Replay available at www.cmworks.com/investors Transcript, when available, at www.cmworks.com/investors © 2018 Columbus McKinnon Corporation 15

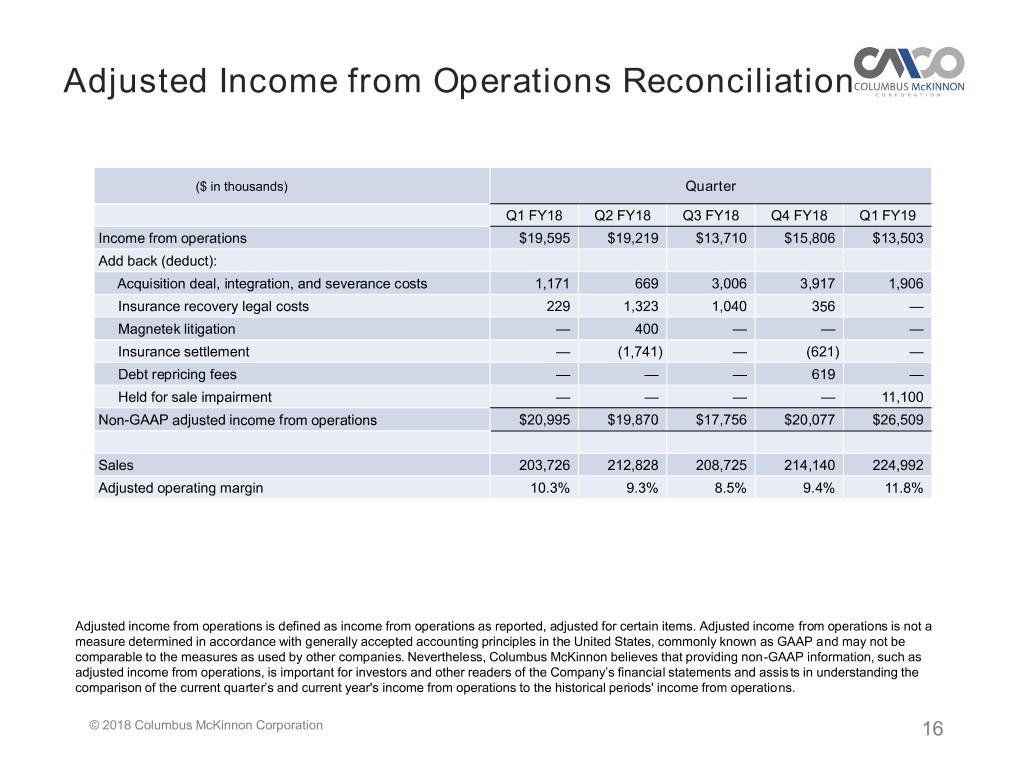
Adjusted Income from Operations Reconciliation ($ in thousands) Quarter Q1 FY18 Q2 FY18 Q3 FY18 Q4 FY18 Q1 FY19 Income from operations $19,595 $19,219 $13,710 $15,806 $13,503 Add back (deduct): Acquisition deal, integration, and severance costs 1,171 669 3,006 3,917 1,906 Insurance recovery legal costs 229 1,323 1,040 356 — Magnetek litigation — 400 — — — Insurance settlement — (1,741) — (621) — Debt repricing fees — — — 619 — Held for sale impairment — — — — 11,100 Non-GAAP adjusted income from operations $20,995 $19,870 $17,756 $20,077 $26,509 Sales 203,726 212,828 208,725 214,140 224,992 Adjusted operating margin 10.3% 9.3% 8.5% 9.4% 11.8% Adjusted income from operations is defined as income from operations as reported, adjusted for certain items. Adjusted income from operations is not a measure determined in accordance with generally accepted accounting principles in the United States, commonly known as GAAP and may not be comparable to the measures as used by other companies. Nevertheless, Columbus McKinnon believes that providing non-GAAP information, such as adjusted income from operations, is important for investors and other readers of the Company’s financial statements and assists in understanding the comparison of the current quarter’s and current year's income from operations to the historical periods' income from operations. © 2018 Columbus McKinnon Corporation 16

Adjusted Net Income Reconciliation ($ in thousands, except per share data) Quarter Q1 FY18 Q2 FY18 Q3 FY18 Q4 FY18 Q1 FY19 Net income (loss) $ 11,656 $ 12,508 $ (10,565) $ 8,466 $ 7,706 Add back (deduct): Acquisition deal, integration, and severance costs 1,171 669 3,006 3,917 1,906 Insurance recovery legal costs 229 1,323 1,040 356 — Magnetek litigation — 400 — — — Insurance settlement — (1,741) — (621) — Debt repricing fees — — — 619 — Held for sale impairment — — — — 11,100 Normalize tax rate (1) (458) (1,296) 16,938 (776) (3,173) Non-GAAP adjusted net income $ 12,598 $ 11,863 $ 10,419 $ 11,961 $ 17,539 Average diluted shares outstanding 23,028 23,142 23,577 23,628 23,610 Diluted income per share - GAAP $0.51 $0.54 $(0.46) $0.36 $0.33 Diluted income per share - Non-GAAP $0.55 $0.51 $0.44 $0.51 $0.74 (1) Applies normalized tax rate of 22% to GAAP pre-tax income and non-GAAP adjustments above, which are each pre-tax. Adjusted net income and diluted EPS are defined as net income and diluted EPS as reported, adjusted for certain items and to apply a normalized tax rate. Adjusted net income and diluted EPS are not measures determined in accordance with generally accepted accounting principles in the United States, commonly known as GAAP, and may not be comparable to the measure as used by other companies. Nevertheless, Columbus McKinnon believes that providing non-GAAP information, such as adjusted net income and diluted EPS, is important for investors and other readers of the Company’s financial statements and assists in understanding the comparison of the current quarter’s and current year’s net income and diluted EPS to the historical periods’ net income and diluted EPS. © 2018 Columbus McKinnon Corporation 17

Adjusted EBITDA Reconciliation ($ in thousands) Quarter Q1 FY18 Q2 FY18 Q3 FY18 Q4 FY18 Q1 FY19 Net income $ 11,656 $ 12,508 $ (10,565) $ 8,466 $ 7,706 Add back (deduct): Income tax expense 3,095 2,050 19,877 2,598 1,774 Interest and debt expense 5,141 5,067 4,864 4,661 4,607 Investment (income) loss (62) (46) (53) 4 (268) Foreign currency exchange (gain) loss 324 69 312 834 (276) Other (income)/expense (559) (61) (262) (239) (40) Depreciation and amortization expense 8,660 9,095 9,118 9,263 8,832 Acquisition deal, integration, and severance costs 1.171 669 3,006 3,917 1,906 Insurance recovery legal costs 229 1,323 1,040 356 — Debt repricing fees — — — 619 — Magnetek litigation — 400 — — — Insurance settlement — (1,741) — (621) — Held for sale impairment — — — — 11,100 Non-GAAP adjusted EBITDA $ 29,655 $ 29,333 $ 27,337 $ 29,858 $ 35,341 Sales $ 203,726 $ 212,828 $ 208,725 $ 214,140 $ 224,992 Adjusted EBITDA margin 14.6% 13.8% 13.1% 13.9% 15.7% Adjusted EBITDA represents net income adjusted for income taxes, interest, depreciation and amortization and other items as noted in the reconciliation table. The Company believes Adjusted EBITDA is an important supplemental measure of operating performance and uses it to assess performance and inform operating decisions. However, Adjusted EBITDA is not a GAAP financial measure. The Company’s calculation of Adjusted EBITDA should not be used as a substitute for GAAP measures of performance, including net cash provided by operations, operating income and net income. The Company’s method of calculating Adjusted EBITDA may vary substantially from the methods used by other companies and investors are cautioned not to rely unduly on it. © 2018 Columbus McKinnon Corporation 18
