Attached files
| file | filename |
|---|---|
| EX-99.1 - EXHIBIT 99.1 - Booz Allen Hamilton Holding Corp | bah063018exhibit991.htm |
| 8-K - 8-K - Booz Allen Hamilton Holding Corp | fy2019q18kearningsrelease.htm |

EARNINGS CALL PRESENTATION Fiscal Year 2019, First Quarter JULY 30, 2018

CALL HORACIO ROZANSKI PARTICIPANTS PRESIDENT AND CHIEF EXECUTIVE OFFICER LLOYD HOWELL CHIEF FINANCIAL OFFICER AND TREASURER NICHOLAS VEASEY DIRECTOR INVESTOR RELATIONS 1

DISCLAIMER Forward Looking Safe Harbor Statement Certain statements contained in this presentation and in related comments by our management include “forward-looking statements” within the meaning of the Private Securities Litigation Reform Act of 1995. Examples of forward-looking statements include information concerning Booz Allen’s preliminary financial results, financial outlook and guidance, including forecasted revenue, Diluted EPS, Adjusted Diluted EPS, free cash flow, future quarterly dividends, and future improvements in operating margins, as well as any other statement that does not directly relate to any historical or current fact. In some cases, you can identify forward-looking statements by terminology such as “may,” “will,” “could,” “should,” “forecasts,” “expects,” “intends,” “plans,” “anticipates,” “projects,” “outlook,” “believes,” “estimates,” “predicts,” “potential,” “continue,” “preliminary,” or the negative of these terms or other comparable terminology. Although we believe that the expectations reflected in the forward-looking statements are reasonable, we can give you no assurance these expectations will prove to have been correct. These forward-looking statements relate to future events or our future financial performance and involve known and unknown risks, uncertainties and other factors that may cause our actual results, levels of activity, performance or achievements to differ materially from any future results, levels of activity, performance or achievements expressed or implied by these forward-looking statements. A number of important factors could cause actual results to differ materially from those contained in or implied by these forward-looking statements, including those factors discussed in our filings with the Securities and Exchange Commission (SEC), including our Annual Report on Form 10-K for the fiscal year ended March 31, 2018, which can be found at the SEC’s website at www.sec.gov. All forward-looking statements attributable to us or persons acting on our behalf are expressly qualified in their entirety by the foregoing cautionary statements. All such statements speak only as of the date made and, except as required by law, we undertake no obligation to update or revise publicly any forward-looking statements, whether as a result of new information, future events or otherwise. Note Regarding Non-GAAP Financial Data Information Booz Allen discloses in the following information Revenue, Excluding Billable Expenses, Adjusted Operating Income, Adjusted EBITDA, Adjusted EBITDA Margin on Revenue, Adjusted EBITDA Margin on Revenue, Excluding Billable Expenses, Adjusted Net Income, Adjusted Diluted EPS, and Free Cash Flow which are not recognized measurements under GAAP, and when analyzing Booz Allen’s performance or liquidity as applicable, investors should (i) evaluate each adjustment in our reconciliation of revenue to Revenue, Excluding Billable Expenses, operating income to Adjusted Operating Income, net income to Adjusted EBITDA, Adjusted EBITDA Margin on Revenue, Adjusted EBITDA Margin on Revenue, Excluding Billable Expenses, Adjusted Net Income and Adjusted Diluted Earnings Per Share, and net cash provided by operating activities to Free Cash Flow, and the explanatory footnotes regarding those adjustments, each as defined under GAAP, (ii) use Revenue, Excluding Billable Expenses, Adjusted Operating Income, Adjusted EBITDA, Adjusted EBITDA Margin on Revenue, Adjusted EBITDA Margin on Revenue Excluding Billable Expenses, Adjusted Net Income, and Adjusted Diluted EPS in addition to, and not as an alternative to revenue, operating income, net income or diluted EPS as measures of operating results, and (iii) use Free Cash Flow in addition to and not as an alternative to net cash provided by operating activities as a measure of liquidity, each as defined under GAAP. The Financial Appendix includes a reconciliation of Revenue, Excluding Billable Expenses, Adjusted Operating Income, Adjusted EBITDA, Adjusted EBITDA Margin on Revenue, Adjusted EBITDA Margin on Revenue, Excluding Billable Expenses, Adjusted Net Income, Adjusted Diluted EPS, and Free Cash Flow to the most directly comparable financial measure calculated and presented in accordance with GAAP. Booz Allen presents these supplemental performance measures because it believes that these measures provide investors and securities analysts with important supplemental information with which to evaluate Booz Allen’s performance, long term earnings potential, or liquidity, as applicable and to enable them to assess Booz Allen’s performance on the same basis as management. These supplemental performance and liquidity measurements may vary from and may not be comparable to similarly titled measures by other companies in Booz Allen’s industry. With respect to our expectations under “Fiscal 2019 Full Year Outlook,” reconciliation of Adjusted Diluted EPS guidance to the closest corresponding GAAP measure is not available without unreasonable efforts on a forward-looking basis due to our inability to predict our stock price, equity grants and dividend declarations during the course of fiscal 2019. Projecting future stock price, equity grants and dividends to be declared would be necessary to accurately calculate the difference between Adjusted Diluted EPS and GAAP EPS as a result of the effects of the two-class method and related possible dilution used in the calculation of EPS. Consequently, any attempt to disclose such reconciliation would imply a degree of precision that could be confusing or misleading to investors. We expect the variability of the above charges to have an unpredictable, and potentially significant, impact on our future GAAP financial results. 2

Q1 FY19 HIGHLIGHTS KEY PERFORMANCE INDICATORS • Delivered revenue and earnings performance consistent with our FY19 guidance and 3-year growth goals • Maintained industry-leading organic revenue growth (1) • Record total backlog since IPO, up 21.4% compared to the prior year period • Record Q1 funded backlog since IPO, up 11.6% compared to the prior year period • Record Q1 book-to-bill since IPO of 1.64x • Returned $76 million to shareholders through dividends and share repurchases • Announced refinancing transaction that will reduce our interest expense and provide additional flexibility and liquidity • Awarded an $885M five-year task order from GSA FEDSIM to provide Enterprise Machine Learning Analytics and Persistent Services (eMAPS) to the Department of Defense, furthering our aspiration to build a large portfolio of AI business 1) Industry consists of CACI International Inc., Engility Holdings Inc., Leidos Holdings Inc., ManTech International Corp., and Science Applications International Corp. 3

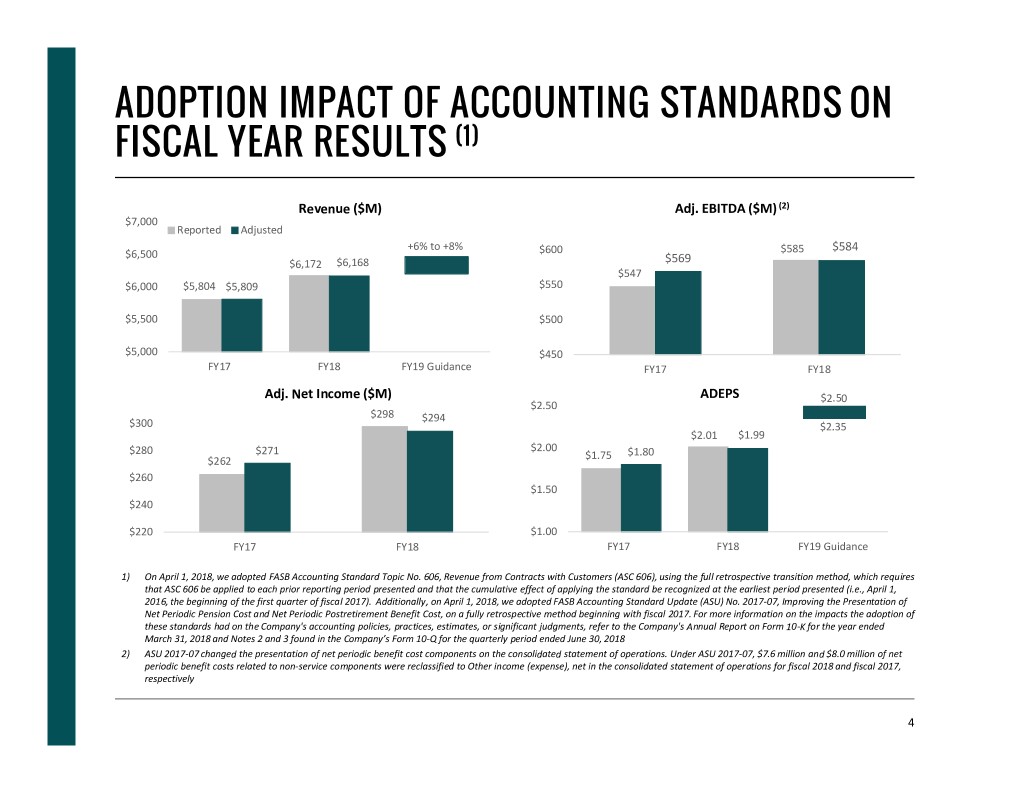
ADOPTION IMPACT OF ACCOUNTING STANDARDS ON FISCAL YEAR RESULTS (1) Revenue ($M) Adj. EBITDA ($M) (2) $7,000 Reported Adjusted +6% to +8% $584 $6,500 $600 $585 $6,172 $6,168 $569 $547 $6,000 $5,804 $5,809 $550 $5,500 $500 $5,000 $450 FY17 FY18 FY19 Guidance FY17 FY18 Adj. Net Income ($M) ADEPS $2.50 $2.50 $298 $294 $300 $2.35 $2.01 $1.99 $2.00 $280 $271 $1.75 $1.80 $262 $260 $1.50 $240 $220 $1.00 FY17 FY18 FY17 FY18 FY19 Guidance 1) On April 1, 2018, we adopted FASB Accounting Standard Topic No. 606, Revenue from Contracts with Customers (ASC 606), using the full retrospective transition method, which requires that ASC 606 be applied to each prior reporting period presented and that the cumulative effect of applying the standard be recognized at the earliest period presented (i.e., April 1, 2016, the beginning of the first quarter of fiscal 2017). Additionally, on April 1, 2018, we adopted FASB Accounting Standard Update (ASU) No. 2017-07, Improving the Presentation of Net Periodic Pension Cost and Net Periodic Postretirement Benefit Cost, on a fully retrospective method beginning with fiscal 2017. For more information on the impacts the adoption of these standards had on the Company's accounting policies, practices, estimates, or significant judgments, refer to the Company's Annual Report on Form 10-K for the year ended March 31, 2018 and Notes 2 and 3 found in the Company’s Form 10-Q for the quarterly period ended June 30, 2018 2) ASU 2017-07 changed the presentation of net periodic benefit cost components on the consolidated statement of operations. Under ASU 2017-07, $7.6 million and $8.0 million of net periodic benefit costs related to non-service components were reclassified to Other income (expense), net in the consolidated statement of operations for fiscal 2018 and fiscal 2017, respectively 4

ADOPTION IMPACT OF ACCOUNTING STANDARDS ON QUARTERLY FISCAL 2018 RESULTS Revenue ($M) (1) 11.5% Adj. EBITDA Margin on Revenue (1) (2) $1,650 $1,636 $1,631 Reported Adjusted $1,600 10.4% 10.5% $1,543 9.9% $1,550 $1,542 9.7% $1,523 9.5% 9.3% 9.2% 9.3% $1,494 $1,500 9.1% $1,500 9.0% $1,471 $1,450 8.5% Q1 FY18 Q2 FY18 Q3 FY18 Q4 FY18 Q1 FY18 Q2 FY18 Q3 FY18 Q4 FY18 $0.60 $85 Adj. Net Income ($M) (1) ADEPS (1) $79.9 $80 $0.55 $0.53 $75.4 $76.2 $0.52 $74.0 $73.8 $0.51 $75 $0.50 $0.51 $71.0 $71.3 $0.50 $70.2 $0.47 $0.48 $0.48 $70 $0.45 $65 $60 $0.40 Q1 FY18 Q2 FY18 Q3 FY18 Q4 FY18 Q1 FY18 Q2 FY18 Q3 FY18 Q4 FY18 1) For interim period financial reporting purposes under ASC 606, contract revenue attributable to indirect costs is recognized using the agreed-upon annual forward-pricing rates established with the U.S. government at the start of each fiscal year. The impact of this change relates to the interim financial reporting period differences between the actual indirect cost incurred and allocated to contracts compared to the estimated amounts allocated to contracts using the estimated annual forward-pricing rates established with the U.S. government. Prior to the adoption of ASC 606, the Company’s practice was to record during interim reporting periods adjustments to revenue based on the indirect spending incurred as of that interim period ended primarily for cost-reimbursable and fixed-price contracts 2) Under ASU 2017-07, $1.9 million and $2.0 million of net periodic benefit costs related to non-service components were reclassified to Other income (expense), net in the condensed consolidated statement of operations for the quarterly periods during fiscal 2018 and fiscal 2017, respectively 5

KEY FINANCIAL RESULTS FIRST QUARTER FISCAL YEAR 2019 PRELIMINARY RESULTS F I R S T Q U A R T E R ( 1 ) Revenue $1.6 billion 8.1% Increase Revenue, Excluding Billable Expenses $1.2 billion 9.2% Increase Adjusted EBITDA $178 million 25.1% Increase Net Income $104 million 47.6% Increase Adjusted Net Income $105 million 47.4% Increase Diluted EPS $0.72 53.2% Increase Adjusted Diluted EPS $0.72 53.2% Increase $17.1 billion Total Backlog 21.4% Increase 1) Comparisons are to prior fiscal period 6

CAPITAL ALLOCATION DELIVERING STRONG CAPITAL RETURNS THROUGH EFFICIENT CAPITAL DEPLOYMENT STRATEGY • Our FY 19 and multi-year capital deployment plans remain on track - Aim to deploy $350 million this year, subject to market conditions - Aim to deploy $1.4 billion over the next three years • Returned $76 million to shareholders in dividends and share repurchases during the quarter - Approximately $454 million of share repurchase authorization remained as of June 30, 2018 • Closed a transaction to reduce the interest rate spread and extend the maturity of Term Loan A and Revolving Credit Facilities, and to provide additional flexibility and liquidity through a $400M delayed draw facility 7

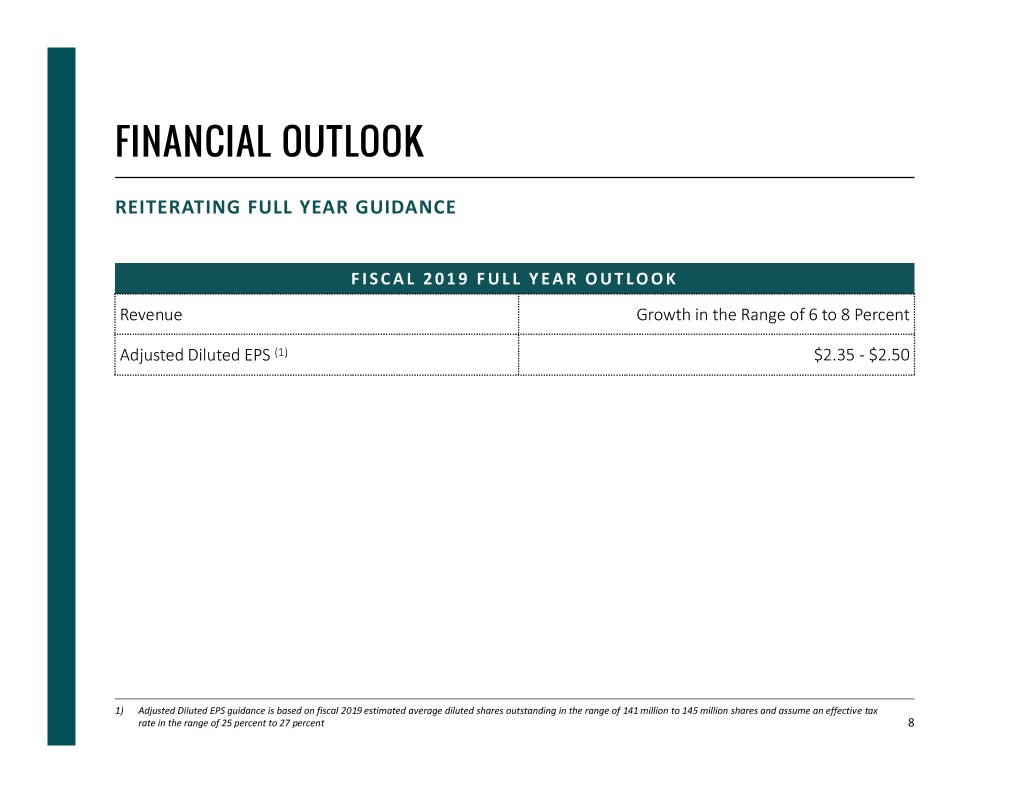
FINANCIAL OUTLOOK REITERATING FULL YEAR GUIDANCE F I S C A L 2 0 1 9 F U L L Y E A R O U T LO O K Revenue Growth in the Range of 6 to 8 Percent Adjusted Diluted EPS (1) $2.35 - $2.50 1) Adjusted Diluted EPS guidance is based on fiscal 2019 estimated average diluted shares outstanding in the range of 141 million to 145 million shares and assume an effective tax rate in the range of 25 percent to 27 percent 8

APPENDIX

NON-GAAP FINANCIAL INFORMATION • "Revenue, Excluding Billable Expenses" represents revenue less billable expenses. We use Revenue, Excluding Billable Expenses because it provides management useful information about the Company's operating performance by excluding the impact of costs that are not indicative of the level of productivity of our consulting staff headcount and our overall direct labor, which management believes provides useful information to our investors about our core operations. • "Adjusted Operating Income" represents operating income before: (i) adjustments related to the amortization of intangible assets resulting from the acquisition of our Company by The Carlyle Group (the “Carlyle Acquisition”), and (ii) transaction costs, fees, losses, and expenses, including fees associated with debt prepayments. We prepare Adjusted Operating Income to eliminate the impact of items we do not consider indicative of ongoing operating performance due to their inherent unusual, extraordinary, or non-recurring nature or because they result from an event of a similar nature. • "Adjusted EBITDA" represents net income before income taxes, net interest and other expense and depreciation and amortization and before certain other items, including transaction costs, fees, losses, and expenses, including fees associated with debt prepayments. “Adjusted EBITDA Margin on Revenue” is calculated as Adjusted EBITDA divided by revenue. Adjusted EBITDA Margin on Revenue, Excluding Billable Expenses is calculated as Adjusted EBITDA divided by Revenue, Excluding Billable Expenses. The Company prepares Adjusted EBITDA, Adjusted EBITDA Margin on Revenue, and Adjusted EBITDA Margin on Revenue, Excluding Billable Expenses to eliminate the impact of items it does not consider indicative of ongoing operating performance due to their inherent unusual, extraordinary or non-recurring nature or because they result from an event of a similar nature. • "Adjusted Net Income" represents net income before: (i) adjustments related to the amortization of intangible assets resulting from the Carlyle Acquisition, (ii) transaction costs, fees, losses, and expenses, including fees associated with debt prepayments, (iii) amortization or write-off of debt issuance costs and write-off of original issue discount, (iv) release of income tax reserves, and (v) re-measurement of deferred tax assets and liabilities as a result of the 2017 Tax Act in each case net of the tax effect where appropriate calculated using an assumed effective tax rate. We prepare Adjusted Net Income to eliminate the impact of items, net of tax, we do not consider indicative of ongoing operating performance due to their inherent unusual, extraordinary, or non-recurring nature or because they result from an event of a similar nature. We view net income excluding the impact of the re-measurement of the Company's deferred tax assets and liabilities as a result of the 2017 Tax Act as an important indicator of performance consistent with the manner in which management measures and forecasts the Company's performance and the way in which management is incentivized to perform. • "Adjusted Diluted EPS" represents diluted EPS calculated using Adjusted Net Income as opposed to net income. Additionally, Adjusted Diluted EPS does not contemplate any adjustments to net income as required under the two-class method as disclosed in the footnotes to the consolidated financial statements. • "Free Cash Flow" represents the net cash generated from operating activities less the impact of purchases of property and equipment. 10

NON-GAAP FINANCIAL INFORMATION (a) Reflects the combination of Interest expense and Other income (expense), net from the condensed consolidated statement of operations. (b) The first quarter of fiscal 2018 reflects the tax effect of adjustments at an assumed effective tax rate of 40%. For fiscal 2019, with the enactment of the 2017 Tax Act, adjustments are reflected using an assumed effective tax rate of 26%, which approximates a blended federal and state tax rate for fiscal 2019, and consistently excludes the impact of other tax credits and incentive benefits realized. (c) Excludes an adjustment of approximately $0.6 million and $0.5 million of net earnings for the three months ended June 30, 2018 and 2017, respectively, associated with the application of the two-class method for computing diluted earnings per share. 11

FINANCIAL RESULTS – KEY DRIVERS First Quarter Fiscal 2019 – Below is a summary of the key factors driving results for the fiscal 2019 first quarter ended June 30, 2018 as compared to the prior year: • Revenue increased by 8.1% to $1.6 billion driven by continued strength in client demand, which led to a total headcount increase of more than 1,100 and an increase in direct client staff labor, as well as improved contract performance. • Revenue, Excluding Billable Expenses increased 9.2% to $1.2 billion due to increased client demand which led to increased client staff headcount, an increase in direct client staff labor, and improved contract performance. • Operating Income and Adjusted Operating Income both increased 27.6% to $161.6 million. Increases in both were primarily driven by the same factors driving revenue growth, as well as strong operating performance. • Net income increased 47.6% to $104.2 million and Adjusted Net Income increased 47.4% to $104.7 million. These increases were primarily driven by the same factors as Operating Income and Adjusted Operating Income. Additionally, Net Income and Adjusted Net Income benefitted from the Company’s recognition of an additional income tax benefit of approximately $15.9 million driven by a lower federal corporate tax rate. The increases in Net Income and Adjusted Net Income were partially offset by an increase in interest expense of $4.3 million primarily due to interest on the Senior Notes as well as increases in interest on the Company’s term loans due to rising LIBOR rates. • EBITDA and Adjusted EBITDA both increased 25.1% to $177.8 million. These increases were due to the same factors as Operating Income and Adjusted Operating Income. • Diluted EPS and Adjusted Diluted EPS both increased to $0.72 from $0.47 in the prior year period. The increases were primarily driven by the same factors as Net Income and Adjusted Net Income, as well as a lower share count in the first quarter of fiscal 2019. • Net cash used in operating activities was $(27.0) million as of June 30, 2018 as compared to net cash provided by operating activities of $4.0 million as of June 30, 2017. The decline was primarily due to delays in the billing and collection of our revenue growth, which includes administrative delays in client payment processing and a decrease in accounts payable associated with the timing of vendor payments. Free Cash Flow was $(47.5) million as of June 30, 2018 as compared to $(7.5) million as of June 30, 2017. The decline was due to the same factors affecting cash provided by operating activities, as well as an increase in capital expenditures related to software and infrastructure investments to support operations and growth. We expect to generate operating cash flow of approximately $380 million to $420 million and spend approximately $100 million on capital expenditures for fiscal 2019. This would result in a fiscal 2019 free cash flow range of approximately $280 million to $320 million. Assuming the midpoint of our fiscal 2019 free cash flow range, or approximately $300 million, and growing fiscal 2019 revenue to approximately $6.6 billion, the midpoint of our fiscal 2019 revenue guidance range of 6 to 8 percent growth over fiscal 2018, we expect our free cash flow as a percentage of our revenue to be approximately 4.5 percent for fiscal 2019. • As of March 31, 2018, total backlog was $17.1 billion, an increase of 21.4% compared to June 30, 2017. Funded backlog increased 11.6%. 12
