Attached files
| file | filename |
|---|---|
| 8-K - 8-K - WELLTOWER INC. | a2q188-k.htm |
| EX-99.1 - EXHIBIT 99.1 - WELLTOWER INC. | a2q18earningsrelease991.htm |

Table of Contents | |
Overview | |
(dollars in thousands, at Welltower pro rata ownership) | |||||||||||
Portfolio Composition | Beds/Unit Mix | ||||||||||
Average Age | Properties | Total | Independent Living | Assisted Living | Memory Care | Long-Term/ Post-Acute Care | |||||
Seniors housing triple-net | 14 | 404 | 35,238 | 7,766 | 20,481 | 6,509 | 482 | ||||
Long-term/post-acute care | 19 | 180 | 21,489 | 40 | 1,016 | 127 | 20,306 | ||||
Seniors housing operating | 17 | 518 | 62,557 | 28,527 | 21,879 | 11,723 | 428 | ||||
Square Feet | |||||||||||
Outpatient medical | 13 | 251 | 16,330,593 | ||||||||
Land parcels | 14 | ||||||||||
Total | 16 | 1,367 | |||||||||
NOI Performance | Same Store(1) | In-Place Portfolio(2) | ||||||||||||||||
Properties | 2Q17 NOI | 2Q18 NOI | % Change | Properties | Annualized In-Place NOI | % of Total | ||||||||||||
Seniors housing triple-net(3) | 305 | $ | 100,615 | 103,783 | 3.1 | % | 375 | $ | 530,360 | 26.7 | % | |||||||
Long-term/post-acute care(3) | 147 | 49,143 | 50,277 | 2.3 | % | 156 | 208,868 | 10.5 | % | |||||||||
Seniors housing operating | 435 | 207,304 | 207,601 | 0.1 | % | 491 | 907,492 | 45.7 | % | |||||||||
Outpatient medical | 231 | 79,638 | 81,232 | 2.0 | % | 244 | 339,900 | 17.1 | % | |||||||||
Total | 1,118 | $ | 436,700 | 442,893 | 1.4 | % | 1,266 | $ | 1,986,620 | 100.0 | % | |||||||
Portfolio Performance | Facility Revenue Mix | |||||||||||
Stable Portfolio(4) | Occupancy | EBITDAR Coverage(5) | EBITDARM Coverage(5) | Private Pay | Medicaid | Medicare | Other Government(6) | |||||
Seniors housing triple-net | 86.2 | % | 1.07 | 1.23 | 93.3 | % | 3.2 | % | 0.5 | % | 3.0 | % |
Long-term/post-acute care | 82.7 | % | 1.44 | 1.77 | 31.3 | % | 33.0 | % | 35.7 | % | 0.0 | % |
Seniors housing operating | 87.6 | % | n/a | n/a | 98.1 | % | 0.1 | % | 0.4 | % | 1.4 | % |
Outpatient medical | 93.6 | % | n/a | n/a | 98.8 | % | 0.0 | % | 0.0 | % | 1.2 | % |
Total | 1.17 | 1.38 | 94.6 | % | 1.9 | % | 2.0 | % | 1.5 | % | ||
Property Acquisitions/Joint Ventures Detail | ||||||||||
Operator | Units | Location | MSA | |||||||
Seniors Housing Operating | ||||||||||
Kisco Senior Living | 176 | 300 Kildaire Woods Drive | Cary | North Carolina | US | Raleigh | ||||
Sunrise Senior Living | 340 | 3701 International Drive | Montgomery | Maryland | US | Washington D.C. | ||||
Total | 516 | |||||||||
Notes: | ||||||||||
(1) See page 24 for reconciliation. | ||||||||||
(2) Excludes land parcels, loans, developments and investments held for sale. See page 22 for reconciliation. | ||||||||||
(3) Same store NOI for these property types represents rent cash receipts excluding the impact of expansions. | ||||||||||
(4) Data as of June 30, 2018 for seniors housing operating and outpatient medical and March 31, 2018 for remaining asset types. | ||||||||||
(5) Represents trailing twelve month coverage metrics. | ||||||||||
(6) Represents various federal and local reimbursement programs in the United Kingdom and Canada. | ||||||||||
1
Investment | |
(dollars in thousands at Welltower pro rata ownership)
Relationship Investment History
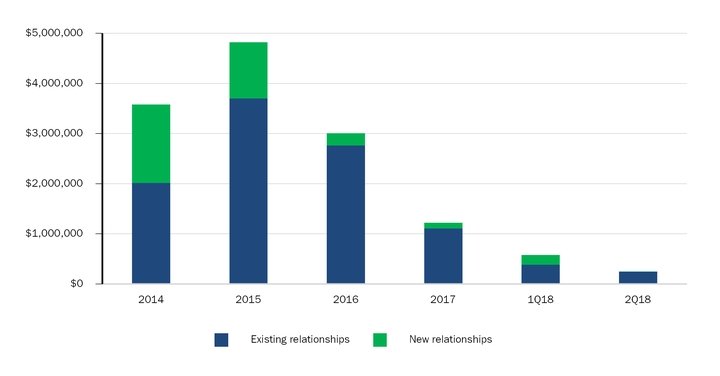
Gross Investments | ||||||||||||||||||||||||||||
2014 | 2015 | 2016 | 2017 | 1Q18 | 2Q18 | 14-18 Quarterly Average | ||||||||||||||||||||||
Existing relationships | $ | 2,018,581 | $ | 3,707,612 | $ | 2,768,874 | $ | 1,113,787 | $ | 389,949 | $ | 251,218 | $ | 640,658 | ||||||||||||||
New relationships | 1,561,250 | 1,112,520 | 238,167 | 110,367 | 188,034 | — | 199,904 | |||||||||||||||||||||
Total | $ | 3,579,831 | $ | 4,820,132 | $ | 3,007,041 | $ | 1,224,154 | $ | 577,983 | $ | 251,218 | $ | 840,562 | ||||||||||||||
% Existing | 56 | % | 77 | % | 92 | % | 91 | % | 67 | % | 100 | % | 76 | % | ||||||||||||||
Detail of Acquisitions/JVs | ||||||||||||||||||||||||||||
2014 | 2015 | 2016 | 2017 | 1Q18 | 2Q18 | 14-18 Total | ||||||||||||||||||||||
Count | 41 | 44 | 22 | 18 | 5 | 2 | 139 | |||||||||||||||||||||
Total | $ | 2,981,276 | $ | 3,765,912 | $ | 2,287,973 | $ | 742,020 | $ | 475,786 | $ | 171,600 | $ | 11,071,953 | ||||||||||||||
Low | 3,500 | 6,080 | 10,618 | 7,310 | 4,950 | 75,600 | 3,500 | |||||||||||||||||||||
Median | 31,150 | 33,513 | 27,402 | 24,025 | 42,789 | 85,800 | 30,625 | |||||||||||||||||||||
High | 880,157 | 437,472 | 1,150,000 | 149,400 | 217,000 | 96,000 | 1,150,000 | |||||||||||||||||||||
Investment Timing | ||||||||||||||||||||||||
Acquisitions/ Joint Ventures | Yield | Loan Advances(1) | Yield | Construction Conversions | Yield | Dispositions | Yield | |||||||||||||||||
April | $ | 75,600 | 6.3 | % | $ | 1,708 | 7.8 | % | $ | 62,230 | 6.4 | % | $ | — | 0.0 | % | ||||||||
May | 96,000 | 7.0 | % | 1,832 | 7.9 | % | — | 0.0 | % | 55,038 | 10.8 | % | ||||||||||||
June | — | 0.0 | % | 1,497 | 7.9 | % | 26,888 | 8.2 | % | 11,723 | 10.0 | % | ||||||||||||
Total | $ | 171,600 | 6.7 | % | $ | 5,037 | 7.9 | % | $ | 89,118 | 7.0 | % | $ | 66,761 | 10.6 | % | ||||||||
Notes: | ||||||||||||||||||||||||
(1) Includes advances for non-real estate loans and excludes advances for development loans. | ||||||||||||||||||||||||
2
Investment | |
(dollars in thousands, except per bed / unit / square foot, at Welltower pro rata ownership) | ||||||||||||
Gross Investment Activity | ||||||||||||
Second Quarter 2018 | ||||||||||||
Properties | Beds / Units / Square Feet | Pro Rata Amount | Investment Per Bed / Unit / SqFt | Yield | ||||||||
Acquisitions / Joint ventures(1) | ||||||||||||
Seniors housing operating | 2 | 516 | units | $ | 171,600 | 332,558 | 6.7 | % | ||||
Development(2) | ||||||||||||
Development projects: | ||||||||||||
Seniors housing triple-net | 8 | 799 | units | $ | 24,610 | |||||||
Long-term/post-acute care | 1 | 120 | beds | 3,405 | ||||||||
Seniors housing operating | 8 | 1,102 | units | 21,304 | ||||||||
Outpatient medical | 2 | 245,455 | sf | 21,073 | ||||||||
Total development projects | 19 | $ | 70,392 | |||||||||
Expansion projects: | ||||||||||||
Seniors housing triple-net | 2 | 81 | units | $ | 2,338 | |||||||
Seniors housing operating | 1 | 48 | units | 1,851 | ||||||||
Total expansion projects | 3 | $ | 4,189 | |||||||||
Total development | 22 | $ | 74,581 | 7.8 | % | |||||||
Loan advances(3) | 5,037 | 7.9 | % | |||||||||
Gross investments | $ | 251,218 | 7.0 | % | ||||||||
Dispositions(4) | ||||||||||||
Seniors housing triple-net | 1 | 172 | units | $ | 18,038 | 104,872 | 11.0 | % | ||||
Long-term/post-acute care | 2 | 230 | beds | 37,000 | 160,870 | 10.7 | % | |||||
Real property dispositions | 3 | $ | 55,038 | 10.8 | % | |||||||
Loan payoffs | 11,723 | 10.0 | % | |||||||||
Total dispositions | 3 | $ | 66,761 | 10.6 | % | |||||||
Net investments | $ | 184,457 | ||||||||||
Notes: | ||||||||||||
(1) Amounts represent purchase price excluding accounting adjustments pursuant to U.S. GAAP for all consolidated and unconsolidated property acquisitions. Yield represents annualized contractual or projected cash rent/NOI to be generated divided by investment amount, excluding land parcels. | ||||||||||||
(2) Amounts represent cash funded and capitalized interest for all developments/expansions including construction in progress, loans and in-substance real estate. Yield represents projected annualized cash rent/NOI to be generated upon conversion/stabilization divided by commitment amount. | ||||||||||||
(3) Amounts represent cash funded to operators for real estate and non-real estate loans, excluding development loans. Yield represents annualized contractual interest divided by investment amount. | ||||||||||||
(4) Amounts represent proceeds received for loan payoffs and consolidated and unconsolidated property sales. Yield represents annualized cash rent/interest/NOI that was being generated pre-disposition divided by proceeds. | ||||||||||||
3
Investment | |
(dollars in thousands, except per bed / unit / square foot, at Welltower pro rata ownership) | ||||||||||||
Gross Investment Activity | ||||||||||||
Year-To-Date 2018 | ||||||||||||
Properties | Beds / Units / Square Feet | Pro Rata Amount | Investment Per Bed / Unit / SqFt | Yield | ||||||||
Acquisitions / Joint ventures(1) | ||||||||||||
Seniors housing operating | 11 | 2,898 | units | $ | 599,647 | 206,918 | 6.7 | % | ||||
Outpatient medical | 3 | 140,734 | sf | 47,739 | 339 | 6.0 | % | |||||
Total acquisitions | 14 | $ | 647,386 | 6.7 | % | |||||||
Development(2) | ||||||||||||
Development projects: | ||||||||||||
Seniors housing triple-net | 9 | 882 | units | $ | 37,813 | |||||||
Long-term/post-acute care | 1 | 120 | beds | 8,150 | ||||||||
Seniors housing operating | 8 | 1,102 | units | 39,628 | ||||||||
Outpatient medical | 5 | 430,270 | sf | 37,587 | ||||||||
Total development projects | 23 | $ | 123,178 | |||||||||
Expansion projects: | ||||||||||||
Seniors housing triple-net | 2 | 81 | units | $ | 8,993 | |||||||
Seniors housing operating | 1 | 48 | units | 1,851 | ||||||||
Total expansion projects | 3 | $ | 10,844 | |||||||||
Total development | 26 | $ | 134,022 | 7.9 | % | |||||||
Loan advances(3) | 47,883 | 6.1 | % | |||||||||
Gross investments | $ | 829,291 | 6.8 | % | ||||||||
Dispositions(4) | ||||||||||||
Seniors housing triple-net | 26 | 2,625 | units | $ | 452,841 | 172,511 | 7.2 | % | ||||
Long-term/post-acute care | 4 | 410 | beds | 61,985 | 151,183 | 11.7 | % | |||||
Seniors housing operating | 2 | 250 | units | 6,908 | 27,632 | 6.5 | % | |||||
Outpatient medical | 18 | 1,441,588 | sf | 428,727 | 297 | 6.0 | % | |||||
Real property dispositions | 50 | $ | 950,461 | 6.9 | % | |||||||
Loan payoffs | 103,796 | 7.5 | % | |||||||||
Total dispositions | 50 | $ | 1,054,257 | 7.0 | % | |||||||
Net investments | $ | (224,966 | ) | |||||||||
Notes: | ||||||||||||
(1) Amounts represent purchase price excluding accounting adjustments pursuant to U.S. GAAP for all consolidated and unconsolidated property acquisitions. Yield represents annualized contractual or projected cash rent/NOI to be generated divided by investment amount, excluding land parcels. | ||||||||||||
(2) Amounts represent cash funded and capitalized interest for all developments/expansions including construction in progress, loans and in-substance real estate. Yield represents projected annualized cash rent/NOI to be generated upon conversion/stabilization divided by commitment amount. | ||||||||||||
(3) Amounts represent cash funded to operators for real estate and non-real estate loans, excluding development loans. Yield represents annualized contractual interest divided by investment amount. | ||||||||||||
(4) Amounts represent proceeds received for loan payoffs and consolidated and unconsolidated property sales. Yield represents annualized cash rent/interest/NOI that was being generated pre-disposition divided by proceeds. | ||||||||||||
4
Portfolio | |
(dollars in thousands at Welltower pro rata ownership) | ||||||||||||||||||||||||
In-Place NOI Diversification(1) | ||||||||||||||||||||||||
By Partner: | Total Properties | Seniors Housing Triple-net | Long-Term/ Post-Acute Care | Seniors Housing Operating | Outpatient Medical | Total | % of Total | |||||||||||||||||
Sunrise Senior Living North America | 124 | $ | — | $ | — | $ | 263,708 | $ | — | $ | 263,708 | 13.3 | % | |||||||||||
Sunrise Senior Living United Kingdom | 44 | — | — | 77,300 | — | 77,300 | 3.9 | % | ||||||||||||||||
Brookdale Senior Living | 145 | 131,684 | — | 13,356 | — | 145,040 | 7.3 | % | ||||||||||||||||
Revera | 98 | — | — | 115,799 | — | 115,799 | 5.8 | % | ||||||||||||||||
Genesis HealthCare | 95 | — | 103,616 | — | — | 103,616 | 5.2 | % | ||||||||||||||||
Benchmark Senior Living | 37 | — | — | 79,371 | — | 79,371 | 4.0 | % | ||||||||||||||||
Brandywine Living | 27 | 74,357 | — | — | — | 74,357 | 3.7 | % | ||||||||||||||||
Senior Resource Group | 24 | — | — | 71,201 | — | 71,201 | 3.6 | % | ||||||||||||||||
Belmont Village | 19 | — | — | 64,720 | — | 64,720 | 3.3 | % | ||||||||||||||||
Avery | 52 | 58,760 | — | 1,119 | — | 59,879 | 3.0 | % | ||||||||||||||||
Sagora Senior Living | 30 | 20,972 | — | 33,869 | — | 54,841 | 2.8 | % | ||||||||||||||||
Remaining | 571 | 244,587 | 105,252 | 187,049 | 339,900 | 876,788 | 44.1 | % | ||||||||||||||||
Total | 1,266 | $ | 530,360 | $ | 208,868 | $ | 907,492 | $ | 339,900 | $ | 1,986,620 | 100.0 | % | |||||||||||
By Country: | ||||||||||||||||||||||||
United States | 1,005 | $ | 446,724 | $ | 202,115 | $ | 661,157 | $ | 318,943 | $ | 1,628,939 | 82.0 | % | |||||||||||
United Kingdom | 110 | 80,180 | — | 78,285 | 20,957 | 179,422 | 9.0 | % | ||||||||||||||||
Canada | 151 | 3,456 | 6,753 | 168,050 | — | 178,259 | 9.0 | % | ||||||||||||||||
Total | 1,266 | $ | 530,360 | $ | 208,868 | $ | 907,492 | $ | 339,900 | $ | 1,986,620 | 100.0 | % | |||||||||||
By MSA: | ||||||||||||||||||||||||
New York | 62 | $ | 71,367 | $ | 13,196 | $ | 54,155 | $ | 8,580 | $ | 147,298 | 7.4 | % | |||||||||||
Los Angeles | 64 | 2,723 | — | 102,780 | 25,614 | 131,117 | 6.6 | % | ||||||||||||||||
Greater London | 50 | 35,616 | — | 52,660 | 20,957 | 109,233 | 5.5 | % | ||||||||||||||||
Philadelphia | 37 | 20,368 | 28,840 | 9,229 | 22,350 | 80,787 | 4.1 | % | ||||||||||||||||
Dallas | 51 | 17,379 | 3,758 | 23,951 | 28,688 | 73,776 | 3.7 | % | ||||||||||||||||
Boston | 36 | 1,757 | 1,411 | 64,349 | 1,172 | 68,689 | 3.5 | % | ||||||||||||||||
Seattle | 28 | 16,173 | — | 19,480 | 14,033 | 49,686 | 2.5 | % | ||||||||||||||||
San Francisco | 17 | 12,326 | — | 35,156 | — | 47,482 | 2.4 | % | ||||||||||||||||
Washington D.C. | 20 | 7,819 | 5,822 | 32,139 | — | 45,780 | 2.3 | % | ||||||||||||||||
Toronto | 25 | — | — | 41,960 | — | 41,960 | 2.1 | % | ||||||||||||||||
Houston | 26 | 4,174 | — | 12,510 | 24,838 | 41,522 | 2.1 | % | ||||||||||||||||
Chicago | 22 | 11,711 | 1,449 | 22,496 | 2,139 | 37,795 | 1.9 | % | ||||||||||||||||
San Diego | 13 | — | 2,825 | 24,833 | 1,500 | 29,158 | 1.5 | % | ||||||||||||||||
Kansas City | 24 | 7,906 | 5,451 | 9,064 | 6,698 | 29,119 | 1.5 | % | ||||||||||||||||
Minneapolis | 19 | 12,582 | — | 3,409 | 13,087 | 29,078 | 1.5 | % | ||||||||||||||||
Miami | 23 | — | — | 10,704 | 17,458 | 28,162 | 1.4 | % | ||||||||||||||||
Montréal | 19 | — | — | 28,134 | — | 28,134 | 1.4 | % | ||||||||||||||||
Indianapolis | 16 | 8,133 | 9,542 | — | 9,999 | 27,674 | 1.4 | % | ||||||||||||||||
Atlanta | 17 | 2,278 | — | 6,707 | 17,042 | 26,027 | 1.3 | % | ||||||||||||||||
Raleigh | 11 | 16,920 | — | 7,066 | — | 23,986 | 1.2 | % | ||||||||||||||||
Remaining | 686 | 281,128 | 136,574 | 346,710 | 125,745 | 890,157 | 44.8 | % | ||||||||||||||||
Total | 1,266 | $ | 530,360 | $ | 208,868 | $ | 907,492 | $ | 339,900 | $ | 1,986,620 | 100.0 | % | |||||||||||
Notes: | ||||||||||||||||||||||||
(1) Represents current quarter annualized in-place NOI. See page 22 for reconciliation. | ||||||||||||||||||||||||
5
Portfolio | |
Top Ten Operating Partner Descriptions
Sunrise Senior Living North America, located in McLean, VA, is a privately held company that operates over 320 premium private pay seniors housing communities with over 30,000 units in the United States and Canada. The portfolio is concentrated in infill locations in major metro markets. As of June 30, 2018, the Welltower portfolio consists of 124 private pay seniors housing facilities and four developments in 26 states, the District of Columbia and a Canadian Province. Sunrise Senior Living United Kingdom, located in Beaconsfield, UK, is a wholly-owned subsidiary of Sunrise Senior Living. As of June 30, 2018, Welltower owns 44 facilities with over 3,000 units in the United Kingdom, with a large concentration in Greater London.
Brookdale Senior Living (NYSE:BKD), located in Brentwood, TN, is a publicly traded company that provides IL, AL, memory care, and rehab services. The company operates approximately 1,000 seniors housing facilities located in 47 states and has the ability to serve over 100,000 residents. As of June 30, 2018, the Welltower portfolio consisted of 145 seniors housing facilities in 29 states.
Revera, headquartered in Mississauga, Ontario, is a leading owner, operator and investor in the senior living sector. Revera owns or operates more than 500 properties across Canada, the United States and the United Kingdom, serving more than 55,000 seniors and employing over 50,000 people. The company offers seniors’ apartments, IL, AL, memory care, and long term care. As of June 30, 2018, the Welltower portfolio consisted of 98 private pay seniors housing facilities located across seven Canadian provinces operated by Revera.
Genesis Healthcare (NYSE:GEN), located in Kennett Square, PA, is a holding company with subsidiaries that, on a combined basis, comprise one of the nation's largest post-acute care providers with approximately 450 skilled nursing centers and senior living communities in 29 states nationwide. Genesis subsidiaries also supply rehabilitation therapy to approximately 1,700 locations in 45 states and the District of Columbia. As of June 30, 2018, the wholly-owned Welltower portfolio consisted of 67 long term/post-acute care properties and one development project. Welltower also owns a minority stake in a joint venture which owns 28 long term/post-acute care properties. The Welltower properties are spread across 14 states.
Benchmark Senior Living, located in Waltham, MA, is a privately held company that operates private pay seniors housing facilities across eight states with a concentration in New England. As of June 30, 2018, the Welltower portfolio consisted of 37 private pay seniors housing facilities in five states.
Brandywine Living, located in Mount Laurel, NJ, is a privately held company that operates premium private pay seniors housing facilities with over 2,500 units in six states. The company has a concentration in infill markets in the Mid-Atlantic. As of June 30, 2018, the Welltower portfolio consisted of 27 existing facilities located in six states.
Senior Resource Group, headquartered in Solana Beach, CA, is an award-winning, fully integrated developer, owner and operator of IL, AL and memory care senior living communities across the United States. Senior Resource Group operates over 30 communities across six states. As of June 30, 2018, the Welltower portfolio consisted of 24 seniors housing facilities in seven states.
Belmont Village, located in Houston, TX, is a privately held company that operates premium private pay seniors housing facilities across eight U.S. states as well as Mexico. The portfolio is concentrated in infill locations in major metro markets. As of June 30, 2018, the Welltower portfolio consisted of 19 private pay seniors housing facilities in five states.
Avery, located in Northampton, UK, is a privately held company that develops and operates high quality private pay oriented seniors housing facilities across England. As of June 30, 2018, the Welltower portfolio consisted of 52 private pay seniors housing facilities in nine regions in England.
Sagora Senior Living, located in Fort Worth, TX, is a privately held company that develops and operates seniors housing facilities across five states. As of June 30, 2018, the Welltower portfolio consisted of 30 seniors housing facilities in four states.
6
Portfolio | |
Triple-Net Payment Coverage Stratification | |||||||||||||||||||
EBITDARM Coverage(1) | EBITDAR Coverage(1) | ||||||||||||||||||
% of In-Place NOI | Seniors Housing Triple-net | Long-Term/ Post- Acute Care | Total | Weighted Average Maturity | Number of Leases | Seniors Housing Triple-net | Long-Term/ Post- Acute Care | Total | Weighted Average Maturity | Number of Leases | |||||||||
<0.85x | 0.2 | % | 0.0 | % | 0.0 | % | 3 | 1 | 0.3 | % | 0.0 | % | 0.3 | % | 7 | 2 | |||
0.85x - 0.95x | 0.0 | % | 0.0 | % | 0.0 | % | — | — | 2.9 | % | 0.1 | % | 3.0 | % | 8 | 5 | |||
0.95x - 1.05x | 2.2 | % | 0.0 | % | 2.2 | % | 8 | 3 | 3.1 | % | 0.9 | % | 4.0 | % | 12 | 6 | |||
1.05x - 1.15x | 0.9 | % | 0.1 | % | 1.0 | % | 9 | 3 | 13.0 | % | 0.7 | % | 13.7 | % | 9 | 8 | |||
1.15x - 1.25x | 13.4 | % | 0.0 | % | 13.4 | % | 9 | 9 | 0.6 | % | 0.0 | % | 0.6 | % | 9 | 2 | |||
1.25x - 1.35x | 3.0 | % | 1.6 | % | 4.6 | % | 11 | 6 | 2.6 | % | 5.2 | % | 7.8 | % | 16 | 6 | |||
>1.35x | 3.9 | % | 7.4 | % | 11.3 | % | 14 | 14 | 1.1 | % | 2.2 | % | 3.3 | % | 10 | 7 | |||
Total | 23.6 | % | 9.1 | % | 32.7 | % | 11 | 36 | 23.6 | % | 9.1 | % | 32.7 | % | 11 | 36 | |||
(dollars in thousands at Welltower pro rata ownership) | |||||||||||||||||||||||||||
Revenue and Lease Maturity(2) | |||||||||||||||||||||||||||
Rental Income | |||||||||||||||||||||||||||
Year | Seniors Housing Triple-net | Long-Term / Post-Acute Care | Outpatient Medical | Interest Income | Seniors Housing Operating | Total Revenues | % of Total | ||||||||||||||||||||
2018 | $ | 173,812 | $ | — | $ | 10,914 | $ | 5,293 | $ | — | $ | 190,019 | 4.5 | % | |||||||||||||
2019 | — | — | 28,367 | 10,059 | — | 38,426 | 0.9 | % | |||||||||||||||||||
2020 | — | — | 32,512 | 7,024 | — | 39,536 | 0.9 | % | |||||||||||||||||||
2021 | 3,203 | 1,291 | 40,067 | 1,813 | — | 46,374 | 1.1 | % | |||||||||||||||||||
2022 | 2,370 | 1,219 | 41,706 | 21,100 | — | 66,395 | 1.6 | % | |||||||||||||||||||
2023 | — | — | 29,847 | 1,660 | — | 31,507 | 0.7 | % | |||||||||||||||||||
2024 | 10,842 | — | 32,213 | 858 | — | 43,913 | 1.0 | % | |||||||||||||||||||
2025 | 64,033 | — | 19,485 | 2,874 | — | 86,392 | 2.0 | % | |||||||||||||||||||
2026 | 64,617 | 34,613 | 29,410 | 701 | — | 129,341 | 3.1 | % | |||||||||||||||||||
2027 | 31,693 | 2,343 | 9,778 | 588 | — | 44,402 | 1.1 | % | |||||||||||||||||||
2028 | 13,441 | 36,543 | 15,135 | 1,118 | — | 66,237 | 1.6 | % | |||||||||||||||||||
Thereafter | 192,181 | 143,380 | 95,194 | 2,490 | 2,999,410 | 3,432,655 | 81.4 | % | |||||||||||||||||||
$ | 556,192 | $ | 219,389 | $ | 384,628 | $ | 55,578 | $ | 2,999,410 | $ | 4,215,197 | 100.0 | % | ||||||||||||||
Weighted Avg Maturity Years | 10 | 13 | 7 | 4 | n/a | 9 | |||||||||||||||||||||
Notes: | |||||||||||||||||||||||||||
(1) Represents trailing twelve month coverage metrics as of March 31, 2018 for stable portfolio only. Agreements included represent 88% of total seniors housing triple-net and long-term/post-acute care In-Place NOI. See page 22 for a reconciliation. Agreements with mixed units use the predominant type based on investment balance. | |||||||||||||||||||||||||||
(2) Excludes all land parcels, developments and investments held for sale. Rental income represents annualized base rent for effective lease agreements. The amounts are derived from the current contracted monthly base rent including straight-line for leases with fixed escalators or annual cash rent for leases with contingent escalators, net of collectability reserves, if applicable. Rental income does not include common area maintenance charges or the amortization of above/below market lease intangibles. Interest income represents contractual rate of interest for loans, net of collectability reserves if applicable. Seniors Housing Operating revenue represents current quarter resident fee and service income annualized and adjusted for timing adjustments for current quarter acquisitions. | |||||||||||||||||||||||||||
(3) Total weighted average revenue maturity includes rental/interest income and excludes seniors housing operating revenues which have no fixed maturities. | |||||||||||||||||||||||||||
7
Portfolio | |
(Currency amounts in thousands, except per bed/unit and REVPOR. Company amounts at Welltower pro rata ownership. DNA = data not available.)
Quality Indicators | ||||||||
Long-Term/Post-Acute Care | US Portfolio(1,3) | Industry Benchmarks(2) | ||||||
Property age | 19 | 39 | ||||||
Quality mix (revenues) | 67.0 | % | 46.0 | % | ||||
EBITDARM per bed | 22,201 | DNA | ||||||
Seniors Housing Operating | US Portfolio(3,5,6) | Industry Benchmarks(4) | ||||||
Property age | 16 | 21 | ||||||
5 year total population growth | 3.9 | % | 3.5 | % | ||||
5 year 75+ population growth | 14.4 | % | 12.2 | % | ||||
Housing value | $ | 536,727 | $ | 209,770 | ||||
Household income | $ | 92,172 | $ | 61,045 | ||||
REVPOR | $ | 7,151 | $ | 4,707 | ||||
SS REVPOR growth | 3.5 | % | 2.6 | % | ||||
SSNOI per unit | $ | 23,724 | $ | 17,827 | ||||
SSNOI growth | 0.0 | % | DNA | |||||
UK Portfolio(3,5,6) | Industry Benchmarks(7) | |||||||
Property age | 10 | 21 | ||||||
Units per property | 79 | 41 | ||||||
5 year total population growth | 3.8 | % | 3.3 | % | ||||
5 year 75+ population growth | 18.6 | % | 8.9 | % | ||||
Housing value | £ | 475,423 | £ | 289,612 | ||||
REVPOR | £ | 6,463 | £ | 3,720 | ||||
SS REVPOR growth | 2.9 | % | 3.3 | % | ||||
SSNOI per unit | £ | 18,917 | £ | 9,544 | ||||
SSNOI growth | 0.3 | % | DNA | |||||
Canadian Portfolio(3,5,6) | Industry Benchmarks(8) | |||||||
5 year total population growth | 5.2 | % | 5.0 | % | ||||
5 year 75+ population growth | 17.4 | % | DNA | |||||
Housing value | C$ | 840,120 | C$ | 692,675 | ||||
Household income | C$ | 107,818 | C$ | 95,952 | ||||
REVPOR | C$ | 3,602 | C$ | 2,320 | ||||
SS REVPOR growth | 2.1 | % | 2.4 | % | ||||
SSNOI per unit | C$ | 15,349 | DNA | |||||
SSNOI growth | 0.8 | % | DNA | |||||
Notes:
(1) Welltower data as of March 31, 2018 for long-term/post-acute care. EBITDARM per bed represents trailing twelve months results for stable portfolio.
(2) Property age per 2Q18 NIC MAP for Majority NC Properties in the primary and secondary markets; quality mix per NIC Skilled Nursing Data Report, March 31, 2018.
(3) Property age, housing value and household income are NOI-weighted as of June 30, 2018. The median housing value and household income is used for the US, and the average housing value and household income is used for the UK and Canada. Housing value, household income and population growth are based on a 3-mile radius. Growth figures represent performance of Welltower's same store portfolio for current quarter. See page 23 for reconciliations.
(4) Property age, REVPOR and REVPOR growth per 2Q18 NIC MAP for Majority AL Properties in the primary and secondary markets; AMR is used as a proxy for REVPOR; population growth reflects 2018-2023 Claritas projections; housing value and household income are the US median per Claritas 2018; NOI per unit per The State of Seniors Housing 2017 and represents 2016 results.
(5) REVPOR is based on total 2Q18 results. See page 23 for reconciliation.
(6) SSNOI per unit represents the SSNOI per unit available based on trailing four quarters for those properties in the portfolio for 15 months preceding the end of the current portfolio performance period. SSNOI per unit for UK portfolio in GBP calculated by taking SSNOI per unit in USD divided by a standardized GBP/USD rate of 1.35. SSNOI per unit for Canadian portfolio in CAD calculated by taking SSNOI per unit in USD divided by a standardized USD/CAD rate of 1.25. See page 24 for reconciliation.
(7) Property age, units per property, REVPOR, REVPOR growth and NOI per Unit derived from LaingBuisson, Care of Older People UK Market Report 29th Edition; population growth reflects 2017-2022 CACI projections; housing value represents UK average per CACI 2017.
(8) Occupancy per Canada Mortgage and Housing Corporation's Seniors' Housing Report 2017; population growth reflects 2018-2023 Environics projection; housing value and household income represents Canadian average per Environics WealthScapes 2018; REVPOR and REVPOR growth represent annual averages from 2018 CMHC Seniors' Housing Survey.
8
Portfolio | |
(dollars in thousands at Welltower pro rata ownership)
New Supply in Our US Seniors Housing Operating Portfolio
We have strategically acquired and developed properties in major US metro markets that benefit from population growth and density, affluence, job growth, and higher barriers to entry. New supply in a 3-mile ring around our properties potentially impacts just 3.3% of our total annualized In-Place NOI (IPNOI).
3-Mile Ring(1) | |||||||||||||||||||||||||||||||||||
Welltower | Welltower | ||||||||||||||||||||||||||||||||||
MSA | Prop. / Units | Annualized IPNOI(2) | % of US SHO Portfolio | Prop. / Units Under Construction(3) | Prop. / Units Potentially Impacted | IPNOI Potentially Impacted(4) | 5 Year Total Pop. Growth(5) | 5 Year 75+ Pop. Growth(5) | Avg. Pop. Density(6) | Household Income(7) | Housing Value(7) | Est. Net Annual Inventory Growth(8) | Est. Annual Job Growth(9) | ||||||||||||||||||||||
Los Angeles | 37 / 4,253 | $ | 102,780 | 15.5 | % | 3 / 362 | 5 / 928 | $ | 3,996 | 3.4 | % | 13.2 | % | 6,879 | $ | 91,581 | $ | 822,309 | 0.4 | % | 1.3 | % | |||||||||||||
Boston | 32 / 2,410 | 64,349 | 9.7 | % | 1 / 96 | 1 / 98 | 2,095 | 3.5 | % | 10.3 | % | 3,013 | 104,603 | 542,019 | 3.5 | % | 1.6 | % | |||||||||||||||||
New York | 16 / 1,216 | 54,155 | 8.2 | % | 5 / 607 | 4 / 263 | 11,327 | 0.7 | % | 7.0 | % | 5,537 | 107,728 | 509,927 | 5.9 | % | 1.2 | % | |||||||||||||||||
San Francisco | 12 / 1,320 | 35,156 | 5.3 | % | 1 / 125 | 1 / 79 | 4,441 | 4.8 | % | 15.6 | % | 7,469 | 113,115 | 1,039,627 | (0.2 | )% | 1.8 | % | |||||||||||||||||
Washington D.C. | 12 / 1,292 | 32,139 | 4.9 | % | 2 / 254 | 5 / 435 | 3,818 | 4.1 | % | 15.8 | % | 5,325 | 121,306 | 687,066 | 4.1 | % | 0.7 | % | |||||||||||||||||
San Diego | 10 / 1,309 | 24,833 | 3.8 | % | — | — | — | 4.3 | % | 17.9 | % | 4,874 | 90,961 | 710,656 | 0.8 | % | 2.2 | % | |||||||||||||||||
Dallas | 13 / 1,839 | 23,951 | 3.6 | % | 1 / 180 | 1 / 215 | 779 | 7.5 | % | 26.0 | % | 3,327 | 76,833 | 267,926 | 3.9 | % | 3.4 | % | |||||||||||||||||
Chicago | 14 / 1,654 | 22,496 | 3.4 | % | 1 / 102 | 1 / 120 | 689 | 0.3 | % | 14.1 | % | 3,385 | 87,163 | 322,786 | 3.6 | % | 0.8 | % | |||||||||||||||||
Seattle | 10 / 1,094 | 19,480 | 2.9 | % | — | — | — | 5.8 | % | 19.0 | % | 5,047 | 88,637 | 498,176 | (0.7 | )% | 3.3 | % | |||||||||||||||||
San Jose | 6 / 735 | 15,144 | 2.3 | % | — | — | — | 5.3 | % | 14.5 | % | 6,353 | 114,915 | 1,102,564 | (1.1 | )% | 3.2 | % | |||||||||||||||||
Houston | 8 / 947 | 12,510 | 1.9 | % | 3 / 541 | 2 / 263 | 5,285 | 8.3 | % | 29.1 | % | 3,545 | 89,706 | 447,885 | 2.8 | % | 2.6 | % | |||||||||||||||||
New Haven | 5 / 524 | 10,842 | 1.6 | % | — | — | — | -0.3 | % | 5.0 | % | 2,290 | 70,037 | 228,944 | (0.1 | )% | 0.6 | % | |||||||||||||||||
Miami | 2 / 849 | 10,704 | 1.6 | % | — | — | — | 6.4 | % | 18.8 | % | 4,289 | 72,813 | 303,340 | 0.4 | % | 0.9 | % | |||||||||||||||||
Norwalk | 3 / 305 | 9,532 | 1.4 | % | 2 / 252 | 2 / 215 | 5,885 | 1.9 | % | 11.5 | % | 1,076 | 120,293 | 471,980 | 17.7 | % | 0.3 | % | |||||||||||||||||
Philadelphia | 5 / 374 | 9,229 | 1.4 | % | 3 / 337 | 2 / 139 | 3,941 | 0.9 | % | 4.7 | % | 1,912 | 98,394 | 377,865 | 2.9 | % | 1.4 | % | |||||||||||||||||
Phoenix | 7 / 768 | 9,197 | 1.4 | % | 1 / 100 | 1 / 144 | 1,186 | 6.6 | % | 17.1 | % | 3,428 | 70,000 | 313,354 | 8.7 | % | 3.1 | % | |||||||||||||||||
Santa Maria, CA | 2 / 605 | 9,176 | 1.4 | % | — | — | — | 4.2 | % | 8.2 | % | 2,818 | 84,181 | 645,136 | N/A | 1.8 | % | ||||||||||||||||||
Kansas City | 6 / 784 | 9,064 | 1.4 | % | 1 / 156 | 1 / 90 | 277 | 3.1 | % | 14.1 | % | 2,355 | 80,978 | 273,005 | 5.3 | % | 1.5 | % | |||||||||||||||||
Charlottesville, VA | 1 / 302 | 8,864 | 1.3 | % | — | — | — | 3.5 | % | 7.9 | % | 2,091 | 48,712 | 314,516 | N/A | 3.1 | % | ||||||||||||||||||
San Antonio | 3 / 725 | 7,525 | 1.1 | % | — | — | — | 9.1 | % | 26.1 | % | 2,730 | 59,635 | 208,173 | (0.2 | )% | 2.2 | % | |||||||||||||||||
Tampa | 3 / 905 | 7,217 | 1.1 | % | 1 / 120 | 1 / 327 | 424 | 9.7 | % | 20.0 | % | 1,433 | 74,199 | 247,128 | 2.4 | % | 2.3 | % | |||||||||||||||||
Providence | 2 / 250 | 7,076 | 1.1 | % | — | — | — | 2.8 | % | 13.7 | % | 969 | 99,807 | 390,053 | (0.6 | )% | 1.3 | % | |||||||||||||||||
Raleigh | 2 / 250 | 7,066 | 1.1 | % | 2 / 471 | 2 / 250 | 6,632 | 6.5 | % | 24.6 | % | 3,064 | 83,708 | 276,844 | 11.2 | % | 3.0 | % | |||||||||||||||||
Manchester, NH | 2 / 168 | 6,993 | 1.1 | % | — | — | — | 1.1 | % | 8.4 | % | 1,916 | 76,194 | 251,002 | N/A | 1.1 | % | ||||||||||||||||||
Atlanta | 6 / 610 | 6,707 | 1.0 | % | 4 / 687 | 4 / 443 | 4,360 | 6.7 | % | 26.7 | % | 3,593 | 85,419 | 424,644 | 8.1 | % | 1.7 | % | |||||||||||||||||
Total - Top 25 | 219 / 25,488 | $ | 526,185 | 79.6 | % | 31 / 4,390 | 33 / 4,009 | $ | 55,135 | 4.0 | % | 15.0 | % | 4,463 | $ | 95,148 | $ | 588,046 | 2.7 | % | 1.7 | % | |||||||||||||
All Other US SHO Markets | 76 / 8,966 | 134,972 | 20.4 | % | 10 / 1,329 | 12 / 1,554 | 11,001 | 3.7 | % | 12.8 | % | 2,535 | 81,037 | 344,736 | |||||||||||||||||||||
Total US SHO | 295 / 34,454 | $ | 661,157 | 100.0 | % | 41 / 5,719 | 45 / 5,563 | $ | 66,136 | 3.9 | % | 14.4 | % | 3,973 | $ | 92,172 | $ | 536,727 | |||||||||||||||||
% of Total IPNOI | 3.3 | % | |||||||||||||||||||||||||||||||||
US National Average | 3.5 | % | 12.2 | % | 93 | $ | 61,045 | $ | 209,770 | 2.9 | % | 1.6 | % | ||||||||||||||||||||||
Notes: | |||||||||||||||||||||||||||||||||||
(1) Based on historical drawing patterns in our portfolio, a 3-mile ring is appropriate for most urban markets, which accounts for the vast majority of our portfolio. A 5-mile ring is appropriate for most suburban markets. A larger ring is appropriate for rural markets. Each market is unique due to population density, town lines, geographic barriers, and roads/infrastructure. In the interest of simplicity, we have applied a 3-mile competitive ring to all of our properties given the preponderance of urban locations. We have also included a sensitivity with a 5-mile ring. | |||||||||||||||||||||||||||||||||||
(2) Represents annualized IPNOI. See pages 5 and 22 for a reconciliation. | |||||||||||||||||||||||||||||||||||
(3) Construction data provided by NIC, reflects competitive seniors housing properties within 3 miles of Welltower SHO properties for US markets. | |||||||||||||||||||||||||||||||||||
(4) Reflects annualized IPNOI for Welltower SHO properties within 3 miles of new construction for the component of our project that potentially competes with the project under construction. | |||||||||||||||||||||||||||||||||||
(5) Total population and 75+ population growth data represents simple averages of Claritas estimates for 2018-2023. | |||||||||||||||||||||||||||||||||||
(6) Average population density data represents average population per square mile within a 3-mile ring based on 2018 Claritas estimates. | |||||||||||||||||||||||||||||||||||
(7) Household income and household value data are medians weighted by IPNOI. | |||||||||||||||||||||||||||||||||||
(8) NIC MAP Data and Analysis Service, 2Q18. Net inventory growth is calculated at the MSA level based on historical deletions from inventory and a 5-6 quarter construction period to reflect our urban locations. Total - Top 25 Net Inventory Growth weighted by IPNOI. | |||||||||||||||||||||||||||||||||||
(9) Annual job growth data represents MSA level growth from May 2017-May 2018 per Bureau of Labor Statistics. | |||||||||||||||||||||||||||||||||||
(10) Weighted by IPNOI. | |||||||||||||||||||||||||||||||||||
(11) Reflects net inventory growth for NIC Top 99 Markets. | |||||||||||||||||||||||||||||||||||
9
Portfolio | |
(dollars in thousands at Welltower pro rata ownership)
New Supply in Our US Seniors Housing Operating Portfolio
We have strategically acquired and developed properties in major US metro markets that benefit from population growth and density, affluence, job growth, and higher barriers to entry. New supply in a 5-mile ring around our properties potentially impacts just 6.3% of our total annualized In-Place NOI (IPNOI).
5-Mile Ring(1) | |||||||||||||||||||||||||||||||||||
Welltower | Welltower | ||||||||||||||||||||||||||||||||||
MSA | Prop. / Units | Annualized IPNOI(2) | % of US SHO Portfolio | Prop. / Units Under Construction(3) | Prop. / Units Potentially Impacted | IPNOI Potentially Impacted(4) | 5 Year Total Pop. Growth(5) | 5 Year 75+ Pop. Growth(5) | Avg. Pop. Density(6) | Household Income(7) | Housing Value(7) | Est. Net Annual Inventory Growth(8) | Est. Annual Job Growth(9) | ||||||||||||||||||||||
Los Angeles | 37 / 4,253 | $ | 102,780 | 15.5 | % | 3 / 362 | 10 / 1,491 | $ | 9,294 | 3.4 | % | 13.4 | % | 6,667 | $ | 85,785 | $ | 760,136 | 0.4 | % | 1.3 | % | |||||||||||||
Boston | 32 / 2,410 | 64,349 | 9.7 | % | 4 / 306 | 4 / 299 | 3,585 | 3.6 | % | 10.8 | % | 2,844 | 102,941 | 527,330 | 3.5 | % | 1.6 | % | |||||||||||||||||
New York | 16 / 1,216 | 54,155 | 8.2 | % | 9 / 1,167 | 7 / 483 | 27,207 | 0.9 | % | 7.3 | % | 5,135 | 104,287 | 480,809 | 5.9 | % | 1.2 | % | |||||||||||||||||
San Francisco | 12 / 1,320 | 35,156 | 5.3 | % | 1 / 125 | 1 / 79 | 4,441 | 4.9 | % | 15.3 | % | 6,380 | 109,958 | 969,890 | (0.2 | )% | 1.8 | % | |||||||||||||||||
Washington D.C. | 12 / 1,292 | 32,139 | 4.9 | % | 5 / 582 | 9 / 1,019 | 8,216 | 4.6 | % | 16.7 | % | 5,259 | 118,213 | 659,796 | 4.1 | % | 0.7 | % | |||||||||||||||||
San Diego | 10 / 1,309 | 24,833 | 3.8 | % | 1 / 200 | 2 / 249 | 1,752 | 4.7 | % | 17.0 | % | 4,400 | 87,898 | 661,269 | 0.8 | % | 2.2 | % | |||||||||||||||||
Dallas | 13 / 1,839 | 23,951 | 3.6 | % | 3 / 417 | 2 / 293 | 1,823 | 7.3 | % | 24.8 | % | 3,154 | 71,721 | 258,667 | 3.9 | % | 3.4 | % | |||||||||||||||||
Chicago | 14 / 1,654 | 22,496 | 3.4 | % | 5 / 581 | 3 / 358 | 6,359 | 0.1 | % | 14.7 | % | 3,148 | 89,138 | 332,368 | 3.6 | % | 0.8 | % | |||||||||||||||||
Seattle | 10 / 1,094 | 19,480 | 2.9 | % | — | — | — | 6.0 | % | 20.9 | % | 4,765 | 86,025 | 497,100 | (0.7 | )% | 3.3 | % | |||||||||||||||||
San Jose | 6 / 735 | 15,144 | 2.3 | % | — | — | — | 5.2 | % | 14.8 | % | 5,456 | 113,979 | 1,094,375 | (1.1 | )% | 3.2 | % | |||||||||||||||||
Houston | 8 / 947 | 12,510 | 1.9 | % | 3 / 541 | 3 / 366 | 5,285 | 8.5 | % | 31.8 | % | 3,592 | 81,354 | 309,730 | 2.8 | % | 2.6 | % | |||||||||||||||||
New Haven | 5 / 524 | 10,842 | 1.6 | % | 1 / 160 | 1 / 103 | 776 | 0.0 | % | 5.3 | % | 2,398 | 69,098 | 244,440 | (0.1 | )% | 0.6 | % | |||||||||||||||||
Miami | 2 / 849 | 10,704 | 1.6 | % | — | — | — | 6.4 | % | 14.4 | % | 4,270 | 64,937 | 278,536 | 0.4 | % | 0.9 | % | |||||||||||||||||
Norwalk | 3 / 305 | 9,532 | 1.4 | % | 3 / 392 | 2 / 215 | 6,384 | 1.5 | % | 10.5 | % | 1,311 | 89,072 | 455,132 | 17.7 | % | 0.3 | % | |||||||||||||||||
Philadelphia | 5 / 374 | 9,229 | 1.4 | % | 4 / 437 | 2 / 139 | 3,941 | 0.9 | % | 5.4 | % | 2,154 | 91,155 | 343,625 | 2.9 | % | 1.4 | % | |||||||||||||||||
Phoenix | 7 / 768 | 9,197 | 1.4 | % | 10 / 1,734 | 6 / 721 | 6,178 | 6.8 | % | 18.2 | % | 3,154 | 68,925 | 292,107 | 8.7 | % | 3.1 | % | |||||||||||||||||
Santa Maria, CA | 2 / 605 | 9,176 | 1.4 | % | — | — | — | 4.8 | % | 9.2 | % | 1,666 | 78,859 | 677,092 | N/A | 1.8 | % | ||||||||||||||||||
Kansas City | 6 / 784 | 9,064 | 1.4 | % | 2 / 228 | 3 / 451 | 2,230 | 3.3 | % | 14.2 | % | 2,218 | 76,163 | 239,142 | 5.3 | % | 1.5 | % | |||||||||||||||||
Charlottesville, VA | 1 / 302 | 8,864 | 1.3 | % | — | — | — | 5.2 | % | 11.5 | % | 1,474 | 61,696 | 323,077 | N/A | 3.1 | % | ||||||||||||||||||
San Antonio | 3 / 725 | 7,525 | 1.1 | % | — | — | — | 8.8 | % | 25.8 | % | 2,557 | 60,774 | 198,014 | (0.2 | )% | 2.2 | % | |||||||||||||||||
Tampa | 3 / 905 | 7,217 | 1.1 | % | 1 / 120 | 1 / 327 | 424 | 9.7 | % | 17.3 | % | 1,414 | 60,418 | 214,566 | 2.4 | % | 2.3 | % | |||||||||||||||||
Providence | 2 / 250 | 7,076 | 1.1 | % | — | — | — | 2.3 | % | 12.2 | % | 1,204 | 100,344 | 380,686 | (0.6 | )% | 1.3 | % | |||||||||||||||||
Raleigh | 2 / 250 | 7,066 | 1.1 | % | 2 / 471 | 2 / 250 | 6,632 | 7.9 | % | 31.2 | % | 2,558 | 91,285 | 333,406 | 11.2 | % | 3.0 | % | |||||||||||||||||
Manchester, NH | 2 / 168 | 6,993 | 1.1 | % | — | — | — | 1.2 | % | 10.2 | % | 1,534 | 75,667 | 259,725 | N/A | 1.1 | % | ||||||||||||||||||
Atlanta | 6 / 610 | 6,707 | 1.0 | % | 6 / 995 | 5 / 535 | 5,292 | 6.7 | % | 27.9 | % | 3,322 | 82,386 | 381,747 | 8.1 | % | 1.7 | % | |||||||||||||||||
Total - Top 25 | 219 / 25,488 | $ | 526,185 | 79.6 | % | 63 / 8,818 | 63 / 7,378 | $ | 99,819 | 4.1 | % | 15.3 | % | 4,200 | $ | 91,486 | $ | 557,148 | 2.7 | % | 1.7 | % | |||||||||||||
All Other US SHO Markets | 76 / 8,966 | 134,972 | 20.4 | % | 26 / 3,454 | 25 / 2,606 | 25,588 | 3.7 | % | 13.5 | % | 2,337 | 76,380 | 321,872 | |||||||||||||||||||||
Total US SHO | 295 / 34,454 | $ | 661,157 | 100.0 | % | 89 / 12,272 | 88 / 9,984 | $ | 125,407 | 4.0 | % | 14.9 | % | 3,726 | $ | 88,300 | $ | 507,523 | |||||||||||||||||
% of Total IPNOI | 6.3 | % | |||||||||||||||||||||||||||||||||
US National Average | 3.5 | % | 12.2 | % | 93 | $ | 61,045 | $ | 209,770 | 2.9 | % | 1.6 | % | ||||||||||||||||||||||
Notes: | |||||||||||||||||||||||||||||||||||
(1) Based on historical drawing patterns in our portfolio, a 3-mile ring is appropriate for most urban markets, which accounts for the vast majority of our portfolio. A 5-mile ring is appropriate for most suburban markets. A larger ring is appropriate for rural markets. Each market is unique due to population density, town lines, geographic barriers, and roads/infrastructure. For this table, we have applied a 5-mile competitive ring to all of our properties. We have also included a sensitivity with a 3-mile ring. | |||||||||||||||||||||||||||||||||||
(2) Represents annualized IPNOI. See pages 5 and 22 for a reconciliation. | |||||||||||||||||||||||||||||||||||
(3) Construction data provided by NIC, reflects competitive seniors housing properties within 5 miles of Welltower SHO properties for US markets. | |||||||||||||||||||||||||||||||||||
(4) Reflects annualized IPNOI for Welltower SHO properties within 5 miles of new construction for the component of our project that potentially competes with the project under construction. | |||||||||||||||||||||||||||||||||||
(5) Total population and 75+ population growth data represents simple averages of Claritas estimates for 2018-2023. | |||||||||||||||||||||||||||||||||||
(6) Average population density data represents average population per square mile within a 5-mile ring based on 2018 Claritas estimates. | |||||||||||||||||||||||||||||||||||
(7) Household income and household value data are medians weighted by IPNOI. | |||||||||||||||||||||||||||||||||||
(8) NIC MAP Data and Analysis Service, 2Q18. Net inventory growth is calculated at the MSA level based on historical deletions from inventory and a 5-6 quarter construction period to reflect our urban locations. Total - Top 25 Net Inventory Growth weighted by IPNOI. | |||||||||||||||||||||||||||||||||||
(9) Annual job growth data represents MSA level growth from May 2017-May 2018 per Bureau of Labor Statistics. | |||||||||||||||||||||||||||||||||||
(10) Weighted by IPNOI. | |||||||||||||||||||||||||||||||||||
(11) Reflects net inventory growth for NIC Top 99 Markets. | |||||||||||||||||||||||||||||||||||
10
Portfolio | |
(dollars in thousands at Welltower pro rata ownership) | |||||||||||||||||||||
Seniors Housing Operating(1) | |||||||||||||||||||||
Total Performance | 2Q17 | 3Q17 | 4Q17 | 1Q18 | 2Q18 | ||||||||||||||||
Properties | 466 | 481 | 484 | 496 | 499 | ||||||||||||||||
Beds/Units | 54,391 | 57,103 | 57,303 | 60,007 | 60,811 | ||||||||||||||||
Total occupancy | 87.9 | % | 87.7 | % | 87.3 | % | 86.4 | % | 86.0 | % | |||||||||||
Total revenues | $ | 633,851 | $ | 655,955 | $ | 672,725 | $ | 678,938 | $ | 706,452 | |||||||||||
Operating expenses | $ | 425,229 | $ | 441,185 | $ | 455,629 | $ | 462,817 | $ | 477,299 | |||||||||||
NOI | $ | 208,622 | $ | 214,770 | $ | 217,096 | $ | 216,121 | $ | 229,153 | |||||||||||
NOI margin | 32.9 | % | 32.7 | % | 32.3 | % | 31.8 | % | 32.4 | % | |||||||||||
Recurring cap-ex | $ | 9,028 | $ | 9,051 | $ | 16,793 | $ | 12,199 | $ | 9,775 | |||||||||||
Other cap-ex | $ | 23,574 | $ | 39,010 | $ | 58,719 | $ | 18,323 | $ | 35,624 | |||||||||||
Same Store Performance(2) | 2Q17 | 3Q17 | 4Q17 | 1Q18 | 2Q18 | ||||||||||||||||
Properties | 435 | 435 | 435 | 435 | 435 | ||||||||||||||||
Occupancy | 89.0 | % | 89.0 | % | 88.8 | % | 88.0 | % | 87.9 | % | |||||||||||
Same store revenues | $ | 616,013 | $ | 624,737 | $ | 625,984 | $ | 624,443 | $ | 630,872 | |||||||||||
Compensation | 252,009 | 256,952 | 261,500 | 263,892 | 264,136 | ||||||||||||||||
Utilities | 20,930 | 23,220 | 22,386 | 24,263 | 20,940 | ||||||||||||||||
Food | 22,709 | 22,943 | 23,200 | 22,146 | 22,501 | ||||||||||||||||
Repairs and maintenance | 13,888 | 14,275 | 15,468 | 14,908 | 15,063 | ||||||||||||||||
Property taxes | 19,417 | 18,954 | 17,046 | 19,108 | 18,959 | ||||||||||||||||
All other | 79,756 | 79,132 | 80,778 | 77,623 | 81,672 | ||||||||||||||||
Same store operating expenses | 408,709 | 415,476 | 420,378 | 421,940 | 423,271 | ||||||||||||||||
Same store NOI | $ | 207,304 | $ | 209,261 | $ | 205,606 | $ | 202,503 | $ | 207,601 | |||||||||||
Year over year growth rate | 0.1 | % | |||||||||||||||||||
Partners | Properties | Beds / Units | Welltower Ownership % | Core Markets | 2Q18 NOI | % of Total | ||||||||||||
Sunrise Senior Living | 172 | 14,634 | 97.6 | % | Southern California | $ | 36,251 | 15.8 | % | |||||||||
Revera | 98 | 12,156 | 75.0 | % | Boston | 16,011 | 7.0 | % | ||||||||||
Benchmark Senior Living | 37 | 3,087 | 95.0 | % | Northern California | 15,805 | 6.9 | % | ||||||||||
Senior Resource Group | 24 | 4,496 | 67.1 | % | New York / New Jersey | 13,434 | 5.9 | % | ||||||||||
Belmont Village | 19 | 2,791 | 95.0 | % | Greater London | 12,914 | 5.6 | % | ||||||||||
Silverado Senior Living | 27 | 2,482 | 95.7 | % | Toronto | 10,433 | 4.6 | % | ||||||||||
Chartwell Retirement Residences | 40 | 7,898 | 52.4 | % | Washington D.C. | 9,451 | 4.1 | % | ||||||||||
Sagora Senior Living | 14 | 2,697 | 89.2 | % | Montréal | 7,043 | 3.1 | % | ||||||||||
Merrill Gardens | 11 | 1,454 | 80.0 | % | Seattle | 4,862 | 2.1 | % | ||||||||||
Senior Star Living | 11 | 2,064 | 90.0 | % | Ottawa | 4,575 | 2.0 | % | ||||||||||
Discovery Senior Living | 6 | 1,930 | 53.6 | % | Vancouver | 2,862 | 1.2 | % | ||||||||||
Brookdale Senior Living | 13 | 1,787 | 80.0 | % | Birmingham, UK | 1,067 | 0.5 | % | ||||||||||
Cogir | 6 | 1,466 | 95.0 | % | Manchester, UK | 1,055 | 0.5 | % | ||||||||||
Northbridge | 6 | 506 | 95.0 | % | Core Markets | 135,763 | 59.2 | % | ||||||||||
EPOCH Senior Living | 3 | 230 | 95.0 | % | All Other | 93,390 | 40.8 | % | ||||||||||
Oakmont Senior Living | 2 | 145 | 100.0 | % | Total | $ | 229,153 | 100.0 | % | |||||||||
Kisco | 1 | 176 | 90.0 | % | ||||||||||||||
Avery | 5 | 445 | 87.5 | % | ||||||||||||||
Signature Senior Lifestyle | 4 | 367 | 87.5 | % | ||||||||||||||
Total | 499 | 60,811 | ||||||||||||||||
Notes: | ||||||||||||||||||
(1) Excludes land and properties classified as held for sale. | ||||||||||||||||||
(2) See page 24 for reconciliation. | ||||||||||||||||||
11
Portfolio | |
(dollars in thousands at Welltower pro rata ownership) | ||||||||||||||||||||
Outpatient Medical | ||||||||||||||||||||
Core Performance(1) | 2Q17 | 3Q17 | 4Q17 | 1Q18 | 2Q18 | |||||||||||||||
Properties | 239 | 240 | 246 | 249 | 249 | |||||||||||||||
Square feet | 15,733,848 | 15,775,193 | 16,145,070 | 16,285,804 | 16,286,006 | |||||||||||||||
Occupancy(2) | 94.0 | % | 94.1 | % | 93.8 | % | 94.0 | % | 93.6 | % | ||||||||||
Total revenues | $ | 121,842 | 124,706 | 125,139 | 126,368 | $ | 126,236 | |||||||||||||
Operating expenses | $ | 39,081 | 40,978 | 39,743 | 40,937 | $ | 39,475 | |||||||||||||
NOI | $ | 82,761 | $ | 83,728 | $ | 85,396 | $ | 85,431 | $ | 86,761 | ||||||||||
NOI margin | 67.9 | % | 67.1 | % | 68.2 | % | 67.6 | % | 68.7 | % | ||||||||||
Revenues per square foot(2) | $ | 33.31 | $ | 34.08 | $ | 33.59 | $ | 33.69 | $ | 33.56 | ||||||||||
NOI per square foot(2) | $ | 22.62 | $ | 22.88 | $ | 22.92 | $ | 22.77 | $ | 23.06 | ||||||||||
Recurring cap-ex | $ | 5,344 | $ | 7,831 | $ | 5,272 | $ | 5,759 | $ | 5,878 | ||||||||||
Other cap-ex | $ | 4,120 | $ | 4,432 | $ | 7,097 | $ | 5,239 | $ | 7,165 | ||||||||||
Same Store Performance(1, 3) | 2Q17 | 3Q17 | 4Q17 | 1Q18 | 2Q18 | |||||||||||||||
Properties | 231 | 231 | 231 | 231 | 231 | |||||||||||||||
Occupancy | 94.1 | % | 94.1 | % | 93.7 | % | 93.8 | % | 93.4 | % | ||||||||||
Same store revenues | $ | 117,746 | $ | 119,685 | $ | 118,932 | $ | 119,867 | $ | 118,638 | ||||||||||
Same store operating expenses | 38,108 | 39,710 | 38,339 | 38,895 | 37,406 | |||||||||||||||
Same store NOI | $ | 79,638 | $ | 79,975 | $ | 80,593 | $ | 80,972 | $ | 81,232 | ||||||||||
Year over year growth rate | 2.0 | % | ||||||||||||||||||
Portfolio Diversification by Tenant(2, 4) | Rental Income | % of Total | Quality Indicators(2) | |||||||
Tenet Health | $ | 32,422 | 8.4 | % | Health system affiliated properties as % of NOI | 95.1 | % | |||
Kelsey-Seybold | 21,631 | 5.6 | % | Health system affiliated tenants as % of rental income | 65.5 | % | ||||
Virtua | 15,708 | 4.1 | % | Retention (trailing twelve months) | 76.2 | % | ||||
Florida Medical Clinic | 11,526 | 3.0 | % | In-house managed properties as % of square feet(5) | 99.4 | % | ||||
Texas Health Resources | 11,370 | 3.0 | % | Average remaining lease term | 6.7 | |||||
Remaining Portfolio | 291,971 | 75.9 | % | Average building size (square feet) | 65,406 | |||||
Total | $ | 384,628 | 100.0 | % | Average age (years) | 13 | ||||
Expirations(2) | 2018 | 2019 | 2020 | 2021 | 2022 | Thereafter | ||||||||||||
Occupied square feet | 464,739 | 1,163,533 | 1,341,407 | 1,580,328 | 1,723,388 | 8,567,398 | ||||||||||||
% of occupied square feet | 3.1 | % | 7.8 | % | 9.0 | % | 10.6 | % | 11.6 | % | 57.7 | % | ||||||
Notes: | ||||||||||||||||||
(1) Includes consolidated rental properties, mortgages, unconsolidated properties and development properties, and excludes land parcels and properties sold or classified as held for sale. | ||||||||||||||||||
(2) Results and forecast include month-to-month and holdover leases, consolidated rental properties and unconsolidated properties, and excludes land parcels and properties sold or classified as held for sale. Per square foot amounts are annualized. | ||||||||||||||||||
(3) Includes 231 same store properties representing 15,156,050 square feet. See page 24 for reconciliation. | ||||||||||||||||||
(4) Rental income represents annualized base rent for effective lease agreements. The amounts are derived from the current contracted monthly base rent including straight-line for leases with fixed escalators or annual cash rent for leases with contingent escalators, net of collectability reserves, if applicable. Rental income does not include common area maintenance charges or the amortization of above/below market lease intangibles. Excludes land parcels and all assets held for sale. | ||||||||||||||||||
(5) Includes only multi-tenant properties. | ||||||||||||||||||
12
Portfolio | |
(dollars in thousands at Welltower pro rata ownership) | ||||||||||||||||||||
Development Summary(1) | ||||||||||||||||||||
Unit Mix | ||||||||||||||||||||
Facility | Total | Independent Living | Assisted Living | Memory Care | Long-term/Post-acute Care | Commitment Amount | Balance at 6/30/18 | Estimated Conversion | ||||||||||||
Seniors Housing Triple-Net | ||||||||||||||||||||
Reigate, UK | 87 | — | 63 | 24 | — | $ | 27,677 | $ | 19,875 | 3Q18 | ||||||||||
El Dorado, CA | 80 | — | 57 | 23 | — | 28,000 | 3,637 | 4Q18 | ||||||||||||
Kingswood, UK | 73 | — | 46 | 27 | — | 11,425 | 3,623 | 1Q19 | ||||||||||||
Apex, NC | 152 | 98 | 30 | 24 | — | 30,883 | — | 3Q19 | ||||||||||||
Westerville, OH | 90 | — | 63 | 17 | 10 | 22,800 | 5,647 | 3Q19 | ||||||||||||
StoryPoint, KY | 162 | 162 | — | — | — | 34,600 | 4,210 | 1Q20 | ||||||||||||
Droitwich, UK | 70 | — | 45 | 25 | — | 16,714 | 4,721 | 1Q20 | ||||||||||||
Edenbridge, UK | 85 | — | 51 | 34 | — | 21,011 | 5,071 | 3Q20 | ||||||||||||
Subtotal | 799 | 260 | 355 | 174 | 10 | $ | 193,110 | $ | 46,784 | |||||||||||
Long-Term/Post-Acute Care | ||||||||||||||||||||
Exton, PA | 120 | — | — | — | 120 | $ | 34,175 | $ | 26,710 | 3Q18 | ||||||||||
Seniors Housing Operating | ||||||||||||||||||||
Bushey, UK | 95 | — | 71 | 24 | — | $ | 40,333 | $ | 35,639 | 3Q18 | ||||||||||
Toronto, ON | 332 | 332 | — | — | — | 33,795 | 20,788 | 2Q19 | ||||||||||||
Scarborough, ON | 172 | 141 | — | 31 | — | 24,501 | 2,330 | 4Q19 | ||||||||||||
Shrewsbury, NJ | 81 | — | 52 | 29 | — | 11,696 | 2,426 | 4Q19 | ||||||||||||
Wilton, CT | 90 | — | 59 | 31 | — | 13,974 | 3,725 | 1Q20 | ||||||||||||
New York, NY | 151 | — | 69 | 82 | — | 141,666 | 77,476 | 1Q20 | ||||||||||||
Wandsworth, UK | 98 | — | 78 | 20 | — | 58,347 | 25,877 | 1Q20 | ||||||||||||
Fairfield, CT | 83 | — | 54 | 29 | — | 12,648 | 3,281 | 4Q20 | ||||||||||||
Subtotal | 1,102 | 473 | 383 | 246 | — | $ | 336,960 | $ | 171,542 | |||||||||||
Outpatient Medical | ||||||||||||||||||||
Rentable Square Ft | Preleased % | Health System Affiliation | Commitment Amount | Balance at 6/30/18 | Estimated Conversion | |||||||||||||||
Brooklyn, NY | 140,955 | 100 | % | Yes | $ | 105,177 | $ | 52,438 | 3Q19 | |||||||||||
Mission Viejo, CA | 104,500 | 100 | % | Yes | 71,372 | 14,625 | 3Q19 | |||||||||||||
Subtotal | 245,455 | $ | 176,549 | $ | 67,063 | |||||||||||||||
Total Development Projects | $ | 740,794 | $ | 312,099 | ||||||||||||||||
Notes: | ||||||||||||||||||||
(1) Includes development projects (construction in progress, development loans and in-substance real estate) and excludes expansion projects. Commitment amount represents current balances plus unfunded commitments to complete development. | ||||||||||||||||||||
13
Portfolio | |
(dollars in thousands at Welltower pro rata ownership) | ||||||||||||||||||||||
Development Funding Projections(1) | ||||||||||||||||||||||
Projected Future Funding | ||||||||||||||||||||||
Projects | Beds / Units / Square Feet | Projected Yields(2) | 2018 Funding | Funding Thereafter | Total Unfunded Commitments | Committed Balances | ||||||||||||||||
Seniors housing triple-net | 8 | 799 | 7.5 | % | $ | 67,521 | $ | 78,805 | $ | 146,326 | $ | 193,110 | ||||||||||
Long-term/post-acute care | 1 | 120 | 8.0 | % | 7,465 | — | 7,465 | 34,175 | ||||||||||||||
Seniors housing operating | 8 | 1,102 | 8.1 | % | 36,501 | 128,917 | 165,418 | 336,960 | ||||||||||||||
Outpatient medical | 2 | 245,455 | 6.8 | % | 50,982 | 58,504 | 109,486 | 176,549 | ||||||||||||||
Total | 19 | 8.0 | % | $ | 162,469 | $ | 266,226 | $ | 428,695 | $ | 740,794 | |||||||||||
Development Project Conversion Estimates(1) | ||||||||||||||
Quarterly Conversions | Annual Conversions | |||||||||||||
Amount | Projected Yields(2) | Amount | Projected Yields(2) | |||||||||||
1Q18 actual | $ | 136,762 | 9.3 | % | 2018 estimate | $ | 356,065 | 8.2 | % | |||||
2Q18 actual | 89,118 | 7.0 | % | 2019 estimate | 311,649 | 7.3 | % | |||||||
3Q18 estimate | 102,185 | 8.5 | % | 2020 estimate | 298,960 | 7.9 | % | |||||||
4Q18 estimate | 28,000 | 6.1 | % | Total | $ | 966,674 | 7.8 | % | ||||||
1Q19 estimate | 11,425 | 8.0 | % | |||||||||||
2Q19 estimate | 33,795 | 7.6 | % | |||||||||||
3Q19 estimate | 230,232 | 7.0 | % | |||||||||||
4Q19 estimate | 36,197 | 8.3 | % | |||||||||||
1Q20 estimate | 265,301 | 7.8 | % | |||||||||||
3Q20 estimate | 21,011 | 8.0 | % | |||||||||||
4Q20 estimate | 12,648 | 9.7 | % | |||||||||||
$ | 966,674 | 7.8 | % | |||||||||||
Unstabilized Properties | ||||||||||||||||
3/31/2018 Properties | Stabilizations | Construction Conversions | Acquisitions/ Dispositions | 6/30/2018 Properties | Beds / Units | |||||||||||
Seniors housing triple-net | 27 | (4 | ) | 1 | (1 | ) | 23 | 2,675 | ||||||||
Long-term/post-acute care | 12 | (3 | ) | — | — | 9 | 1,266 | |||||||||
Seniors housing operating | 24 | (4 | ) | — | 1 | 21 | 2,383 | |||||||||
Total | 63 | (11 | ) | 1 | — | 53 | 6,324 | |||||||||
Occupancy | 3/31/2018 Properties | Stabilizations | Construction Conversions | Acquisitions/ Dispositions | Progressions | 6/30/2018 Properties | |||||||||||
0% - 50% | 23 | — | 1 | — | (7 | ) | 17 | ||||||||||
50% - 70% | 20 | (3 | ) | — | — | 4 | 21 | ||||||||||
70% + | 20 | (8 | ) | — | — | 3 | 15 | ||||||||||
Total | 63 | (11 | ) | 1 | — | — | 53 | ||||||||||
Occupancy | 6/30/2018 Properties | Months In Operation | Revenues | % of Total Revenues(3) | Gross Investment Balance | % of Total Gross Investment | |||||||||||
0% - 50% | 17 | 5 | $ | 38,296 | 0.9 | % | $ | 404,362 | 1.3 | % | |||||||
50% - 70% | 21 | 19 | 53,272 | 1.3 | % | 426,177 | 1.4 | % | |||||||||
70% + | 15 | 24 | 50,570 | 1.2 | % | 465,438 | 1.5 | % | |||||||||
Total | 53 | 16 | $ | 142,138 | 3.4 | % | $ | 1,295,977 | 4.2 | % | |||||||
Notes: | |||||||||||||||||
(1) Includes development projects (construction in progress, development loans, and in-substance real estate) and excludes expansion projects. | |||||||||||||||||
(2) Actual yields may vary. | |||||||||||||||||
(3) Includes revenues annualized from amounts presented on page 7. | |||||||||||||||||
14
Financial | |
(dollars in thousands at Welltower pro rata ownership) | ||||||||
Components of NAV | ||||||||
Stabilized NOI | Pro rata beds/units/square feet | |||||||
Seniors housing operating(1) | $ | 907,492 | 47,536 | units | ||||
Seniors housing triple-net | 530,360 | 31,165 | units | |||||
Long-term/post-acute care | 208,868 | 15,690 | beds | |||||
Outpatient medical | 339,900 | 15,041,891 | square feet | |||||
Total in-place NOI(2) | 1,986,620 | |||||||
Incremental stabilized NOI(3) | 29,742 | |||||||
Total stabilized NOI | $ | 2,016,362 | ||||||
Obligations | ||||||||
Lines of credit | $ | 540,000 | ||||||
Senior unsecured notes(4) | 8,461,754 | |||||||
Secured debt(4) | 2,632,937 | |||||||
Capital lease obligations | 71,302 | |||||||
Total Debt | $ | 11,705,993 | ||||||
Add (Subtract): | ||||||||
Other liabilities (assets), net(5) | $ | 400,216 | ||||||
Cash and cash equivalents and restricted cash | (272,383 | ) | ||||||
Preferred stock | 718,498 | |||||||
Net Obligations | $ | 12,552,324 | ||||||
Other Assets | ||||||||
Land parcels | $ | 50,549 | Effective Interest Rate(7) | |||||
Real estate loans receivable(6) | 431,144 | 8.0% | ||||||
Non real estate loans receivable | 286,891 | 8.8% | ||||||
Other investments(8) | 49,734 | |||||||
Investments held for sale(9) | 708,561 | |||||||
Development properties:(10) | ||||||||
Current balance | $ | 315,466 | ||||||
Unfunded commitments | 439,728 | |||||||
Committed balances | $ | 755,194 | ||||||
Projected yield | 8.0 | % | ||||||
Projected NOI | $ | 60,416 | ||||||
Common Shares Outstanding | 372,030 | |||||||
Notes: | ||||||||
(1) Includes $14,271,000 attributable to our proportional share of income from unconsolidated management company investments. | ||||||||
(2) See page 22 for reconciliation. | ||||||||
(3) Represents incremental NOI from seniors housing operating lease-up properties that have been open for less than two years. | ||||||||
(4) Amounts represent principal amounts due and do not include unamortized premiums/discounts, deferred loan expenses or other fair value adjustments as reflected on the balance sheet. Includes $1.3 billion of foreign secured debt. | ||||||||
(5) Includes liabilities / (assets) that impact cash or NOI and excludes non-real estate loans and non-cash items such as follows: | ||||||||
Unearned revenues | $ | 203,121 | ||||||
Below/(above) market lease intangibles, net | 38,697 | |||||||
Deferred taxes, net | (14,185 | ) | ||||||
Available-for-sale equity investments | (21,903 | ) | ||||||
In place lease intangibles, net | (52,048 | ) | ||||||
Other non-cash liabilities / (assets), net | 3,772 | |||||||
Total non-cash liabilities/(assets), net | $ | 157,454 | ||||||
(6) Represents $499,516,000 of real estate loans excluding development loans and net of $68,372,000 of allowance for loan losses. | ||||||||
(7) Average cash-pay interest rates are 8.0% and 6.1% for real estate and non real estate loans, respectively. Rates exclude non-accrual/interest-free loans. | ||||||||
(8) Represents fair value estimate of unconsolidated equity investments including Genesis HealthCare stock and a management company investment not reflected in NOI. | ||||||||
(9) Represents expected proceeds from assets held for sale. | ||||||||
(10) See pages 13-14. Also includes expansion projects. | ||||||||
15
Financial | |
(dollars in thousands at Welltower pro rata ownership) | ||||||||||||||||||||
Net Operating Income(1) | ||||||||||||||||||||
2Q17 | 3Q17 | 4Q17 | 1Q18 | 2Q18 | ||||||||||||||||
Revenues: | ||||||||||||||||||||
Seniors housing triple-net | ||||||||||||||||||||
Rental income | $ | 145,575 | $ | 148,492 | $ | 145,824 | $ | 143,923 | $ | 137,864 | ||||||||||
Interest income | 7,989 | 8,083 | 7,144 | 7,087 | 7,428 | |||||||||||||||
Other income | 2,177 | 1,240 | 936 | 312 | 12,959 | |||||||||||||||
Total revenues | 155,741 | 157,815 | 153,904 | 151,322 | 158,251 | |||||||||||||||
Long-term/post-acute care | ||||||||||||||||||||
Rental income | 74,648 | 74,441 | 74,422 | 63,284 | 61,598 | |||||||||||||||
Interest income | 12,912 | 12,105 | 4,831 | 7,463 | 5,819 | |||||||||||||||
Other income | 365 | 1,948 | (900 | ) | 1,064 | 236 | ||||||||||||||
Total revenues | 87,925 | 88,494 | 78,353 | 71,811 | 67,653 | |||||||||||||||
Seniors housing operating | ||||||||||||||||||||
Resident fees and service | 660,591 | 682,589 | 699,545 | 704,930 | 731,580 | |||||||||||||||
Interest income | — | — | — | 85 | 172 | |||||||||||||||
Other income | 1,030 | 1,432 | 1,118 | 1,143 | 1,554 | |||||||||||||||
Total revenues | 661,621 | 684,021 | 700,663 | 706,158 | 733,306 | |||||||||||||||
Outpatient medical | ||||||||||||||||||||
Rental income | 128,848 | 131,792 | 131,950 | 126,785 | 126,044 | |||||||||||||||
Interest income | — | — | — | 12 | 43 | |||||||||||||||
Other income | 707 | 495 | 461 | 182 | 195 | |||||||||||||||
Total revenues | 129,555 | 132,287 | 132,411 | 126,979 | 126,282 | |||||||||||||||
Corporate and land | ||||||||||||||||||||
Rental income | 54 | 84 | 26 | 86 | 62 | |||||||||||||||
Other income | 150 | 651 | 322 | 307 | 439 | |||||||||||||||
Total revenues | 204 | 735 | 348 | 393 | 501 | |||||||||||||||
Total | ||||||||||||||||||||
Rental income | 349,125 | 354,809 | 352,222 | 334,078 | 325,568 | |||||||||||||||
Resident fees and service | 660,591 | 682,589 | 699,545 | 704,930 | 731,580 | |||||||||||||||
Interest income | 20,901 | 20,188 | 11,975 | 14,647 | 13,462 | |||||||||||||||
Other income | 4,429 | 5,766 | 1,937 | 3,008 | 15,383 | |||||||||||||||
Total revenues | $ | 1,035,046 | $ | 1,063,352 | $ | 1,065,679 | $ | 1,056,663 | $ | 1,085,993 | ||||||||||
Property operating expenses: | ||||||||||||||||||||
Seniors housing triple-net | $ | — | $ | — | $ | — | $ | 17 | $ | 9 | ||||||||||
Long-term/post-acute care | — | — | — | — | 124 | |||||||||||||||
Seniors housing operating | 446,219 | 462,531 | 477,430 | 484,636 | 498,277 | |||||||||||||||
Outpatient medical | 39,388 | 41,347 | 40,057 | 41,010 | 39,533 | |||||||||||||||
Corporate and land | 178 | 95 | 60 | 163 | 126 | |||||||||||||||
Total property operating expenses | $ | 485,785 | $ | 503,973 | $ | 517,547 | $ | 525,826 | $ | 538,069 | ||||||||||
Net operating income: | ||||||||||||||||||||
Seniors housing triple-net | $ | 155,741 | $ | 157,815 | $ | 153,904 | $ | 151,305 | $ | 158,242 | ||||||||||
Long-term/post-acute care | 87,925 | 88,494 | 78,353 | 71,811 | 67,529 | |||||||||||||||
Seniors housing operating | 215,402 | 221,490 | 223,233 | 221,522 | 235,029 | |||||||||||||||
Outpatient medical | 90,167 | 90,940 | 92,354 | 85,969 | 86,749 | |||||||||||||||
Corporate and land | 26 | 640 | 288 | 230 | 375 | |||||||||||||||
Net operating income | $ | 549,261 | $ | 559,379 | $ | 548,132 | $ | 530,837 | $ | 547,924 | ||||||||||
Notes: | ||||||||||||||||||||
(1) Please see discussion of Supplemental Reporting Measures on page 21. Includes amounts from investments sold or held for sale. See pages 11-12 for more information. | ||||||||||||||||||||
16
Financial | |
(dollars in thousands) | ||||||||
Leverage and EBITDA Reconciliations(1) | ||||||||
Twelve Months Ended | Three Months Ended | |||||||
6/30/2018 | 6/30/2018 | |||||||
Net income (loss) | $ | 620,384 | $ | 167,273 | ||||
Interest expense | 493,986 | 121,416 | ||||||
Income tax expense (benefit) | 31,761 | 3,841 | ||||||
Depreciation and amortization | 933,072 | 236,275 | ||||||
EBITDA | $ | 2,079,203 | $ | 528,805 | ||||
Loss (income) from unconsolidated entities | 57,221 | (1,249 | ) | |||||
Stock-based compensation(2) | 26,158 | 5,167 | ||||||
Loss (gain) on extinguishment of debt, net | 12,377 | 299 | ||||||
Impairment of assets | 132,638 | 4,632 | ||||||
Loss (gain) on real estate dispositions, net | (406,942 | ) | (10,755 | ) | ||||
Provision for loan losses | 62,966 | — | ||||||
Loss (gain) on derivatives and financial instruments, net | (14,309 | ) | (7,460 | ) | ||||
Additional other income | (10,805 | ) | (10,805 | ) | ||||
Other expenses(2) | 171,243 | 10,058 | ||||||
Total adjustments | 30,547 | (10,113 | ) | |||||
Adjusted EBITDA | $ | 2,109,750 | $ | 518,692 | ||||
0 | ||||||||
Interest Coverage Ratios | ||||||||
Interest expense | $ | 493,986 | $ | 121,416 | ||||
Capitalized interest | 10,437 | 2,100 | ||||||
Non-cash interest expense | (11,628 | ) | (1,716 | ) | ||||
Total interest | $ | 492,795 | $ | 121,800 | ||||
EBITDA | $ | 2,079,203 | $ | 528,805 | ||||
Interest coverage ratio | 4.22 | x | 4.34 | x | ||||
Adjusted EBITDA | $ | 2,109,750 | $ | 518,692 | ||||
Adjusted Interest coverage ratio | 4.28 | x | 4.26 | x | ||||
0 | ||||||||
Fixed Charge Coverage Ratios | ||||||||
Total interest | $ | 492,795 | $ | 121,800 | ||||
Secured debt principal amortization | 60,258 | 14,139 | ||||||
Preferred dividends | 46,704 | 11,676 | ||||||
Total fixed charges | $ | 599,757 | $ | 147,615 | ||||
EBITDA | $ | 2,079,203 | $ | 528,805 | ||||
Fixed charge coverage ratio | 3.47 | x | 3.58 | x | ||||
Adjusted EBITDA | $ | 2,109,750 | $ | 518,692 | ||||
Adjusted Fixed charge coverage ratio | 3.52 | x | 3.51 | x | ||||
0 | ||||||||
Net Debt to EBITDA Ratios | ||||||||
Total debt | $ | 11,435,559 | ||||||
Less: cash and cash equivalents(3) | (215,120 | ) | ||||||
Net debt | $ | 11,220,439 | ||||||
EBITDA Annualized | 2,115,220 | |||||||
Net debt to EBITDA ratio | 5.30 | x | ||||||
Adjusted EBITDA Annualized | $ | 2,074,768 | ||||||
Net debt to Adjusted EBITDA ratio | 5.41 | x | ||||||
0 | ||||||||
Notes: | ||||||||
(1) Please see discussion of Supplemental Reporting Measures on page 21. | ||||||||
(2) Certain severance-related costs are included in stock-based compensation and excluded from other expenses. | ||||||||
(3) Includes IRC Section 1031 deposits, if any. | ||||||||
17
Financial | |
(amounts in thousands except share price) | |||||||
Leverage and Current Capitalization | |||||||
% of Total | |||||||
Book Capitalization | |||||||
Lines of credit | $ | 540,000 | 2.0 | % | |||
Long-term debt obligations(1) | 10,895,559 | 41.3 | % | ||||
Cash and cash equivalents(2) | (215,120 | ) | (0.8 | )% | |||
Net debt to consolidated book capitalization | 11,220,439 | 42.5 | % | ||||
Total equity(3) | 15,198,644 | 57.5 | % | ||||
Consolidated book capitalization | $ | 26,419,083 | 100.0 | % | |||
Joint venture debt, net(4) | 170,859 | ||||||
Total book capitalization | $ | 26,589,942 | |||||
Undepreciated Book Capitalization | |||||||
Lines of credit | $ | 540,000 | 1.7 | % | |||
Long-term debt obligations(1) | 10,895,559 | 34.6 | % | ||||
Cash and cash equivalents(2) | (215,120 | ) | (0.7 | )% | |||
Net debt to consolidated undepreciated book capitalization | $ | 11,220,439 | 35.6 | % | |||
Accumulated depreciation and amortization | 5,113,928 | 16.2 | % | ||||
Total equity(3) | 15,198,644 | 48.2 | % | ||||
Consolidated undepreciated book capitalization | $ | 31,533,011 | 100.0 | % | |||
Joint venture debt, net(4) | 170,859 | ||||||
Total undepreciated book capitalization | $ | 31,703,870 | |||||
Enterprise Value | |||||||
Lines of credit | $ | 540,000 | 1.5 | % | |||
Long-term debt obligations(1) | 10,895,559 | 30.2 | % | ||||
Cash and cash equivalents(2) | (215,120 | ) | (0.6 | )% | |||
Net debt to consolidated enterprise value | $ | 11,220,439 | 31.1 | % | |||
Common shares outstanding | 372,030 | ||||||
Period end share price | 62.69 | ||||||
Common equity market capitalization | $ | 23,322,561 | 64.5 | % | |||
Noncontrolling interests(3) | 856,721 | 2.4 | % | ||||
Preferred stock | 718,498 | 2.0 | % | ||||
Consolidated enterprise value | $ | 36,118,219 | 100.0 | % | |||
Joint venture debt, net(4) | 170,859 | ||||||
Total enterprise value | $ | 36,289,078 | |||||
Secured Debt as % of Total Assets | |||||||
Secured debt(1) | $ | 2,450,483 | 8.9 | % | |||
Total assets | $ | 27,618,982 | |||||
Total Debt as % of Total Assets | |||||||
Total debt(1) | $ | 11,435,559 | 41.4 | % | |||
Total assets | $ | 27,618,982 | |||||
Unsecured Debt as % of Unencumbered Assets | |||||||
Unsecured debt(1) | $ | 8,913,774 | 34.4 | % | |||
Unencumbered assets | $ | 25,916,082 | |||||
Notes: | |||||||
(1) Amounts include unamortized premiums/discounts and other fair value adjustments as reflected on our balance sheet. | |||||||
(2) Inclusive of IRC Section 1031 deposits, if any. | |||||||
(3) Includes all noncontrolling interests (redeemable and permanent) as reflected on our balance sheet. | |||||||
(4) Net of Welltower's share of unconsolidated debt and minority partners' share of Welltower consolidated debt. | |||||||
18
Financial | |
(dollars in thousands) | |||||||||||||||||||||||||||||
Debt Maturities and Principal Payments(1) | |||||||||||||||||||||||||||||
Year | Lines of Credit(2) | Senior Unsecured Notes(3,4,5) | Consolidated Secured Debt | Share of Unconsolidated Secured Debt | Noncontrolling Interests' Share of Consolidated Secured Debt | Combined Debt(6) | % of Total | Wtd. Avg. Interest Rate | |||||||||||||||||||||
2018 | $ | — | $ | — | $ | 197,438 | $ | 20,084 | $ | (20,798 | ) | $ | 196,724 | 1.7 | % | 4.2 | % | ||||||||||||
2019 | — | 600,000 | 476,109 | 56,712 | (87,144 | ) | 1,045,677 | 9.0 | % | 4.1 | % | ||||||||||||||||||
2020 | — | 685,810 | 138,533 | 54,240 | (32,691 | ) | 845,892 | 7.3 | % | 5.0 | % | ||||||||||||||||||
2021 | 540,000 | 1,140,259 | 340,621 | 25,378 | (116,073 | ) | 1,930,185 | 16.6 | % | 3.0 | % | ||||||||||||||||||
2022 | — | 600,000 | 224,330 | 12,652 | (30,579 | ) | 806,403 | 6.9 | % | 4.9 | % | ||||||||||||||||||
2023 | — | 500,000 | 290,628 | 18,812 | (104,272 | ) | 705,168 | 6.1 | % | 4.0 | % | ||||||||||||||||||
2024 | — | 400,000 | 287,602 | 36,095 | (81,237 | ) | 642,460 | 5.5 | % | 4.4 | % | ||||||||||||||||||
2025 | — | 1,250,000 | 126,540 | 371,744 | (31,178 | ) | 1,717,106 | 14.8 | % | 3.9 | % | ||||||||||||||||||
2026 | — | 700,000 | 38,853 | 15,717 | (9,233 | ) | 745,337 | 6.4 | % | 4.2 | % | ||||||||||||||||||
2027 | — | — | 136,189 | 60,171 | (34,623 | ) | 161,737 | 1.4 | % | 3.6 | % | ||||||||||||||||||
Thereafter | — | 2,585,685 | 205,235 | 78,390 | (31,308 | ) | 2,838,002 | 24.3 | % | 4.8 | % | ||||||||||||||||||
Totals | $ | 540,000 | $ | 8,461,754 | $ | 2,462,078 | $ | 749,995 | $ | (579,136 | ) | $ | 11,634,691 | 100.0 | % | ||||||||||||||
Weighted Avg Interest Rate(7) | 3.0 | % | 4.5 | % | 3.8 | % | 3.8 | % | 3.6 | % | 4.2 | % | |||||||||||||||||
Weighted Avg Maturity Years | 2.9 | 7.7 | 5.5 | 9.0 | 5.4 | 7.2 | |||||||||||||||||||||||
% Floating Rate Debt | 100.0 | % | 8.2 | % | 34.8 | % | 13.5 | % | 54.3 | % | 16.2 | % | |||||||||||||||||
Debt by Local Currency(1) | |||||||||||||||||||||||||||||
Lines of Credit | Senior Unsecured Notes | Consolidated Secured Debt | Share of Unconsolidated Secured Debt | Noncontrolling Interests' Share of Consolidated Secured Debt | Combined Debt | Investment Hedges(8) | |||||||||||||||||||||||
United States | $ | 540,000 | $ | 6,657,500 | $ | 1,138,999 | $ | 547,861 | $ | (278,357 | ) | $ | 8,606,003 | $ | — | ||||||||||||||
United Kingdom | — | 1,385,685 | 177,737 | — | (44,434 | ) | 1,518,988 | 1,176,698 | |||||||||||||||||||||
Canada | — | 418,569 | 1,145,342 | 202,134 | (256,345 | ) | 1,509,700 | 437,595 | |||||||||||||||||||||
Totals | $ | 540,000 | $ | 8,461,754 | $ | 2,462,078 | $ | 749,995 | $ | (579,136 | ) | $ | 11,634,691 | $ | 1,614,293 | ||||||||||||||
Notes:
(1) Represents principal amounts due excluding unamortized premiums/discounts or other fair value adjustments as reflected on the balance sheet.
(2) The primary unsecured credit facility has capacity of $3.7 billion with remaining availability of $2.4 billion. As of June 30, 2018, letters of credit in the aggregate amount of $22 million have been issued which reduces the available borrowing capacity. The unsecured revolving credit facility matures on May 13, 2020 (with an option to extend for two successive terms of six months each at our discretion) and the term credit facilities mature on May 13, 2021.
(3) 2021 amounts include a $500 million term loan and a CAD$250 million unsecured term loan (approximately $190 million USD at June 30, 2018). The loans mature on May 13, 2021. The interest rates on the loans are LIBOR + 95 bps for USD and CDOR + 95 bps for CAD.
(4) 2020 amounts include CAD$300 million of 3.35% senior unsecured notes (approximately $228 million USD at June 30, 2018). The notes mature on November 25, 2020.
(5) Thereafter includes £550 million of 4.8% senior unsecured notes (approximately $726 million USD at June 30, 2018). The notes mature on November 20, 2028. Also included is £500 million of 4.5% senior unsecured notes (approximately $660 million USD at June 30, 2018). The notes mature on December 1, 2034.
(6) Excludes capital lease obligations of $71.3 million, of which $69.3 million mature in April 2023 and $2 million have various maturities.
(7) The interest rate on the primary unsecured credit facility is 1-month LIBOR + 90 bps. Senior notes and secured debt average interest rate represents the face value note rate.
(8) Represents notional value of foreign currency derivative contracts at end of period spot FX rates. The fair market value of the gains (losses) of these contracts is currently USD $51.4 million, as represented in other assets (liabilities) on the balance sheet. We supplement our local currency debt with foreign currency derivative contracts to offset the translation and economic exposures related to our international investments. Currently, our foreign currency derivatives are comprised of forward contracts and cross-currency swaps.
19
Glossary | |
Age: Current year, less the year built, adjusted for major renovations. Average age is weighted by pro rata NOI.
Cap-ex, Tenant Improvements, Leasing Commissions: Represents amounts paid in cash for: 1) recurring and non-recurring capital expenditures required to maintain and re-tenant our properties, 2) second generation tenant improvements and 3) leasing commissions paid to third party leasing agents to secure new tenants.
Construction Conversion: Represents completed construction projects that were placed into service and began generating NOI.
EBITDAR: Earnings before interest, taxes, depreciation, amortization and rent. The company uses unaudited, periodic financial information provided solely by tenants/borrowers to calculate EBITDAR and has not independently verified the information.
EBITDAR Coverage: Represents the ratio of EBITDAR to contractual rent for leases or interest and principal payments for loans. EBITDAR coverage is a measure of a property’s ability to generate sufficient cash flows for the operator/borrower to pay rent and meet other obligations. The coverage shown excludes properties that are unstabilized, closed or for which data is not available or meaningful.
EBITDARM: Earnings before interest, taxes, depreciation, amortization, rent and management fees. The company uses unaudited, periodic financial information provided solely by tenants/borrowers to calculate EBITDARM and has not independently verified the information.
EBITDARM Coverage: Represents the ratio of EBITDARM to contractual rent for leases or interest and principal payments for loans. EBITDARM coverage is a measure of a property’s ability to generate sufficient cash flows for the operator/borrower to pay rent and meet other obligations, assuming that management fees are not paid. The coverage shown excludes properties that are unstabilized, closed or for which data is not available or meaningful.
Health System-Affiliated: Properties are considered affiliated with a health system if one or more of the following conditions are met: 1) the land parcel is contained within the physical boundaries of a hospital campus; 2) the land parcel is located adjacent to the campus; 3) the building is physically connected to the hospital regardless of the land ownership structure; 4) a ground lease is maintained with a health system entity; 5) a master lease is maintained with a health system entity; 6) significant square footage is leased to a health system entity; 7) the property includes an ambulatory surgery center with a hospital partnership interest; or (8) a significant square footage is leased to a physician group that is either employed, directly or indirectly by a health system, or has a significant clinical and financial affiliation with the health system.
Long-Term/Post-Acute Care: Includes all skilled nursing, rehabilitation and long-term acute-care facilities where the majority of individuals require 24-hour nursing or medical care. Generally, these properties are licensed for Medicaid and/or Medicare reimbursement and are subject to triple-net operating leases. Most of these facilities focus on higher acuity patients and offer rehabilitation units specializing in cardiac, orthopedic, dialysis, neurological or pulmonary rehabilitation.
MSA: For the United States and Canada, we use the Metropolitan Statistical Area as defined by the U.S. Census Bureau and the Census Metropolitan Areas as defined by Statistics Canada, respectively. For the United Kingdom, we generally use the Metro Region as defined by EuroStat with Greater London defined as a 55-mile radius around the city’s center.
Occupancy: Outpatient medical occupancy represents the percentage of total rentable square feet leased and occupied, including month-to-month leases, as of the date reported. Occupancy for all other property types represents average quarterly operating occupancy based on the most recent quarter of available data and excludes properties that are unstabilized, closed or for which data is not available or meaningful. The company uses unaudited, periodic financial information provided solely by tenants/borrowers to calculate occupancy and has not independently verified the information.
Outpatient Medical: Outpatient medical buildings include properties offering ambulatory medical services such as primary and secondary care, outpatient surgery, diagnostic procedures and rehabilitation. These properties are typically affiliated with a health system and may be located on a hospital campus. They are specifically designed and constructed for use by health care professionals to provide services to patients. They also include medical office buildings that typically contain sole and group physician practices and may provide laboratory and other specialty services.
Quality Mix: Non-Medicaid revenue as a percentage of total revenue at a facility.
Renewal Rate: The ratio of total renewed square feet to total square feet expiring and available for lease.
Renewed Square Feet: Square feet expiring during the reporting period upon which a lease is executed by the current occupant.
Seniors Housing Operating: Includes independent, assisted living, and dementia care properties in the U.S. and Canada and all care homes in the U.K. structured to take advantage of the REIT Investment Diversification and Empowerment Act of 2007.
Seniors Housing Triple-net: Includes independent, assisted living, and dementia care properties in the U.S. and Canada and all care homes in the U.K. subject to triple-net operating leases and loans receivable.
Square Feet: Net rentable square feet calculated utilizing Building Owners and Managers Association measurement standards.
Stable: Generally, a triple-net rental property is considered stable (versus unstabilized or under development) when it has achieved EBITDAR coverage of 1.00x or greater for three consecutive months or, if targeted performance has not been achieved, 12 months following the budgeted stabilization date. A seniors housing operating facility is considered stable upon the earliest of 90% occupancy, NOI at or above the underwritten target or 24 months past the closing date (for acquisitions) or the open date (for development). Excludes assets held for sale and assets disposed of during the current quarter.
Unstabilized: An acquisition that does not meet the stable criteria upon closing or a construction property that has opened but not yet reached stabilization.
20
Supplemental Reporting Measures | |
The company believes that revenues and net income, as defined by U.S. generally accepted accounting principles (U.S. GAAP), are the most appropriate earnings measurements. However, the company considers EBITDA, A-EBITDA, REVPOR, SS REVPOR, NOI, In-Place NOI (IPNOI) and SSNOI to be useful supplemental measures of its operating performance. Excluding EBITDA and A-EBITDA, these supplemental measures are disclosed on a Welltower pro rata ownership basis. Pro rata amounts are derived by reducing consolidated amounts for minority partners’ noncontrolling ownership interests and adding Welltower’s minority ownership share of unconsolidated amounts. Welltower does not control unconsolidated investments. While the company considers pro rata disclosures useful, they may not accurately depict the legal and economic implications of Welltower’s joint venture arrangements and should be used with caution.
The company defines NOI as total revenues, including tenant reimbursements, less property operating expenses. Property operating expenses represent costs associated with managing, maintaining and servicing tenants for our seniors housing operating and outpatient medical properties. These expenses include, but are not limited to, property-related payroll and benefits, property management fees paid to operators, marketing, housekeeping, food service, maintenance, utilities, property taxes and insurance. General and administrative expenses represent costs unrelated to property operations. These expenses include, but are not limited to, payroll and benefits, professional services, office expenses and depreciation of corporate fixed assets. IPNOI represents NOI excluding interest income, other income and non-IPNOI and adjusted for timing of current quarter portfolio changes such as acquisitions, development conversions, segment transitions, dispositions and investments held for sale. SSNOI is used to evaluate the operating performance of our properties under a consistent population which eliminates changes in the composition of our portfolio. As used herein, same store is generally defined as those revenue-generating properties in the portfolio for the relevant year-over-year reporting periods. Land parcels, loans, and sub-leases as well as any properties acquired, developed/redeveloped (including major refurbishments where 20% or more of units are simultaneously taken out of commission for 30 days or more), sold or classified as held for sale during that period are excluded from the same store amounts. Properties undergoing operator transitions and/or segment transitions (except triple-net to seniors housing operating with the same operator) are also excluded from the same store amounts. Normalizers include adjustments that in management’s opinion are appropriate in considering SSNOI, a supplemental, non-GAAP performance measure. None of these adjustments, which may increase or decrease SSNOI, are reflected in the company’s financial statements prepared in accordance with U.S. GAAP. Significant normalizers (defined as any that individually exceed 0.50% of SSNOI growth per property type) are separately disclosed and explained. The company believes NOI, IPNOI and SSNOI provide investors relevant and useful information because they measure the operating performance of the company’s properties at the property level on an unleveraged basis. The company uses NOI, IPNOI and SSNOI to make decisions about resource allocations and to assess the property level performance of our properties.
REVPOR represents the average revenues generated per occupied room per month at the company’s seniors housing operating properties. It is calculated as our pro rata version of total resident fees and services revenues from the income statement divided by average monthly occupied room days. SS REVPOR is used to evaluate the REVPOR performance of our properties under a consistent population which eliminates changes in the composition of our portfolio. It is based on the same pool of properties used for SSNOI and includes any revenue normalizations used for SSNOI. The company uses REVPOR and SS REVPOR to evaluate the revenue-generating capacity and profit potential of its seniors housing operating portfolio independent of fluctuating occupancy rates. They are also used in comparison against industry and competitor statistics, if known, to evaluate the quality of the company’s seniors housing operating portfolio.
We measure our credit strength both in terms of leverage ratios and coverage ratios. The leverage ratios indicate how much of our balance sheet capitalization is related to long-term debt, net of cash and Internal Revenue Code (“IRC”) Section 1031 deposits. We expect to maintain capitalization ratios and coverage ratios sufficient to maintain a capital structure consistent with our current profile. The coverage ratios are based on EBITDA which stands for earnings (net income per income statement) before interest expense, income taxes, depreciation and amortization. Covenants in our senior unsecured notes contain financial ratios based on a definition of EBITDA that is specific to those agreements. Failure to satisfy these covenants could result in an event of default that could have a material adverse impact on our cost and availability of capital, which could in turn have a material adverse impact on our consolidated results of operations, liquidity and/or financial condition. Due to the materiality of these debt agreements and the financial covenants, we have defined A-EBITDA to exclude unconsolidated entities and to include adjustments for stock-based compensation expense, provision for loan losses, gains/losses on extinguishment of debt, gains/losses/impairments on properties, gains/losses on derivatives and financial instruments, and other expenses. We believe that EBITDA and A-EBITDA, along with net income and cash flow provided from operating activities, are important supplemental measures because they provide additional information to assess and evaluate the performance of our operations. We primarily utilize them to measure our interest coverage ratio, which represents EBITDA and A-EBITDA divided by total interest, and our fixed charge coverage ratio, which represents EBITDA and A-EBITDA divided by fixed charges. Fixed charges include total interest, secured debt principal amortization and preferred dividends. Our leverage ratios include net debt to A-EBITDA, book capitalization, undepreciated book capitalization and market capitalization. Book capitalization represents the sum of net debt (defined as total long-term debt less cash and cash equivalents and any IRC Section 1031 deposits), total equity and redeemable noncontrolling interests. Undepreciated book capitalization represents book capitalization adjusted for accumulated depreciation and amortization. Market capitalization represents book capitalization adjusted for the fair market value of our common stock. Our leverage ratios are defined as the proportion of net debt to total capitalization.
The company’s supplemental reporting measures and similarly entitled financial measures are widely used by investors, equity and debt analysts and rating agencies in the valuation, comparison, rating and investment recommendations of companies. The company’s management uses these financial measures to facilitate internal and external comparisons to historical operating results and in making operating decisions. Additionally, these measures are utilized by the Board of Directors to evaluate management. None of the supplemental reporting measures represent net income or cash flow provided from operating activities as determined in accordance with U.S. GAAP and should not be considered as alternative measures of profitability or liquidity.
Finally, the supplemental reporting measures, as defined by the company, may not be comparable to similarly entitled items reported by other real estate investment trusts or other companies. Multi-period amounts may not equal the sum of the individual quarterly amounts due to rounding.
21
Supplemental Reporting Measures | |
(dollars in thousands) | |||||||||||||||||||||||
Non-GAAP Reconciliations | |||||||||||||||||||||||
NOI Reconciliation | 2Q17 | 3Q17 | 4Q17 | 1Q18 | 2Q18 | ||||||||||||||||||
Net income (loss) | $ | 203,441 | $ | 89,299 | $ | (89,743 | ) | $ | 453,555 | $ | 167,273 | ||||||||||||
Loss (gain) on real estate dispositions, net | (42,155 | ) | (1,622 | ) | (56,381 | ) | (338,184 | ) | (10,755 | ) | |||||||||||||
Loss (income) from unconsolidated entities | 3,978 | (3,408 | ) | 59,449 | 2,429 | (1,249 | ) | ||||||||||||||||
Income tax expense (benefit) | (8,448 | ) | 669 | 25,663 | 1,588 | 3,841 | |||||||||||||||||
Other expenses | 6,339 | 99,595 | 60,167 | 3,712 | 10,058 | ||||||||||||||||||
Impairment of assets | 13,631 | — | 99,821 | 28,185 | 4,632 | ||||||||||||||||||
Provision for loan losses | — | — | 62,966 | — | — | ||||||||||||||||||
Loss (gain) on extinguishment of debt, net | 5,515 | — | 371 | 11,707 | 299 | ||||||||||||||||||
Loss (gain) on derivatives and financial instruments, net | 736 | 324 | — | (7,173 | ) | (7,460 | ) | ||||||||||||||||
General and administrative expenses | 32,632 | 29,913 | 28,365 | 33,705 | 32,831 | ||||||||||||||||||
Depreciation and amortization | 224,847 | 230,138 | 238,458 | 228,201 | 236,275 | ||||||||||||||||||
Interest expense | 116,231 | 122,578 | 127,217 | 122,775 | 121,416 | ||||||||||||||||||
Consolidated net operating income | $ | 556,747 | $ | 567,486 | $ | 556,353 | $ | 540,500 | $ | 557,161 | |||||||||||||
NOI attributable to unconsolidated investments(1) | 21,873 | 22,431 | 21,539 | 21,620 | 21,725 | ||||||||||||||||||
NOI attributable to noncontrolling interests(2) | (29,359 | ) | (30,538 | ) | (29,760 | ) | (31,283 | ) | (30,962 | ) | |||||||||||||
Pro rata net operating income (NOI)(3) | $ | 549,261 | $ | 559,379 | $ | 548,132 | $ | 530,837 | $ | 547,924 | |||||||||||||
In-Place NOI Reconciliation | ||||||||||||||||||||||||
At Welltower pro rata ownership | Seniors Housing Triple-net | Long-Term /Post-Acute Care | Seniors Housing Operating | Outpatient Medical | Corporate & Land | Total | ||||||||||||||||||
Revenues | $ | 158,251 | $ | 67,653 | $ | 733,306 | $ | 126,282 | $ | 501 | $ | 1,085,993 | ||||||||||||
Property operating expenses | (9 | ) | (124 | ) | (498,277 | ) | (39,533 | ) | (126 | ) | (538,069 | ) | ||||||||||||
NOI(3) | 158,242 | 67,529 | 235,029 | 86,749 | 375 | 547,924 | ||||||||||||||||||
Adjust: | ||||||||||||||||||||||||
Interest income | (7,428 | ) | (5,819 | ) | (172 | ) | (43 | ) | — | (13,462 | ) | |||||||||||||
Other income | (12,959 | ) | (236 | ) | (1,554 | ) | (195 | ) | (439 | ) | (15,383 | ) | ||||||||||||
Sold / held for sale | (3,001 | ) | (5,160 | ) | (5,702 | ) | 12 | — | (13,851 | ) | ||||||||||||||
Developments / land | — | (7 | ) | 205 | — | 64 | 262 | |||||||||||||||||
Non In-Place NOI(4) | (2,054 | ) | (4,090 | ) | (2,221 | ) | (2,037 | ) | — | (10,402 | ) | |||||||||||||
Timing adjustments(5) | (210 | ) | — | 1,288 | 489 | — | 1,567 | |||||||||||||||||
Total adjustments | (25,652 | ) | (15,312 | ) | (8,156 | ) | (1,774 | ) | (375 | ) | (51,269 | ) | ||||||||||||
In-Place NOI | 132,590 | 52,217 | 226,873 | 84,975 | — | 496,655 | ||||||||||||||||||
Annualized In-Place NOI | $ | 530,360 | $ | 208,868 | $ | 907,492 | $ | 339,900 | $ | — | $ | 1,986,620 | ||||||||||||
Notes: | ||||||||||||||||||||||||
(1) Represents Welltower's interests in joint ventures where Welltower is the minority partner. | ||||||||||||||||||||||||
(2) Represents minority partners' interests in joint ventures where Welltower is the majority partner. | ||||||||||||||||||||||||
(3) Represents Welltower's pro rata share of NOI. See page 16 for more information. | ||||||||||||||||||||||||
(4) Primarily represents non-cash NOI. | ||||||||||||||||||||||||
(5) Represents timing adjustments for current quarter acquisitions, construction conversions and segment transitions. Excludes recently announced Brookdale transaction. | ||||||||||||||||||||||||
22
Supplemental Reporting Measures | |
(dollars in thousands, except REVPOR and SSNOI/unit) | ||||||||||||||||
SHO REVPOR Reconciliation | United States | United Kingdom | Canada | Total | ||||||||||||
Consolidated SHO revenues(1) | $ | 568,965 | $ | 80,621 | $ | 115,581 | $ | 765,167 | ||||||||
Unconsolidated SHO revenues attributable to Welltower(2) | 22,585 | — | 20,123 | 42,708 | ||||||||||||
SHO revenues attributable to noncontrolling interests(3) | (42,481 | ) | (6,281 | ) | (25,807 | ) | (74,569 | ) | ||||||||
Pro rata SHO revenues(4) | 549,069 | 74,340 | 109,897 | 733,306 | ||||||||||||
SHO interest and other income | (1,396 | ) | (30 | ) | (300 | ) | (1,726 | ) | ||||||||
SHO revenues attributable to held for sale properties | (25,509 | ) | (1,172 | ) | — | (26,681 | ) | |||||||||
Adjustment for standardized currency rate(5) | — | (563 | ) | 3,573 | 3,010 | |||||||||||
SHO local revenues | 522,164 | 72,575 | 113,170 | 707,909 | ||||||||||||
Average occupied units/month | 24,407 | 2,780 | 13,128 | 40,315 | ||||||||||||
REVPOR/month in USD | $ | 7,151 | $ | 8,725 | $ | 2,881 | $ | 5,869 | ||||||||
REVPOR/month in local currency(5) | £ | 6,463 | C$ | 3,602 | ||||||||||||
Reconciliations of SHO SS REVPOR Growth, SSNOI Growth and SSNOI/Unit | |||||||||||||||||||||||||||||||
United States | United Kingdom | Canada | Total | ||||||||||||||||||||||||||||
2Q17 | 2Q18 | 2Q17 | 2Q18 | 2Q17 | 2Q18 | 2Q17 | 2Q18 | ||||||||||||||||||||||||
SHO SS REVPOR Growth | |||||||||||||||||||||||||||||||
Consolidated SHO revenues(1) | $ | 503,984 | $ | 568,965 | $ | 70,042 | $ | 80,621 | $ | 104,063 | $ | 115,581 | $ | 678,089 | $ | 765,167 | |||||||||||||||
Unconsolidated SHO revenues attributable to WELL(2) | 22,397 | 22,585 | — | — | 19,338 | 20,123 | 41,735 | 42,708 | |||||||||||||||||||||||
SHO revenues attributable to noncontrolling interests(3) | (29,552 | ) | (42,481 | ) | (4,107 | ) | (6,281 | ) | (24,544 | ) | (25,807 | ) | (58,203 | ) | (74,569 | ) | |||||||||||||||
SHO pro rata revenues(4) | 496,829 | 549,069 | 65,935 | 74,340 | 98,857 | 109,897 | 661,621 | 733,306 | |||||||||||||||||||||||
Non-cash revenues on same store properties | (119 | ) | (110 | ) | (19 | ) | (22 | ) | — | — | (138 | ) | (132 | ) | |||||||||||||||||
Revenues attributable to non-same store properties | (52,003 | ) | (75,718 | ) | (16,192 | ) | (19,369 | ) | (2,561 | ) | (9,343 | ) | (70,756 | ) | (104,430 | ) | |||||||||||||||
Currency and ownership adjustments(5) | 4,532 | — | 2,765 | (436 | ) | 7,301 | 3,278 | 14,598 | 2,842 | ||||||||||||||||||||||
SH-NNN to SHO conversions (6) | 11,834 | — | — | — | — | — | 11,834 | — | |||||||||||||||||||||||
Other normalizing adjustments(7) | — | — | (1,146 | ) | (716 | ) | — | — | (1,146 | ) | (716 | ) | |||||||||||||||||||
SHO SS revenues(8) | 461,073 | 473,241 | 51,343 | 53,797 | 103,597 | 103,832 | 616,013 | 630,870 | |||||||||||||||||||||||
Avg. occupied units/month(9) | 22,069 | 21,884 | 2,066 | 2,104 | 11,893 | 11,668 | 36,028 | 35,656 | |||||||||||||||||||||||
SHO SS REVPOR(10) | $ | 6,983 | $ | 7,228 | $ | 8,307 | $ | 8,546 | $ | 2,912 | $ | 2,974 | $ | 5,715 | $ | 5,914 | |||||||||||||||
SS REVPOR YOY growth | — | % | 3.5 | % | — | % | 2.9 | % | — | % | 2.1 | % | — | 3.5 | % | ||||||||||||||||
SHO SSNOI Growth | |||||||||||||||||||||||||||||||
Consolidated SHO NOI(1) | $ | 159,148 | $ | 175,125 | $ | 20,174 | $ | 20,295 | $ | 39,656 | $ | 44,085 | $ | 218,978 | $ | 239,505 | |||||||||||||||
Unconsolidated SHO NOI attributable to WELL(2) | 9,006 | 8,245 | — | — | 7,396 | 7,996 | 16,402 | 16,241 | |||||||||||||||||||||||
SHO NOI attributable to noncontrolling interests(3) | (10,208 | ) | (9,950 | ) | (236 | ) | (923 | ) | (9,534 | ) | (9,844 | ) | (19,978 | ) | (20,717 | ) | |||||||||||||||
SHO pro rata NOI(4) | 157,946 | 173,420 | 19,938 | 19,372 | 37,518 | 42,237 | 215,402 | 235,029 | |||||||||||||||||||||||
Non-cash NOI on same store properties | 503 | (587 | ) | (19 | ) | (22 | ) | — | 1 | 484 | (608 | ) | |||||||||||||||||||
NOI attributable to non-same store properties | (14,395 | ) | (21,350 | ) | (3,945 | ) | (3,050 | ) | (768 | ) | (3,655 | ) | (19,108 | ) | (28,055 | ) | |||||||||||||||
Currency and ownership adjustments(5) | 1,279 | — | 887 | (116 | ) | 2,788 | 1,261 | 4,954 | 1,145 | ||||||||||||||||||||||
SH-NNN to SHO conversions(6) | 6,902 | — | — | — | — | — | 6,902 | — | |||||||||||||||||||||||
Other normalizing adjustments(7) | (184 | ) | 510 | (1,146 | ) | (420 | ) | — | — | (1,330 | ) | 90 | |||||||||||||||||||
SHO pro rata SSNOI(8) | $ | 152,051 | $ | 151,993 | $ | 15,715 | $ | 15,764 | $ | 39,538 | $ | 39,844 | $ | 207,304 | $ | 207,601 | |||||||||||||||
SHO SSNOI growth | 0.0 | % | 0.3 | % | 0.8 | % | 0.1 | % | |||||||||||||||||||||||
SHO SSNOI/Unit | |||||||||||||||||||||||||||||||
Trailing four quarters' SSNOI(4) | $ | 600,229 | $ | 64,227 | $ | 160,515 | $ | 824,971 | |||||||||||||||||||||||
Average units in service(11) | 25,300 | 2,515 | 13,072 | 40,887 | |||||||||||||||||||||||||||
SSNOI/unit in USD | $ | 23,724 | $ | 25,538 | $ | 12,279 | $ | 20,177 | |||||||||||||||||||||||
SSNOI/unit in local currency(5) | £ | 18,917 | C$ | 15,349 | |||||||||||||||||||||||||||
Notes: | |||||||||||||||||||||||||||||||
(1) Represents consolidated revenues or consolidated NOI per Note 17 to Welltower's Form 10-Q for the quarter ended June 30, 2018. | |||||||||||||||||||||||||||||||
(2) Represents Welltower's interests in joint ventures where Welltower is the minority partner. | |||||||||||||||||||||||||||||||
(3) Represents minority partners' interests in joint ventures where Welltower is the majority partner. | |||||||||||||||||||||||||||||||
(4) Represents SHO revenues/NOI/SSNOI at Welltower pro rata ownership. See pages 16 & 24 for more information. | |||||||||||||||||||||||||||||||
(5) Includes where appropriate adjustments to reflect consistent property ownership percentages, to translate Canadian properties at a USD/CAD rate of 1.25 and to translate UK properties at a GBP/USD rate of 1.35. | |||||||||||||||||||||||||||||||
(6) Represents the revenues and NOI of certain properties that were converted from SH-NNN to SHO with the same operator. Amounts derived from unaudited operating results provided by the operator and were not a component of WELL earnings. | |||||||||||||||||||||||||||||||
(7) Represents aggregate normalizing adjustments which are individually less than .50% of SSNOI growth. | |||||||||||||||||||||||||||||||
(8) Represents SS SHO revenues/NOI at Welltower pro rata ownership. | |||||||||||||||||||||||||||||||
(9) Represents average occupied units for SS properties related solely to referenced country on a pro rata basis. | |||||||||||||||||||||||||||||||
(10) Represents pro rata SS average revenues generated per occupied room per month. | |||||||||||||||||||||||||||||||
(11) Represents average units in service for SS properties related solely to referenced country on a pro rata basis. | |||||||||||||||||||||||||||||||
23
Supplemental Reporting Measures | |
(dollars in thousands at Welltower pro rata ownership) | ||||||||||||||||||||||
Same Store Property Reconciliation | SH-NNN | LT/PAC | SHO | OM | Total | |||||||||||||||||
Total properties | 407 | 180 | 521 | 259 | 1,367 | |||||||||||||||||
Recent acquisitions/ development conversions | (11 | ) | (1 | ) | (24 | ) | (14 | ) | (50 | ) | ||||||||||||
Under development/redevelopment | (2 | ) | (2 | ) | (22 | ) | (3 | ) | (29 | ) | ||||||||||||
Current held for sale | (12 | ) | (23 | ) | (18 | ) | (2 | ) | (55 | ) | ||||||||||||
Land parcels, loans and sub-leases | (19 | ) | (7 | ) | (5 | ) | (8 | ) | (39 | ) | ||||||||||||
Transitions | (58 | ) | — | (16 | ) | (1 | ) | (75 | ) | |||||||||||||
Other(1) | — | — | (1 | ) | — | (1 | ) | |||||||||||||||
Same store properties | 305 | 147 | 435 | 231 | 1,118 | |||||||||||||||||
Same Store NOI Reconciliation | 2Q17 | 3Q17 | 4Q17 | 1Q18 | 2Q18 | Y/o/Y | ||||||||||||||||
Seniors Housing Triple-net | ||||||||||||||||||||||
NOI | $ | 155,741 | $ | 157,815 | $ | 153,904 | $ | 151,305 | $ | 158,242 | ||||||||||||
Non-cash NOI on same store properties | (3,293 | ) | (2,500 | ) | (3,116 | ) | (4,228 | ) | (1,077 | ) | ||||||||||||
NOI attributable to non-same store properties | (52,775 | ) | (54,644 | ) | (49,082 | ) | (42,929 | ) | (52,347 | ) | ||||||||||||
Currency and ownership adjustments(2) | 582 | 347 | 299 | (488 | ) | (52 | ) | |||||||||||||||
Other normalizing adjustments(5) | 360 | 272 | 129 | (122 | ) | (983 | ) | |||||||||||||||
SSNOI | 100,615 | 101,290 | 102,134 | 103,538 | 103,783 | 3.1 | % | |||||||||||||||
Long-Term/Post-Acute Care | ||||||||||||||||||||||
NOI | 87,925 | 88,494 | 78,353 | 71,811 | 67,529 | |||||||||||||||||
Non-cash NOI on same store properties | (2,561 | ) | (3,701 | ) | (1,125 | ) | (4,684 | ) | (3,942 | ) | ||||||||||||
NOI attributable to non-same store properties | (28,197 | ) | (27,263 | ) | (19,600 | ) | (17,550 | ) | (13,365 | ) | ||||||||||||
Currency and ownership adjustments(2) | 123 | 4 | 28 | 19 | 55 | |||||||||||||||||
Normalizing adjustments for rent restructuring(3) | (8,527 | ) | (8,568 | ) | (8,546 | ) | — | — | ||||||||||||||
Other normalizing adjustments(5) | 380 | 382 | 384 | — | — | |||||||||||||||||
SSNOI | 49,143 | 49,348 | 49,494 | 49,596 | 50,277 | 2.3 | % | |||||||||||||||
Seniors Housing Operating | ||||||||||||||||||||||
NOI | 215,402 | 221,490 | 223,233 | 221,522 | 235,029 | |||||||||||||||||
Non-cash NOI on same store properties | 484 | 267 | (353 | ) | (652 | ) | (608 | ) | ||||||||||||||
NOI attributable to non-same store properties | (19,108 | ) | (18,411 | ) | (18,560 | ) | (18,889 | ) | (28,055 | ) | ||||||||||||
Currency and ownership adjustments(2) | 4,954 | 1,528 | 940 | (32 | ) | 1,145 | ||||||||||||||||
SH-NNN to SHO conversions(4) | 6,902 | 5,320 | — | — | — | |||||||||||||||||
Other normalizing adjustments(5) | (1,330 | ) | (933 | ) | 346 | 554 | 90 | |||||||||||||||
SSNOI | 207,304 | 209,261 | 205,606 | 202,503 | 207,601 | 0.1 | % | |||||||||||||||
Outpatient Medical | ||||||||||||||||||||||
NOI | 90,167 | 90,940 | 92,354 | 85,969 | 86,749 | |||||||||||||||||
Non-cash NOI on same store properties | (2,689 | ) | (2,375 | ) | (2,587 | ) | (1,294 | ) | (1,504 | ) | ||||||||||||
NOI attributable to non-same store properties | (7,825 | ) | (8,524 | ) | (8,948 | ) | (3,440 | ) | (4,139 | ) | ||||||||||||
Currency and ownership adjustments(2) | 286 | 44 | (67 | ) | (216 | ) | (43 | ) | ||||||||||||||
Other normalizing adjustments(5) | (301 | ) | (110 | ) | (159 | ) | (47 | ) | 169 | |||||||||||||
SSNOI | 79,638 | 79,975 | 80,593 | 80,972 | 81,232 | 2.0 | % | |||||||||||||||
Corporate & Land | ||||||||||||||||||||||
NOI | 26 | 640 | 288 | 230 | 375 | |||||||||||||||||
NOI attributable to non-same store properties | (26 | ) | (640 | ) | (288 | ) | (230 | ) | (375 | ) | ||||||||||||
SSNOI | — | — | — | — | — | |||||||||||||||||
Total | ||||||||||||||||||||||
NOI | 549,261 | 559,379 | 548,132 | 530,837 | 547,924 | |||||||||||||||||
Non-cash NOI on same store properties | (8,059 | ) | (8,309 | ) | (7,181 | ) | (10,858 | ) | (7,131 | ) | ||||||||||||
NOI attributable to non-same store properties | (107,931 | ) | (109,482 | ) | (96,478 | ) | (83,038 | ) | (98,281 | ) | ||||||||||||
Currency and ownership adjustments | 5,945 | 1,923 | 1,200 | (717 | ) | 1,105 | ||||||||||||||||
Normalizing adjustments, net | (2,516 | ) | (3,637 | ) | (7,846 | ) | 385 | (724 | ) | |||||||||||||
SSNOI | $ | 436,700 | $ | 439,874 | $ | 437,827 | $ | 436,609 | $ | 442,893 | 1.4 | % | ||||||||||
Notes : | ||||||||||||||||||||||
(1) Includes 1 flooded property. | ||||||||||||||||||||||
(2) Includes adjustments to reflect consistent property ownership percentages, to translate Canadian properties at a USD/CAD rate of 1.25 and to translate UK properties at a GBP/USD rate of 1.35. | ||||||||||||||||||||||
(3) Represents adjustments related to rent restructuring for one LTPAC master lease. | ||||||||||||||||||||||
(4) Represents the performance of certain properties that were converted from SH-NNN to SHO with the same operator. Amounts represent unaudited operating results provided by the operator and were not a component of WELL earnings. | ||||||||||||||||||||||
(5) Represents aggregate normalizing adjustments which are individually less than 0.50% of SSNOI growth per property type. | ||||||||||||||||||||||
24
Forward-Looking Statement and Risk Factors | |
Forward-Looking Statements and Risk Factors
This document contains “forward-looking statements” as defined in the Private Securities Litigation Reform Act of 1995. When the company uses words such as “may,” “will,” “intend,” “should,” “believe,” “expect,” “anticipate,” “project,” “estimate” or similar expressions that do not relate solely to historical matters, it is making forward-looking statements. In particular, these forward-looking statements include, but are not limited to, those relating to the company’s opportunities to acquire, develop or sell properties; the company’s ability to close its anticipated acquisitions, investments or dispositions on currently anticipated terms, or within currently anticipated timeframes; the expected performance of the company’s operators/tenants and properties; the company’s expected occupancy rates; the company’s ability to declare and to make distributions to shareholders; the company’s investment and financing opportunities and plans; the company’s continued qualification as a real estate investment trust (“REIT”); the company’s ability to access capital markets or other sources of funds; and the company’s ability to meet its earnings guidance. Forward-looking statements are not guarantees of future performance and involve risks and uncertainties that may cause the company’s actual results to differ materially from the company’s expectations discussed in the forward-looking statements. This may be a result of various factors, including, but not limited to: the status of the economy; the status of capital markets, including availability and cost of capital; issues facing the health care industry, including compliance with, and changes to, regulations and payment policies, responding to government investigations and punitive settlements and operators’/tenants’ difficulty in cost-effectively obtaining and maintaining adequate liability and other insurance; changes in financing terms; competition within the health care and seniors housing industries; negative developments in the operating results or financial condition of operators/tenants, including, but not limited to, their ability to pay rent and repay loans; the company’s ability to transition or sell properties with profitable results; the failure to make new investments or acquisitions as and when anticipated; natural disasters and other acts of God affecting the company’s properties; the company’s ability to re-lease space at similar rates as vacancies occur; the company’s ability to timely reinvest sale proceeds at similar rates to assets sold; operator/tenant or joint venture partner bankruptcies or insolvencies; the cooperation of joint venture partners; government regulations affecting Medicare and Medicaid reimbursement rates and operational requirements; liability or contract claims by or against operators/tenants; unanticipated difficulties and/or expenditures relating to future investments or acquisitions; environmental laws affecting the company’s properties; changes in rules or practices governing the company’s financial reporting; the movement of U.S. and foreign currency exchange rates; the company’s ability to maintain its qualification as a REIT; key management personnel recruitment and retention; and other risks described in the company’s reports filed from time to time with the Securities and Exchange Commission (“SEC”). Finally, the company undertakes no obligation to update or revise publicly any forward-looking statements, whether because of new information, future events or otherwise, or to update the reasons why actual results could differ from those projected in any forward-looking statements.
Additional Information
The information in this supplemental information package should be read in conjunction with the company’s Annual Report on Form 10-K, Quarterly Reports on Form 10-Q, Current Reports on Form 8-K, earnings press release dated July 27, 2018 and other information filed with, or furnished to, the SEC. The Supplemental Reporting Measures and reconciliations of Non-GAAP measures are an integral part of the information presented herein.
You can access the company’s Annual Report on Form 10-K, Quarterly Reports on Form 10-Q, Current Reports on Form 8-K and amendments to those reports filed or furnished pursuant to Section 13(a) or 15(d) of the Exchange Act at www.welltower.com as soon as reasonably practicable after they are filed with, or furnished to, the SEC. You can also review these SEC filings and other information by accessing the SEC’s website at http://www.sec.gov. The company also routinely posts important information on its website at www.welltower.com in the “Investors” section, including corporate and investor presentations and financial information. The company intends to use its website as a means of disclosing material, non-public information and for complying with its disclosure obligations under Regulation FD. Such disclosures will be included on its website under the heading “Investors.” Accordingly, investors should monitor such portion of the company’s website in addition to following its press releases, public conference calls and filings with the SEC. The information on or connected to the company’s website is not, and shall not be deemed to be, a part of, or incorporated into this supplemental information package.
25

26