Attached files
| file | filename |
|---|---|
| 8-K - 8-K - PG&E Corp | d579743d8k.htm |
Exhibit 99.1
|
UPDATE July 27, 2018
|
StatementsThis presentation contains statements regarding management?s expectations and objectives for future periods as well as forecasts and estimates regarding 2018 IIC guidance, Tax Cuts and Jobs Act expected impact, 2017-2019 capital expenditures, 2017-2019 weighted average ratebase, and general earnings sensitivities. It also includes 2018 assumptions regarding capital expenditures, authorized rate base, authorized cost of capital, and certain other factors. These statements and other statements that are not purely historical constitute forward-looking statements that are necessarily subject to various risks and uncertainties. Actual results may differ materially from those described in forward-looking statements. PG&E Corporation and the Utility are not able to predict all the factors that may affect future results. Factors that could cause actual results to differ materially include, but are not limited to:the impact of the Northern California wildfires, including whether Pacific Gas and Electric Company (Utility) will be able to recover costs for service restoration and repair to the Utility?s facilities through its Catastrophic Event Memorandum Account (CEMA); the timing and outcome of the wildfire investigations; whether the Utility may have liability associated with these fires and, if liable for one or more fires, whether the Utility would be able to recover all or part of such costs through insurance or through regulatory mechanisms, to the extent insurance is not available or exhausted; and potential liabilities in connection with fines or penalties that could be imposed on the Utility if the California Public Utilities Commission (CPUC) or any other lawenforcement agency brought an enforcement action and determined that the Utility failed to comply with applicable laws and regulations; the timing and outcome of the Butte fire litigation; the timing and outcome of any proceeding to recover from customers restoration and repair costs and costs in excess of insurance; the effect, if any, that the CPUC?s Safety and Enforcement Division?s (SED) $8.3 million citations issued in connection with the Butte fire may have on the Butte fire litigation; and whether additional investigations and proceedings in connection wi h the Butte fire will be opened and any additional fines or penalties imposed on the Utility; whether the CPUC approves the Utility?s application to establish a Wildfire Expense Memorandum Account (WEMA) to track wildfire expenses and to preserve the opportunity for the Utility to request recovery of wildfire costs in excess of insurance at a future date, and the outcome of any potential request to recover such costs; the impact of the Tax Cuts and Jobs Act of 2017, and the timing and outcome of CPUC decision(s) related to the Utility?s March 30, 2018 submissions in connection with the impact of the Tax Cuts and Jobs Act of 2017 on the Utility?s rate cases, and its implementation plan; the timing and outcomes of the 2019 GT&S rate case, TO18 and TO19 rate cases, 2018 CEMA, and other ratemaking and regulatory proceedings; the cost of the Utility’s community wildfire safety program, and the timing and outcome of any proceeding to recover such costs through rates; the timing and outcomes of phase two of the ex parte order instituting investigation (OII) and of the safety culture OII; the Utility?s ability to efficiently manage capital expenditures and its operating and maintenance expenses within the authorized levels of spending and timely recover its costs through rates, and the extent to which the Utility incurs unrecoverable costs that are higher than the forecasts of such costs; whether the Utility can continue to obtain insurance and whether insurance coverage is adequate for future losses or claims; the outcome of the probation and the monitorship, the timing and outcomes of the debarment proceeding, the SED?s unresolved enforcement matters relating to the Utility?s compliance with natural gas-related laws and regulations, and other investigations that have been or may be commenced, and the ultimate amount of fines, penalties, and remedial and other costs that the Utility may incur as a result; the ability of PG&E Corporation and the Utility to access capital markets and other sources of financing in a timely manner on acceptable terms; further changes in credit ratings which could, among other things, result in higher borrowing costs and fewer financing options, especially if PG&E Corporation or the Utility were to lose their investment grade credit ratings; and the other factors disclosed in PG&E Corporation and the Utility?s joint annual report on Form 10-K for the year ended December 31, 2017, their joint quarterly report on Form 10-Q for the quarter ended March 31, 2018, and other reports filed with the Securities and Exchange Commission (SEC), which are available on PG&E Corporation?s website at www.pgecorp.com and on the SEC website at www.sec.gov.To be UpdatedInformation regarding 2018 IICs, 2018 Assumptions, and 2018 Earnings Sensitivities was issued on May 3, 2018. Unless otherwise indicated, the statements in this presentation are made as of this date and PG&E Corporation undertakes no obligation to update information contained herein. This presentation was attached to PG&E Corporation?s Current Report on Form 8-K that was furnished to the SEC on May 7, 2018, and also is available on PG&E Corporation?s website at www.pgecorp.com.2
|
|
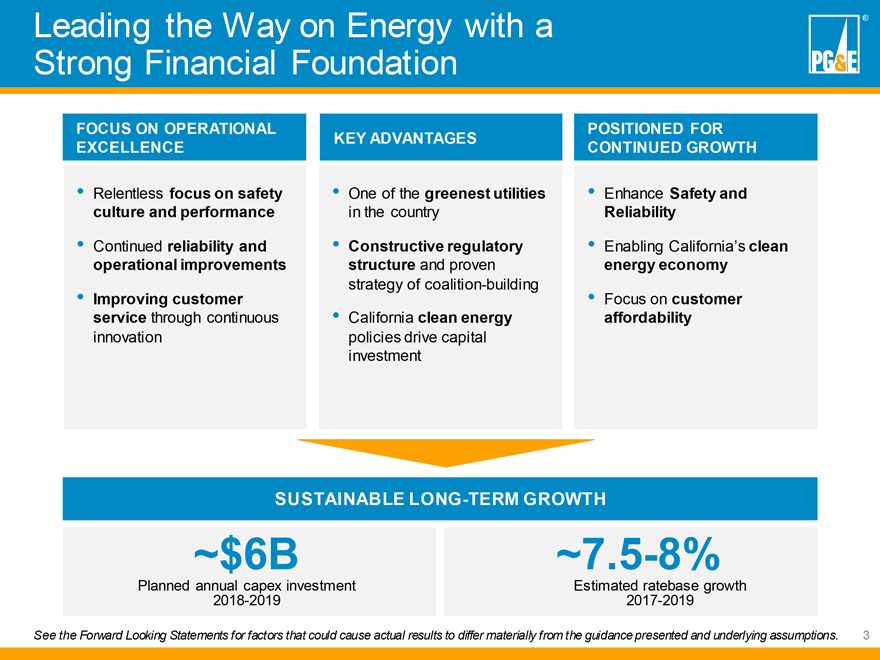
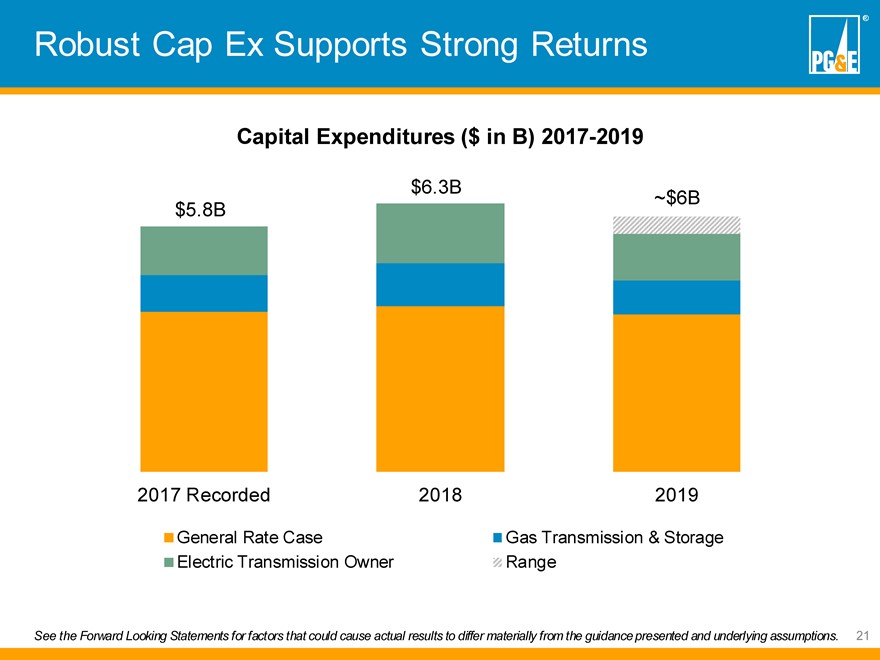
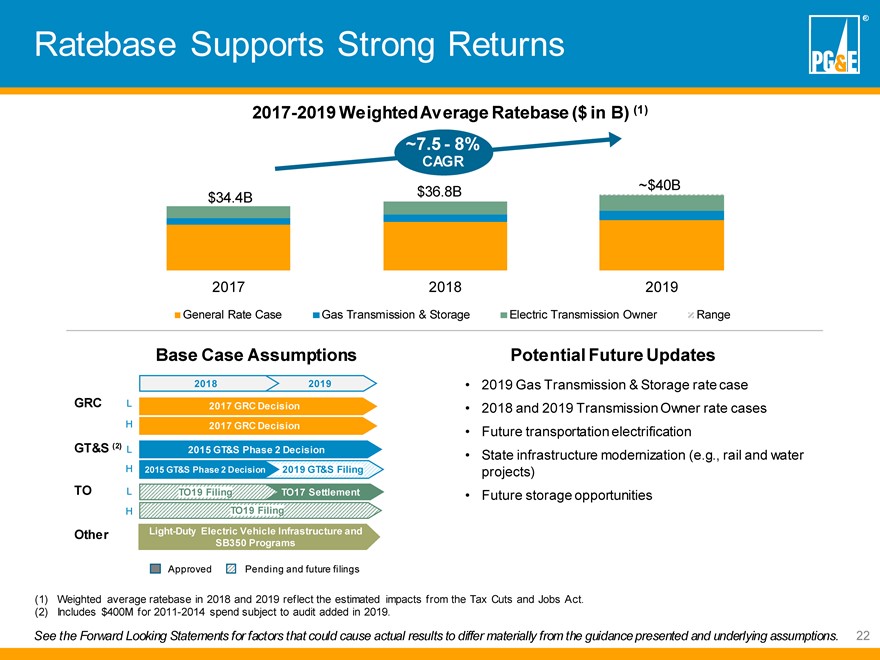
See the Forward Looking Statements for factors that could cause actual results to differ materially from the guidance presented and underlying assumptions. 3 Leading the Way on Energy with a Strong Financial Foundation ~$6B Planned annual capex investment 2018-2019 Relentless focus on safety culture and performance Continued reliability and operational improvements Improving customer service through continuous innovation One of the greenest utilities in the country Constructive regulatory structure and proven strategy of coalition-building California clean energy policies drive capital investment Enhance Safety and Reliability Enabling California’s clean energy economy Focus on customer affordability FOCUS ON OPERATIONAL EXCELLENCE KEY ADVANTAGES POSITIONED FOR CONTINUED GROWTH SUSTAINABLE LONG-TERM GROWTH ~7.5-8% Estimated ratebase growth 2017-2019
|
AgendaFocus on Operational ExcellenceKey AdvantagesPositioning for the Future4
|
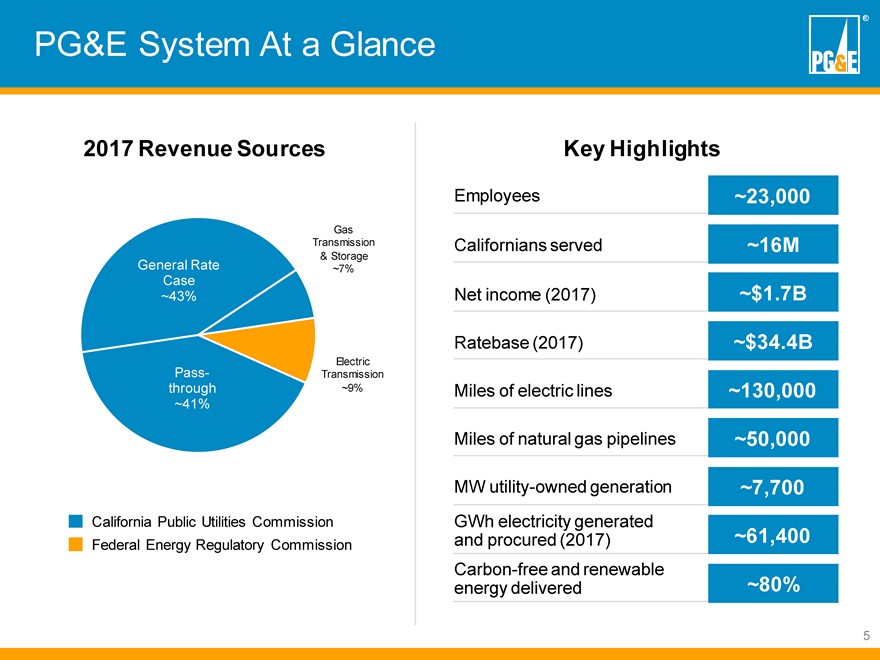
System At a Glance2017 Revenue SourcesGas Transmission& StorageGeneral Rate ~7% Case ~43%Electric Pass- Transmissionthrough ~9% ~41%California Public Utilities Commission Federal Energy Regulatory CommissionKey HighlightsEmployees ~23,000 Californians served ~16M Net income (2017) ~$1.7B Ratebase (2017) ~$34.4B Miles of electric lines ~130,000 Miles of natural gas pipelines ~50,000MW utility-owned generation ~7,700 GWh electricity generated and procured (2017) ~61,400 Carbon-free and renewable energy delivered ~80%5
|
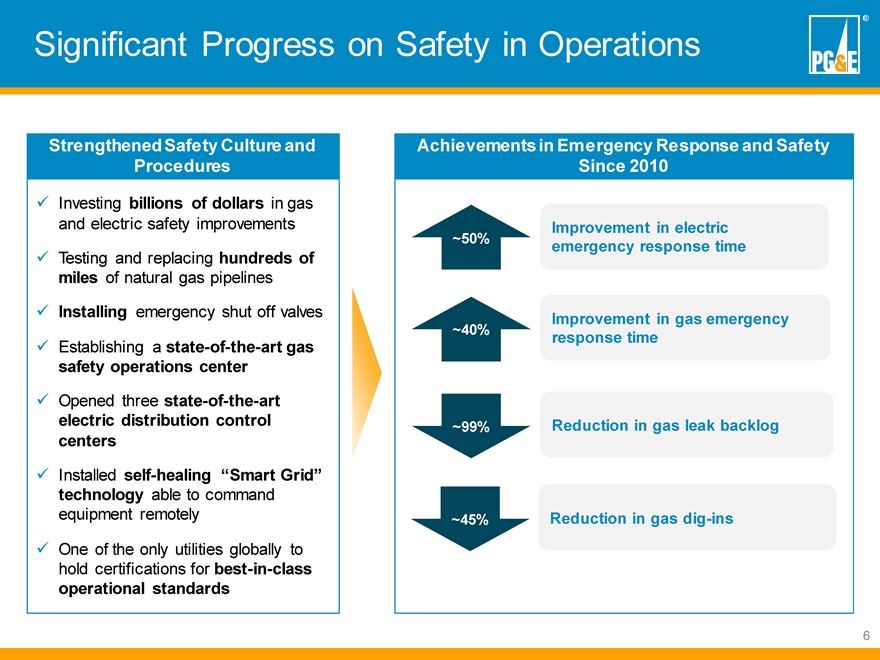
Significant Progress on Safety in OperationsStrengthenedSafety Culture and ProceduresInvesting billions of dollars in gas and electric safety improvements Testing and replacing hundreds of miles of natural gas pipelines Installing emergency shut off valves Establishing a state-of-the-art gas safety operations center Opened three state-of-the-art electric distribution control centers Installed self-healing ?Smart Grid? technology able to command equipment remotely One of the only utilities globally to hold certifications for best-in-class operational standardsAchievements in Emergency Response and Safety Since 2010~50% ~40% ~99% ~45%Improvement in electric emergency response timeImprovement in gas emergency response timeReduction in gas leak backlog Reduction in gas dig-ins6
|
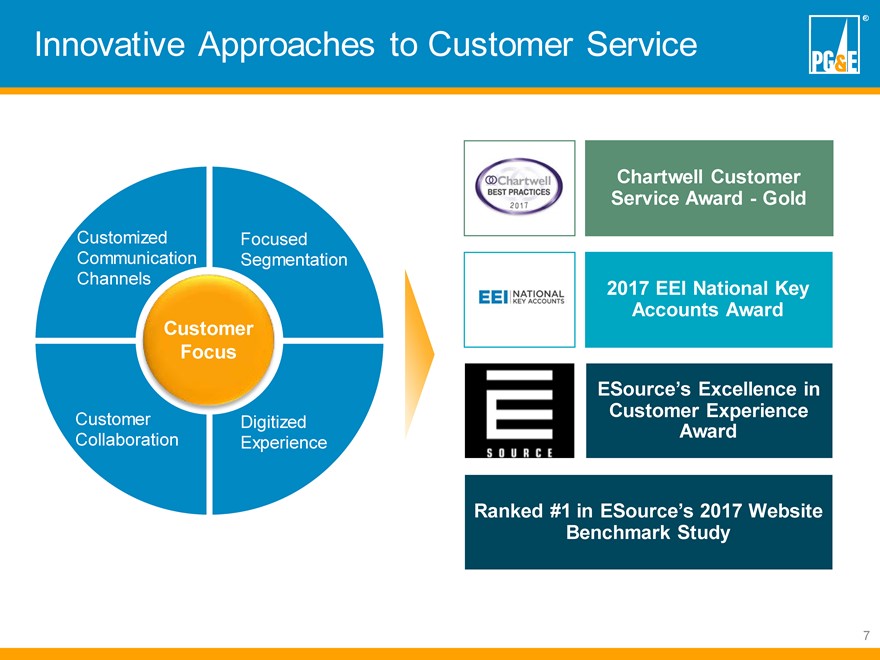
Innovative Approaches to Customer ServiceCustomized Focused Communication Segmentation ChannelCustomer FocusCustomer Digitized Collaboration ExperienceChartwell Customer Service Award—Gold 2017 EEI National Key Accounts AwardESource?s Excellence in Customer Experience AwardRanked #1 in ESource?s 2017 Website Benchmark Study7
|
AgendaFocus on Operational ExcellenceKey AdvantagesPositioning for the Future8
|
Advantages1 One of the greenest utilities in the country2 Constructive regulatory framework3 California clean energy policies4 Multiple capital investment drivers9
|
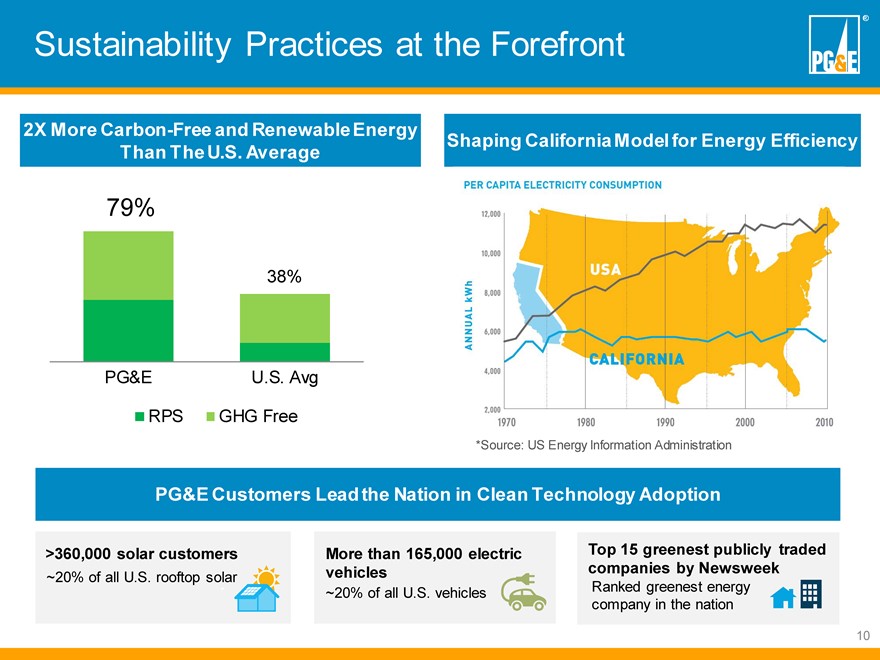
Practices at the Forefront 2X More Carbon-Free and Renewable Energy Than The U.S. Average 79%38%PG&E U.S. Avg RPS GHG FreeShaping California Model for Energy Efficiency*Source: US Energy Information AdministrationPG&E Customers Lead the Nation in Clean Technology Adoption>360,000 solar customers~20% of all U.S. rooftop solarMore than 165,000 electric vehicles~20% of all U.S. vehicles Top 15 greenest publicly traded companies by NewsweekRanked greenest energy company in the nation10
|
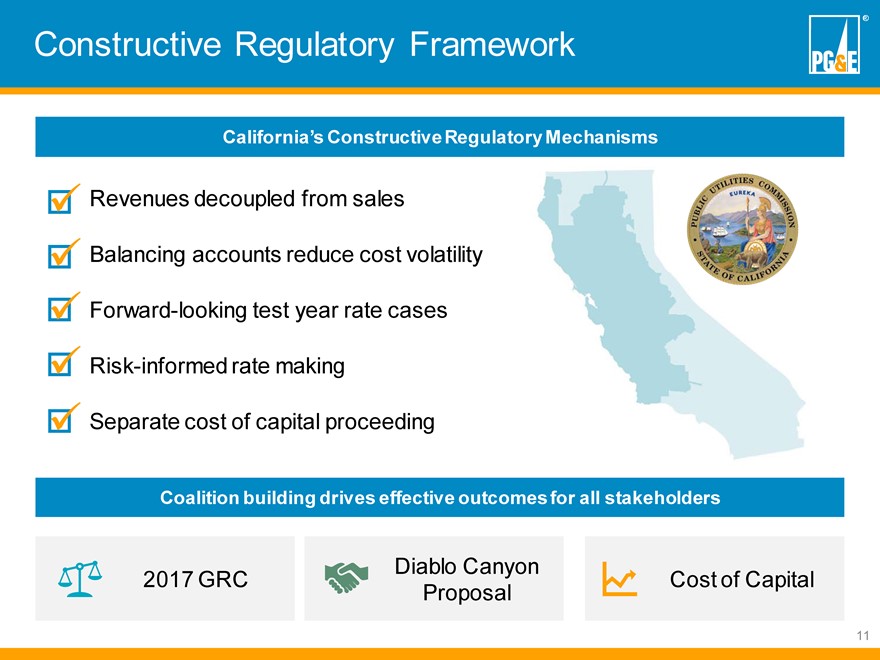
Regulatory FrameworkCalifornia?s Constructive Regulatory MechanismsRevenues decoupled from salesBalancing accounts reduce cost volatilityForward-looking test year rate casesRisk-informed rate makingSeparate cost of capital proceedingCoalition building drives effective outcomes for all stakeholdersDiablo Canyon 2017 GRC Cost of Capital Proposal11
|
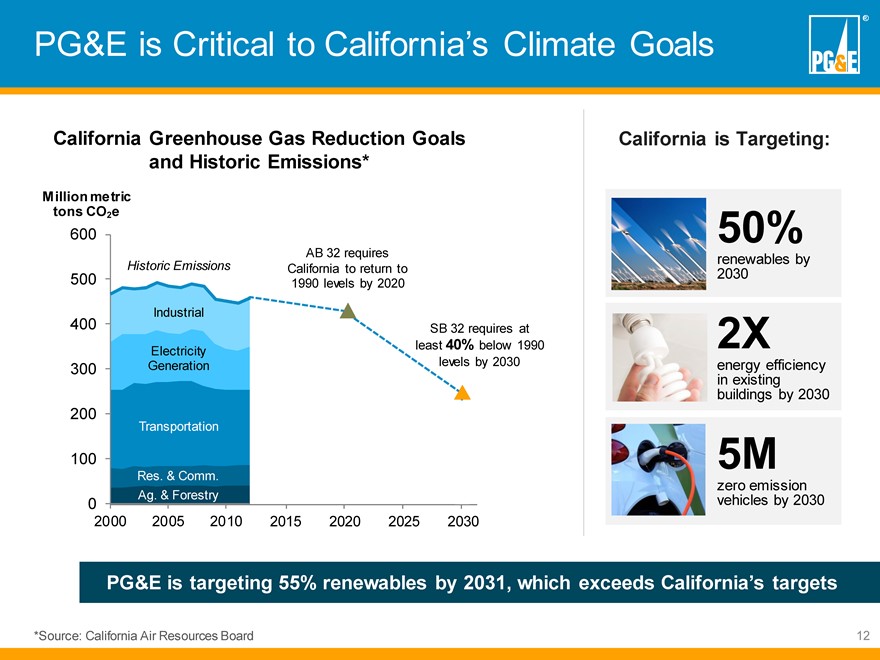
is Critical to California?s Climate GoalsCalifornia Greenhouse Gas Reduction Goals and Historic Emissions*Million metric tons CO2e600Historic Emissions AB 32 requires California to return to 500 1990 levels by 2020 Industrial400 SB 32 requires at Electricity least 40% below 1990 300 Generation levels by 2030 200Transportation100Res. & Comm. Ag. & Forestry02000 2005 2010 2015 2020 2025 2030California is Targeting:50%2030 renewables by 2Xenergy in existing efficiency buildings by 20305Mvehicles zero emission by 2030 PG&E is targeting 55% renewables by 2031, which exceeds California?s targets*Source: California Air Resources Board12
|
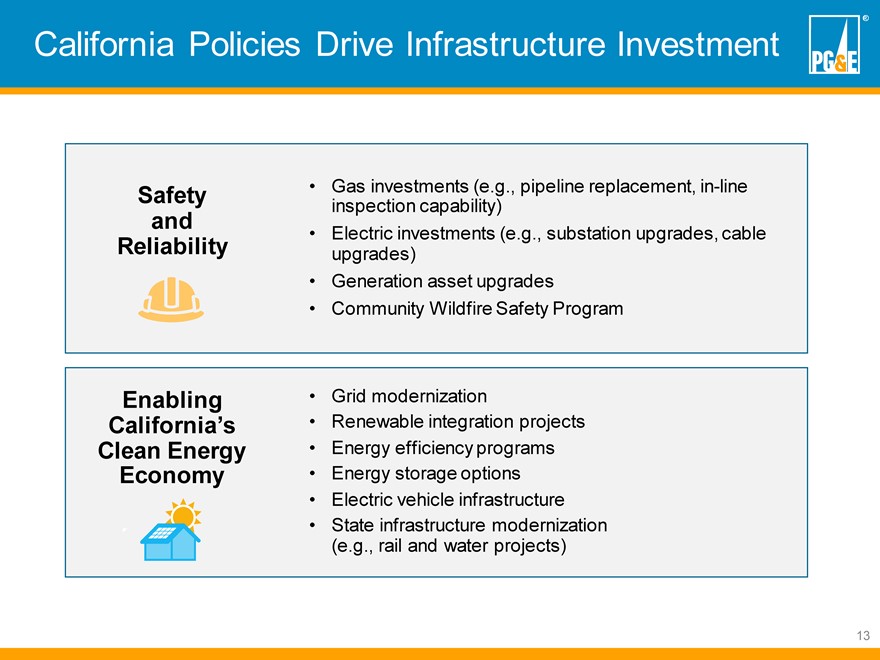
Policies Drive Infrastructure Investment Safety and ReliabilityGas investments (e.g., pipeline replacement, in-line inspection capability) Electric investments (e.g., substation upgrades, cable upgrades) Generation asset upgrades Community Wildfire Safety ProgramEnabling California?s Clean Economy Energy Grid modernizationRenewable integration projects Energy efficiency programs Energy storage options Electric vehicle infrastructure State infrastructure modernization (e.g., rail and water projects)13
|
on Operational ExcellenceKey AdvantagesPositioning for the Future14
|
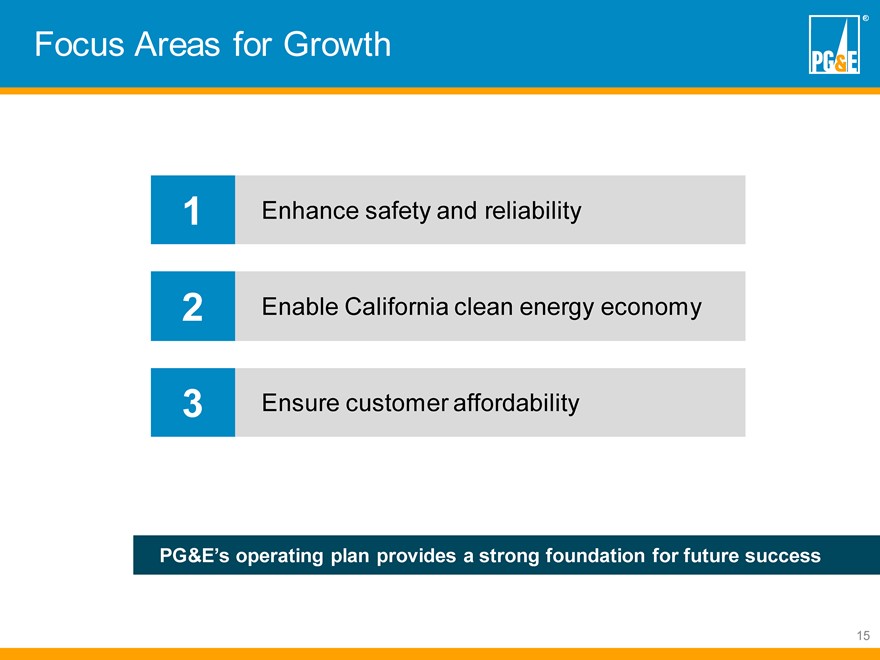
Areas for Growth1 Enhance safety and reliability2 Enable California clean energy economy3 Ensure customer affordabilityPG&E?s operating plan provides a strong foundation for future success15
|
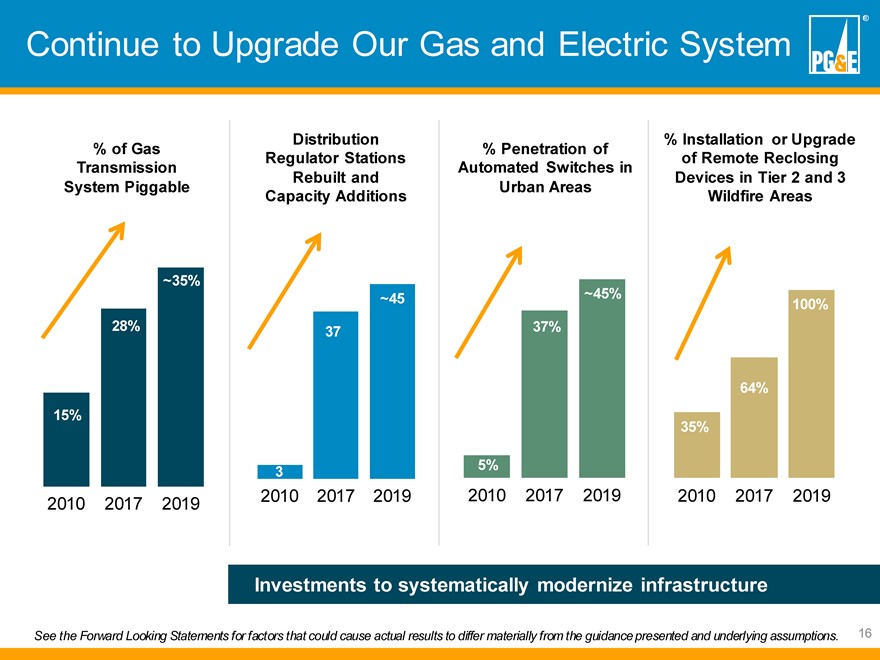
to Upgrade Our Gas and Electric SystemDistribution % Installation or Upgrade % of Gas % Penetration of Regulator Stations of Remote Reclosing Transmission Automated Switches in Rebuilt and Devices in Tier 2 and 3 System Piggable Urban Areas Capacity Additions Wildfire Areas~35%~45 ~45%100% 28% 37 37%64% 15% 35%3 5%2010 2017 2019 2010 2017 2019 2010 2017 2019 2010 2017 2019Investments to systematically modernize infrastructureSee the Forward Looking Statements for factors that could cause actual results to differ materially from the guidance presented and underlying assumptions.16
|
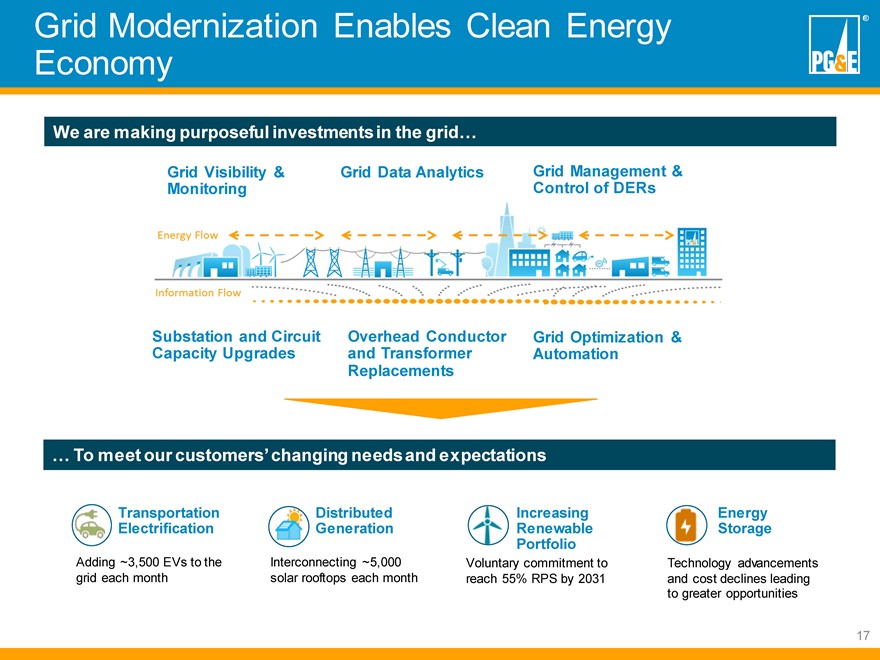
Modernization Enables Clean Energy EconomyWe are making purposeful investments in the gridGrid Visibility & Grid Data Analytics Grid Management & Monitoring Control of DERsSubstation and Circuit Overhead Conductor Grid Optimization & Capacity Upgrades and Transformer Automation Replacements To meet our customers? changing needs and expectationsTransportation Distributed Increasing Energy Electrification Generation Renewable Storage PortfolioAdding ~3,500 EVs to the Interconnecting ~5,000 Voluntary commitment to Technology advancements grid each month solar rooftops each month reach 55% RPS by 2031 and cost declines leading to greater opportunities17
|
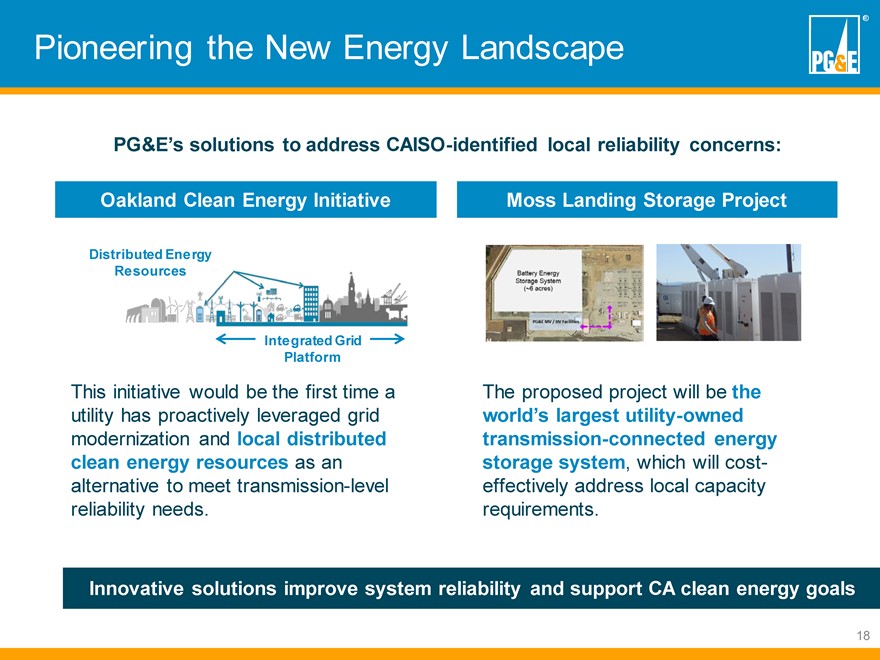
the New Energy LandscapePG&E?s solutions to address CAISO-identified local reliability concerns:Oakland Clean Energy Initiative Moss Landing Storage ProjectDistributed Energy ResourcesIntegrated Grid PlatformThis initiative would be the first time a The proposed project will be the utility has proactively leveraged grid world?s largest utility-owned modernization and local distributed transmission-connected energy clean energy resources as an storage system, which will cost-alternative to meet transmission-level effectively address local capacity reliability needs. requirements.Innovative solutions improve system reliability and support CA clean energy goals 18
|
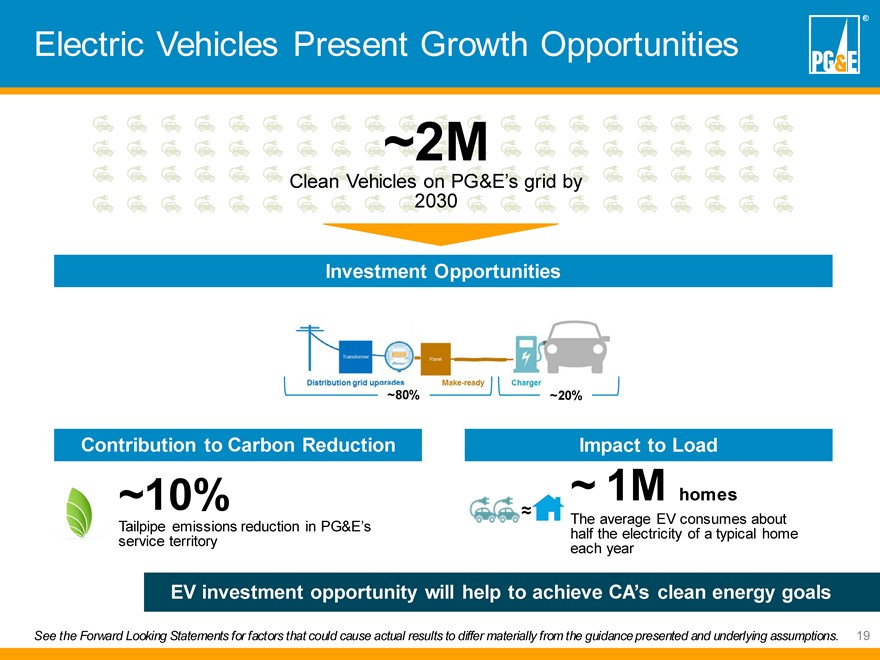
Vehicles Present Growth Opportunities~2MClean Vehicles2030 on PG&E?s grid by Investment Opportunities~80% ~20%Contribution to Carbon Reduction Impact to Load~10% ~ 1M homesTailpipe emissions reduction in PG&E?s ? The average EV consumes about half the electricity of a typical home service territory each yearEV investment opportunity will help to achieve CA?s clean energy goalsSee the Forward Looking Statements for factors that could cause actual results to differ materially from the guidance presented and underlying assumptions.19
|
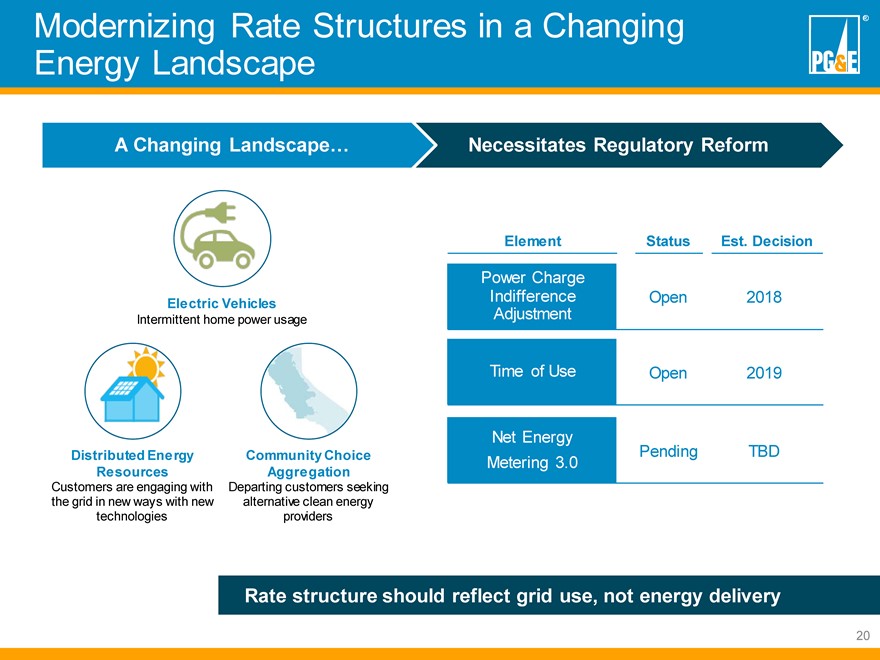
Rate Structures in a Changing Energy LandscapeA Changing Landscape Necessitates Regulatory ReformElement Status Est. DecisionPower Charge Electric Vehicles Indifference Open 2018Intermittent home power usage AdjustmentTime of Use Open 2019Net Energy Distributed Energy Community Choice Pending TBDMetering 3.0Resources AggregationCustomers are engaging with Departing customers seeking the grid in new ways with new alternative clean energy technologies providersRate structure should reflect grid use, not energy delivery20
|
Cap Ex Supports Strong ReturnsCapital Expenditures ($ in B) 2017-2019$6.3B~$6B $5.8B2017 Recorded 2018 2019General Rate Case Gas Transmission & Storage Electric Transmission Owner RangeSee the Forward Looking Statements for factors that could cause actual results to differ materially from the guidance presented and underlying assumptions.21
|
Supports Strong Returns2017-2019 Weighted Average Ratebase ($ in B) (1) ~7.5—8%CAGR $36.8B ~$40B $34.4B2017 2018 2019General Rate Case Gas Transmission & Storage Electric Transmission Owner RangeBase Case Assumptions Potential Future Updates2018 2019 2019 Gas Transmission & Storage rate case GRC L 2017 GRC Decision 2018 and 2019 Transmission Owner rate cases H 2017 GRC Decision Future transportation electrification GT&S (2) L 2015 GT&S Phase 2 Decision State infrastructure modernization (e.g., rail and water H 2015 GT&S Phase 2 Decision 2019 GT&S Filing projects)TO L TO19 Filing TO17 Settlement Future storage opportunitiesH TO19 FilingOther Light-Duty Electric Vehicle Infrastructure and SB350 ProgramsApproved Pending and future filings(1) Weighted average ratebase in 2018 and 2019 reflect the estimated impacts from the Tax Cuts and Jobs Act. (2) Includes $400M for 2011-2014 spend subject to audit added in 2019.See the Forward Looking Statements for factors that could cause actual results to differ materially from the guidance presented and underlying assumptions.22
|
Appendices
|
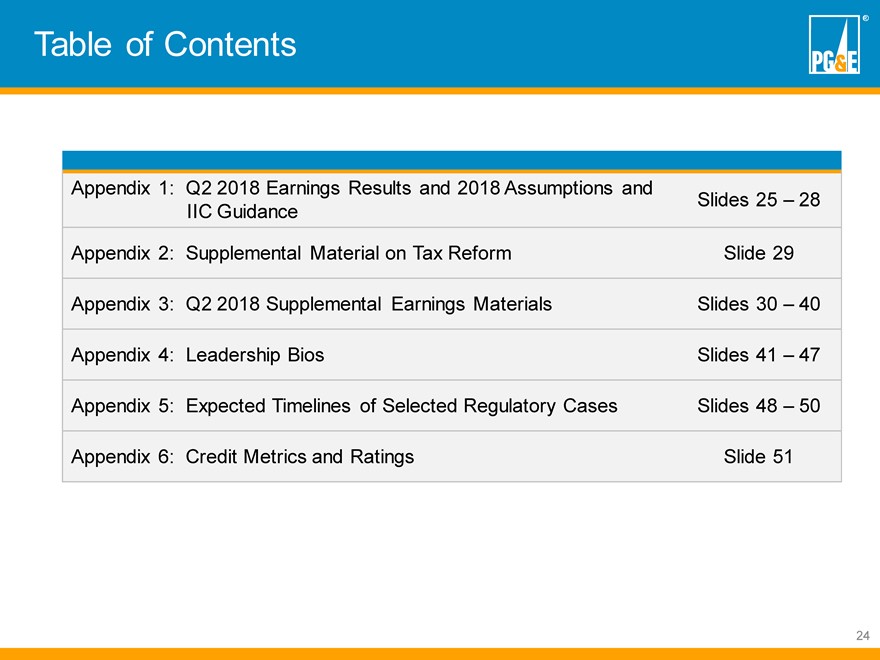
Table of Contents Appendix 1: Q2 2018 Earnings Results and 2018 Assumptions andSlides 25 ? 28 IIC Guidance Appendix 2: Supplemental Material on Tax Reform Slide 29 Appendix 3: Q2 2018 Supplemental Earnings Materials Slides 30 ? 40 Appendix 4: Leadership Bios Slides 41 ? 47 Appendix 5: Expected Timelines of Selected Regulatory Cases Slides 48 ? 50 Appendix 6: Credit Metrics and Ratings Slide 5124
|
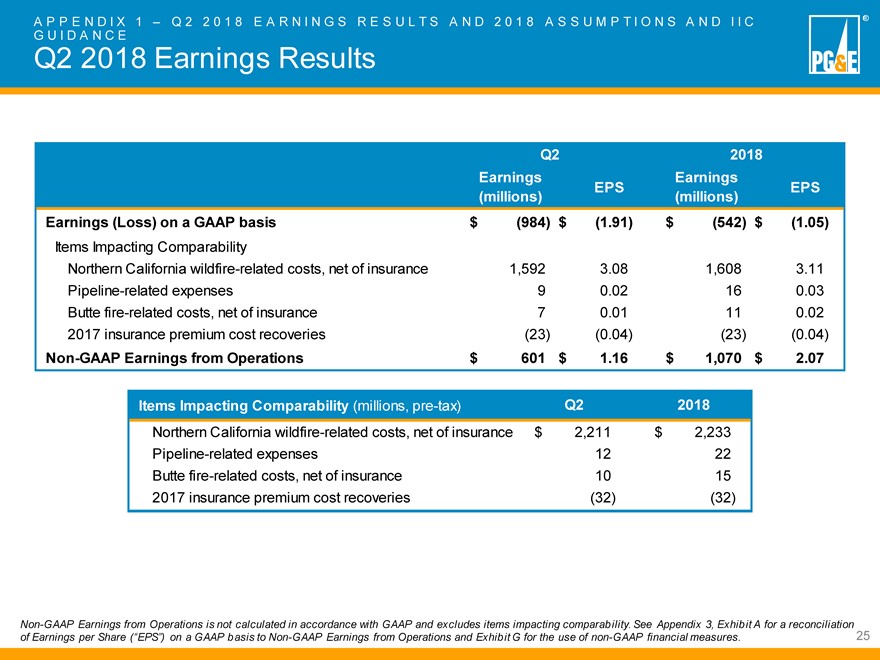
A P P E N D I X 1 ? Q 2 2 0 1 8 E A R N I N G S R E S U L T S A N D 2 0 1 8 A S S U M P T I O N S A N D I I C G U I D A N C EQ2 2018 Earnings ResultsQ2 2018 Earnings Earnings EPS EPS (millions) (millions) Earnings (Loss) on a GAAP basis $ (984) $ (1.91) $ (542) $ (1.05) Items Impacting ComparabilityNorthern California wildfire-related costs, net of insurance 1,592 3.08 1,608 3.11 Pipeline-related expenses 9 0.02 16 0.03 Butte fire-related costs, net of insurance 7 0.01 11 0.02 2017 insurance premium cost recoveries (23) (0.04) (23) (0.04) Non-GAAP Earnings from Operations $ 601 $ 1.16 $ 1,070 $ 2.07 Items Impacting Comparability (millions, pre-tax) Q2 2018Northern California wildfire-related costs, net of insurance $ 2,211 $ 2,233 Pipeline-related expenses 12 22 Butte fire-related costs, net of insurance 10 15 2017 insurance premium cost recoveries (32) (32)Non-GAAP Earnings from Operations is not calculated in accordance with GAAP and excludes items impacting comparability. See Appendix 3, Exhibit A for a reconciliation of Earnings per Share (?EPS?) on a GAAP basis to Non-GAAP Earnings from Operations and Exhibit G for the use of non-GAAP financial measures. 25
|
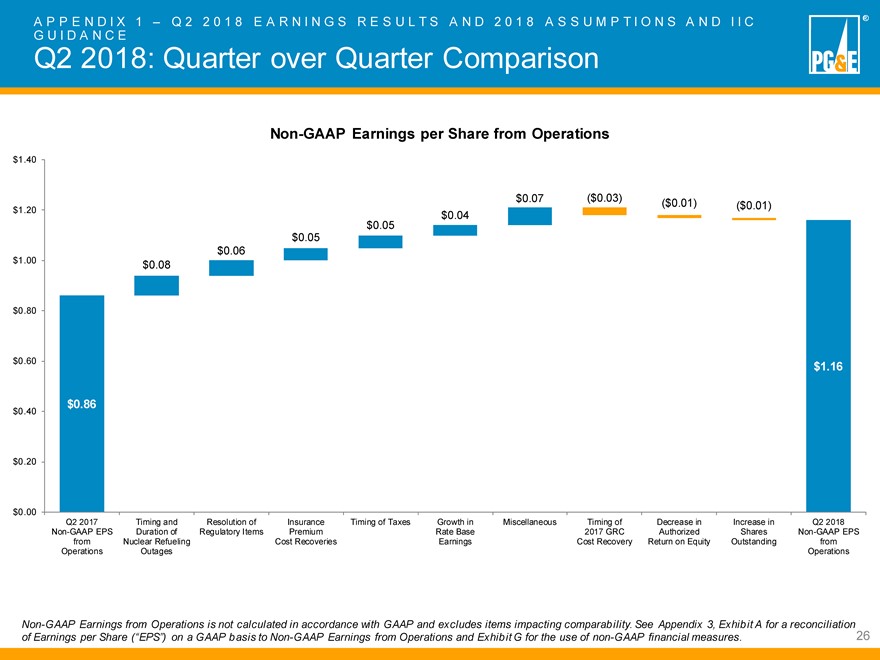
A P P E N D I X 1 ? Q 2 2 0 1 8 E A R N I N G S R E S U L T S A N D 2 0 1 8 A S S U M P T I O N S A N D I I C G U I D A N C EQ2 2018: Quarter over Quarter ComparisonNon-GAAP Earnings per Share from Operations$1.40$0.07 ($0.03) ($0.01)$1.20 ($0.01)$0.04 $0.05 $0.05 $1.00 $0.06 $0.08 $0.80$0.60 $1.16 $0.86 $0.40$0.20$0.00Q2 2017 Timing and Resolution of Insurance Timing of Taxes Growth in Miscellaneous Timing of Decrease in Increase in Q2 2018 Non-GAAP EPS Duration of Regulatory Items Premium Rate Base 2017 GRC Authorized Shares Non-GAAP EPS from Nuclear Refueling Cost Recoveries Earnings Cost Recovery Return on Equity Outstanding from Operations Outages OperationsNon-GAAP Earnings from Operations is not calculated in accordance with GAAP and excludes items impacting comparability. See Appendix 3, Exhibit A for a reconciliation of Earnings per Share (?EPS?) on a GAAP basis to Non-GAAP Earnings from Operations and Exhibit G for the use of non-GAAP financial measures. 26
|
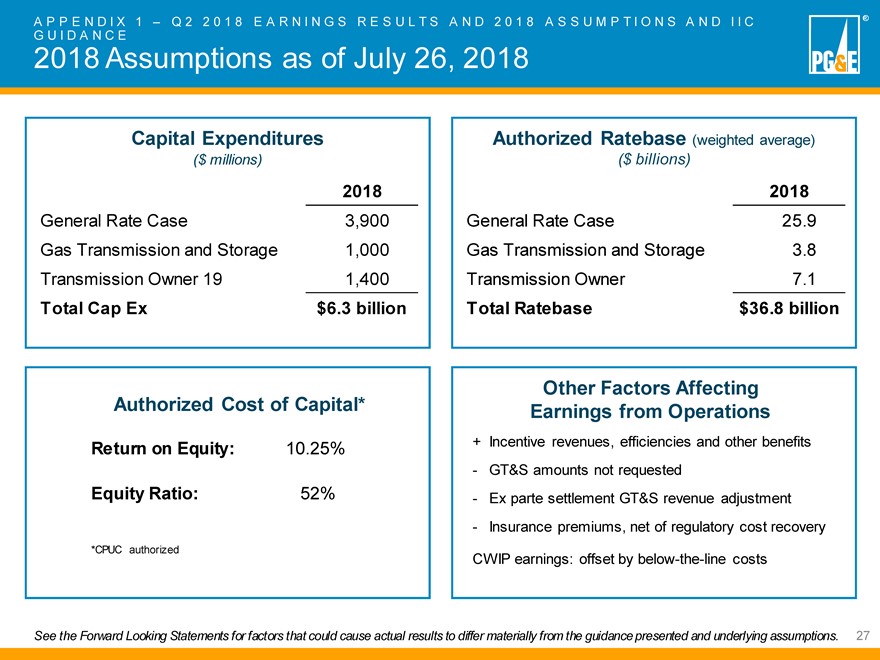
A P P E N D I X 1 ? Q 2 2 0 1 8 E A R N I N G S R E S U L T S A N D 2 0 1 8 A S S U M P T I O N S A N D I I C G U I D A N C E2018 Assumptions as of July 26, 2018Capital Expenditures Authorized Ratebase (weighted average)($ millions) ($ billions)2018 2018General Rate Case 3,900 General Rate Case 25.9 Gas Transmission and Storage 1,000 Gas Transmission and Storage 3.8 Transmission Owner 19 1,400 Transmission Owner 7.1Total Cap Ex $6.3 billion Total Ratebase $36.8 billionOther Factors Affecting Authorized Cost of Capital* Earnings from OperationsReturn on Equity: 10.25% + Incentive revenues, efficiencies and other benefits- GT&S amounts not requested Equity Ratio: 52%—Ex parte settlement GT&S revenue adjustment- Insurance premiums, net of regulatory cost recovery*CPUC authorizedCWIP earnings: offset by below-the-line costsSee the Forward Looking Statements for factors that could cause actual results to differ materially from the guidance presented and underlying assumptions.27
|
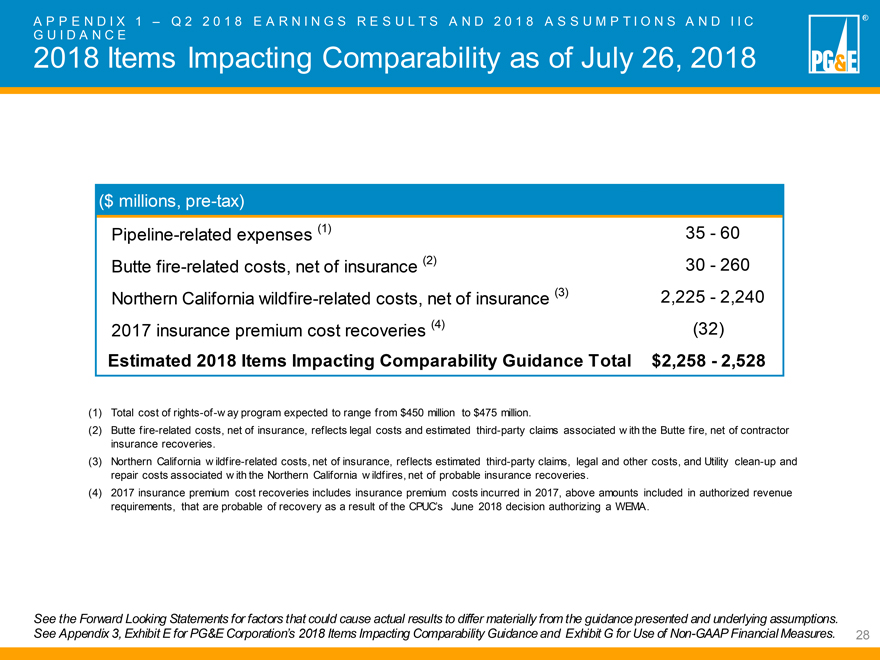
APPENDIX 1 – Q2 2018 EARNINGS RESULTS AND 2018 AS ASSUMPTIONS AND IIC GUIDANCE 2018 Items Impacting Comparability as of July 26, 2018 (1) Total cost of rights-of -way program expected to range from $450 million to $475 million. (2) Butte fire-related costs, net of insurance, reflects legal costs and estimated third-party claims associated with the Butte fire, net of contractor insurance recoveries. (3) Northern California wildfire-related costs, net of insurance, reflects estimated third-party claims, legal and other costs, and Utility clean-up and repair costs associated with the Northern California wildfires, net of probable insurance recoveries. (4) 2017 insurance premium cost recoveries insurance premium costs incurred in 2017, above amounts included in authorized revenue requirements, that are probable of recovery as a result of the CPUC’s June 2018 decision authorizing a WEMA. See the Forward Looking Statements for factors that could cause actual results to differ materially from the guidance presented and underlying assumptions. See Appendix 3, Exhibit E for PG&E Corporation’s 2018 Items Impacting Comparability Guidance and Exhibit G for Use of Non-GAAP Financial Measures. PG&E® ($ millions, pre-tax) Pipeline-related expenses (1) 35- 60 Butte fire-related costs, net of insurance (2) 30- 260 Northern California wildfire-related costs, net of insurance (3) 2,225-2,240 2017 insurance premium cost recoveries (4) (32) Estimated 2018 Items Impacting Comparability Guidance Total $2,258 - 2,528
|
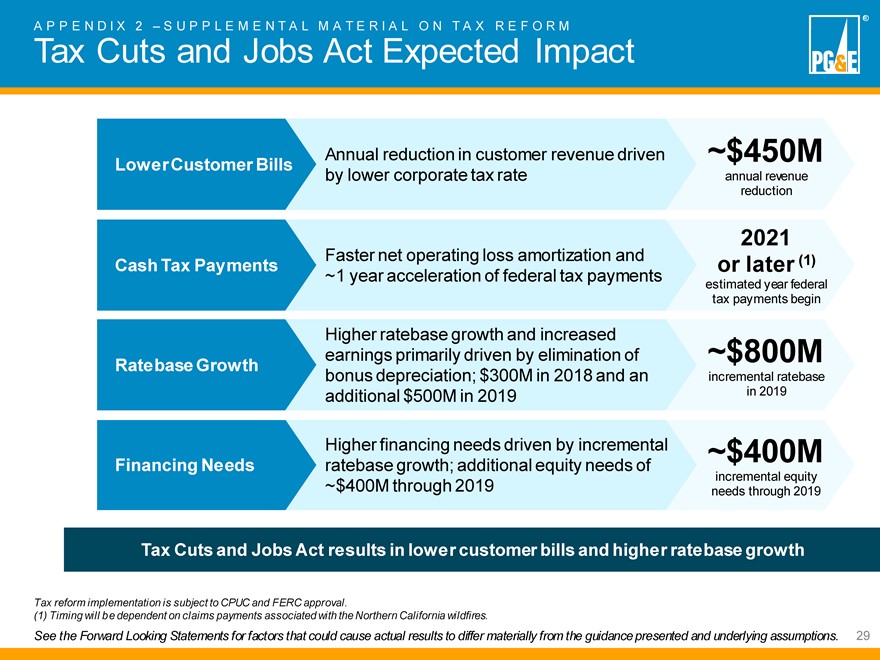
A P P E N D I X 2 ? S U P P L E M E N T A L M A T E R I A L O N T A X R E F O R MTax Cuts and Jobs Act Expected ImpactAnnual reduction in customer revenue driven ~$450M Lower Customer Bills by lower corporate tax rate annual revenue reduction2021 Faster net operating loss amortization and (1)Cash Tax Payments or later ~1 year acceleration of federal tax paymentsestimated year federal tax payments beginHigher ratebase growth and increased earnings primarily driven by elimination of ~$800M Ratebase Growth bonus depreciation; $300M in 2018 and an incremental ratebase additional $500M in 2019 in 2019Higher financing needs driven by incremental ~$400M Financing Needs ratebase growth; additional equity needs of ~$400M through 2019 incremental equity needs through 2019Tax Cuts and Jobs Act results in lower customer bills and higher ratebase growthTax reform implementation is subject to CPUC and FERC approval.(1) Timing will be dependent on claims payments associated with the Northern California wildfires.See the Forward Looking Statements for factors that could cause actual results to differ materially from the guidance presented and underlying assumptions.29
|
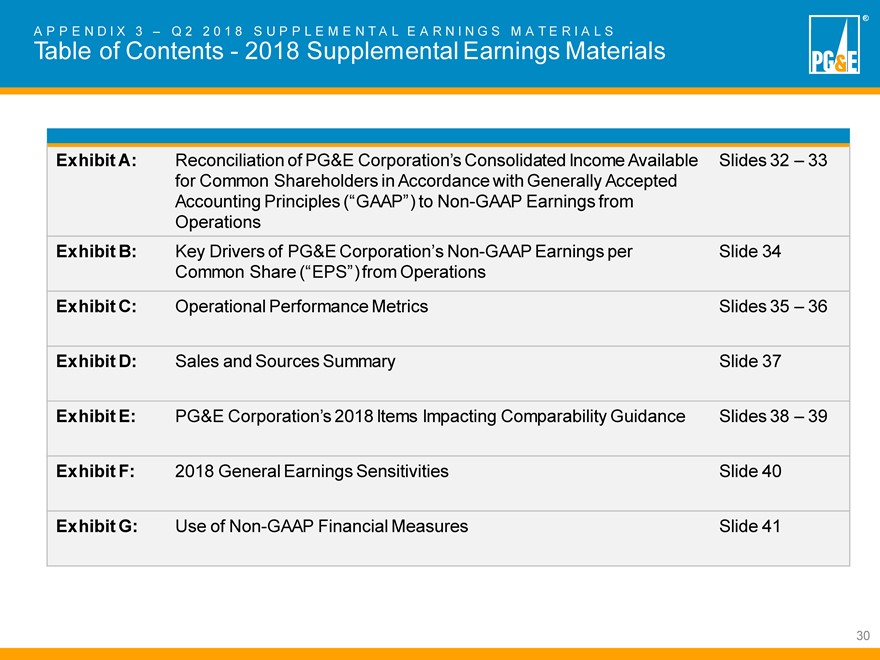
A P P E N D I X 3 ? Q 2 2 0 1 8 S U P P L E M E N T A L E A R N I N G S M A T E R I A L STable of Contents—2018 Supplemental Earnings MaterialsExhibit A: Reconciliation of PG&E Corporation?s Consolidated Income Available Slides 32 ? 33 for Common Shareholders in Accordance with Generally Accepted Accounting Principles (?GAAP?) to Non-GAAP Earnings from Operations Exhibit B: Key Drivers of PG&E Corporation?s Non-GAAP Earnings per Slide 34 Common Share (?EPS?) from Operations Exhibit C: Operational Performance Metrics Slides 35 ? 36 Exhibit D: Sales and Sources Summary Slide 37 Exhibit E: PG&E Corporation?s 2018 Items Impacting Comparability Guidance Slides 38 ? 39 Exhibit F: 2018 General Earnings Sensitivities Slide 40 Exhibit G: Use of Non-GAAP Financial Measures Slide 4130
|
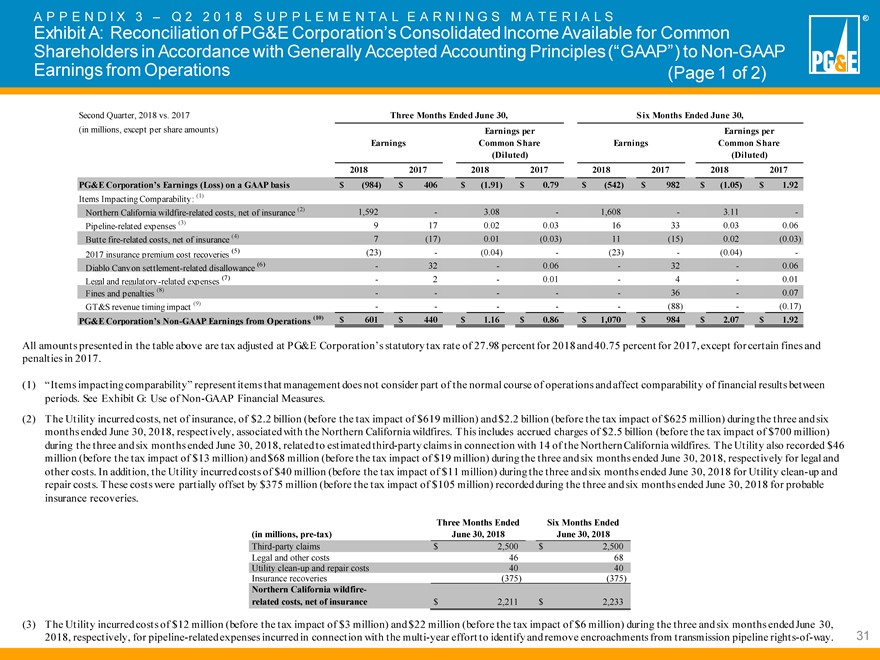
Exhibit A: D IReconciliation X 3 ‘ Q 2 2 0 1 of8 PG&E S U P P Corporation’s L E M E N T A L Consolidated E A R N I N G S Income M A T E R Available I A L S for Common Shareholders in Accordance with Generally Accepted Accounting Principles (‘GAAP‘) to Non-GAAP Earnings from Operations (Page 1 of 2)Second Quarter, 2018 vs. 2017 Three Months Ended June 30, Six Months Ended June 30,(in millions, except per share amounts) Earnings per Earnings per Earnings Common Share Earnings Common Share (Diluted) (Diluted) 2018 2017 2018 2017 2018 2017 2018 2017 PG&E Corporation‘s Earnings (Loss) on a GAAP basis $ (984) $ 406 $ (1.91) $ 0.79 $ (542) $ 982 $ (1.05) $ 1.92Items Impacting Comparability: (1)Northern California wildfire-related costs, net of insurance (2) 1,592 — 3.08 — 1,608 — 3.11 -Pipeline-related expenses (3) 9 17 0.02 0.03 16 33 0.03 0.06 Butte fire-related costs, net of insurance (4) 7 (17) 0.01 (0.03) 11 (15) 0.02 (0.03) 2017 insurance premium cost recoveries (5) (23) — (0.04) — (23) — (0.04) -Diablo Canyon settlement-related disallowance (6) — 32 — 0.06 — 32 — 0.06 Legal and regulatory-related expenses (7) — 2 — 0.01 — 4 — 0.01 Fines and penalties (8) — — — — — 36 — 0.07 GT&S revenue timing impact (9) — — — — — (88) — (0.17)PG&E Corporation‘s Non-GAAP Earnings from Operations (10) $ 601 $ 440 $ 1.16 $ 0.86 $ 1,070 $ 984 $ 2.07 $ 1.92All amounts presented in the table above are tax adjusted at PG&E Corporation‘s statutory tax rate of 27.98 percent for 2018 and40.75 percent for 2017, except for certain fines and penalties in 2017.(1) ‘Items impacting comparability‘ represent items that management does not consider part of the normal course of operations andaffect comparability of financial results between periods. See Exhibit G: Use of Non-GAAP Financial Measures.(2) The Utility incurred costs, net of insurance, of $2.2 billion (before the tax impact of $619 million) and $2.2 billion (before the tax impact of $625 million) during the three and six months ended June 30, 2018, respectively, associated with the Northern California wildfires. This includes accrued charges of $2.5 billion (before the tax impact of $700 million) during the three and six months ended June 30, 2018, related to estimated third-party claims in connection with 14 of the Northern California wildfires. The Utility also recorded $46 million (before the tax impact of $13 million) and $68 million (before the tax impact of $19 million) during the three and six months ended June 30, 2018, respectively for legal and other costs. In addition, the Utility incurred costs of $40 million (before the tax impact of $11 million) during the three and six months ended June 30, 2018 for Utility clean-up and repair costs. These costs were partially offset by $375 million (before the tax impact of $105 million) recorded during the three and six months ended June 30, 2018 for probable insurance recoveries. Three Months Ended Six Months Ended (in millions, pre-tax) June 30, 2018 June 30, 2018 Third-party claims $ 2,500 $ 2,500 Legal and other costs 46 68 Utility clean-up and repair costs 40 40 Insurance recoveries (375) (375) Northern California wildfire- related costs, net of insurance $ 2,211 $ 2,233 (3) The Utility incurred costs of $12 million (before the tax impact of $3 million) and $22 million (before the tax impact of $6 million) during the three and six months ended June 30, 2018, respectively, for pipeline-related expenses incurred in connection with the multi-year effort to identify and remove encroachments from transmission pipeline rights-of-way.31
|
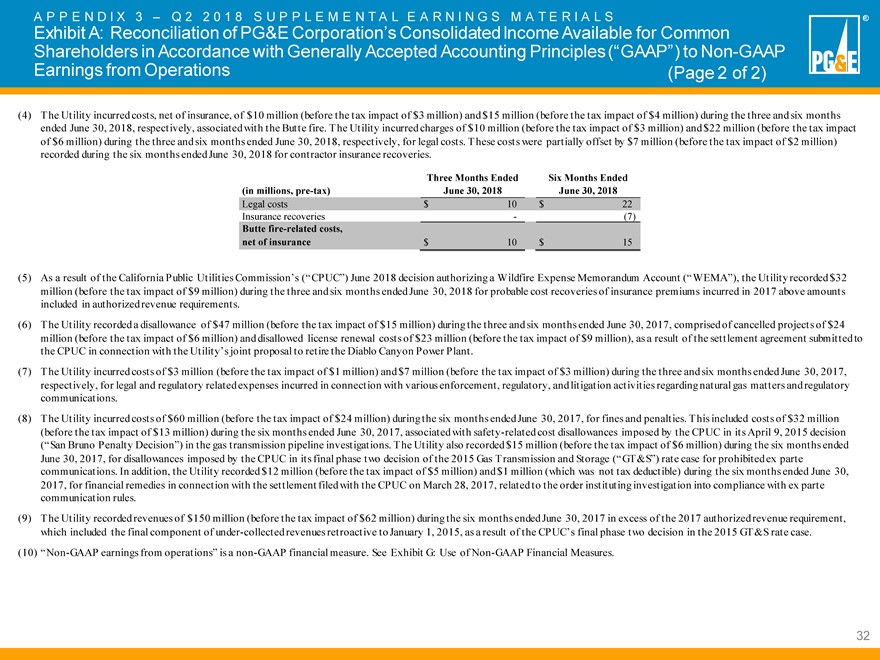
Exhibit A: D IReconciliation X 3 ? Q 2 2 0 1 of8 PG&E S U P P Corporation?s L E M E N T A L Consolidated E A R N I N G S Income M A T E R Available I A L S for Common Shareholders in Accordance with Generally Accepted Accounting Principles (?GAAP?) to Non-GAAP Earnings from Operations (Page 2 of 2)(4) The Utility incurred costs, net of insurance, of $10 million (before the tax impact of $3 million) and $15 million (before the tax impact of $4 million) during the three and six months ended June 30, 2018, respectively, associated with the Butte fire. The Utility incurred charges of $10 million (before the tax impact of $3 million) and $22 million (before the tax impact of $6 million) during the three and six months ended June 30, 2018, respectively, for legal costs. These costs were partially offset by $7 million (before the tax impact of $2 million) recorded during the six months ended June 30, 2018 for contractor insurance recoveries. Three Months Ended Six Months Ended (in millions, pre-tax) June 30, 2018 June 30, 2018 Legal costs $ 10 $ 22 Insurance recoveries — (7) Butte fire-related costs, net of insurance $ 10 $ 15 (5) As a result of the California Public Utilities Commission?s (?CPUC?) June 2018 decision authorizing a Wildfire Expense Memorandum Account (?WEMA?), the Utility recorded $32 million (before the tax impact of $9 million) during the three and six months ended June 30, 2018 for probable cost recoveries of insurance premiums incurred in 2017 above amounts included in authorized revenue requirements.(6) The Utility recorded a disallowance of $47 million (before the tax impact of $15 million) during the three and six months ended June 30, 2017, comprised of cancelled projects of $24 million (before the tax impact of $6 million) and disallowed license renewal costs of $23 million (before the tax impact of $9 million), as a result of the settlement agreement submitted to the CPUC in connection with the Utility?s joint proposal to retire the Diablo Canyon Power Plant.(7) The Utility incurred costs of $3 million (before the tax impact of $1 million) and $7 million (before the tax impact of $3 million) during the three and six months ended June 30, 2017, respectively, for legal and regulatory related expenses incurred in connection with various enforcement, regulatory, and litigation activities regarding natural gas matters and regulatory communications. (8) The Utility incurred costs of $60 million (before the tax impact of $24 million) during the six months ended June 30, 2017, for fines and penalties. This included costs of $32 million (before the tax impact of $13 million) during the six months ended June 30, 2017, associated with safety-related cost disallowances imposed by the CPUC in its April 9, 2015 decision (?San Bruno Penalty Decision?) in the gas transmission pipeline investigations. The Utility also recorded $15 million (before the tax impact of $6 million) during the six months ended June 30, 2017, for disallowances imposed by the CPUC in its final phase two decision of the 2015 Gas Transmission and Storage (?GT&S?) rate case for prohibited ex parte communications. In addition, the Utility recorded $12 million (before the tax impact of $5 million) and $1 million (which was not tax deductible) during the six months ended June 30, 2017, for financial remedies in connection with the settlement filed with the CPUC on March 28, 2017, related to the order instituting investigation into compliance with ex parte communication rules. (9) The Utility recorded revenues of $150 million (before the tax impact of $62 million) during the six months ended June 30, 2017 in excess of the 2017 authorized revenue requirement, which included the final component of under-collected revenues retroactive to January 1, 2015, as a result of the CPUC?s final phase two decision in the 2015 GT&S rate case. (10) ?Non-GAAP earnings from operations? is a non-GAAP financial measure. See Exhibit G: Use of Non-GAAP Financial Measures.32
|
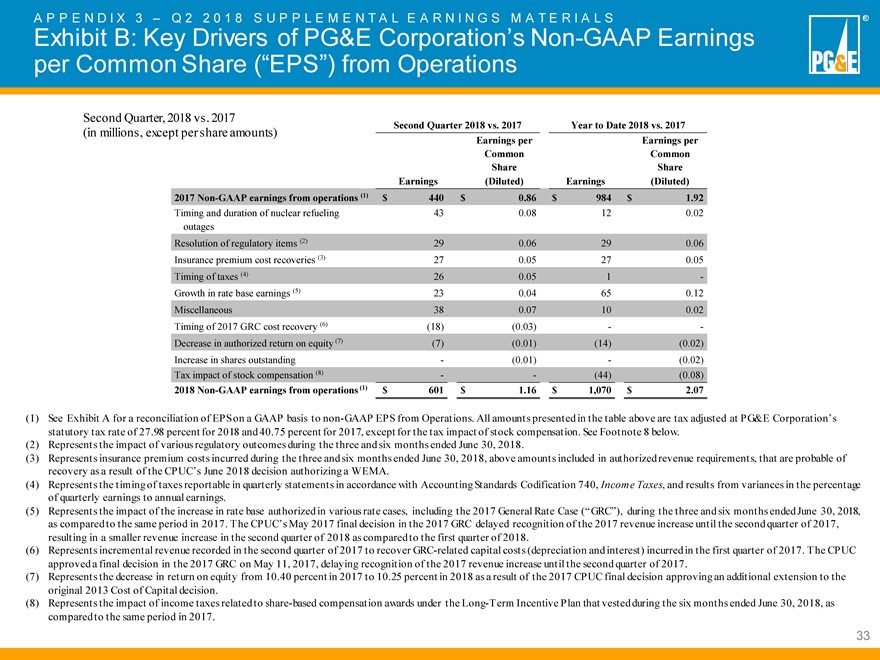
A P P E N D I X 3 ? Q 2 2 0 1 8 S U P P L E M E N T A L E A R N I N G S M A T E R I A L SExhibit B: Key Drivers of PG&E Corporation?s Non-GAAP Earnings per Common Share (?EPS?) from OperationsSecond Quarter, 2018 vs. 2017Second Quarter 2018 vs. 2017 Year to Date 2018 vs. 2017 (in millions, except per share amounts) Earnings per Earnings per Common Common Share Share Earnings (Diluted) Earnings (Diluted) 2017 Non-GAAP earnings from operations (1) $ 440 $ 0.86 $ 984 $ 1.92 Timing and duration of nuclear refueling 43 0.08 12 0.02 outages Resolution of regulatory items (2) 29 0.06 29 0.06 Insurance premium cost recoveries (3) 27 0.05 27 0.05 Timing of taxes (4) 26 0.05 1 —Growth in rate base earnings (5) 23 0.04 65 0.12 Miscellaneous 38 0.07 10 0.02 Timing of 2017 GRC cost recovery (6) (18) (0.03) ——Decrease in authorized return on equity (7) (7) (0.01) (14) (0.02) Increase in shares outstanding — (0.01) — (0.02) Tax impact of stock compensation (8) — — (44) (0.08) 2018 Non-GAAP earnings from operations (1) $ 601 $ 1.16 $ 1,070 $ 2.07 (1) See Exhibit A for a reconciliation of EPS on a GAAP basis to non-GAAP EPS from Operations. All amounts presented in the table above are tax adjusted at PG&E Corporation?s statutory tax rate of 27.98 percent for 2018 and 40.75 percent for 2017, except for the tax impact of stock compensation. See Footnote 8 below. (2) Represents the impact of various regulatory outcomes during the three and six months ended June 30, 2018. (3) Represents insurance premium costs incurred during the three and six months ended June 30, 2018, above amounts included in authorized revenue requirements, that are probable of recovery as a result of the CPUC?s June 2018 decision authorizing a WEMA. (4) Represents the timing of taxes reportable in quarterly statements in accordance with Accounting Standards Codification 740, Income Taxes, and results from variances in the percentage of quarterly earnings to annual earnings. (5) Represents the impact of the increase in rate base authorized in various rate cases, including the 2017 General Rate Case (?GRC?), during the three and six months ended June 30, 2018, as compared to the same period in 2017. The CPUC?s May 2017 final decision in the 2017 GRC delayed recognition of the 2017 revenue increase until the second quarter of 2017, resulting in a smaller revenue increase in the second quarter of 2018 as compared to the first quarter of 2018. (6) Represents incremental revenue recorded in the second quarter of 2017 to recover GRC-related capital costs (depreciation and interest) incurred in the first quarter of 2017. The CPUC approved a final decision in the 2017 GRC on May 11, 2017, delaying recognition of the 2017 revenue increase until the second quarter of 2017. (7) Represents the decrease in return on equity from 10.40 percent in 2017 to 10.25 percent in 2018 as a result of the 2017 CPUC final decision approving an additional extension to the original 2013 Cost of Capital decision. (8) Represents the impact of income taxes related to share-based compensation awards under the Long-Term Incentive Plan that vested during the six months ended June 30, 2018, as compared to the same period in 2017. 33
|
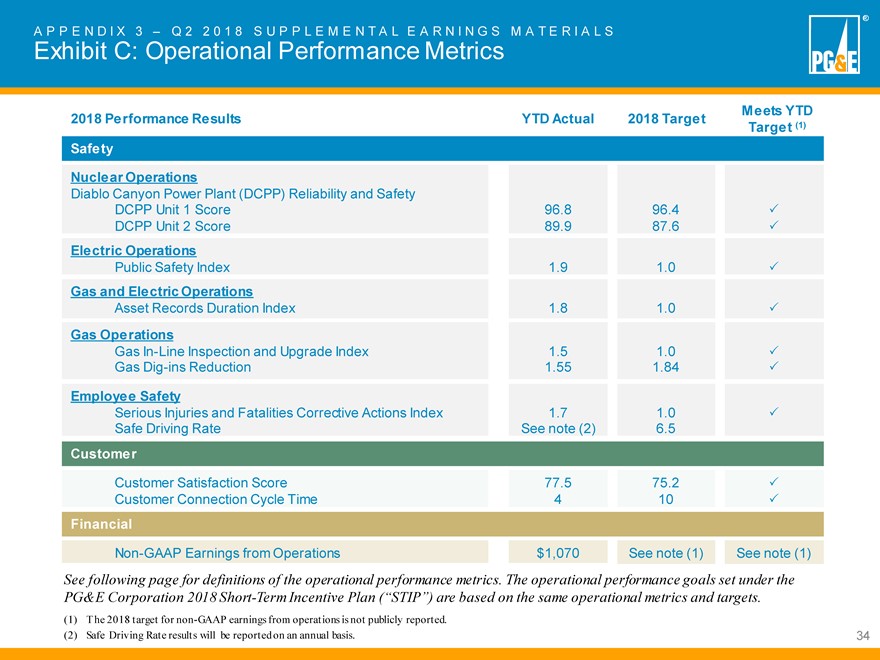
A P P E N D I X 3 ? Q 2 2 0 1 8 S U P P L E M E N T A L E A R N I N G S M A T E R I A L SExhibit C: Operational Performance MetricsMeets YTD 2018 Performance Results YTD Actual 2018 Target Target (1) Safety Nuclear OperationsDiablo Canyon Power Plant (DCPP) Reliability and SafetyDCPP Unit 1 Score 96.8 96.4 DCPP Unit 2 Score 89.9 87.6 Electric OperationsPublic Safety Index 1.9 1.0 Gas and Electric OperationsAsset Records Duration Index 1.8 1.0 Gas OperationsGas In-Line Inspection and Upgrade Index 1.5 1.0 Gas Dig-ins Reduction 1.55 1.84 Employee SafetySerious Injuries and Fatalities Corrective Actions Index 1.7 1.0 Safe Driving Rate See note (2) 6.5CustomerCustomer Satisfaction Score 77.5 75.2 Customer Connection Cycle Time 4 10 FinancialNon-GAAP Earnings from Operations $1,070 See note (1) See note (1)See following page for definitions of the operational performance metrics. The operational performance goals set under the PG&E Corporation 2018 Short-Term Incentive Plan (?STIP?) are based on the same operational metrics and targets.(1) The 2018 target for non-GAAP earnings from operations is not publicly reported. (2) Safe Driving Rate results will be reported on an annual basis. 34
|
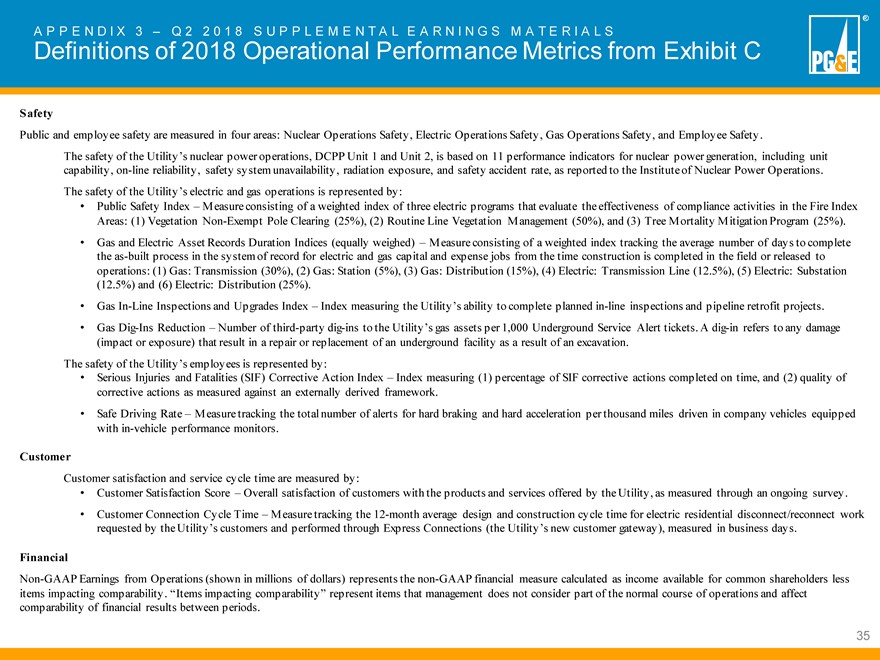
A P P E N D I X 3 ? Q 2 2 0 1 8 S U P P L E M E N T A L E A R N I N G S M A T E R I A L SDefinitions of 2018 Operational Performance Metrics from Exhibit CSafetyPublic and employee safety are measured in four areas: Nuclear Operations Safety, Electric Operations Safety, Gas Operations Safety, and Employee Safety.The safety of the Utility?s nuclear power operations, DCPP Unit 1 and Unit 2, is based on 11 performance indicators for nuclear power generation, including unit capability, on-line reliability, safety system unavailability, radiation exposure, and safety accident rate, as reported to the Institute of Nuclear Power Operations. The safety of the Utility?s electric and gas operations is represented by: Public Safety Index ? Measure consisting of a weighted index of three electric programs that evaluate the effectiveness of compliance activities in the Fire Index Areas: (1) Vegetation Non-Exempt Pole Clearing (25%), (2) Routine Line Vegetation Management (50%), and (3) Tree Mortality Mitigation Program (25%). Gas and Electric Asset Records Duration Indices (equally weighed) ? Measure consisting of a weighted index tracking the average number of days to complete the as-built process in the system of record for electric and gas capital and expense jobs from the time construction is completed in the field or released to operations: (1) Gas: Transmission (30%), (2) Gas: Station (5%), (3) Gas: Distribution (15%), (4) Electric: Transmission Line (12.5%), (5) Electric: Substation (12.5%) and (6) Electric: Distribution (25%). Gas In-Line Inspections and Upgrades Index ? Index measuring the Utility?s ability to complete planned in-line inspections and pipeline retrofit projects. Gas Dig-Ins Reduction ? Number of third-party dig-ins to the Utility?s gas assets per 1,000 Underground Service Alert tickets. A dig-in refers to any damage (impact or exposure) that result in a repair or replacement of an underground facility as a result of an excavation.The safety of the Utility?s employees is represented by: Serious Injuries and Fatalities (SIF) Corrective Action Index ? Index measuring (1) percentage of SIF corrective actions completed on time, and (2) quality of corrective actions as measured against an externally derived framework. Safe Driving Rate ? Measure tracking the total number of alerts for hard braking and hard acceleration per thousand miles driven in company vehicles equipped with in-vehicle performance monitors. CustomerCustomer satisfaction and service cycle time are measured by: Customer Satisfaction Score ? Overall satisfaction of customers with the products and services offered by the Utility, as measured through an ongoing survey. Customer Connection Cycle Time ? Measure tracking the 12-month average design and construction cycle time for electric residential disconnect/reconnect work requested by the Utility?s customers and performed through Express Connections (the Utility?s new customer gateway), measured in business days.FinancialNon-GAAP Earnings from Operations (shown in millions of dollars) represents the non-GAAP financial measure calculated as income available for common shareholders less items impacting comparability. ?Items impacting comparability? represent items that management does not consider part of the normal course of operations and affect comparability of financial results between periods.35
|
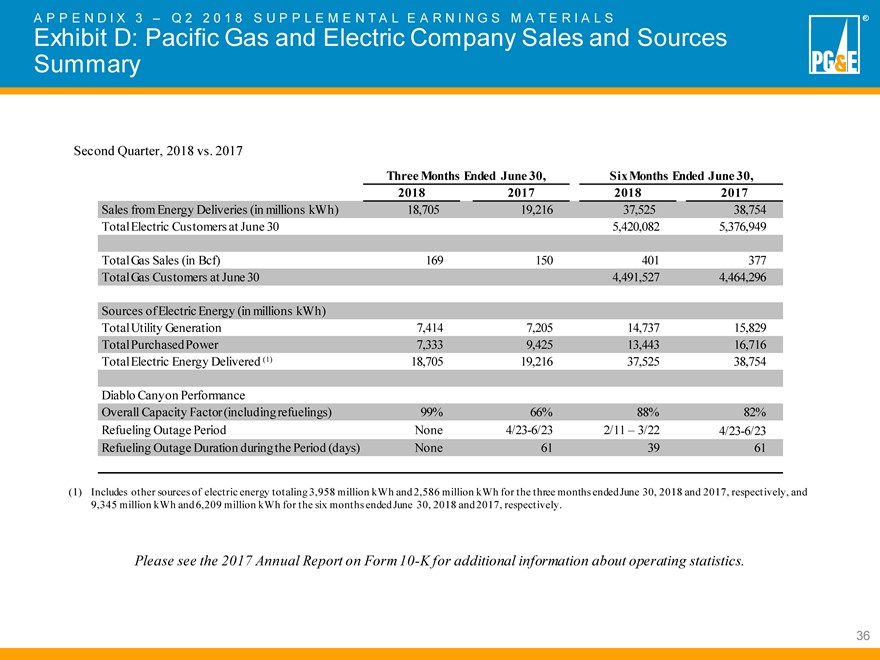
D I X 3 ? Q 2 2 0 1 8 S U P P L E M E N T A L E A R N I N G S M A T E R I A L SExhibit D: Pacific Gas and Electric Company Sales and Sources SummarySecond Quarter, 2018 vs. 2017Three Months Ended June 30, Six Months Ended June 30, 2018 2017 2018 2017Sales from Energy Deliveries (in millions kWh) 18,705 19,216 37,525 38,754 Total Electric Customers at June 30 5,420,082 5,376,949Total Gas Sales (in Bcf) 169 150 401 377 Total Gas Customers at June 30 4,491,527 4,464,296Sources of Electric Energy (in millions kWh)Total Utility Generation 7,414 7,205 14,737 15,829 Total Purchased Power 7,333 9,425 13,443 16,716 Total Electric Energy Delivered (1) 18,705 19,216 37,525 38,754Diablo Canyon PerformanceOverall Capacity Factor (including refuelings) 99% 66% 88% 82% Refueling Outage Period None 4/23-6/23 2/11 ? 3/22 4/23-6/23 Refueling Outage Duration during the Period (days) None 61 39 61(1) Includes other sources of electric energy totaling 3,958 million kWh and 2,586 million kWh for the three months ended June 30, 2018 and 2017, respectively, and 9,345 million kWh and 6,209 million kWh for the six months ended June 30, 2018 and 2017, respectively.Please see the 2017 Annual Report on Form 10-K for additional information about operating statistics.36
|
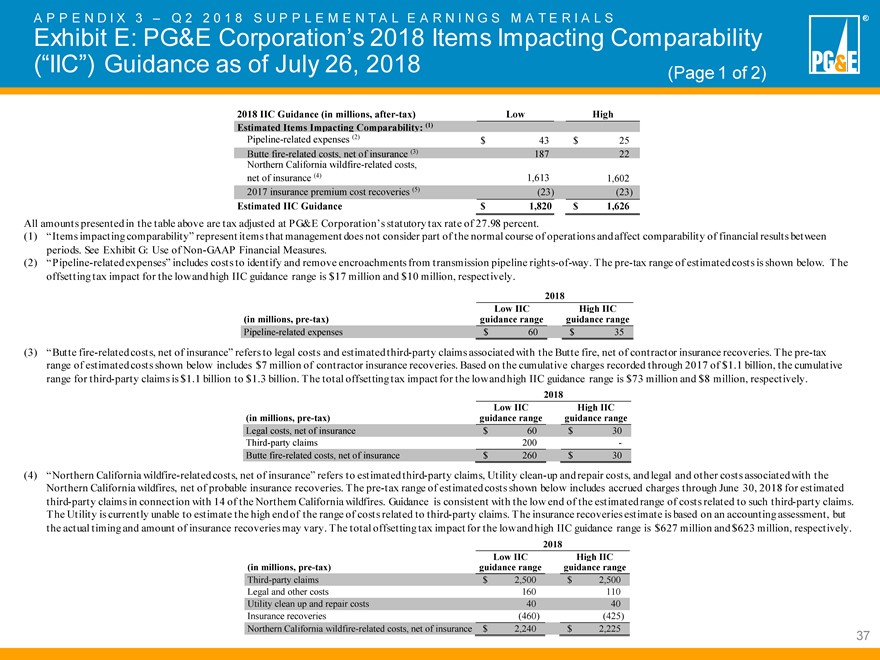
D I X 3 ? Q 2 2 0 1 8 S U P P L E M E N T A L E A R N I N G S M A T E R I A L SExhibit E: PG&E Corporation?s 2018 Items Impacting Comparability (?IIC?) Guidance as of July 26, 2018 (Page 1 of 2)2018 IIC Guidance (in millions, after-tax) Low High Estimated Items Impacting Comparability: (1) Pipeline-related expenses (2) $ 43 $ 25 Butte fire-related costs, net of insurance (3) 187 22 Northern California wildfire-related costs, (4) net of insurance 1,613 1,602 2017 insurance premium cost recoveries (5) (23) (23) Estimated IIC Guidance $ 1,820 $ 1,626 All amounts presented in the table above are tax adjusted at PG&E Corporation?s statutory tax rate of 27.98 percent. (1) ?Items impacting comparability? represent items that management does not consider part of the normal course of operations andaffect comparability of financial results between periods. See Exhibit G: Use of Non-GAAP Financial Measures.(2) ?Pipeline-related expenses? includes costs to identify and remove encroachments from transmission pipeline rights-of-way. The pre-tax range of estimated costs is shown below. The offsetting tax impact for the low and high IIC guidance range is $17 million and $10 million, respectively. 2018 (in millions, pre-tax) guidance Low IIC range guidance High IIC range Pipeline-related expenses $ 60 $ 35 (3) ?Butte fire-related costs, net of insurance? refers to legal costs and estimated third-party claims associated with the Butte fire, net of contractor insurance recoveries. The pre-tax range of estimated costs shown below includes $7 million of contractor insurance recoveries. Based on the cumulative charges recorded through 2017 of $1.1 billion, the cumulative range for third-party claims is $1.1 billion to $1.3 billion. The total offsetting tax impact for the low and high IIC guidance range is $73 million and $8 million, respectively. 2018 (in millions, pre-tax) guidance Low IIC range guidance High IIC range Legal costs, net of insurance $ 60 $ 30 Third-party claims 200 —Butte fire-related costs, net of insurance $ 260 $ 30 (4) ?Northern California wildfire-related costs, net of insurance? refers to estimated third-party claims, Utility clean-up and repair costs, and legal and other costs associated with the Northern California wildfires, net of probable insurance recoveries. The pre-tax range of estimated costs shown below includes accrued charges through June 30, 2018 for estimated third-party claims in connection with 14 of the Northern California wildfires. Guidance is consistent with the low end of the estimated range of costs related to such third-party claims.The Utility is currently unable to estimate the high end of the range of costs related to third-party claims. The insurance recoveries estimate is based on an accounting assessment, but the actual timing and amount of insurance recoveries may vary. The total offsetting tax impact for the low and high IIC guidance range is $627 million and $623 million, respectively. 2018 (in millions, pre-tax) guidance Low IIC range guidance High IIC range Third-party claims $ 2,500 $ 2,500 Legal and other costs 160 110 Utility clean up and repair costs 40 40 Insurance recoveries (460) (425) Northern California wildfire-related costs, net of insurance $ 2,240 $ 2,225 37
|
APPENDIX 3 – Q2 2018 SUPPLEMENTAL EARNINGS
MATERIALS
Exhibit E: PG&E Corporation’s 2018 Items Impacting Comparability (“IIC”) Guidance as of July 26, 2018 (Page 2 of 2) (5) “2017
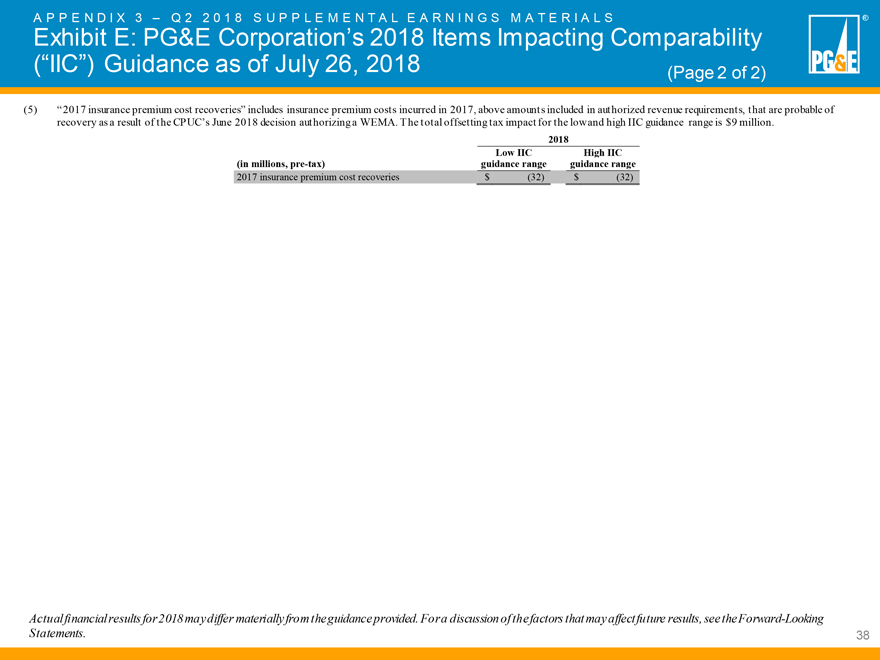
insurance premium cost recoveries” includes insurance premium costs incurred in 2017, above amounts included in authorized revenue requirements, that are probable of recovery as a result of the CPUC’s June 2018 decision authorizing a WEMA.
The total offsetting tax impact for the low and high IIC guidance range is $9 million.
| 2018 | ||||||||
| (in millions, pre-tax) | |
Low IIC guidance range |
|
|
High IIC guidance range |
| ||
| 2017 insurance premium cost recoveries | $ | (32 | ) | $ | (32 | ) | ||
Actual financial results for 2018 may differ materially from the guidance provided. For a discussion of the factors that may affect future results, see the Forward-Looking Statements. PG&E®
|
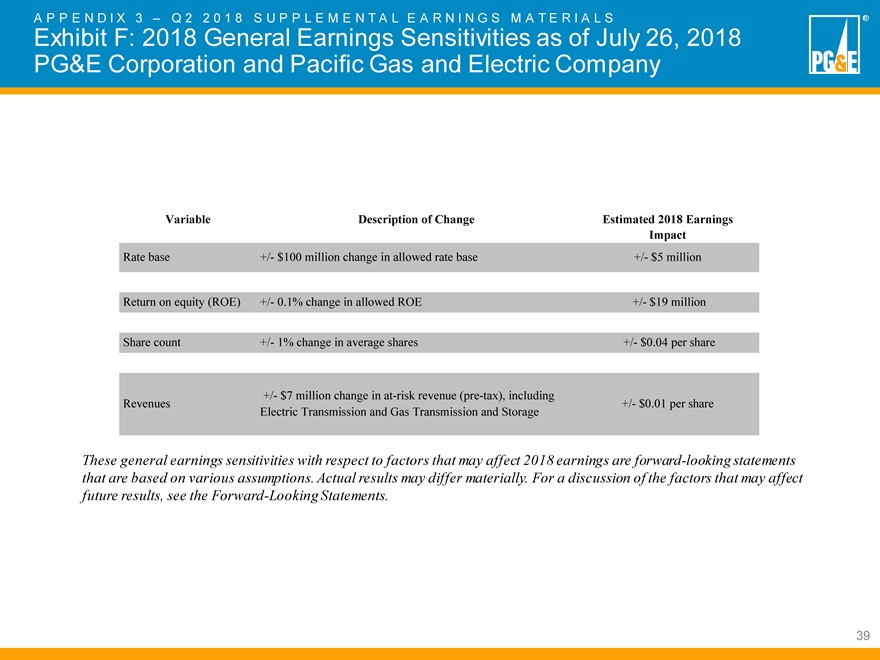
D I X 3 ? Q 2 2 0 1 8 S U P P L E M E N T A L E A R N I N G S M A T E R I A L SExhibit F: 2018 General Earnings Sensitivities as of July 26, 2018 PG&E Corporation and Pacific Gas and Electric CompanyVariable Description of Change Estimated 2018 Earnings Impact Rate base +/- $100 million change in allowed rate base +/- $5 million Return on equity (ROE) +/- 0.1% change in allowed ROE +/- $19 million Share count +/- 1% change in average shares +/- $0.04 per share +/- $7 million change in at-risk revenue (pre-tax), including Revenues +/- $0.01 per share Electric Transmission and Gas Transmission and Storage These general earnings sensitivities with respect to factors that may affect 2018 earnings are forward-looking statements that are based on various assumptions. Actual results may differ materially. For a discussion of the factors that may affect future results, see the Forward-Looking Statements.39
|
D I X 3 ? Q 2 2 0 1 8 S U P P L E M E N T A L E A R N I N G S M A T E R I A L SExhibit G: Use of Non-GAAP Financial MeasuresPG&E Corporation and Pacific Gas and Electric Company: Use of Non-GAAP Financial MeasuresPG&E Corporation discloses historical financial results and provides guidance based on ?non-GAAP earnings from operations? in order to provide a measure that allows investors to compare the underlying financial performance of the business from one period to another, exclusive of items impacting comparability. ?Non-GAAP earnings from operations? is a non-GAAP financial measure and is calculated as income available for common shareholders less items impacting comparability. ?Items impacting comparability? represent items that management does not consider part of the normal course of operations and affect comparability of financial results between periods, including Northern California wildfire-related costs, net of insurance, pipeline-related expenses, Butte fire-related costs, net of insurance, 2017 insurance premium cost recovery, Diablo Canyon settlement-related disallowance, legal and regulatory-related expenses, fines and penalties, and 2015 GT&S rate case revenue timing impact. PG&E Corporation uses non-GAAP earnings from operations to understand and compare operating results across reporting periods for various purposes including internal budgeting and forecasting, short- and long-term operating planning, and employee incentive compensation. PG&E Corporation believes that non-GAAP earnings from operations provide additional insight into the underlying trends of the business, allowing for a better comparison against historical results and expectations for future performance. Non-GAAP earnings from operations are not a substitute or alternative for GAAP measures such as consolidated income available for common shareholders and may not be comparable to similarly titled measures used by other companies.40

|
PPEN D I X 4 ? L E A D E R S H I P B I O S Geisha J. WilliamsGeisha J. WilliamsChief Executive Officer (CEO) and President PG&E CorporationGeisha J. Williams was elected CEO and President of PG&E Corporation, effective March 1, 2017. Williams has more than three decades of experience in the utility industry.Williams and her team are responsible for the end-to-end delivery of safe, reliable, affordable and clean electricity and gas to 16 million people in northern and central California. Her focus on renewables integration, grid modernization and smart grid technologies has resulted in PG&E customers benefitting from the best electric reliability in company history while also receiving energy that is nearly 70 percent greenhouse gas free. Williams previously was the Utility?s President, Electric (August 2015 ? February 2017) and Executive Vice President, Electric Operations (June 2011 to August 2015). In her role as President, Williams led all aspects of the Utility?s electric business, including power generation, nuclear operations, transmission, distribution, and substation operations, asset management and strategy, energy procurement and customer care.Before joining PG&E, Williams worked at Florida Power and Light (FPL) for 24 years. She served in a number of roles during her tenure there including Vice President of Power Systems, Electric Distribution. In this role, she was responsible for all aspects of the electric distribution infrastructure serving FPL?s 4.4 million customers, including asset management and planning, engineering, construction, maintenance and restoration. During her time at FPL, she considers the company?s restoration and recovery efforts in response to seven hurricanes that made landfall in a 15-month period as one of her proudest accomplishments.Williams is a director at the Edison Electric Institute, the Institute of Nuclear Power Operations, and the Association of Edison Illuminating Companies. She also serves as the board chair for the Center for Energy Workforce Development and is an active participant in Executive Women in Energy.Her involvement with the community includes serving as a trustee of the California Academy of Sciences and the University of Miami. She is a five-time recipient of the Bay Area Most Influential Women in Business Award, and in 2014 she was honored with Leadership California?s TrailblazerAward.Williams holds a bachelor’s degree in engineering from the University of Miami and a master?s degree in business administration from Nova Southeastern University.She lives in the BayArea with her family.41
|
PPEN D I X 4 ? L E A D E R S H I P B I O S Nick Stavropoulos Nick StavropoulosPresident & Chief Operating Officer Pacific Gas and Electric CompanyNick Stavropoulos serves as President and Chief Operating Officer of Pacific Gas and Electric Company and has more than 35 years of experience in the U.S. and international energy industry. He oversees a diverse workforce of more than 23,000 employees across electric, gas, generation and nuclear operations as well as corporate support functions. He was promoted to his current role of leading the utility in March 2017.Today, he and his team are responsible for the end-to-end delivery of safe, reliable, affordable and clean electric and gas service to 16 million people across PG&E’s 70,000 square mile service area in northern and central California. PG&E?s energy portfolio is one of the cleanest in the nation with nearly 80 percent of its portfolio coming from carbon-free energy sources. Stavropoulos is a passionate advocate for workplace safety and safety culture. Under his leadership, PG&E?s gas business has earned or qualified for international certifications including ISO 55000; PAS 55001; API RP 1173; and RC 14001. PG&E is the only North American utility to currently hold these third party certifications. Prior to joining PG&E, Stavropoulos served as Executive Vice President and Chief Operating Officer for National Grid, an electricity and natural gas delivery company serving nearly seven million customers in the Northeast United States. As COO, he was responsible for all aspects of its U.S. gas distribution business. Throughout his career, he held a number of senior leadership positions with successive levels of responsibility, including Chief Financial Officer, at Keyspan?s predecessor companies ? Colonial Gas Company and Boston Gas.Stavropoulos is an internationally sought after speaker on the topics of leadership and safety culture. In recent years, he has delivered keynote speeches at the International Atomic Energy Agency; National Safety Council?s Campbell Institute; Institute of Engineering and Technology/The Institute of Asset Management Conference; International Safety Culture Symposium; and Global Safety Culture Conference.He is a member of the Board of Directors for Pacific Gas & Electric Company, American Gas Association, Gas Technology Institute and National Safety Council. He holds a bachelor’s degree in accounting from Bentley College and a master?s degree in business administration from Babson College. He also sits on the board of his alma mater Bentley University and has served on multiple public and not-for-profit boards including chairing audit committees.42

|
PPEN D I X 4 ? L E A D E R S H I P B I O S Jason P. WellsJason P. WellsSenior Vice President and Chief Financial Officer PG&E Corporation Jason P. Wells is Senior Vice President and Chief Financial Officer for PG&E Corporation. Wells oversees the financial activities of the company including accounting, treasury, tax, risk, business and financial planning, and investor relations. Wells began his career at PricewaterhouseCoopers, LLC, where he was most recently a senior manager. In 2007, Wells joined PG&E as the Director of technical accounting and was promoted to Senior Director and Assistant Controller of corporate accounting in 2008. In 2011, Wells became Vice President, Finance. He assumed his current position on January 2016.He earned his bachelor’s and master’s degrees in accounting from the University of Florida. Wells is a Certified Public Accountant in the state of Florida. He currently serves as the Treasurer and on the board of Habitat for Humanity Greater San Francisco.43
|
PPEN D I X 4 ? L E A D E R S H I P B I O S John R. SimonJohn R. SimonExecutive Vice President and General Counsel PG&E CorporationJohn R. Simon serves as Executive Vice President & General Counsel for San-Francisco-based PG&E Corporation. In his role, he oversees Law; Marketing and Communications; Land and Environmental Management; and Enterprise Records Information Management. He has held his current role since March 1, 2017.John joined PG&E in 2007 and has held several senior roles within the company including Executive Vice President, Corporate Services and Human Resources and Senior Vice President, Human Resources.Before joining PG&E, John worked for TeleTech Holdings, Inc., a global provider of customer care technology and services, where he held leadership roles in legal and human resources including Executive Vice President, Global Human Capital.John holds a bachelor’s degree from Colorado College and a law degree from Georgetown University. Following law school and a judicial clerkship with United States District Judge William Skretny, he litigated commercial cases in state and federal courts, first with Proskauer Rose in Washington, D.C., and later with Hallenbeck Lascell, in Rochester, New York.John is an active member of the Bar of New York, registered as in house counsel in California, and inactive member of the Bars of Illinois and Washington, D.C. He serves on the Board of Trustees of the Marine Mammal Center in Sausalito and the California Minority Counsel Program in Sausalito and California Minority Counsel Program in San Francisco.44
|
PPEN D I X 4 ? L E A D E R S H I P B I O S Patrick M. HoganPatrick M. HoganSenior Vice President of Electric Operations Pacific Gas and Electric CompanyPatrick M. Hogan is Senior Vice President of Electric Operations at Pacific Gas and Electric Company.Hogan oversees PG&E’s electric transmission and distribution system, which delivers safe and reliable energy to more than 16 million people throughout Northern and Central California. In addition to his electric responsibilities, Hogan has enterprise-wide responsibility for PG&E?s Transportation Services organization, managing over 14,000 vehicles and pieces of equipment.Prior to his promotion to Senior Vice President of Electric Operations in 2016, Hogan served as Vice President of Electric Strategy & Asset Management where he oversawthe company’s electric transmission and distribution assets. Hogan also led the development and deployment of technology into PG&E’selectric system.Before joining PG&E in 2013, Hogan held leadership and officer roles in transmission, distribution, operations, engineering and asset management at British Columbia Hydro, National Grid, and KeySpan.Originally from New York, Hogan holds a bachelor’s and master’s degree in electrical engineering from Manhattan College and a master’s degree in business administration from Hofstra University. His community involvement includes serving on the board of the San Francisco Ballet, and he currently resides in San Francisco.45
|
PPEN D I X 4 ? L E A D E R S H I P B I O S Jesus Soto Jr.Jesus Soto Jr.Senior Vice President, Gas Operations Pacific Gas and Electric CompanyJesus Soto Jr. is the Senior Vice President of Gas Operations for Pacific Gas and Electric Company. He is responsible for overseeing and executing the day-to-day operations of the second largest natural gas system in the United States. PG&E’s natural gas system provides safe, reliable, affordable and clean natural gas service to 16 million people in northern and central California.Soto is passionate about public and employee safety. Through Soto?s leadership, PG&E became the first utility in the United States to earn several notable third-party certifications around pipeline safety and asset management, including the ISO 55001:2014 and PAS 55-1:2008 international certifications for the company’s enhancements in gas asset management; meet the rigor of the industry standard on pipeline safety management system from the American Petroleum Institute Recommended Practice (API RP) 1173; and certified to the chemical industry?s RC14001: 2013 management system standard.Soto has also led PG&E?s Gas Operations organization to develop state-of-the-art technologies aimed at enhancing pipeline safety and reliability, including leak detection technology that is 1,000 times more sensitive than conventional leak detection tools. Soto’s commitment to safety has led to a significant reduction in the time it takes PG&E to respond to gas odor calls achieving top decile industry performance.Before joining PG&E in May 2012, Soto served as Vice President of Operations Services for El Paso Corporation’s Pipeline Group in Houston, TX. He led the technical services and support functions for pipeline operations and oversaw measurement, compression, reservoir and pipeline systems and Department of Transportation compliance. He was also responsible for risk and integrity management, public awareness and emergency response. Prior to that, Soto was Vice President of Engineering and Construction, leading the engineering and construction programs for ANR Pipeline, El Paso Natural Gas, Colorado Interstate Gas, Southern Natural Gas and Tennessee Gas Pipeline for onshore and offshore facilities.Soto holds a Bachelor of Science in civil engineering from the University of Texas at El Paso, a master’s degree in civil engineering from Texas A&M University, and a Master of Business Administration degree from the University of Phoenix. He currently serves as Vice Chair of the Common GroundAlliance’s board of directors.46
|
PPEN D I X 4 ? L E A D E R S H I P B I O S David S. ThomasonDavid S. ThomasonVice President and Controller PG&E CorporationVice President, Chief Financial Officer and Controller Pacific Gas and Electric CompanyDavid S. Thomason is Vice President and Controller of PG&E Corporation, as well as Vice President, Chief Financial Officer and Controller of Pacific Gas and Electric Company.Thomason joined PG&E in 2001 as a senior accounting analyst after starting his career with Arthur Andersen in Portland. During his 16 years at PG&E, he has held a multitude of roles, growing as a leader and gaining additional responsibilities with each new position. Functional areas he has overseen include external financial reporting, revenue forecasting, planning and analysis, corporate accounting and more.Thomason received a Master’s degree in Business Administration from University of California, Berkeley, and a Bachelor’s degree in Accounting from University of Oregon, Eugene. He holds registrations as a Certified Public Accountant in the states of California and Oregon. He currently serves on the board of the San Francisco Zoological Society.47
|
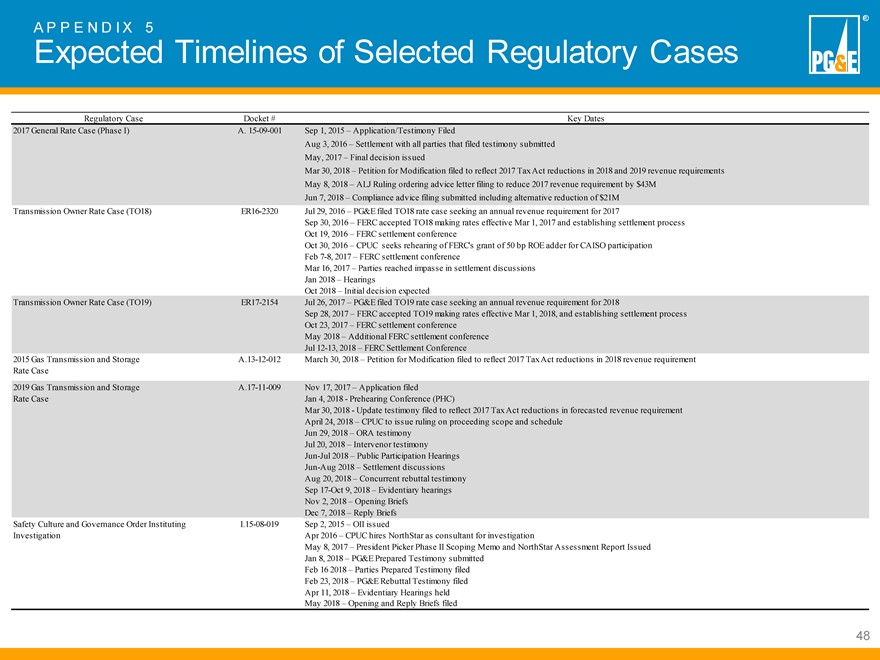
PPEN D I X 5Expected Timelines of Selected Regulatory CasesRegulatory Case Docket # Key Dates 2017 General Rate Case (Phase I) A. 15-09-001 Sep 1, 2015 ? Application/Testimony Filed Aug 3, 2016 ? Settlement with all parties that filed testimony submitted May, 2017 ? Final decision issuedMar 30, 2018 ? Petition for Modification filed to reflect 2017 Tax Act reductions in 2018 and 2019 revenue requirements May 8, 2018 ? ALJ Ruling ordering advice letter filing to reduce 2017 revenue requirement by $43MJun 7, 2018 ? Compliance advice filing submitted including alternative reduction of $21M Transmission Owner Rate Case (TO18) ER16-2320 Jul 29, 2016 ? PG&E filed TO18 rate case seeking an annual revenue requirement for 2017Sep 30, 2016 ? FERC accepted TO18 making rates effective Mar 1, 2017 and establishing settlement process Oct 19, 2016 ? FERC settlement conference Oct 30, 2016 ? CPUC seeks rehearing of FERC’s grant of 50 bp ROE adder for CAISO participation Feb 7-8, 2017 ? FERC settlement conference Mar 16, 2017 ? Parties reached impasse in settlement discussions Jan 2018 ? HearingsOct 2018 ? Initial decision expectedTransmission Owner Rate Case (TO19) ER17-2154 Jul 26, 2017 ? PG&E filed TO19 rate case seeking an annual revenue requirement for 2018Sep 28, 2017 ? FERC accepted TO19 making rates effective Mar 1, 2018, and establishing settlement process Oct 23, 2017 ? FERC settlement conference May 2018 ? Additional FERC settlement conference Jul 12-13, 2018 ? FERC Settlement Conference 2015 Gas Transmission and Storage A.13-12-012 March 30, 2018 ? Petition for Modification filed to reflect 2017 Tax Act reductions in 2018 revenue requirement Rate Case 2019 Gas Transmission and Storage A.17-11-009 Nov 17, 2017 ? Application filed Rate Case Jan 4, 2018—Prehearing Conference (PHC) Mar 30, 2018—Update testimony filed to reflect 2017 Tax Act reductions in forecasted revenue requirement April 24, 2018 ? CPUC to issue ruling on proceeding scope and schedule Jun 29, 2018 ? ORA testimony Jul 20, 2018 ? Intervenor testimony Jun-Jul 2018 ? Public Participation Hearings Jun-Aug 2018 ? Settlement discussions Aug 20, 2018 ? Concurrent rebuttal testimony Sep 17-Oct 9, 2018 ? Evidentiary hearings Nov 2, 2018 ? Opening Briefs Dec 7, 2018 ? Reply Briefs Safety Culture and Governance Order Instituting I.15-08-019 Sep 2, 2015 ? OII issued Investigation Apr 2016 ? CPUC hires NorthStar as consultant for investigation May 8, 2017 ? President Picker Phase II Scoping Memo and NorthStar Assessment Report Issued Jan 8, 2018 ? PG&E Prepared Testimony submitted Feb 16 2018 ? Parties Prepared Testimony filed Feb 23, 2018 ? PG&E Rebuttal Testimony filed Apr 11, 2018 ? Evidentiary Hearings held May 2018 ? Opening and Reply Briefs filed48
|
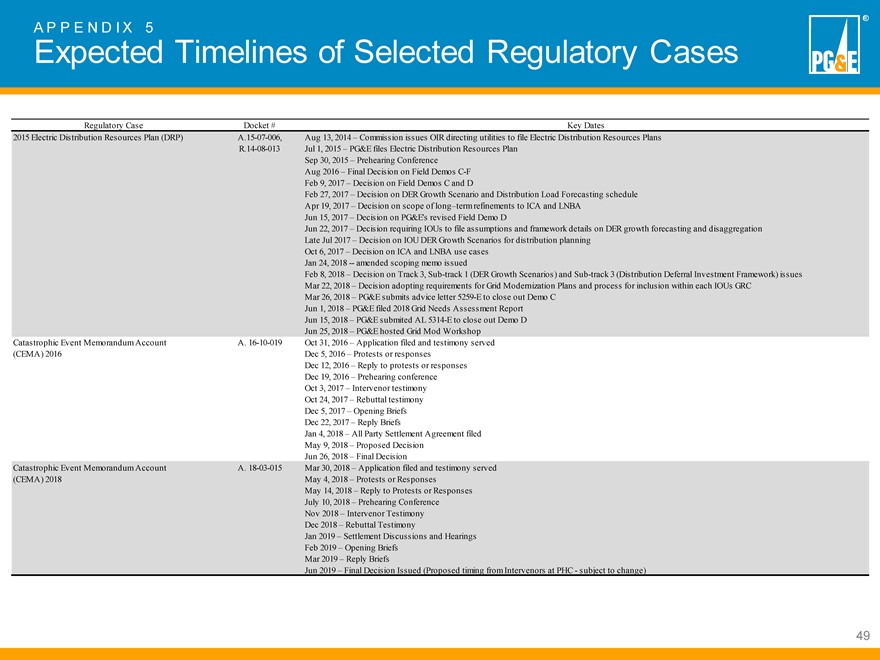
PPEN D I X 5Expected Timelines of Selected Regulatory CasesRegulatory Case Docket # Key Dates2015 Electric Distribution Resources Plan (DRP) A.15-07-006, Aug 13, 2014 ? Commission issues OIR directing utilities to file Electric Distribution Resources Plans R.14-08-013 Jul 1, 2015 ? PG&E files Electric Distribution Resources Plan Sep 30, 2015 ? Prehearing Conference Aug 2016 ? Final Decision on Field Demos C-F Feb 9, 2017 ? Decision on Field Demos C and DFeb 27, 2017 ? Decision on DER Growth Scenario and Distribution Load Forecasting schedule Apr 19, 2017 ? Decision on scope of long?term refinements to ICA and LNBAJun 15, 2017 ? Decision on PG&E’s revised Field Demo D Jun 22, 2017 ? Decision requiring IOUs to file assumptions and framework details on DER growth forecasting and disaggregation Late Jul 2017 ? Decision on IOU DER Growth Scenarios for distribution planning Oct 6, 2017 ? Decision on ICA and LNBA use cases Jan 24, 2018 — amended scoping memo issuedFeb 8, 2018 ? Decision on Track 3, Sub-track 1 (DER Growth Scenarios) and Sub-track 3 (Distribution Deferral Investment Framework) issues Mar 22, 2018 ? Decision adopting requirements for Grid Modernization Plans and process for inclusion within each IOUs GRCMar 26, 2018 ? PG&E submits advice letter 5259-E to close out Demo C Jun 1, 2018 ? PG&E filed 2018 Grid Needs Assessment Report Jun 15, 2018 ? PG&E submited AL 5314-E to close out Demo D Jun 25, 2018 ? PG&E hosted Grid Mod Workshop Catastrophic Event Memorandum Account A. 16-10-019 Oct 31, 2016 ? Application filed and testimony served (CEMA) 2016 Dec 5, 2016 ? Protests or responses Dec 12, 2016 ? Reply to protests or responses Dec 19, 2016 ? Prehearing conference Oct 3, 2017 ? Intervenor testimony Oct 24, 2017 ? Rebuttal testimony Dec 5, 2017 ? Opening Briefs Dec 22, 2017 ? Reply Briefs Jan 4, 2018 ? All Party Settlement Agreement filed May 9, 2018 ? Proposed Decision Jun 26, 2018 ? Final Decision Catastrophic Event Memorandum Account A. 18-03-015 Mar 30, 2018 ? Application filed and testimony served (CEMA) 2018 May 4, 2018 ? Protests or Responses May 14, 2018 ? Reply to Protests or Responses July 10, 2018 ? Prehearing Conference Nov 2018 ? Intervenor Testimony Dec 2018 ? Rebuttal Testimony Jan 2019 ? Settlement Discussions and Hearings Feb 2019 ? Opening Briefs Mar 2019 ? Reply Briefs Jun 2019 ? Final Decision Issued (Proposed timing from Intervenors at PHC—subject to change)49
|
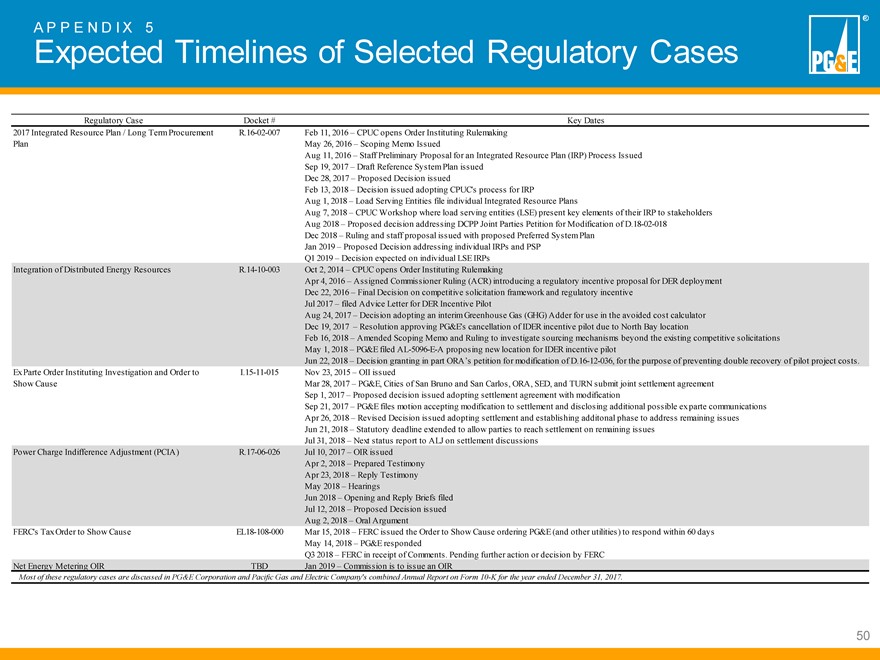
PPEN D I X 5Expected Timelines of Selected Regulatory CasesRegulatory Case Docket # Key Dates 2017 Integrated Resource Plan / Long Term Procurement R.16-02-007 Feb 11, 2016 ? CPUC opens Order Instituting Rulemaking Plan May 26, 2016 ? Scoping Memo IssuedAug 11, 2016 ? Staff Preliminary Proposal for an Integrated Resource Plan (IRP) Process Issued Sep 19, 2017 ? Draft Reference System Plan issued Dec 28, 2017 ? Proposed Decision issued Feb 13, 2018 ? Decision issued adopting CPUC’s process for IRP Aug 1, 2018 ? Load Serving Entities file individual Integrated Resource PlansAug 7, 2018 ? CPUC Workshop where load serving entities (LSE) present key elements of their IRP to stakeholders Aug 2018 ? Proposed decision addressing DCPP Joint Parties Petition for Modification of D.18-02-018 Dec 2018 ? Ruling and staff proposal issued with proposed Preferred System Plan Jan 2019 ? Proposed Decision addressing individual IRPs and PSPQ1 2019 ? Decision expected on individual LSE IRPs Integration of Distributed Energy Resources R.14-10-003 Oct 2, 2014 ? CPUC opens Order Instituting RulemakingApr 4, 2016 ? Assigned Commissioner Ruling (ACR) introducing a regulatory incentive proposal for DER deployment Dec 22, 2016 ? Final Decision on competitive solicitation framework and regulatory incentive Jul 2017 ? filed Advice Letter for DER Incentive Pilot Aug 24, 2017 ? Decision adopting an interim Greenhouse Gas (GHG) Adder for use in the avoided cost calculator Dec 19, 2017 ? Resolution approving PG&E’s cancellation of IDER incentive pilot due to North Bay locationFeb 16, 2018 ? Amended Scoping Memo and Ruling to investigate sourcing mechanisms beyond the existing competitive solicitations May 1, 2018 ? PG&E filed AL-5096-E-A proposing new location for IDER incentive pilotJun 22, 2018 ? Decision granting in part ORA?s petition for modification of D.16-12-036, for the purpose of preventing double recovery of pilot project costs. Ex Parte Order Instituting Investigation and Order to I.15-11-015 Nov 23, 2015 ? OII issued Show Cause Mar 28, 2017 ? PG&E, Cities of San Bruno and San Carlos, ORA, SED, and TURN submit joint settlement agreement Sep 1, 2017 ? Proposed decision issued adopting settlement agreement with modification Sep 21, 2017 ? PG&E files motion accepting modification to settlement and disclosing additional possible ex parte communications Apr 26, 2018 ? Revised Decision issued adopting settlement and establishing additonal phase to address remaining issues Jun 21, 2018 ? Statutory deadline extended to allow parties to reach settlement on remaining issues Jul 31, 2018 ? Next status report to ALJ on settlement discussions Power Charge Indifference Adjustment (PCIA) R.17-06-026 Jul 10, 2017 ? OIR issued Apr 2, 2018 ? Prepared Testimony Apr 23, 2018 ? Reply Testimony May 2018 ? Hearings Jun 2018 ? Opening and Reply Briefs filed Jul 12, 2018 ? Proposed Decision issued Aug 2, 2018 ? Oral Argument FERC’s Tax Order to Show Cause EL18-108-000 Mar 15, 2018 ? FERC issued the Order to Show Cause ordering PG&E (and other utilities) to respond within 60 days May 14, 2018 ? PG&E responded Q3 2018 ? FERC in receipt of Comments. Pending further action or decision by FERCNet Energy Metering OIR TBD Jan 2019 ? Commission is to issue an OIRMost of these regulatory cases are discussed in PG&E Corporation and Pacific Gas and Electric Company’s combined Annual Report on Form 10-K for the year ended December 31, 2017.50
|
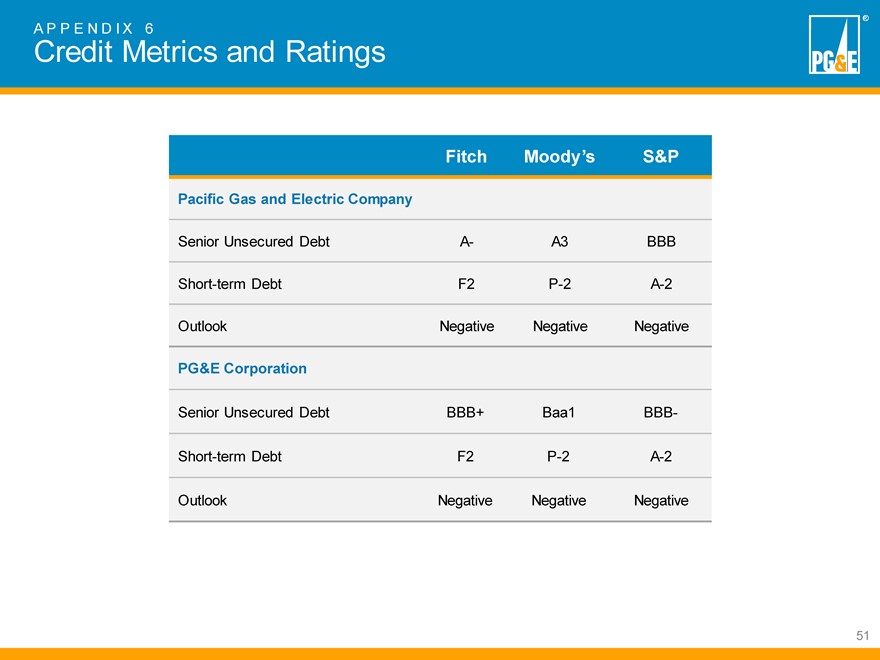
PPEN D I X 6Credit Metrics and RatingsFitch Moody?s S&PPacific Gas and Electric CompanySenior Unsecured Debt A- A3 BBB Short-term Debt F2 P-2 A-2 Outlook Negative Negative NegativePG&E CorporationSenior Unsecured Debt BBB+ Baa1 BBB-Short-term Debt F2 P-2 A-2 Outlook Negative Negative Negative51