Attached files
| file | filename |
|---|---|
| 8-K - 8-K - 3RD QUARTER FISCAL 2018 EARNINGS PRESS RELEASE - MATTHEWS INTERNATIONAL CORP | form8k-2018q3earnings.htm |
| EX-99.1 - EXHIBIT 99.1 3RD QUARTER FISCAL 2018 EARNINGS PRESS RELEASE - MATTHEWS INTERNATIONAL CORP | ex991_3q2018earningspr.htm |

Third Quarter Fiscal 2018 Earnings Teleconference July 27, 2018 Joseph C. Bartolacci President and Chief Executive Officer Steven F. Nicola Chief Financial Officer ©2018 Matthews International Corporation. All Rights Reserved.

Disclaimer Any forward-looking statements with respect to Matthews International Corporation (the “Company”) in connection with this presentation are being made pursuant to the safe harbor provisions of the Private Securities Litigation Reform Act of 1995. Such forward-looking statements involve known and unknown risks and uncertainties that may cause the Company’s actual results in future periods to be materially different from management’s expectations. Although the Company believes that the expectations reflected in such forward-looking statements are reasonable, no assurance can be given that such expectations will prove correct. Factors that could cause the Company’s results to differ from those presented herein are set forth in the Company’s Annual Report on Form 10-K and other periodic filings with the Securities and Exchange Commission (“SEC”). The Company periodically provides information derived from financial data which is not presented in the consolidated financial statements prepared in accordance with U.S. generally accepted accounting principles (“GAAP”). Certain of this information are considered “non-GAAP financial measures” under the SEC rules. The Company believes that this information provides management and investors with a useful measure of the Company’s financial performance on a comparable basis. These non-GAAP financial measures are supplemental to the Company’s GAAP disclosures and should not be considered an alternative to the GAAP financial information. The Company uses non-GAAP financial measures to assist in comparing its performance on a consistent basis for purposes of business decision making by removing the impact of certain items that management believes do not directly reflect the Company’s core operations including acquisition-related items, system-integration costs, adjustments related to intangible assets, litigation items, and strategic initiative and other charges, which includes non-recurring charges related to operational initiatives and exit activities. Management believes that presenting non-GAAP financial measures is useful to investors because it (i) provides investors with meaningful supplemental information regarding financial performance by excluding certain items, (ii) permits investors to view performance using the same tools that management uses to budget, forecast, make operating and strategic decisions, and evaluate historical performance, and (iii) otherwise provides supplemental information that may be useful to investors in evaluating the Company’s results. The Company believes that the presentation of these non-GAAP financial measures, when considered together with the corresponding GAAP financial measures and the reconciliations to those measures, provided herein, provides investors with an additional understanding of the factors and trends affecting the Company’s business that could not be obtained absent these disclosures. The Company also has presented adjusted operating profit and believes that it provides relevant and useful information, which is widely used by analysts and investors, as well as by the Company’s management in assessing both consolidated and segment performance. Adjusted operating profit provides the Company with an understanding of the results from the primary operations of its business by excluding the effects of certain acquisition and system-integration costs, and items that do not reflect the ordinary earnings of the Company’s operations. This measure may be useful to an investor in evaluating the underlying primary operating performance of the Company’s segments and business overall on a consistent basis. Similarly, the Company believes that EBITDA, adjusted EBITDA, and adjusted EBITDA margin provide relevant and useful information, which is widely used by analysts and investors, as well as by the Company’s management in assessing the performance of its business. Adjusted EBITDA provides the Company with an understanding of earnings before the impact of investing and financing charges and income taxes, and the effects of certain acquisition and system-integration costs, and items that do not reflect the ordinary earnings of the Company’s operations. This measure may be useful to an investor in evaluating operating performance. It is also useful as a financial measure for lenders and is used by the Company’s management to measure performance as well as strategic planning and forecasting. The Company has also presented adjusted earnings per share and believes it provides relevant and useful information, which is widely used by analysts and investors, as well as by the Company’s management in assessing the performance of its business. Adjusted earnings per share provides the Company with an understanding of the results from the primary operations of our business by excluding the per share effects of certain acquisition and system-integration costs, and items that do not reflect the ordinary earnings of our operations. This measure provides management with insight into the earning value for shareholders excluding certain costs, not related to the Company’s primary operations. Likewise, this measure may be useful to an investor in evaluating the underlying operating performance of the Company’s business overall, as well as performance trends, on a consistent basis. Lastly, the Company has presented adjusted net income and believes it provides relevant and useful information, which is widely used by analysts and investors, as well as by the Company’s management in assessing financial performance. Adjusted net income provides the Company with an understanding of the results from the primary operations of its business by excluding the effects of certain acquisition and system-integration costs, and items that do not reflect the ordinary earnings of the Company’s operations. This measure may be useful to an investor in evaluating the underlying performance of the business. ©2018 Matthews International Corporation. All Rights Reserved. 2
Financial Overview ©2018 Matthews International Corporation. All Rights Reserved. 3
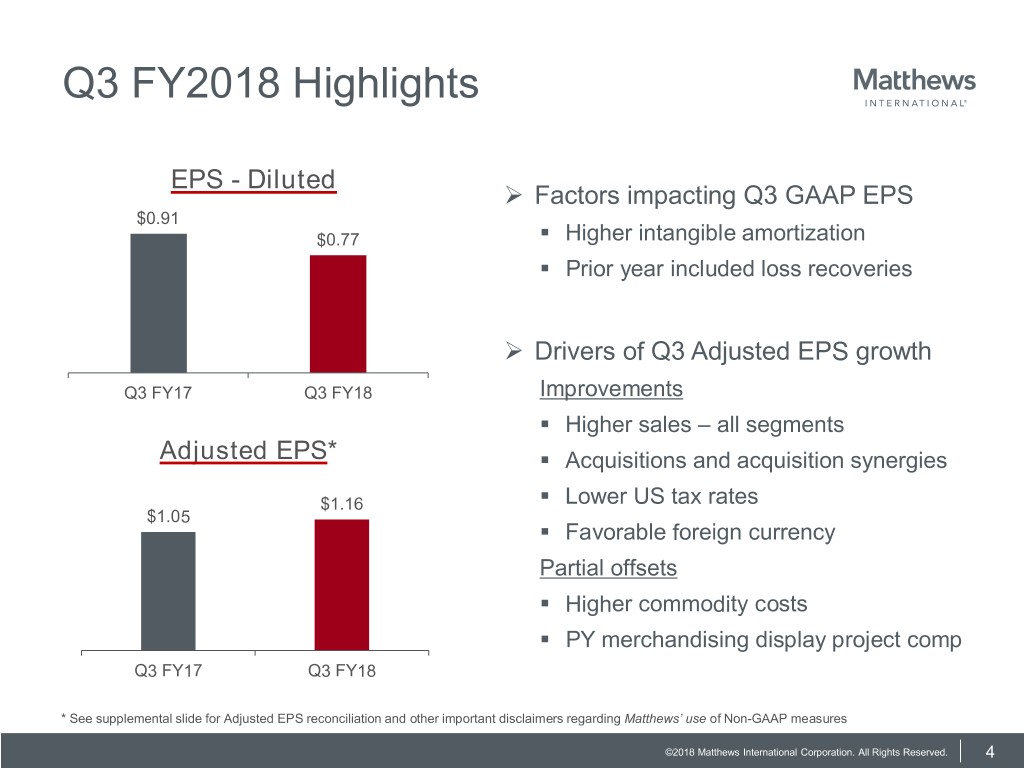
Q3 FY2018 Highlights EPS - Diluted Factors impacting Q3 GAAP EPS $0.91 . $0.77 Higher intangible amortization . Prior year included loss recoveries Drivers of Q3 Adjusted EPS growth Q3 FY17 Q3 FY18 Improvements . Higher sales – all segments Adjusted EPS* . Acquisitions and acquisition synergies . $1.16 Lower US tax rates $1.05 . Favorable foreign currency Partial offsets . Higher commodity costs . PY merchandising display project comp Q3 FY17 Q3 FY18 * See supplemental slide for Adjusted EPS reconciliation and other important disclaimers regarding Matthews’ use of Non-GAAP measures ©2018 Matthews International Corporation. All Rights Reserved. 4

Q3 FY18 Consolidated Results ($ in millions) Sales GAAP Operating Profit and Margin $37.9 $389.6 $411.6 $36.8 9.4% 9.2% Q3 FY2017 Q3 FY2018 Q3 FY2017 Q3 FY2018 GAAP Gross Profit Adjusted EBITDA* and Margin and Margin $65.6 $69.2 $144.1 $151.9 37.0 % 36.9% 16.8% 16.8% Q3 FY2017 Q3 FY2018 Q3 FY2017 Q3 FY2018 * See supplemental slide for Adjusted EBITDA reconciliation and other important disclosures regarding Matthews’ use of Non-GAAP measures ©2018 Matthews International Corporation. All Rights Reserved. 5

YTD FY18 Consolidated Results ($ in millions) Sales GAAP Operating Profit and Margin $1,195.1 $1,119.5 $82.7 $85.6 7.4% 7.2% YTD FY2017 YTDFY2018 YTD FY2017 YTD FY2018 GAAP Gross Profit Adjusted EBITDA* and Margin and Margin $178.2 $409.8 $432.6 $174.6 36.6% 36.2% 15.6% 14.9% YTD FY2017 YTD FY2018 YTD FY2017 YTD FY2018 * See supplemental slide for Adjusted EBITDA reconciliation and other important disclosures regarding Matthews’ use of Non-GAAP measures ©2018 Matthews International Corporation. All Rights Reserved. 6

Q3 FY18 SGK Brand Solutions Results ($ in millions) Sales GAAP Operating Profit and Margin $200.6 $203.0 $11.4 $8.3 5.7% 4.1% Q3 FY2017 Q3 FY2018 Q3 FY2017 Q3 FY2018 Higher European sales (brand / surfaces & Adjusted EBITDA* engineering), acquisitions and currency; PY and Margin included significant merchandising project $29.6 $28.2 Operating profit includes $4.7 million and $5.3 million of amortization expense in Q3 FY2017 and Q3 FY2018 Adjusted EBITDA comparison impacted by 14.7% 13.9% PY merchandising display project & current Q3 FY2017 Q3 FY2018 year start-up costs for new account wins * See supplemental slide for Adjusted EBITDA reconciliation and other important disclosures regarding Matthews’ use of Non-GAAP measures ©2018 Matthews International Corporation. All Rights Reserved. 7

YTD FY18 SGK Brand Solutions Results ($ in millions) Sales GAAP Operating Profit and Margin $601.8 $566.5 $19.9 $16.6 3.5% 2.8% YTD FY2017 YTD FY2018 YTD FY2017 YTD FY2018 Sales growth driven by Europe, UK & Asia Adjusted EBITDA* Pacific, acquisitions, and favorable currency and Margin Operating profit includes $12.5 million and $77.3 $75.6 $15.4 million of amortization expense for YTD FY17 and YTD FY18 Adjusted EBITDA benefited from sales growth, acquisitions and currency; PY 13.7% 12.6% included significant merchandising project YTD FY2017 YTD FY2018 * See supplemental slide for Adjusted EBITDA reconciliation and other important disclosures regarding Matthews’ use of Non-GAAP measures ©2018 Matthews International Corporation. All Rights Reserved. 8

Q3 FY18 Memorialization Results ($ in millions) Sales GAAP Operating Profit and Margin $155.8 $162.0 $23.5 $24.9 15.1% 15.4% Q3 FY2017 Q3 FY2018 Q3 FY2017 Q3 FY2018 Sales growth driven by cremation equipment Adjusted EBITDA* and Star acquisition; partially offset by lower and Margin memorial and casket sales $32.6 $34.3 Operating profit includes $1.2 million and $2.1 million of amortization expense in Q3 FY2017 and Q3 FY2018 Adjusted EBITDA growth reflects higher sales, 20.9% 21.2% acquisitions, and synergies; partially offset by Q3 FY2017 Q3 FY2018 higher material costs * See supplemental slide for Adjusted EBITDA reconciliation and other important disclosures regarding Matthews’ use of Non-GAAP measures ©2018 Matthews International Corporation. All Rights Reserved. 9

YTD FY18 Memorialization Results ($ in millions) Sales GAAP Operating Profit* and Margin $463.6 $475.6 $60.8 $63.3 13.1% 13.3% YTD FY2017 YTD FY2018 YTD FY2017 YTD FY2018 Sales growth driven by cremation equipment, Adjusted EBITDA* and acquisition; partially offset by lower and Margin memorial and casket sales $91.1 $90.7 Operating profit includes $3.6 million and $5.3 million of amortization expense in YTD FY17 and YTD FY18 Adjusted EBITDA benefited from acquisition 19.7% 19.1% synergies; offset by impact of lower memorial & casket sales and higher material costs YTD FY2017 YTD FY2018 * See supplemental slide for Adjusted EBITDA reconciliation and other important disclosures regarding Matthews’ use of Non-GAAP measures ©2018 Matthews International Corporation. All Rights Reserved. 10

Q3 FY18 Industrial Technologies Results ($ in millions) Sales GAAP Operating Profit $46.7 and Margin $4.7 $33.2 $1.9 5.9% 10.0% Q3 FY2017 Q3 FY2018 Q3 FY2017 Q3 FY2018 Sales growth reflected increases in marking Adjusted EBITDA* products, fulfillment systems and OEM and Margin solutions; and recent acquisition $6.7 Operating profit includes $0.4 million and $1.0 million of amortization expense in Q3 FY2017 $3.4 and Q3 FY2018 Adjusted EBITDA benefited from higher sales; 10.4% 14.4% partially offset by higher new product development project costs ($1.9 million in Q3 Q3 FY2017 Q3 FY2018 FY2017 vs. $2.3 million in Q3 FY2018) * See supplemental slide for Adjusted EBITDA reconciliation and other important disclosures regarding Matthews’ use of Non-GAAP measures ©2018 Matthews International Corporation. All Rights Reserved. 11
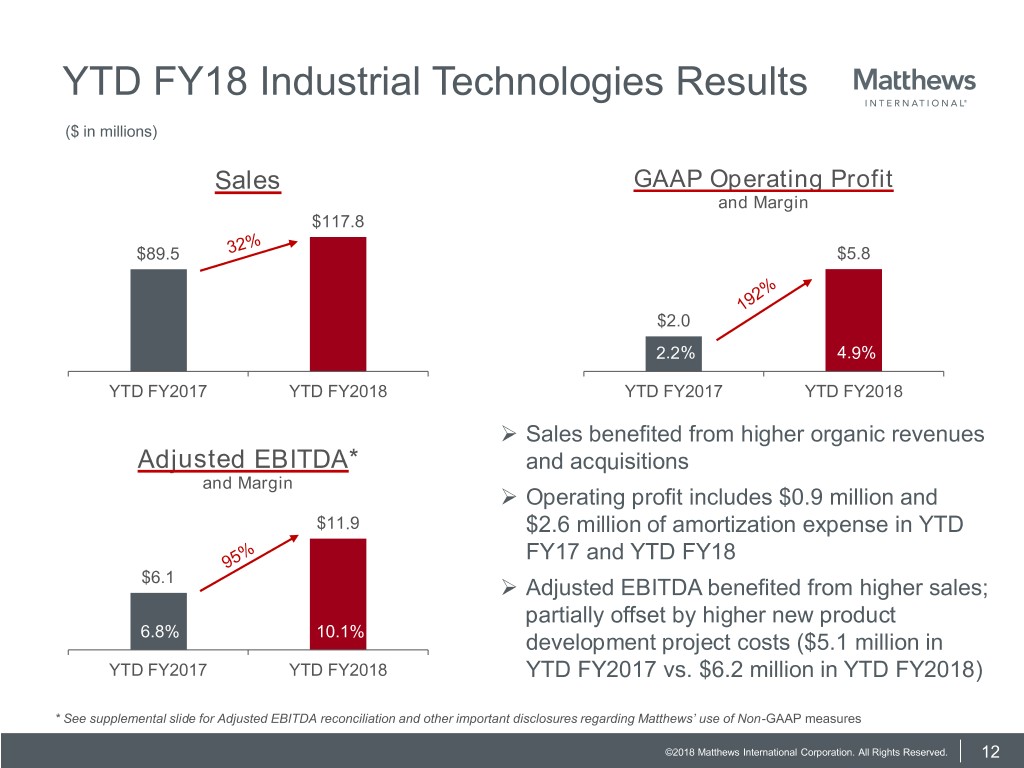
YTD FY18 Industrial Technologies Results ($ in millions) Sales GAAP Operating Profit and Margin $117.8 $89.5 $5.8 $2.0 2.2% 4.9% YTD FY2017 YTD FY2018 YTD FY2017 YTD FY2018 Sales benefited from higher organic revenues Adjusted EBITDA* and acquisitions and Margin Operating profit includes $0.9 million and $11.9 $2.6 million of amortization expense in YTD FY17 and YTD FY18 $6.1 Adjusted EBITDA benefited from higher sales; partially offset by higher new product 6.8% 10.1% development project costs ($5.1 million in YTD FY2017 YTD FY2018 YTD FY2017 vs. $6.2 million in YTD FY2018) * See supplemental slide for Adjusted EBITDA reconciliation and other important disclosures regarding Matthews’ use of Non-GAAP measures ©2018 Matthews International Corporation. All Rights Reserved. 12

Capitalization and Cash Flows ($ in millions) Debt Operating Cash Flow $1,026.4 $95.8 $911.1 $82.8 9/30/2017 6/30/2018 YTD FY2017 YTD FY2018 Debt reduction of $19.9 million during Q3 Cash FY2018 $57.5 $53.7 YTD operating cash flow impacted by CY pension contribution; PY included benefit of loss recoveries Q3 FY2018 purchased 36k shares for $1.8 million; YTD FY18 purchased 372k shares for $20.1 million 9/30/2017 6/30/2018 Quarterly dividend $0.19/share, payable 8/13/18 ©2018 Matthews International Corporation. All Rights Reserved. 13

Business Overview ©2018 Matthews International Corporation. All Rights Reserved. 14
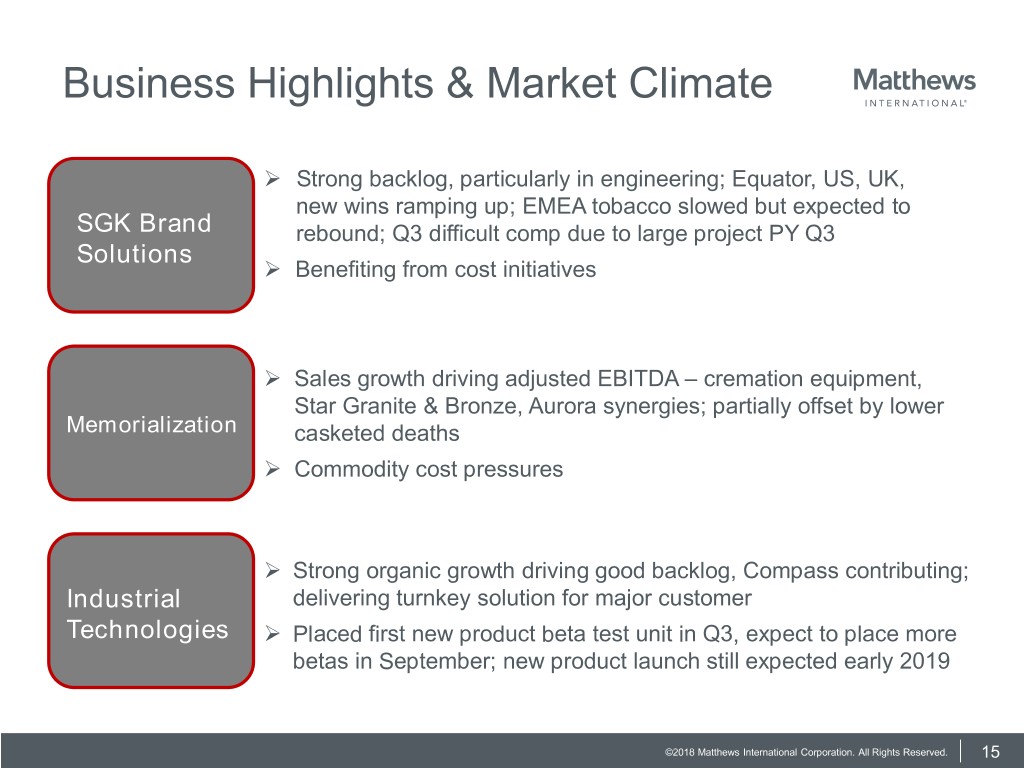
Business Highlights & Market Climate Strong backlog, particularly in engineering; Equator, US, UK, new wins ramping up; EMEA tobacco slowed but expected to SGK Brand rebound; Q3 difficult comp due to large project PY Q3 Solutions Benefiting from cost initiatives Sales growth driving adjusted EBITDA – cremation equipment, Star Granite & Bronze, Aurora synergies; partially offset by lower Memorialization casketed deaths Commodity cost pressures Strong organic growth driving good backlog, Compass contributing; Industrial delivering turnkey solution for major customer Technologies Placed first new product beta test unit in Q3, expect to place more betas in September; new product launch still expected early 2019 ©2018 Matthews International Corporation. All Rights Reserved. 15
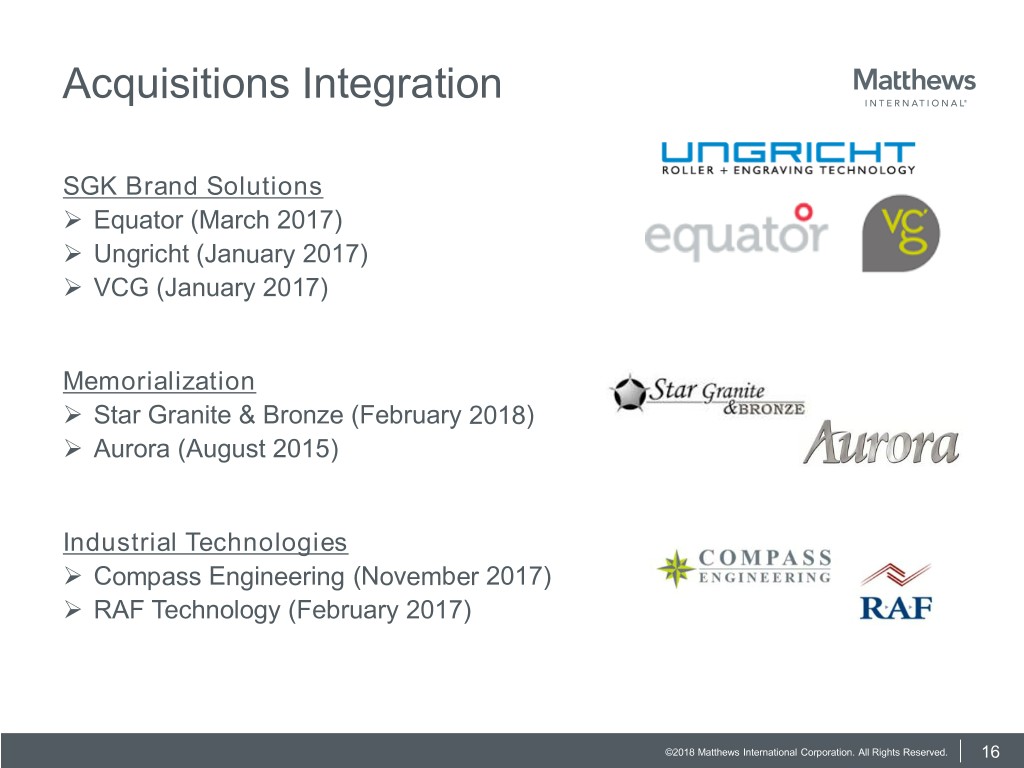
Acquisitions Integration SGK Brand Solutions Equator (March 2017) Ungricht (January 2017) VCG (January 2017) Memorialization Star Granite & Bronze (February 2018) Aurora (August 2015) Industrial Technologies Compass Engineering (November 2017) RAF Technology (February 2017) ©2018 Matthews International Corporation. All Rights Reserved. 16

Outlook for Fiscal 2018* Growth in non-GAAP EPS by at least 10% over FY 2017 Operating cash flow currently expected to exceed FY2017 record level * As of July 26, 2018 ©2018 Matthews International Corporation. All Rights Reserved. 17

Supplemental Information ©2018 Matthews International Corporation. All Rights Reserved. 18

Reconciliations of Non-GAAP Financial Measures The Company uses non-GAAP financial measures to assist in comparing its performance on a consistent basis for purposes of business decision making by removing the impact of certain items that management believes do not directly reflect the Company’s core operations including acquisition-related items, adjustments related to intangible assets, litigation items, and strategic initiative and other charges, which includes non-recurring charges related to operational initiatives and exit activities. Management believes that presenting non-GAAP financial measures (such as EBITDA, Adjusted EBITDA, Adjusted EBITDA margin, Adjusted operating profit, Adjusted net income and Adjusted EPS) is useful to investors because it (i) provides investors with meaningful supplemental information regarding financial performance by excluding certain items, (ii) permits investors to view performance using the same tools that management uses to budget, forecast, make operating and strategic decisions, and evaluate historical performance, and (iii) otherwise provides supplemental information that may be useful to investors in evaluating the Company’s results. The Company believes that the presentation of these non-GAAP financial measures, when considered together with the corresponding GAAP financial measures and the reconciliations to those measures, provided herein, provides investors with an additional understanding of the factors and trends affecting the Company’s business that could not be obtained absent these disclosures. These non-GAAP financial measures are supplemental to the Company’s GAAP disclosures and should not be considered an alternative to the GAAP financial information. ©2018 Matthews International Corporation. All Rights Reserved. 19

Adjusted Earnings Per Share Non-GAAP Reconciliation ($ in thousands, except per share data) Three Months Ended June 30, Nine Months Ended June 30, 2018 2017 2018 2017 (1) Net income attributable to Matthews $ 24,414 $ 29,485 $ 77,776 $ 54,727 Acquisition-related items 4,609 5,127 13,064 17,972 Pension and postretirement expense (2) 1,055 1,525 3,164 4,574 Intangible amortization expense 6,167 4,423 17,215 11,773 Strategic initiatives and other charges 478 — 2,118 — Loss recoveries, net of costs — (6,504) — (6,504) Tax-related (3) — 150 (26,738) 285 Adjusted net income $ 36,723 $ 34,206 $ 86,599 $ 82,827 Adjusted EPS $ 1.16 $ 1.05 $ 2.72 $ 2.55 Note: Adjustments to net income for non-GAAP reconciling items were calculated using an income tax rate of 26.0% and 22.7%, for the three months ended June 30, 2018 and 2017, respectively, and 26.0% and 20.1% for the nine months ended June 30, 2018 and 2017, respectively. (1) Information for the nine months ended June 30, 2017 has been adjusted to reflect the adoption of ASU No. 2016-09. The Company early adopted this ASU in the fourth quarter of fiscal 2017, which resulted in a reduction to income tax expense of $1,234, and a corresponding favorable impact on diluted earnings per share, both of which have been retroactively included in the first quarter results for fiscal 2017. There was no impact for the three month period ended June 30, 2017. (2) The non-GAAP adjustment to pension and postretirement expense represents the add-back of the non-service related components of these costs. Non-service related components include interest cost, expected return on plan assets and amortization of actuarial gains and losses. The service cost and prior service cost components of pension and postretirement expense are considered to be a better reflection of the ongoing service-related costs of providing these benefits. The other components of GAAP pension and postretirement expense are primarily influenced by general market conditions impacting investment returns and interest (discount) rates. Please note that GAAP pension and postretirement expense or the adjustment above are not necessarily indicative of the current or future cash flow requirements related to these employee benefit plans. (3) The tax-related adjustments in fiscal 2018 consisted of income tax regulation changes which included an estimated favorable tax benefit of approximately $37,800 for the reduction in the Company’s net deferred tax liability principally reflecting the lower U.S. Federal tax rate, offset partially by an estimated repatriation transition tax charge and other charges of approximately $11,100, for the nine month period ended June 30, 2018. * See Disclaimer (page 2) for Management’s assessment of supplemental information related to adjusted net income and adjusted EPS. ©2018 Matthews International Corporation. All Rights Reserved. 20
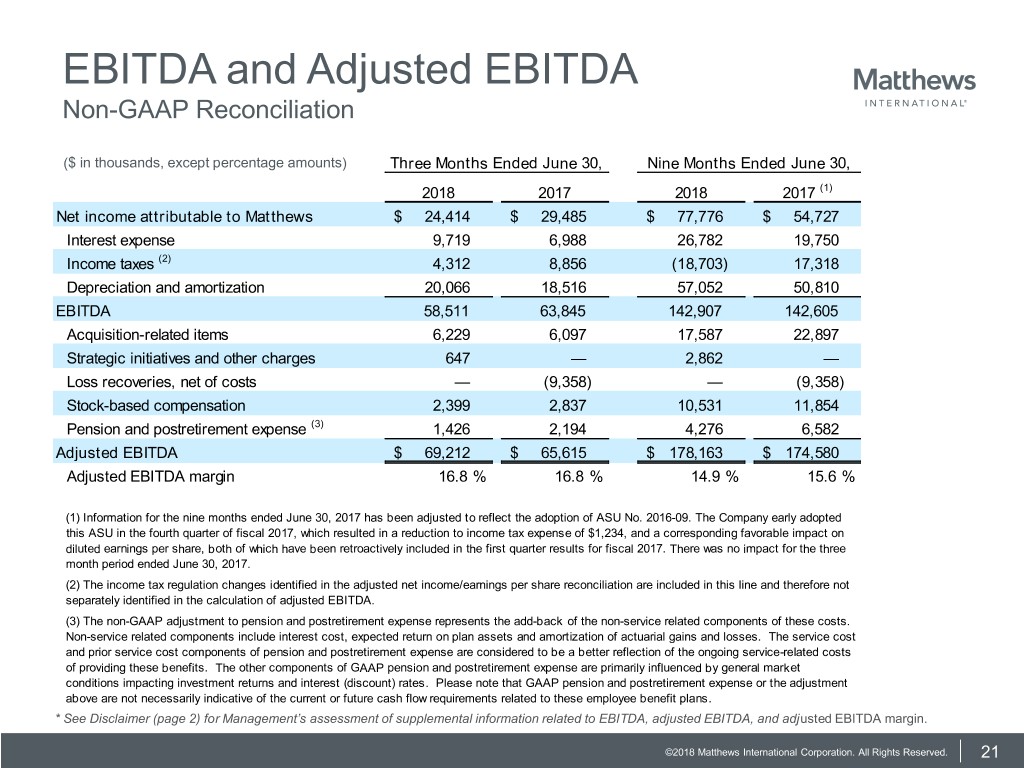
EBITDA and Adjusted EBITDA Non-GAAP Reconciliation ($ in thousands, except percentage amounts) Three Months Ended June 30, Nine Months Ended June 30, 2018 2017 2018 2017 (1) Net income attributable to Matthews $ 24,414 $ 29,485 $ 77,776 $ 54,727 Interest expense 9,719 6,988 26,782 19,750 Income taxes (2) 4,312 8,856 (18,703) 17,318 Depreciation and amortization 20,066 18,516 57,052 50,810 EBITDA 58,511 63,845 142,907 142,605 Acquisition-related items 6,229 6,097 17,587 22,897 Strategic initiatives and other charges 647 — 2,862 — Loss recoveries, net of costs — (9,358) — (9,358) Stock-based compensation 2,399 2,837 10,531 11,854 Pension and postretirement expense (3) 1,426 2,194 4,276 6,582 Adjusted EBITDA $ 69,212 $ 65,615 $ 178,163 $ 174,580 Adjusted EBITDA margin 16.8 % 16.8 % 14.9 % 15.6 % (1) Information for the nine months ended June 30, 2017 has been adjusted to reflect the adoption of ASU No. 2016-09. The Company early adopted this ASU in the fourth quarter of fiscal 2017, which resulted in a reduction to income tax expense of $1,234, and a corresponding favorable impact on diluted earnings per share, both of which have been retroactively included in the first quarter results for fiscal 2017. There was no impact for the three month period ended June 30, 2017. (2) The income tax regulation changes identified in the adjusted net income/earnings per share reconciliation are included in this line and therefore not separately identified in the calculation of adjusted EBITDA. (3) The non-GAAP adjustment to pension and postretirement expense represents the add-back of the non-service related components of these costs. Non-service related components include interest cost, expected return on plan assets and amortization of actuarial gains and losses. The service cost and prior service cost components of pension and postretirement expense are considered to be a better reflection of the ongoing service-related costs of providing these benefits. The other components of GAAP pension and postretirement expense are primarily influenced by general market conditions impacting investment returns and interest (discount) rates. Please note that GAAP pension and postretirement expense or the adjustment above are not necessarily indicative of the current or future cash flow requirements related to these employee benefit plans. * See Disclaimer (page 2) for Management’s assessment of supplemental information related to EBITDA, adjusted EBITDA, and adjusted EBITDA margin. ©2018 Matthews International Corporation. All Rights Reserved. 21
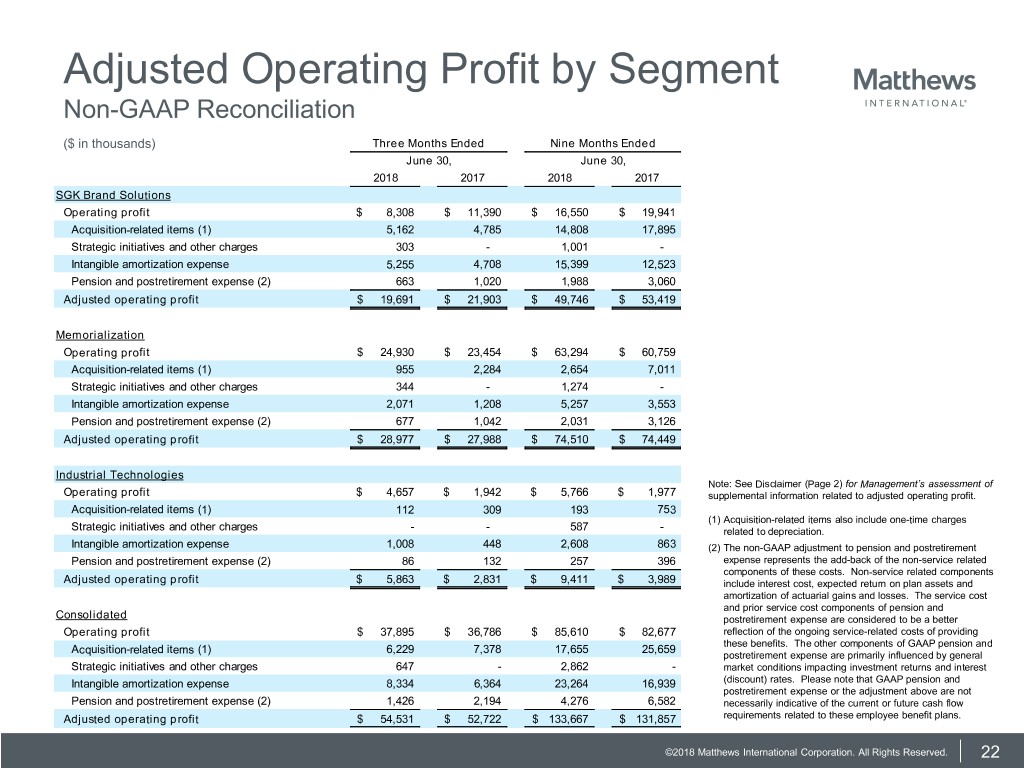
Adjusted Operating Profit by Segment Non-GAAP Reconciliation ($ in thousands) Three Months Ended Nine Months Ended June 30, June 30, 2018 2017 2018 2017 SGK Brand Solutions Operating profit $ 8,308 $ 11,390 $ 16,550 $ 19,941 Acquisition-related items (1) 5,162 4,785 14,808 17,895 Strategic initiatives and other charges 303 - 1,001 - Intangible amortization expense 5,255 4,708 15,399 12,523 Pension and postretirement expense (2) 663 1,020 1,988 3,060 Adjusted operating profit $ 19,691 $ 21,903 $ 49,746 $ 53,419 Memorialization Operating profit $ 24,930 $ 23,454 $ 63,294 $ 60,759 Acquisition-related items (1) 955 2,284 2,654 7,011 Strategic initiatives and other charges 344 - 1,274 - Intangible amortization expense 2,071 1,208 5,257 3,553 Pension and postretirement expense (2) 677 1,042 2,031 3,126 Adjusted operating profit $ 28,977 $ 27,988 $ 74,510 $ 74,449 Industrial Technologies Note: See Disclaimer (Page 2) for Management’s assessment of Operating profit $ 4,657 $ 1,942 $ 5,766 $ 1,977 supplemental information related to adjusted operating profit. Acquisition-related items (1) 112 309 193 753 (1) Acquisition-related items also include one-time charges Strategic initiatives and other charges - - 587 - related to depreciation. Intangible amortization expense 1,008 448 2,608 863 (2) The non-GAAP adjustment to pension and postretirement Pension and postretirement expense (2) 86 132 257 396 expense represents the add-back of the non-service related components of these costs. Non-service related components Adjusted operating profit $ 5,863 $ 2,831 $ 9,411 $ 3,989 include interest cost, expected return on plan assets and amortization of actuarial gains and losses. The service cost and prior service cost components of pension and Consolidated postretirement expense are considered to be a better Operating profit $ 37,895 $ 36,786 $ 85,610 $ 82,677 reflection of the ongoing service-related costs of providing these benefits. The other components of GAAP pension and Acquisition-related items (1) 6,229 7,378 17,655 25,659 postretirement expense are primarily influenced by general Strategic initiatives and other charges 647 - 2,862 - market conditions impacting investment returns and interest Intangible amortization expense 8,334 6,364 23,264 16,939 (discount) rates. Please note that GAAP pension and postretirement expense or the adjustment above are not Pension and postretirement expense (2) 1,426 2,194 4,276 6,582 necessarily indicative of the current or future cash flow Adjusted operating profit $ 54,531 $ 52,722 $ 133,667 $ 131,857 requirements related to these employee benefit plans. ©2018 Matthews International Corporation. All Rights Reserved. 22

Adjusted EBITDA by Segment Non-GAAP Reconciliation Three Months Ended Nine Months Ended ($ in thousands) June 30, June 30, 2018 2017 2018 2017 (1) SGK Brand Solutions Operating profit $ 8,308 $ 11,390 $ 16,550 $ 19,941 Depreciation and amortization (2) 12,468 12,097 36,486 31,995 Other (3) 256 3,972 114 4,240 EBITDA 21,032 27,459 53,150 56,176 Acquisition-related items (2) 5,162 4,128 14,808 17,005 Strategic initiatives and other charges (4) 303 — 1,001 — Loss recoveries, net of costs — (4,351) — (4,351) Stock-based compensation 1,042 1,296 4,618 5,445 Pension and postretirement expense (5) 663 1,020 1,988 3,060 Adjusted EBITDA $ 28,202 $ 29,552 $ 75,565 $ 77,335 Note: See Disclaimer (Page 2) for Management’s assessment of Memorialization supplemental information related to EBITDA and adjusted Operating profit $ 24,930 $ 23,454 $ 63,294 $ 60,759 EBITDA. Depreciation and amortization (2) 5,980 5,524 16,228 16,627 Other (3) 261 4,058 116 4,331 (1) Information for the nine months ended June 30, 2017 has EBITDA 31,171 33,036 79,638 81,717 been adjusted to reflect the adoption of ASU No. 2016-09. Acquisition-related items (2) 955 1,660 2,586 5,139 The Company early adopted this ASU in the fourth quarter of fiscal 2017, which resulted in a reduction to income tax Strategic initiatives and other charges (4) 344 — 1,274 — Loss recoveries, net of costs — (4,445) — (4,445) expense of $1,234, and a corresponding favorable impact on diluted earnings per share, both of which have been Stock-based compensation 1,166 1,329 5,127 5,588 retroactively included in the first quarter results for fiscal (5) 677 1,042 2,031 3,126 Pension and postretirement expense 2017. There was no impact for the three month period ended Adjusted EBITDA $ 34,313 $ 32,622 $ 90,656 $ 91,125 June 30, 2017. Industrial Technologies (2) One-time depreciation and amortization charges related to recent acquisitions are included in Depreciation and Operating profit $ 4,657 $ 1,942 $ 5,766 $ 1,977 amortization. Depreciation and amortization (2) 1,618 895 4,338 2,188 Other (3) 33 513 15 547 (3) Other represents Investment (loss) income, Other income EBITDA 6,308 3,350 10,119 4,712 (deductions), net, and Net loss (income) attributable to noncontrolling interests Acquisition-related items (2) 112 309 193 753 Strategic initiatives and other charges (4) — — 587 — (4) One-time non-operating related charges are included in the Loss recoveries, net of costs — (562) — (562) calculation of Adjusted EBITDA. Stock-based compensation 191 212 786 821 (5) The non-GAAP adjustment to pension and postretirement Pension and postretirement expense (5) 86 132 257 396 expense represents the add-back of the non-service related Adjusted EBITDA $ 6,697 $ 3,441 $ 11,942 $ 6,120 components of these costs. Non-service related components include interest cost, expected return on plan assets and Consolidated amortization of actuarial gains and losses. The service cost Operating profit $ 37,895 $ 36,786 $ 85,610 $ 82,677 and prior service cost components of pension and post Depreciation and amortization (2) 20,066 18,516 57,052 50,810 retirement expense are considered to be a better reflection Other (3) 550 8,543 245 9,118 of the ongoing service-related costs of providing these EBITDA 58,511 63,845 142,907 142,605 benefits. The other components of GAAP pension and postretirement expense are primarily influenced by general Acquisition-related items (2) 6,229 6,097 17,587 22,897 market conditions impacting investment returns and interest (4) 647 — 2,862 — Strategic initiatives and other charges (discount) rates. Please note that GAAP pension and Loss recoveries, net of costs — (9,358) — (9,358) postretirement expense or the adjustment above are not Stock-based compensation 2,399 2,837 10,531 11,854 necessarily indicative of the current or future cash flow (5) Pension and postretirement expense 1,426 2,194 4,276 6,582 requirements related to these employee benefit plans. Adjusted EBITDA $ 69,212 $ 65,615 $ 178,163 $ 174,580 ©2018 Matthews International Corporation. All Rights Reserved. 23

Third Quarter Fiscal 2018 Earnings Teleconference July 27, 2018 ©2018 Matthews International Corporation. All Rights Reserved.
