Attached files
| file | filename |
|---|---|
| 8-K - 8-K - BYLINE BANCORP, INC. | by-8k_20180726.htm |

Q2 2018 Financial Results Exhibit 99.1
Forward Looking Statements This communication contains forward-looking statements within the meaning of the U.S. federal securities laws. Forward-looking statements include, without limitation, statements concerning plans, estimates, calculations, forecasts and projections with respect to the anticipated future performance of the Company and its business. These statements are often, but not always, made through the use of words or phrases such as ‘‘may’’, ‘‘might’’, ‘‘should’’, ‘‘could’’, ‘‘predict’’, ‘‘potential’’, ‘‘believe’’, ‘‘expect’’, ‘‘continue’’, ‘‘will’’, ‘‘anticipate’’, ‘‘seek’’, ‘‘estimate’’, ‘‘intend’’, ‘‘plan’’, ‘‘projection’’, ‘‘would’’, ‘‘annualized’’, “target” and ‘‘outlook’’, or the negative version of those words or other comparable words or phrases of a future or forward-looking nature. Forward-looking statements reflect various assumptions and involve elements of subjective judgement and analysis, which may or may not prove to be correct, and which are subject to uncertainties and contingencies outside the control of Byline and its respective affiliates, directors, employees and other representatives, which could cause actual results to differ materially from those presented in this communication. No representations, warranties or guarantees are or will be made by Byline as to the reliability, accuracy or completeness of any forward-looking statements contained in this communication or that such forward-looking statements are or will remain reliable, accurate or complete based on current reasonable assumptions. You should not place undue reliance on any forward-looking statements contained in this communication. Forward-looking statements speak only as of the date they are made, and we assume no obligation to update any of these statements in light of new information, future events or otherwise unless required under the federal securities laws.
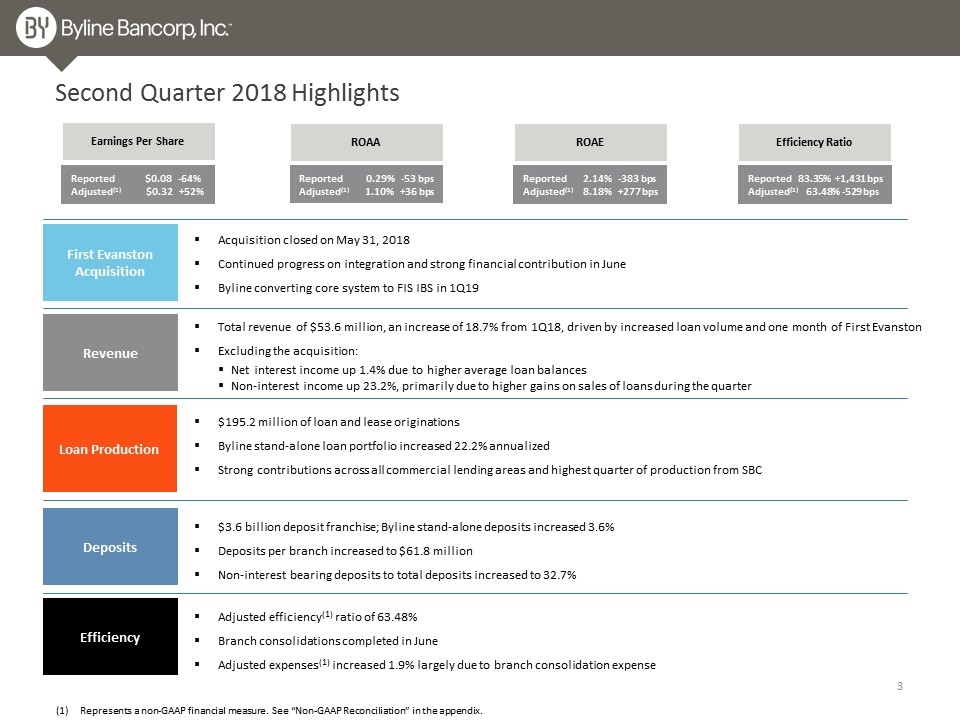
Second Quarter 2018 Highlights Loan Production First Evanston Acquisition Revenue Deposits $195.2 million of loan and lease originations Byline stand-alone loan portfolio increased 22.2% annualized Strong contributions across all commercial lending areas and highest quarter of production from SBC Total revenue of $53.6 million, an increase of 18.7% from 1Q18, driven by increased loan volume and one month of First Evanston Excluding the acquisition: Net interest income up 1.4% due to higher average loan balances Non-interest income up 23.2%, primarily due to higher gains on sales of loans during the quarter $3.6 billion deposit franchise; Byline stand-alone deposits increased 3.6% Deposits per branch increased to $61.8 million Non-interest bearing deposits to total deposits increased to 32.7% Efficiency Acquisition closed on May 31, 2018 Continued progress on integration and strong financial contribution in June Byline converting core system to FIS IBS in 1Q19 Adjusted efficiency(1) ratio of 63.48% Branch consolidations completed in June Adjusted expenses(1) increased 1.9% largely due to branch consolidation expense Represents a non-GAAP financial measure. See “Non-GAAP Reconciliation” in the appendix. Earnings Per Share Reported $0.08 -64% Adjusted(1) $0.32 +52% ROAA ROAE Efficiency Ratio Reported 0.29% -53 bps Adjusted(1) 1.10% +36 bps Reported 2.14% -383 bps Adjusted(1) 8.18% +277 bps Reported 83.35% +1,431 bps Adjusted(1) 63.48% -529 bps
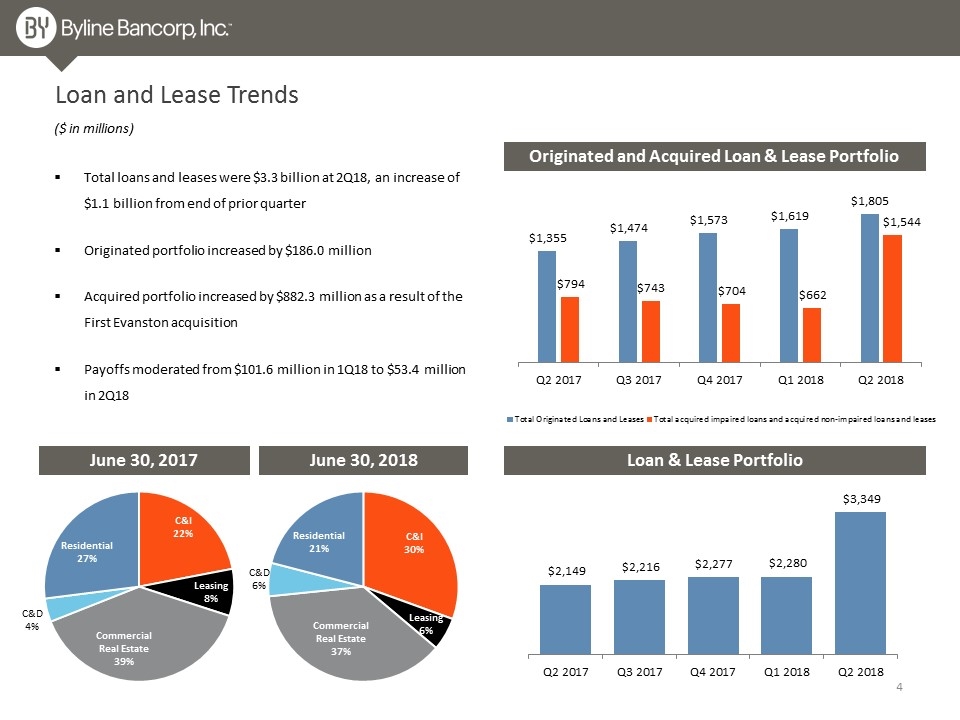
Loan and Lease Trends Loan & Lease Portfolio June 30, 2017 June 30, 2018 ($ in millions) Originated and Acquired Loan & Lease Portfolio Total loans and leases were $3.3 billion at 2Q18, an increase of $1.1 billion from end of prior quarter Originated portfolio increased by $186.0 million Acquired portfolio increased by $882.3 million as a result of the First Evanston acquisition Payoffs moderated from $101.6 million in 1Q18 to $53.4 million in 2Q18
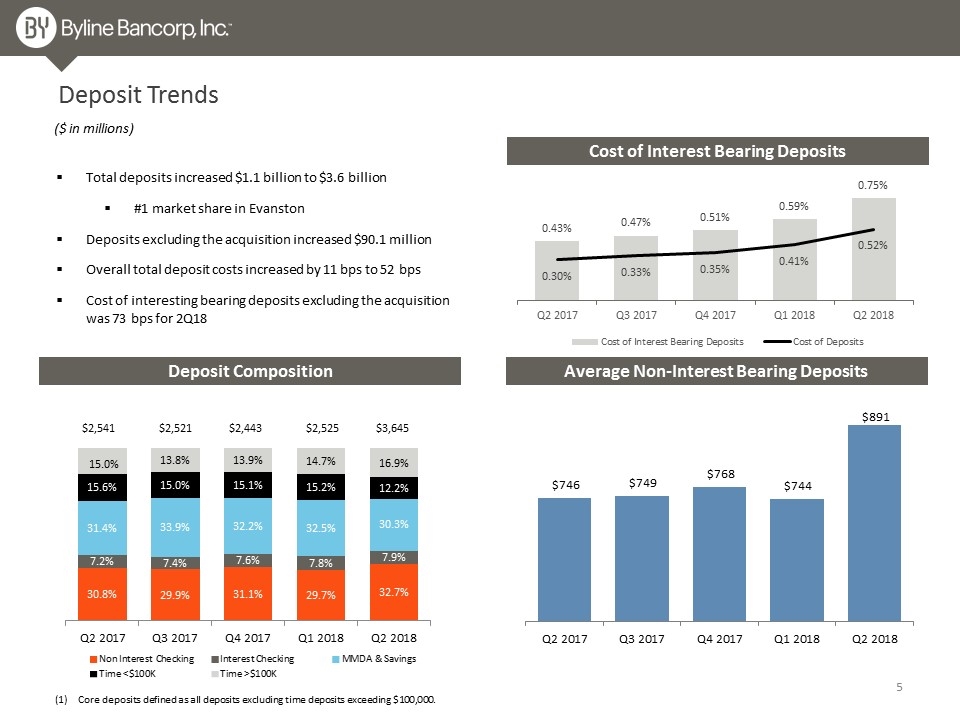
Total deposits increased $1.1 billion to $3.6 billion #1 market share in Evanston Deposits excluding the acquisition increased $90.1 million Overall total deposit costs increased by 11 bps to 52 bps Cost of interesting bearing deposits excluding the acquisition was 73 bps for 2Q18 Deposit Trends Average Non-Interest Bearing Deposits ($ in millions) Deposit Composition (1) Core deposits defined as all deposits excluding time deposits exceeding $100,000. $2,521 $2,443 $3,645 $2,541 Cost of Interest Bearing Deposits $2,525
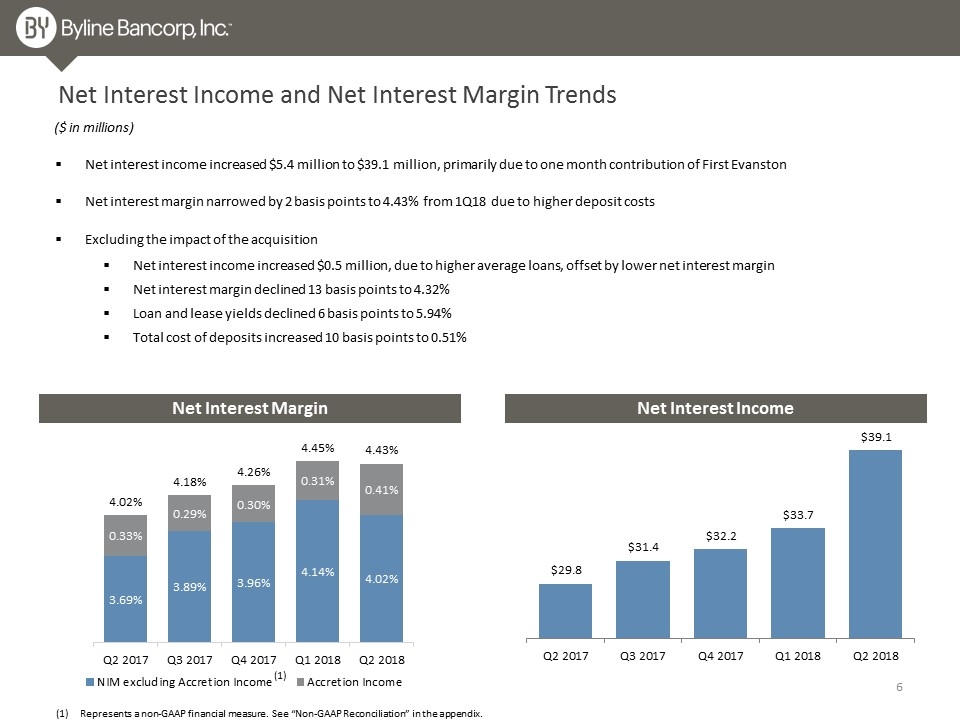
Net Interest Income and Net Interest Margin Trends Net interest income increased $5.4 million to $39.1 million, primarily due to one month contribution of First Evanston Net interest margin narrowed by 2 basis points to 4.43% from 1Q18 due to higher deposit costs Excluding the impact of the acquisition Net interest income increased $0.5 million, due to higher average loans, offset by lower net interest margin Net interest margin declined 13 basis points to 4.32% Loan and lease yields declined 6 basis points to 5.94% Total cost of deposits increased 10 basis points to 0.51% Net Interest Margin Net Interest Income Represents a non-GAAP financial measure. See “Non-GAAP Reconciliation” in the appendix. ($ in millions) (1)
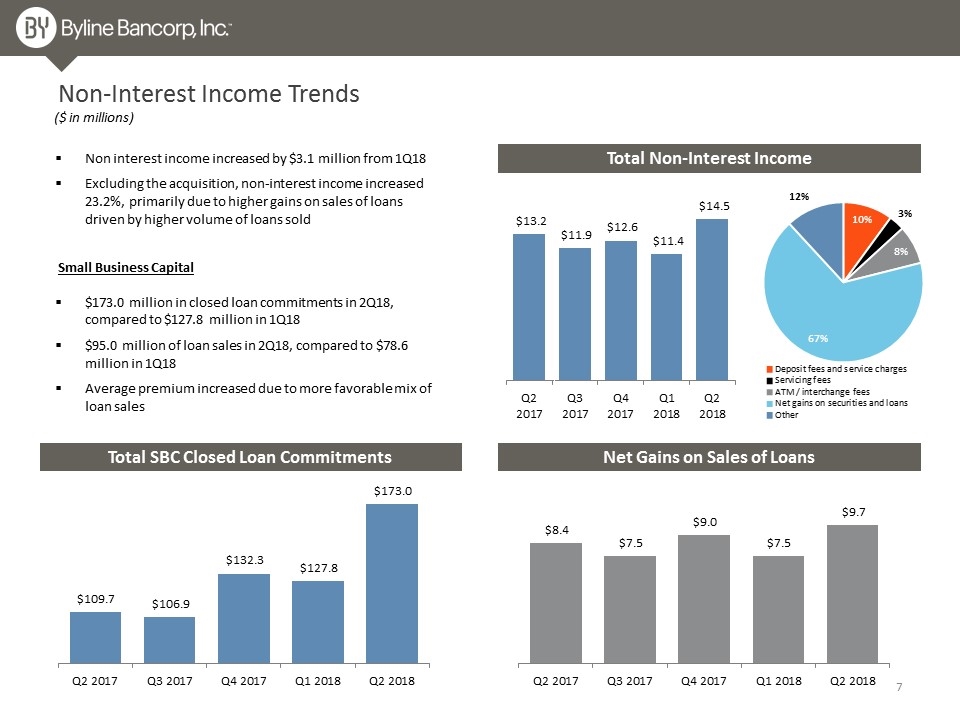
Total Non-Interest Income Non-Interest Income Trends Non interest income increased by $3.1 million from 1Q18 Excluding the acquisition, non-interest income increased 23.2%, primarily due to higher gains on sales of loans driven by higher volume of loans sold ($ in millions) Total SBC Closed Loan Commitments Net Gains on Sales of Loans $173.0 million in closed loan commitments in 2Q18, compared to $127.8 million in 1Q18 $95.0 million of loan sales in 2Q18, compared to $78.6 million in 1Q18 Average premium increased due to more favorable mix of loan sales Small Business Capital
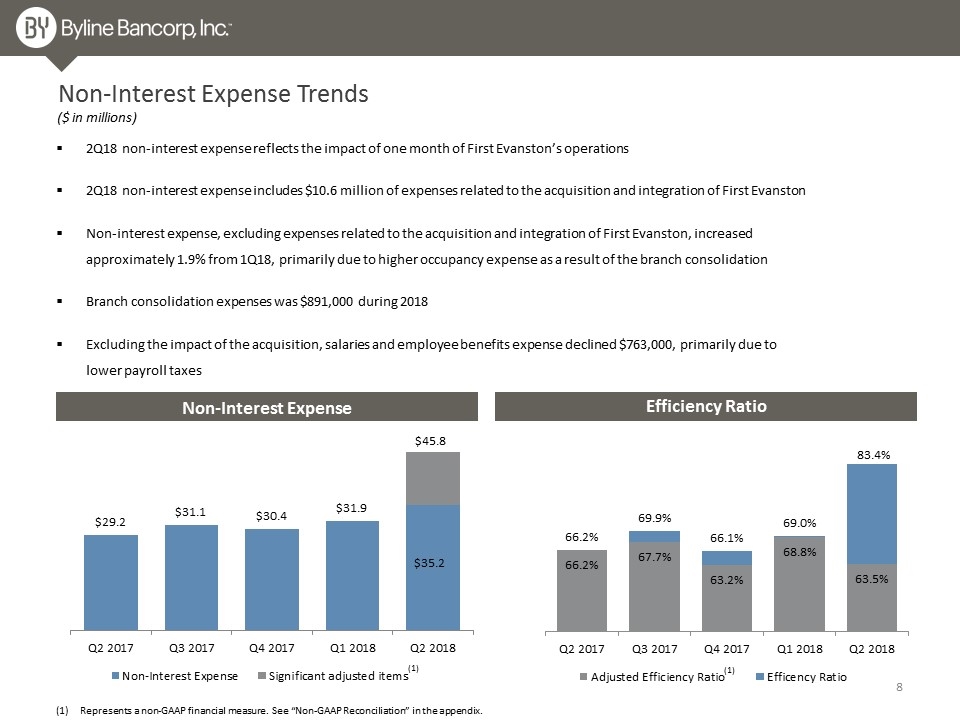
Non-Interest Expense Trends 2Q18 non-interest expense reflects the impact of one month of First Evanston’s operations 2Q18 non-interest expense includes $10.6 million of expenses related to the acquisition and integration of First Evanston Non-interest expense, excluding expenses related to the acquisition and integration of First Evanston, increased approximately 1.9% from 1Q18, primarily due to higher occupancy expense as a result of the branch consolidation Branch consolidation expenses was $891,000 during 2018 Excluding the impact of the acquisition, salaries and employee benefits expense declined $763,000, primarily due to lower payroll taxes ($ in millions) Efficiency Ratio Non-Interest Expense Represents a non-GAAP financial measure. See “Non-GAAP Reconciliation” in the appendix. (1) (1)
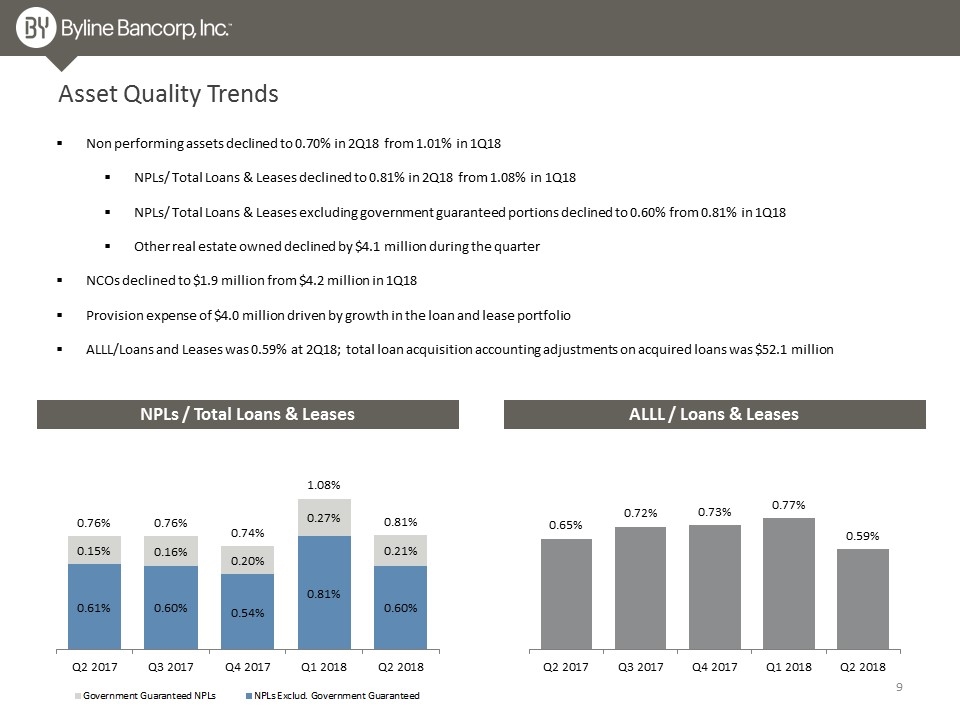
Asset Quality Trends Non performing assets declined to 0.70% in 2Q18 from 1.01% in 1Q18 NPLs/ Total Loans & Leases declined to 0.81% in 2Q18 from 1.08% in 1Q18 NPLs/ Total Loans & Leases excluding government guaranteed portions declined to 0.60% from 0.81% in 1Q18 Other real estate owned declined by $4.1 million during the quarter NCOs declined to $1.9 million from $4.2 million in 1Q18 Provision expense of $4.0 million driven by growth in the loan and lease portfolio ALLL/Loans and Leases was 0.59% at 2Q18; total loan acquisition accounting adjustments on acquired loans was $52.1 million NPLs / Total Loans & Leases ALLL / Loans & Leases

Appendix
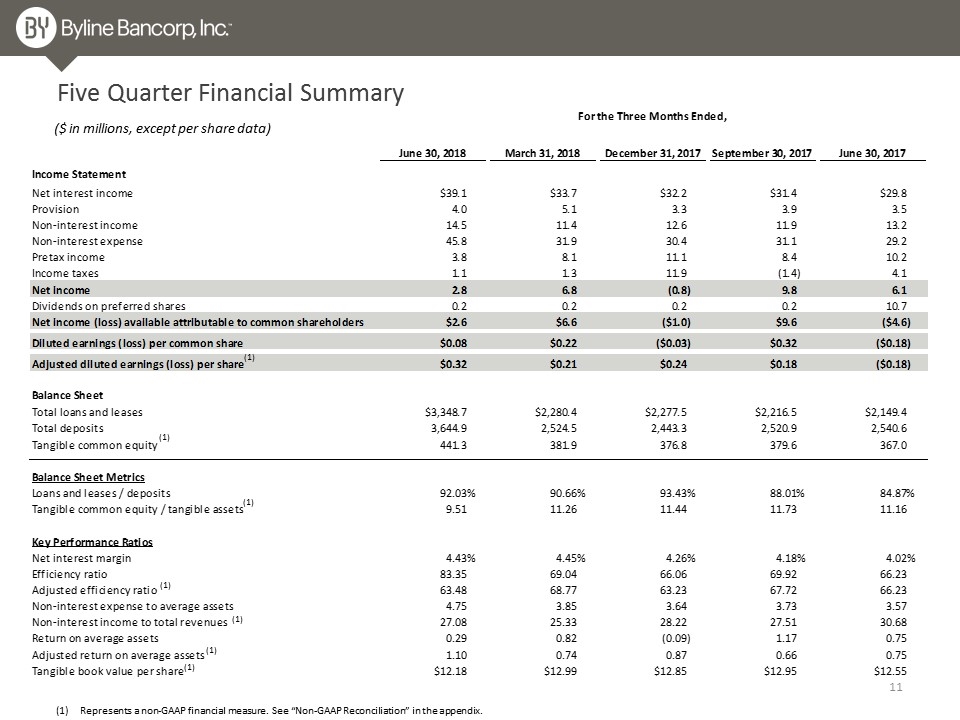
Five Quarter Financial Summary ($ in millions, except per share data) Represents a non-GAAP financial measure. See “Non-GAAP Reconciliation” in the appendix. (1) (1) (1) (1) (1) (1) (1)
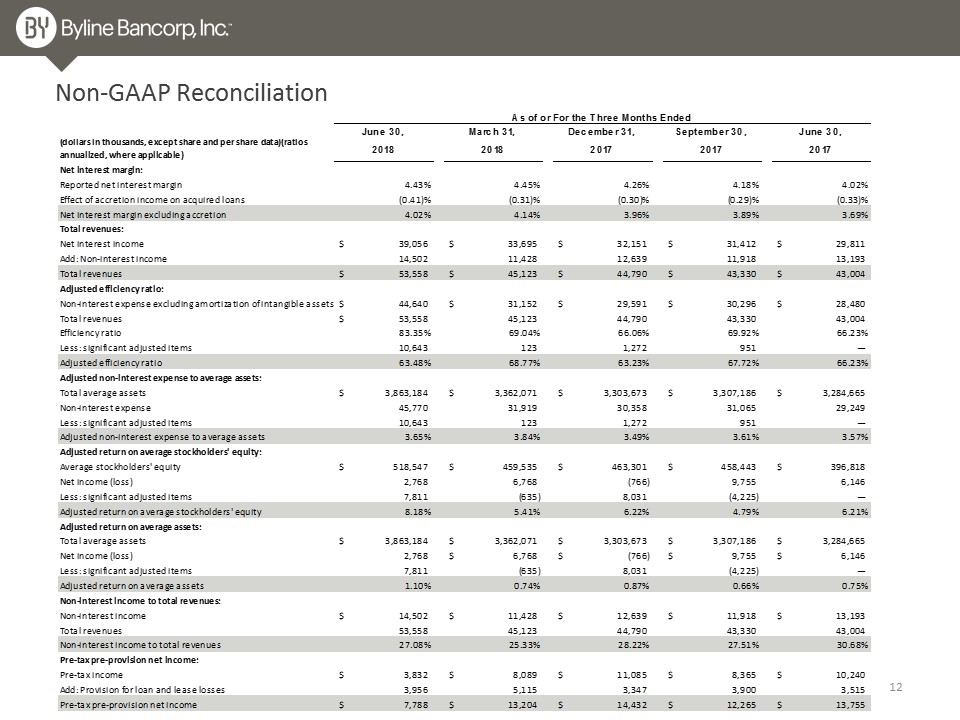
Non-GAAP Reconciliation
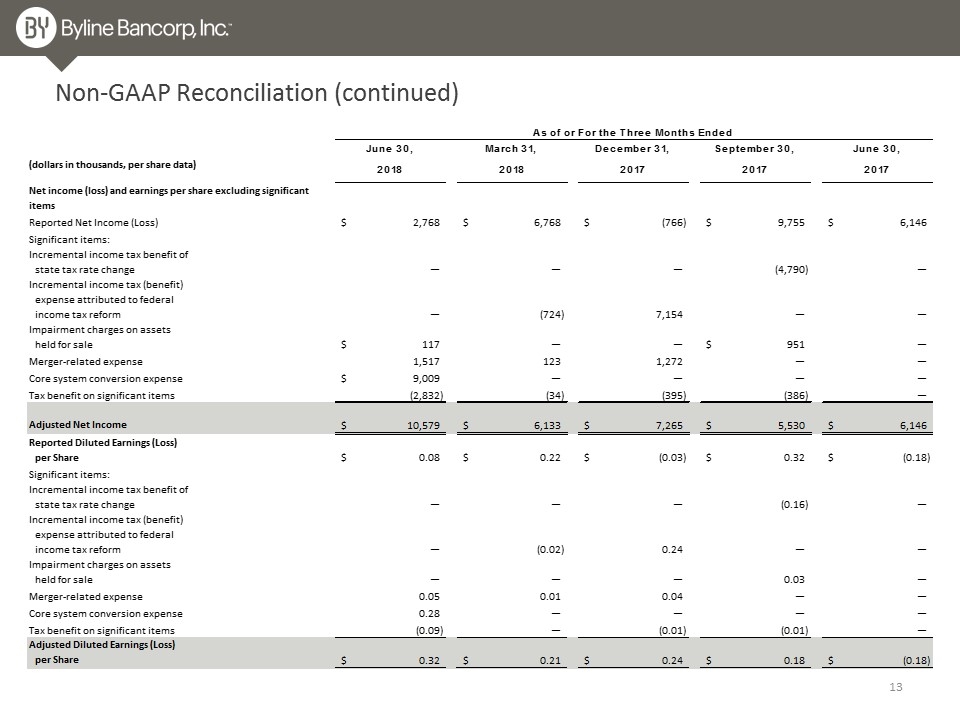
Non-GAAP Reconciliation (continued)
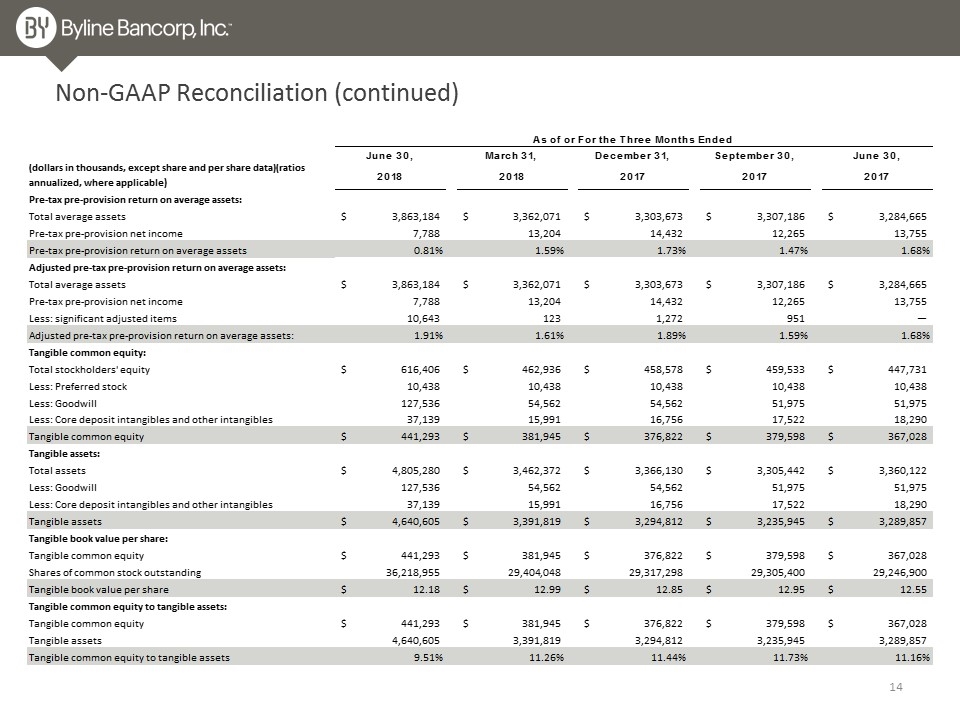
Non-GAAP Reconciliation (continued)
