Attached files
| file | filename |
|---|---|
| 8-K - FORM 8-K - Ameris Bancorp | tv499471_8k.htm |
| EX-99.1 - EXHIBIT 99.1 - Ameris Bancorp | tv499471_ex99-1.htm |
Exhibit 99.2
Ameris Bancorp 2 nd Quarter 2018 Results Investor Presentation

This presentation contains certain performance measures determined by methods other than in accordance with accounting principles generally accepted in the United States of America (“GAAP”) . Management of Ameris Bancorp (the “Company”) uses these non - GAAP measures in its analysis of the Company’s performance . These measures are useful when evaluating the underlying performance and efficiency of the Company’s operations and balance sheet . The Company’s management believes that these non - GAAP measures provide a greater understanding of ongoing operations, enhance comparability of results with prior periods and demonstrate the effects of significant gains and charges in the current period . The Company’s management believes that investors may use these non - GAAP financial measures to evaluate the Company’s financial performance without the impact of unusual items that may obscure trends in the Company’s underlying performance . These disclosures should not be viewed as a substitute for financial measures determined in accordance with GAAP, nor are they necessarily comparable to non - GAAP performance measures that may be presented by other companies . Tangible common equity and Tier 1 capital ratios are non - GAAP measures . The Company calculates the Tier 1 capital ratio using current call report instructions . The Company’s management uses these measures to assess the quality of capital and believes that investors may find them useful in their evaluation of the Company . These capital measures may, or may not be necessarily comparable to similar capital measures that may be presented by other companies . This presentation may contain statements that constitute “forward - looking statements” within the meaning of Section 27 A of the Securities Act of 1933 , as amended, and Section 21 E of the Securities Exchange Act of 1934 , as amended . The words “believe”, “estimate”, “expect”, “intend”, “anticipate” and similar expressions and variations thereof identify certain of such forward - looking statements, which speak only as of the dates which they were made . The Company undertakes no obligation to publicly update or revise any forward - looking statements, whether as a result of new information, future events or otherwise . Readers are cautioned that any such forward - looking statements are not guarantees of future performance and involve risks and uncertainties and that actual results may differ materially from those indicated in the forward - looking statements as a result of various factors . Readers are cautioned not to place undue reliance on these forward - looking statements and are referred to the Company’s periodic filings with the Securities and Exchange Commission for a summary of certain factors that may impact the Company’s results of operations and financial condition . Cautionary Statements 1

ROA of 1 . 55 % and ROTCE of 19 . 45 % in the 2 Q 2018 . Up from 1 . 32 % and 14 . 86 % in the same quarter of 2017 . ( 1 ) • Improvement from balance sheet growth, stable margin and improving efficiency as well as reduced tax rates • Operating efficiency ratio improved to 57 . 53 % , with catalysts already in place for material improvement • Margin stable at 3 . 83 % with interest bearing deposit beta of 28 % (core Ameris Bank before impact of ACFC) The Ameris Bancorp Story Top Quartile Results Leader in M&A in the Southeast • Evaluate M&A opportunities that fit within our culture • Focused on organizations that have diversified loan portfolios and REAL deposit franchises • Not looking at deals that dilute TBV or that require exhaustive strategies to realize meaningful economics ( 1 ) Excludes merger and conversion charges, Executive Chairman retirement benefits, loss on sale of premises and certain credit costs associated with premium finance division that management does not anticipate going forward . Top Quartile Organic Growth Rates • Organic loan growth of $ 268 . 0 million, or 18 . 4 % annualized, in 2 Q 18 • Year - over - year organic growth in noninterest bearing deposits of $ 232 . 7 million, or 13 . 9 % annualized • CRE concentrations are low and afford the Company room to grow • Loan and deposit growth outlook still in mid double - digits 2

Acquisitions Completed in 2Q18 • Atlantic Coast Financial Corporation (“Atlantic”) – Forecasted $14.1 million of cost saves; Identified and realized $15.7 million – Added $874.9 million in total assets, $758.5 million in loans and $584.1 million in total deposits – Issued 2,631,520 shares of the Ameris common stock at a value on the closing date of $147.8 million – Data conversion also complete in 2Q18; Operating efficiencies immediate in 3Q18 – 2Q Impact of $0.03; Expected additional impact to 3Q18 EPS of $0.05 • Hamilton State Bancshares, Inc. (“Hamilton”) – Forecasted $14.5 million of cost saves; Identified $15.3 million – Added $1.8 billion in total assets, $1.3 billion in loans and $1.6 billion in total deposits – Issued 6,548,385 shares of the Ameris common stock at a value on the closing date of $349.4 million – Data conversion planned for early 4Q18; Operating efficiencies effective 4Q18 – Expected impact to 3Q18 EPS of $0.05; Expected additional impact to 4Q18 EPS of $0.03 • Including all merger costs, the reduction of $0.18 per share to the Company’s TBV – earn back period of less than 4 months 3

Clear Path to Future Increase in EPS 2018 Impact Items: • Atlantic and Hamilton positive impact to EPS going forward: – 2Q18 only included one month of Atlantic – 2Q18 only included one day of Hamilton • Continued organic growth in loans and deposits with stable margins • Maintain stable level of noninterest expense 2019 Impact Items: • Operating Efficiencies Identified (Data Processing, Occupancy, etc.) to offset Crossing $10 Billion Infrastructure Costs • Maintain Stable Margin while continuing balance sheet growth • Reliable and profitable growth in Lines of Business (Mortgage, SBA, Premium Finance) 4

Impact of Recently Closed M&A on Future Quarters 5 2Q18 Normalized Run Rate Additional ACFC & HMBH Impact on 3Q18 ACFC & HMBH Impact on 4Q18 over 3Q impact Net Interest Income 81,832 22,796 - Non - Interest Income 29,196 2,704 - Non - Interest Expense 66,973 9,788 (2,303) Average Diluted Shares O/S 39,565 8,230 8,230 Average Earning Assets 7,822,647 2,455,667 2,455,667 Average Assets 8,575,541 2,623,267 2,623,267 Total revenue from two deals normalized at approximately $113.5 million, annually. Opex burden, after integration, expected to be between $33.9 and $35.3 million, annually. ABCB will achieve its stated economics on both deals with no balance sheet growth and no revenue synergies, which we believe are meaningful opportunities. Fourth quarter impact on non - interest expense reflects savings from system conversion and integration in October 2018.

Earnings Summary – Operating Basis 6 Quarter to Date Results Year To Date Results 2Q 18 2Q 17 Change 2018 2017 Change Operating Earnings $ 29,239 $ 23,458 25% $ 57,019 $ 45,064 27% Earnings Per Share $ 0.74 $ 0.63 17% $ 1.46 $ 1.23 19% Return on Assets 1.37% 1.32% 4% 1.40% 1.29% 9% Return on TCE 17.26% 14.86% 16% 17.24% 15.31% 13% NIM (net of accretion) 3.81% 3.77% 1% 3.82% 3.78% 1% Efficiency Ratio 57.53% 59.37% - 3% 58.67% 59.51% - 1% Net Overhead Ratio 1.71% 1.51% 13% 1.66% 1.56% 6%

2Q 2018 Operating Highlights • Growth in adjusted net earnings of 24.6% compared with 2Q 2017 • Organic Loan Growth of $268.0 million, or 18.4% annualized during 2Q 2018 • Year over year organic growth in noninterest bearing deposits of $222.3 million, or 14.2% • Net Interest Margin (excluding accretion) declined by 3bps compared to 1Q 2018 • Operating efficiency ratio of 57.53% compared to 59.95% in 1Q 2018 • Total Revenue of $107.3 million, growth of 17.5% compared to 2Q 2017 • Legacy non - accrual assets improved to 0.29% of total assets • Increase in TBV to $17.12 per share, compared with $16.90 per share at March 31, 2018 7

Credit Quality Update • 2Q18 Provision Expense increased to $9.1 million • $6.7 million related to Premium Finance Division: – Related to two acquired loan relationships to insurance agencies (general operating lines) – These were all acquired business loans acquired in the premium finance transaction, but were not traditional premium finance loans – The remaining balance of these type of loans was $18.1 million, or 3.3% of the total premium finance portfolio (average loan balance of approximately $300k). • Credit Quality in Remainder of Portfolio Remains Excellent: – Originated NPA’s as % of total assets decreased four basis points to 0.29% – Net Charge - offs, including the PF charges above were 0.26%. (0.11% normalized excluding these amounts) – Criticized loans as % of total loans decreased seven basis points 8

Diversified Loan Portfolio Agriculture 2.6% C&I 17.2% MUNI 7.1% Consumer 5.0% Investor CRE 18.7% Owner - Occupied CRE 11.8% AC&D 10.9% Multi - Family 3.4% SFR Mortgage 23.4% 2Q 2018 Loan Portfolio • Largest category of loans < 24% of total • Participations purchased < 1% of total loans • Average loan size = $205M • Only 10.9% of total loans in Construction or A&D • CRE and C&D concentrations are 268% and 88%, respectively • Approval authority vested in 6 Regional Credit Officers. Credit Admin team includes 25 Portfolio Managers, as well as credit support teams specifically for construction management, CRE underwriting and Municipal loans. 9

Operating Highlights (1) Asset growth is materially impacted in 2Q18 by the acquisitions of Atlantic and Hamilton (2) Core Operating expenses exclude merger related charges, Executive Chairman retirement costs and gain/loss on sale of premises (3) Operating efficiency ratio is Core Operating Expenses divided by Net Interest Income and Non - interest income 10 For the quarter For the year to date period 2Q18 2Q17 2018 2017 Asset Growth (1) 3,167,869 505,827 3,334,494 505,827 Asset Growth Rate 163.53% 14.68% 170.24% 14.68% Organic Loan Growth 268,020 391,339 421,795 489,851 Organic Loan Growth Rate 18.35% 32.92% 14.83% 21.12% Total Revenue (1) 107,306 91,346 202,571 177,642 Total Revenue Growth 17.47% 10.10% 14.03% 12.65% Core Operating Expenses (2) 62,343 55,169 120,023 107,565 Core OPEX Growth 13.00% 8.08% 11.58% 6.21% Operating Efficiency (3) 57.53% 59.37% 58.67% 59.51% Legacy NPAs / Assets 0.29% 0.41% Credit Related Costs 10,155 2,804 12,505 5,573

Total Revenue Spread Revenues • $1.24 billion or 18.8% growth in average earning assets over 2Q 2018 • Steady margin with strong growth in existing rate environment. Margin (excluding accretion) of 3.81% in current quarter compared to 3.77% a year ago Non - Interest Income • Mortgage Revenue – increased $947,000, or 6.8% over 2Q 2017 despite tighter gain on sale. Production increased 30.5% to offset the reduced gain on sale • Service charges – remained steady at $10.6 million due to competitive service charge routines – we remain focused on attracting quality customers • SBA revenues – remained stable compared to 2Q18 due to steady production and slightly increased premium on sale 11

Net Interest Margin Spread Income and Margin supported by: • Growth in average earning assets of $1.24 billion or 18.8% compared to 2Q17 • Margin (excluding accretion) higher by 4bps compared to 2Q17; despite tax equivalent yield affect of 6bps due to tax law change • Margin (excluding accretion) lower by 3bps compared to 1Q18 due to higher loan yields offset by increased funding costs Accretion income a decreasingly lower part of our revenues: • 2.0% of revenue in YTD 2018 (6 mos ) • 2.9% of revenue in YTD 2017 • 4.3% of revenue in YTD 2016 Slight margin compression despite growth in earning assets in current rate environment Loan Production Details Period Fixed Rate (2) Variable Rate (2) Total 2Q18 242.7 5.36% 254.4 5.51% 497.1 5.44% 1Q18 230.4 5.10% 187.2 5.30% 417.6 5.19% 4Q17 264.2 4.79% 203.9 5.03% 468.1 4.89% $51.3 $54.4 $56.0 $59.3 $61.9 $65.9 $69.4 $68.3 $74.3 3.79% 3.77% 3.80% 3.82% 3.84% 3.81% 3.00% 3.50% 4.00% 4.50% $20.0 $30.0 $40.0 $50.0 $60.0 $70.0 $80.0 2Q 16 3Q 16 4Q 16 1Q 17 2Q 17 3Q 17 4Q17 1Q18 2Q18 Net Interest Income before Accretion (in millions) 12

Expenses – 2Q18 • Basically no increase in core bank operating expenses • Increase in operating expense in lines of business relates to higher commissions and incentives, due to increased production • Continue to monitor expense control throughout the company and look for efficiencies in our administrative functions • Adjusted operating expenses ( 1 ) increased $ 4 . 6 million in 2 Q 18 , compared to 1 Q 18 : – $ 2 . 2 million increase in commissions and incentives due to increased production – $ 1 . 3 million increase in intangible amortization due to acquisitions – $ 496 , 000 increase in loss on OREO – $ 708 , 000 net increase in all other operating expenses 1 – Adjusted operating expenses exclude Credit resolution related expenses, merger and conversion costs, Executive Chairman reti rement benefits and special compliance charges in 4Q16 and 3Q17. OPEX Highlights: Steady, Adjusted Operating Expenses (1) 13 $12.1 $10.7 $13.7 $14.4 $16.6 $15.6 $14.2 $18.5 $40.9 $37.8 $38.7 $40.8 $41.9 $42.1 $43.5 $43.8 0.0 25.0 50.0 75.0 3Q 16 4Q 16 1Q 17 2Q 17 3Q 17 4Q 17 1Q 18 2Q 18 Core Operating Expenses (in millions) LOBs Bank
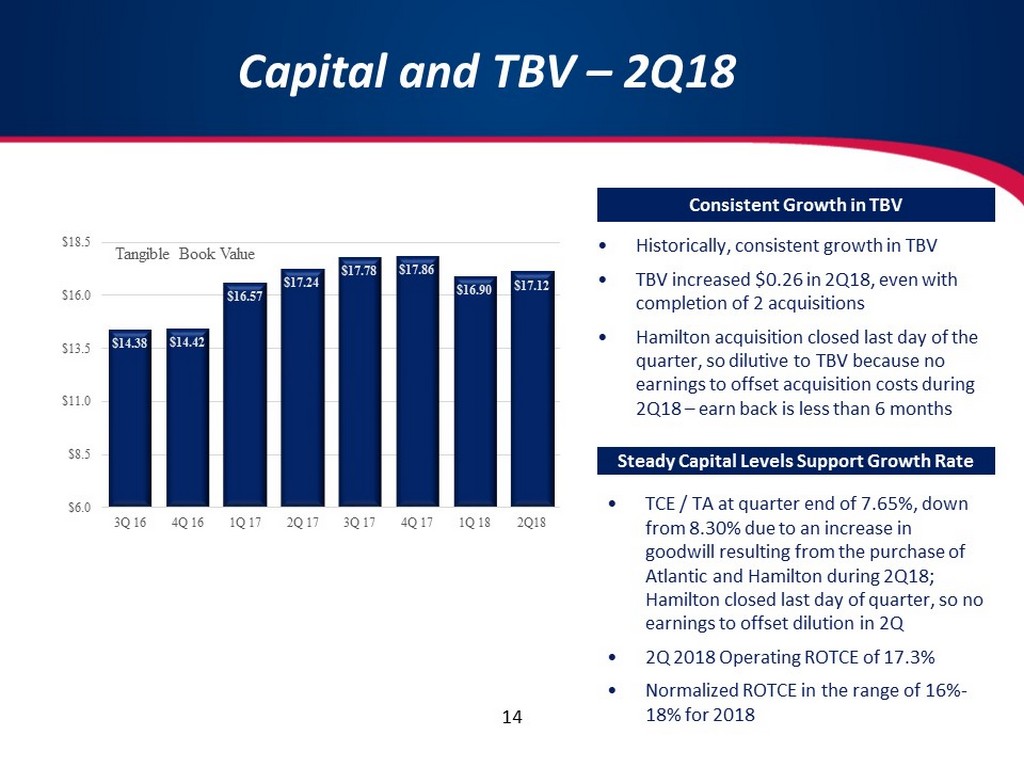
Capital and TBV – 2Q18 • Historically, consistent growth in TBV • TBV increased $0.26 in 2Q18, even with completion of 2 acquisitions • Hamilton acquisition closed last day of the quarter, so dilutive to TBV because no earnings to offset acquisition costs during 2Q18 – earn back is less than 6 months Consistent Growth in TBV • TCE / TA at quarter end of 7.65%, down from 8.30% due to an increase in goodwill resulting from the purchase of Atlantic and Hamilton during 2Q18; Hamilton closed last day of quarter, so no earnings to offset dilution in 2Q • 2Q 2018 Operating ROTCE of 17.3% • Normalized ROTCE in the range of 16% - 18% for 2018 Steady Capital Levels Support Growth Rate 14 $14.38 $14.42 $16.57 $17.24 $17.78 $17.86 $16.90 $17.12 $6.0 $8.5 $11.0 $13.5 $16.0 $18.5 3Q 16 4Q 16 1Q 17 2Q 17 3Q 17 4Q 17 1Q 18 2Q18 Tangible Book Value

Investment Rationale Organic Growth Opportunities • Top Quartile Return on Assets • Strong ROTCE’s that support organic and M&A growth • Efficiency ratio below 60 % with catalysts that will drive us into lower 50 % range over next 18 months Operating Performance Valuation • Material discount on earnings relative to southeastern peer group suggest upside, particularly considering : – Top quartile operating ratios – Reliable growth outlook (balance sheet and earnings) that are not dependent on increasing prices for M&A . • Organic growth opportunities already producing double digit growth • Recently completed acquisitions put us in Orlando, Tampa and Atlanta with enough presence to improve already strong growth rates • Deposit growth is challenging but we have grown while managing a best in class deposit beta 15

Ameris Bancorp Press Release & Financial Highlights June 30, 2018