Attached files
| file | filename |
|---|---|
| 8-K - FORM 8-K - AMERISERV FINANCIAL INC /PA/ | tv499543_8k.htm |
Exhibit 99.1

AmeriServ Financial, Inc. (ASRV) Investor Presentation July 2018 1

Forward - Looking Statements 2 This presentation contains various forward - looking statements and includes assumptions concerning the Company’s beliefs, plans, objectives, goals, expectations, anticipations, estimates, intentions, operations, future results, and prospects, incl udi ng statements that include the words “may,” “could,” “should,” “would,” “believe,” “expect,” “anticipate,” “estimate,” “intend,” “project,” “plan” or similar expressions. These forward - looking statements are based upon current expectations, are subject to risk and uncertainties and are applicable only as of the dates of such statements. Forward - looking statements involve risks, uncertainties and assumptions. Although we do not make forward - looking statements unless we believe we have a reasonable basis for doing so, we cannot guarantee their accuracy. You should not put undue reliance on any forward - looking statements. These statements speak only as of the date of this presentation, even if subsequently made available on our website or otherwise, and we undertake no obligation to update or revise these statements to reflect events or circumstances occurring after the date of this presentation. In connection with the “safe harbor” provisions of the Private Securities Litigation Reform Act of 1995, the Company provides the following cautionary statement identifying important factors (some of which are beyond the Company’s control) which could cause the actual results or events to differ materially from those set forth in or implied by the forward - looking statements and related assumptions. Such factors include the following: ( i ) the effect of changing regional and national economic conditions; (ii) the effects of trade, monetary and fiscal policies and laws, including interest rate policies of the Federal Reserve; (iii) significant changes in int erest rates and prepayment speeds; (iv) inflation, stock and bond market, and monetary fluctuations; (v) credit risks of commercial , real estate, consumer, and other lending activities; (vi) changes in federal and state banking and financial services laws an d regulations; (vii) the presence in the Company’s market area of competitors with greater financial resources than the Company ; (viii) the timely development of competitive new products and services by the Company and the acceptance of those products and services by customers and regulators (when required); (ix) the willingness of customers to substitute competitors’ produc ts and services for those of the Company and vice versa; (x) changes in consumer spending and savings habits; (xi) unanticipated regulatory or judicial proceedings; and (xii) other external developments which could materially impact the Company’s operational and financial performance. The foregoing list of important factors is not exclusive, and neither such list nor any forward - looking statement takes into account the impact that any future acquisition may have on the Company and on any such forward - looking statement.

ASRV Branches Loan Production Offices Overview of AmeriServ Financial Inc. Branch Map Overview ▪ $1.2 Billion Community Bank Headquartered in Johnstown, PA ▪ 15 Retail Branches ▪ 3 Loan Production Offices ▪ Sizable Wealth Management Company with $2 Billion Assets Under Administration ▪ Stable deposit base in core markets with largest deposit market share (23%) in Cambria County ▪ Commercial Loan Portfolio well diversified in nearby faster growing markets Financial Highlights as of 06/30/2018 ($ Millions except per share data) Total Assets $1180.8 Total Loans $ 895.2 Total Deposits $ 928.2 Shareholders Equity $ 96.9 Net Income $ 3.5 Earnings Per Share $ 0.19 Tangible Book Value/Share $ 4.71 NASDAQ Ticker Symbol ASRV Market Cap $ 76.0 3

AmeriServ Financial, Inc. Strategic Plan 2017 - 2019 • Built around Banking for Life philosophy • Focuses on four key constituencies – Shareholders – Customers – Staff – Communities 4
AmeriServ Strategic Plan 5 Create long - term value for our shareholders by: – Maintaining financially strong balance sheet – Appropriately managing risk – Consistently improving shareholder returns

6 Financially Strong Balance Sheet Loan Portfolio Composition ($mm) As of June 30, 2018 Residential Mortgage $146.3 Home Equity & Consumer $105.1 Commercial & Industrial $170.2 Commercial Real Estate $473.6 $895.2 Million 72% Commercial / 28% Retail Non - Owner Occupied CRE / Total Capital Ratio: 345%

7 Financially Strong Balance Sheet Commercial Loan Portfolio Diversification ($mm) Loan Total = $ 642.2 Million As of June 30, 2018 $194.8 30% $223.5 35% $122.0 19% $101.9 16% Johnstown Pittsburgh Hagerstown State College/Altoona

Total Average Loans (Millions) 500 600 700 800 900 2012 2013 2014 2015 2016 2017 June 30 2018 689 746 805 857 888 894 882 8

9 Financially Strong Balance Sheet Deposit Composition ($mm) As of June 30, 2018 Demand Deposits $184.3 Savings, NOW & Money Market , $479.1 Certificates of Deposit $233.3 Jumbo Certificates of Deposit $31.5 $928.2 Million 20% 3% 25% 52%
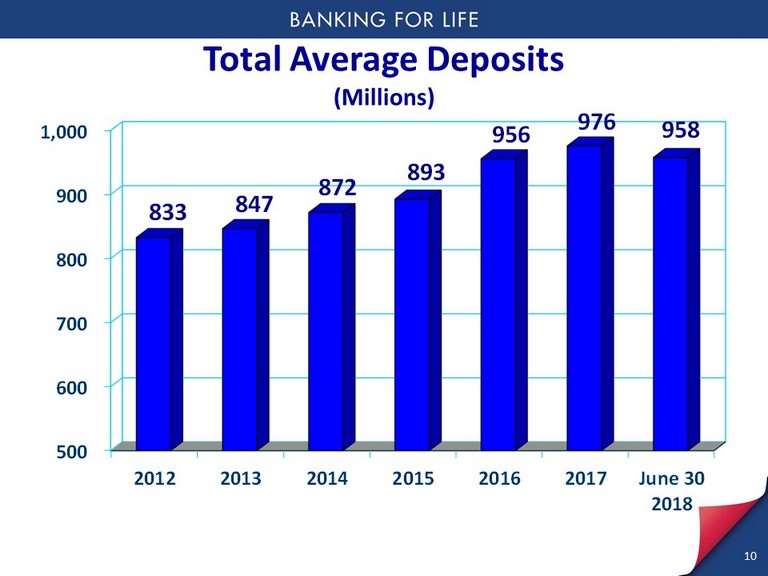
Total Average Deposits (Millions) 500 600 700 800 900 1,000 2012 2013 2014 2015 2016 2017 June 30 2018 833 847 872 893 956 976 958 10
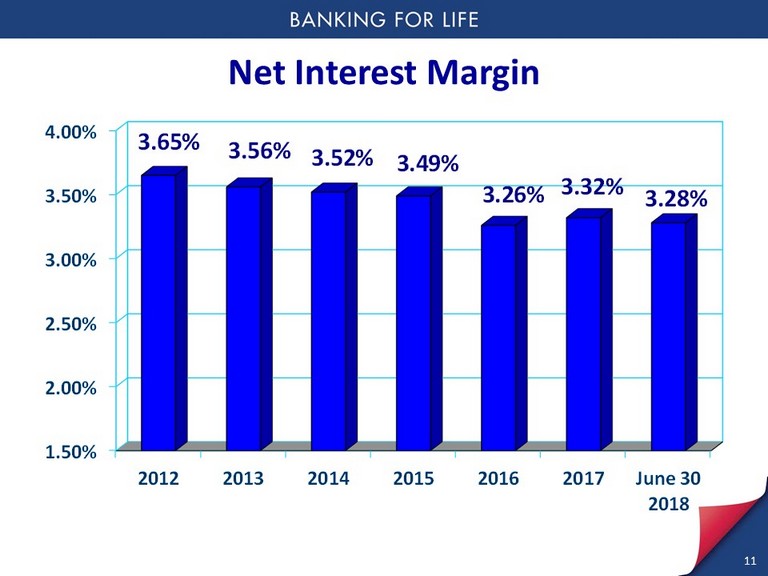
Net Interest Margin 1.50% 2.00% 2.50% 3.00% 3.50% 4.00% 2012 2013 2014 2015 2016 2017 June 30 2018 3.65% 3.56% 3.52% 3.49% 3.26% 3.32% 3.28% 11

$0 $4,000 $8,000 $12,000 1Q '16 2Q 3Q 4Q 1Q '17 2Q 3Q 4Q 1Q '18 2Q Loan Loss Reserve Non Performing Assets 317 % 437 % 510 % 612 % 677 % 440 % 193 % 337 % 460 % 821 % Allowance for Loan Loss vs. Non - Performing Assets (Thousands) 12
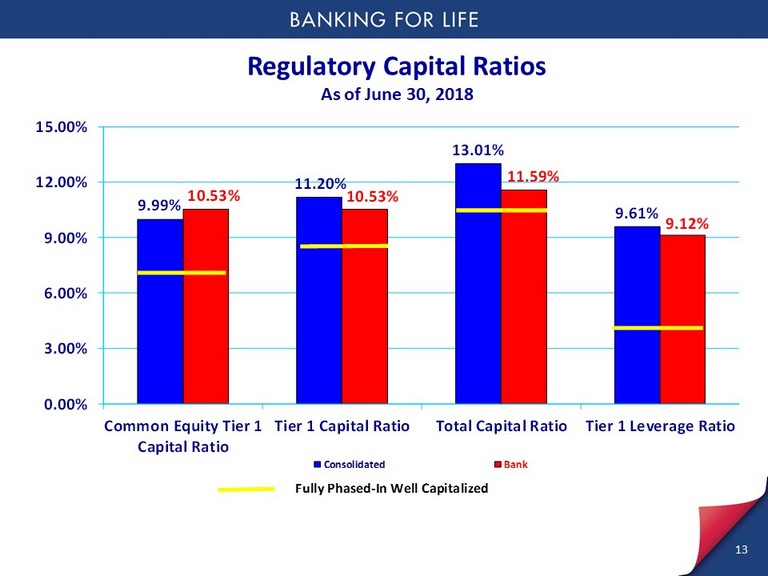
9.99% 11.20% 13.01% 9.61% 10.53% 10.53% 11.59% 9.12% 0.00% 3.00% 6.00% 9.00% 12.00% 15.00% Common Equity Tier 1 Capital Ratio Tier 1 Capital Ratio Total Capital Ratio Tier 1 Leverage Ratio Consolidated Bank Fully Phased - In Well Capitalized Regulatory Capital Ratios As of June 30, 2018 13

AmeriServ Strategic Plan Shareholder value creation focuses on: – Increasing Earnings Per Share (EPS) – Providing Strong Capital Returns to Shareholders 14

AmeriServ Strategic Plan 15 Increasing Earnings Per Share (EPS) – Striving to grow EPS by at least 10% annually – Improve profitability metrics – Narrow financial performance gap – Careful balance sheet and income statement management

Earnings Per Share $0.00 $0.05 $0.10 $0.15 $0.20 $0.25 $0.30 $0.35 2012 2013 2014 2015 2016 2017 June 30 2018 $0.21 $0.26 $0.15 $0.31 $0.12 $0.18 $0.19 16

Earnings Per Share (excluding the one time additional income tax expense) $0.00 $0.05 $0.10 $0.15 $0.20 $0.25 $0.30 $0.35 2012 2013 2014 2015 2016 2017 June 30 2018 $0.21 $0.26 $0.15 $0.31 $0.12 $0.32 $0.19 17

-$0.10 -$0.05 $0.00 $0.05 $0.10 1Q '16 2Q 3Q 4Q 1Q '17 2Q 3Q 4Q 1Q '18 2Q - $0.07 $0.07 $0.06 $0.06 $0.07 $0.07 $0.08 - $0.05 $0.10 $0.10 Earnings per Share 18

AmeriServ Financial 2017 19 Key Strategic Financial Accomplishments – Achieved 10% EPS annual growth goal with reported EPS increasing 50% and adjusted EPS excluding tax charge increasing 167% – Achieved positive operating leverage as total revenue grew while total non - interest expense declined – Maintained strong asset quality resulting in reduced loan loss provision and lower net charge - offs – Strengthened regulatory capital ratios

AmeriServ Strategic Plan Strong Capital Returns to Shareholders – Strategic plan goal – Return 75% of earnings to shareholders through a combination of dividends and share repurchases – Subject to maintaining sufficient capital to support balance sheet growth 20

2017 Capital Returns 21 2017 Net Income (excluding tax charge) $5,917,000 Common Stock Repurchase Program $3,405,000 Common Stock Dividend Payments $1,113,000 Total Capital Returned to Shareholders $4,518,000 % of Earnings Returned to Shareholders 76.4%
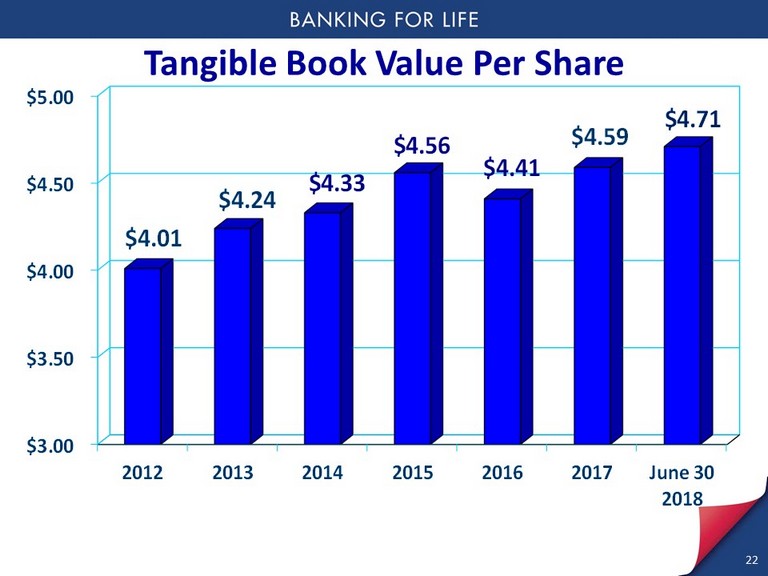
Tangible Book Value Per Share $3.00 $3.50 $4.00 $4.50 $5.00 2012 2013 2014 2015 2016 2017 June 30 2018 $4.01 $4.24 $4.33 $4.56 $4.41 $4.59 $4.71 22
AmeriServ Financial 2017 23 Key Strategic Customer Accomplishments – Introduced AmeriServ Financial Banking Center concept at University Heights and North Atherton Locations – Provides customers with a comprehensive offering of financial solutions including retail and business banking, home mortgages and wealth management at one location – Completed in a cost effective manner as two existing branches were closed and customer accounts were consolidated into these newly renovated banking centers

AmeriServ Financial 2017 24 Key Strategic Technology Accomplishments – Cost effectively leverage technology with core systems vendor contract extension – New contract enables us to install several platform enhancements including: Consumer eBanking (with mobile), Business eBanking (with new mobile feature), Hosted ACH Tracker, Online Account Opening, New Account Desk and more tailored deposit service charging capabilities

AmeriServ Financial 2017 25 Key Strategic Technology Accomplishments – Technology platform conversions are ongoing and will continue over next two years – Cost effective contract extension will save Company approximately $600,000 in vendor - related costs over contract term – Developed and launched new AmeriServ Website and Digital Strategy

AmeriServ Financial 2017 26 Key Strategic Employee Accomplishments – New 4 - year labor contract with United Steelworkers of America – Key financial terms – • Annual wage increases of 3% • Transition of union employees to new exclusive health care provider plan insures better control of future health care costs – Expect defined benefit pension plan cost will continue to decline in future years.

AmeriServ Financial 2017 27 Key Strategic Wealth Management Accomplishments – Developed new strategic plan that focuses on revenue expansion of business lines – Continue to invest in talent within wealth management business – Unique ERECT Fund product allows us to leverage union relations for revenue growth – Important strategically for AmeriServ Financial since non - interest income represents almost 30% of total revenue
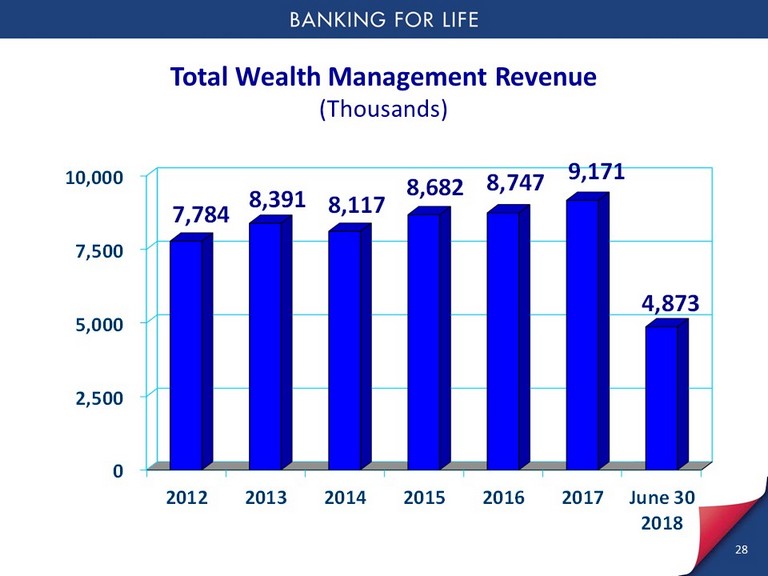
28 Total Wealth Management Revenue (Thousands) 0 2,500 5,000 7,500 10,000 2012 2013 2014 2015 2016 2017 June 30 2018 7,784 8,391 8,117 8,682 8,747 9,171 4,873
AmeriServ Financial 2018 29 Outlook 2018 – Key Strategic Initiatives – Continue to execute strategic plan and further improve earnings – Bring as much income tax savings from corporate tax reform to bottom line so we can accrete capital faster and further close financial performance gap to peer – Maintain strong asset quality and sound credit underwriting while further strengthening risk management practices related to commercial real estate concentrations

AmeriServ Financial 2018 30 Outlook 2018 – Key Strategic Initiatives – Further grow Maryland presence by consolidating successful Hagerstown Loan Production Office into new full - service AmeriServ Financial Banking Center in Hagerstown, Maryland.

0 20,000 40,000 60,000 80,000 100,000 120,000 140,000 2012 2013 2014 2015 2016 2017 8,800 42,899 67,523 90,547 110,732 125,822 31 Hagerstown, Maryland Loan Production Office Commercial Loans Outstanding (Thousands)

AmeriServ Financial 2018 32 Outlook 2018 – Key Strategic Initiatives – Further leverage union - related revenue streams through expansion of affinity group mortgage and consumer loan programs
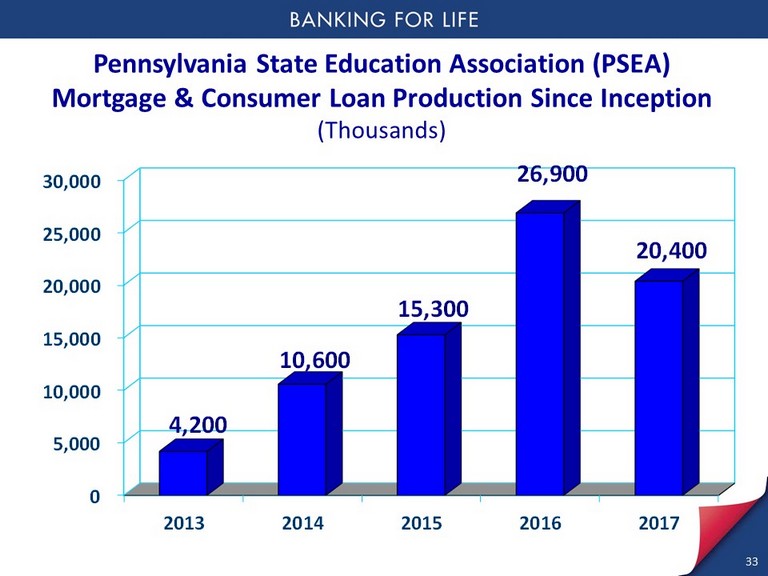
0 5,000 10,000 15,000 20,000 25,000 30,000 2013 2014 2015 2016 2017 4,200 10,600 15,300 26,900 20,400 33 Pennsylvania State Education Association (PSEA) Mortgage & Consumer Loan Production Since Inception (Thousands)

AmeriServ Financial 2018 34 Outlook 2018 – Key Strategic Initiatives – Increase common stock price through improved earnings and active capital returns to shareholders while ensuring we maintain sufficient capital to support balance sheet growth

AmeriServ Strategic Plan 35 Outlook 2018 – Strong Capital Returns to Shareholders – April 2018: Increased quarterly common stock cash dividend by ½ cent or 33% to $0.02 per share – 1 st Quarter 2018: Completed most recently authorized common stock buyback program by repurchasing 106,000 shares at a cost of $ 445,000 – This means we completed buyback program in 14 months by repurchasing 945,000 shares at a total cost of $ 3.8 million or average price of $4.07 per share

AmeriServ Strategic Plan 36 Outlook 2018 – Strong Capital Returns to Shareholders – Accretive use of capital given all shares were repurchased at a price below tangible book value per share which currently rests at $4.71 – Buyback program beneficial to EPS; able to spread increased earnings over a smaller number of shares – In July 2018 announced a new buyback program that targets the repurchase of 3% of outstanding common stock or 545,000 shares over the next 12 months.
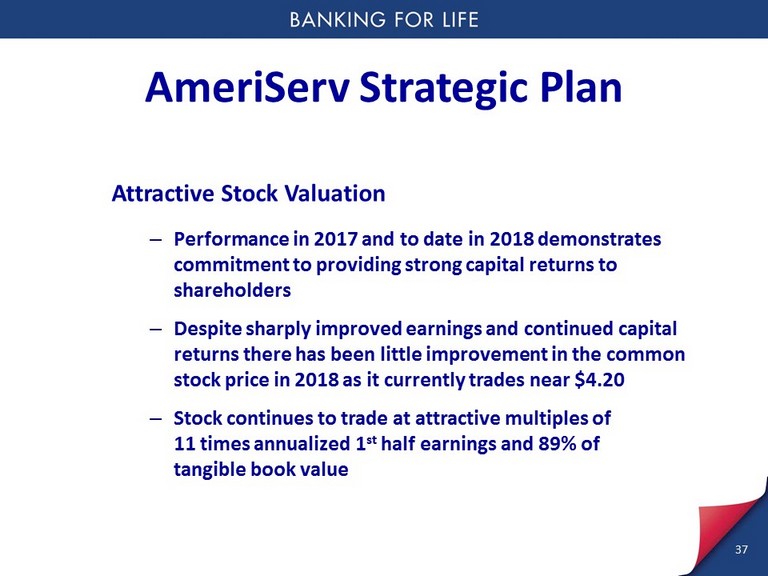
AmeriServ Strategic Plan 37 Attractive Stock Valuation – Performance in 2017 and to date in 2018 demonstrates commitment to providing strong capital returns to shareholders – Despite sharply improved earnings and continued capital returns there has been little improvement in the common stock price in 2018 as it currently trades near $4.20 – Stock continues to trade at attractive multiples of 11 times annualized 1 st half earnings and 89% of tangible book value