Attached files
| file | filename |
|---|---|
| 8-K - FORM 8-K - Prime Meridian Holding Co | d592067d8k.htm |
Exhibit 99.1

Investor Presentation 2018Q2 PRIME MERIDIAN HOLDING COMPANY
Forward Looking Statements This Presentation, including information incorporated herein by reference, may contain forward-looking statements within the meaning of the Private Securities Litigation Reform Act of 1995. Words such as “may,” “could,” “should,” “would,” “believe,” “anticipate,” “estimate,” “expect,” “intend,” “plan,” “project,” “is confident that,” and similar expressions are intended to identify these forward-looking statements. These forward-looking statements involve risk and uncertainty and a variety of factors could cause our actual results and experience to differ materially from the anticipated results or other expectations expressed in these forward-looking statements. We do not have a policy of updating or revising forward looking statements except as otherwise required by law, and silence by management over time should not be construed to mean that actual events are occurring as estimated in such forward-looking statements. Our ability to predict results or the actual effect of future plans or strategies is inherently uncertain. Factors that could have a material adverse effect on our operations and the operations of our subsidiary, Prime Meridian Bank, include, but are not limited to, changes in: • risk factors named in the Prospectus • general economic conditions • legislative/regulatory changes • monetary and fiscal policies of the U.S. Government • the quality and composition of our loan or investment portfolios • competition • demand for loan and deposit products • demand for financial services in our primary trade area • litigation, tax, and other regulatory matters • accounting principles and guidelines • other economic, competitive, governmental, regulatory, or technological factors affecting us The factors listed above should not be construed as exhaustive. A number of important factors could cause actual results to differ materially from those indicated by the forward-looking statements. Information on these factors can be found in the Company’s Annual Report on Form 10-K for the year ended December 31, 2017, and other reports and statements Prime Meridian Holding Company has filed with the Securities and Exchange Commission which are available at its website (www.sec.gov). We do not have a policy of updating or revising forward-looking statements except as otherwise required by law, and silence by management over time should not be construed to mean that actual events are occurring as estimated in such forward-looking statements. INVESTORS.PRIMEMERIDIANBANK.COM | OTCQX: PMHG 2
Contents 4 Company Profile 5 Management Team 6 Personnel Profile 7 MSA Profile 8 Summary Results 10 Increasing Franchise Value Total Assets | Gross Loans | Total Deposits | Cost of Funds 11 Building Shareholder Value Total Equity | Net Income | Tangible Book Value Per Share | Earnings Per Share 12 Loan Portfolio 13 Residential Loan Portfolio 14 Portfolio Risk Management | CRE Commitments 15 Funding Overview 16 Deposit Market Share 17 Investment Considerations 21 Company Culture 24 Appendix Financial Highlights | Consolidated Statements of Earnings | Balance Sheets Updated as of 6/30/2018 INVESTORS.PRIMEMERIDIANBANK.COM | OTCQX: PMHG 3
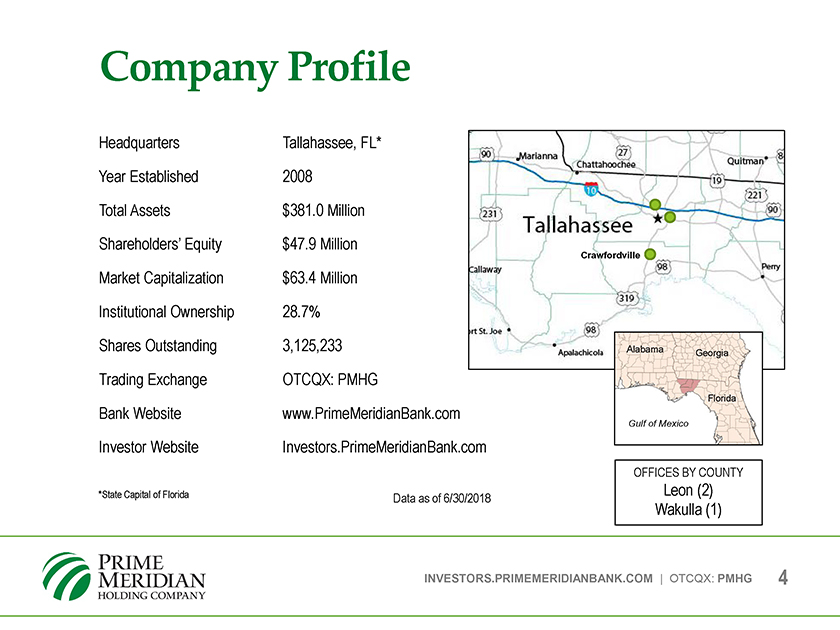
Company Profile Headquarters Tallahassee, FL* Year Established 2008 Total Assets $381.0 Million Shareholders’ Equity $47.9 Million Crawfordville Market Capitalization $63.4 Million Institutional Ownership 28.7% Shares Outstanding 3,125,233 Alabama Georgia Trading Exchange OTCQX: PMHG Bank Website www.PrimeMeridianBank.com Florida Gulf of Mexico Investor Website Investors.PrimeMeridianBank.com OFFICES BY COUNTY *State Capital of Florida Leon (2) Data as of 6/30/2018 Wakulla (1) INVESTORS.PRIMEMERIDIANBANK.COM | OTCQX: PMHG 4

Management Team Experienced management team with proven track record of franchise growth and development Community leaders who know their clients History of profitable bank operations Sammie D. Dixon, Jr. Vice Chairman, President and Chief Executive Officer Age: 48 | 21 years banking experience R. Randy Guemple Executive Vice President and Chief Financial Officer Age: 66 | 40 years banking and CPA experience Chris L. Jensen, Jr. Executive Vice President and Chief Lending Officer Age: 61 | 39 years banking experience Susan Payne Turner Executive Vice President and Chief Risk Officer Age: 51 | 36 years banking experience INVESTORS.PRIMEMERIDIANBANK.COM | OTCQX: PMHG 5
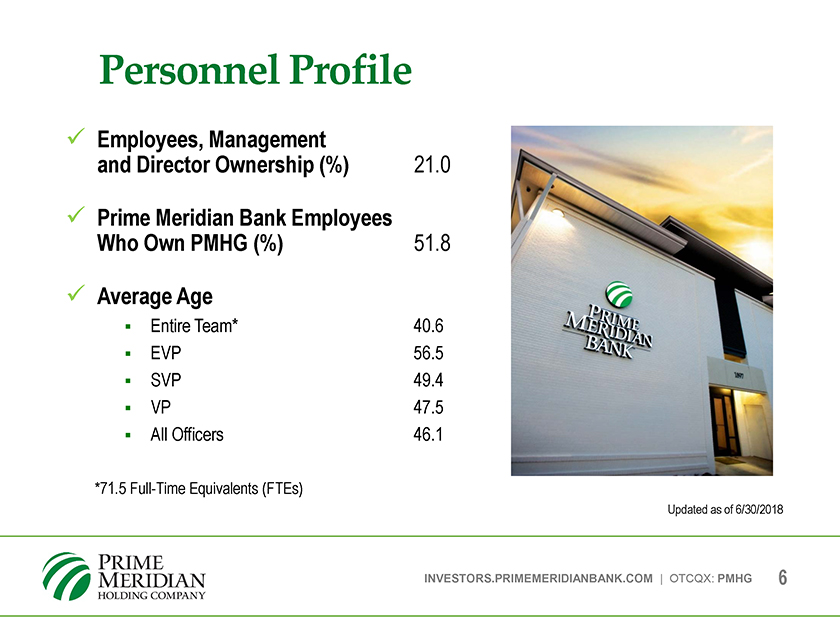
Personnel Profile Employees, Management and Director Ownership (%) 21.0 Prime Meridian Bank Employees .8 Who Own PMHG (%) 51 Average Age Entire Team* 40.6 EVP 56.5 SVP 49.4 VP 47.5 All Officers 46.1 *71.5 Full-Time Equivalents (FTEs) Updated as of 6/30/2018 INVESTORS.PRIMEMERIDIANBANK.COM | OTCQX: PMHG 6
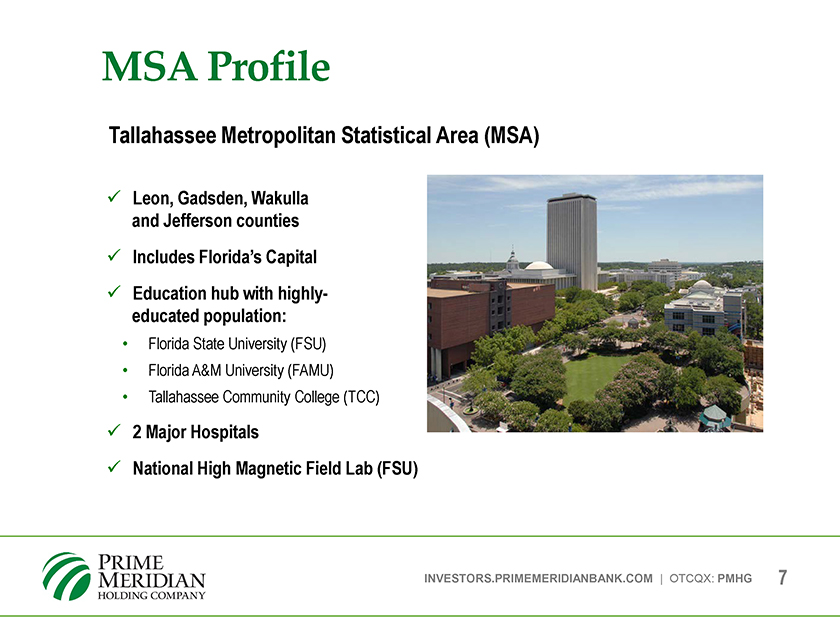
MSA Profile Tallahassee Metropolitan Statistical Area (MSA) Leon, Gadsden, Wakulla and Jefferson counties Includes Florida’s Capital Education hub with highly-educated population: Florida State University (FSU) Florida A&M University (FAMU) Tallahassee Community College (TCC) 2 Major Hospitals National High Magnetic Field Lab (FSU) INVESTORS.PRIMEMERIDIANBANK.COM | OTCQX: PMHG 7
Summary Results | 2018Q2 Net income grew $248,000, or 32.9%, over last quarter and $237,000, or 31.0% over the second quarter of 2017, while earnings per share grew 33.3% on a linked quarter basis and 6.7% over the second quarter of 2017. Net interest income grew 5.3% over the prior quarter and 16.9% over the second quarter of 2017. Loans increased 4.7% since March 31, 2018 and 17.9% since June 30, 2017. INVESTORS.PRIMEMERIDIANBANK.COM | OTCQX: PMHG 8
Summary Results | 2018Q2 Deposits increased 7.3% since March 31, 2018 and 13.6% since June 30, 2017. For the quarter ended June 30, 2018, the annualized Return on Average Assets was 1.10% and the annualized Return on Average Equity was 8.49%. INVESTORS.PRIMEMERIDIANBANK.COM | OTCQX: PMHG 9
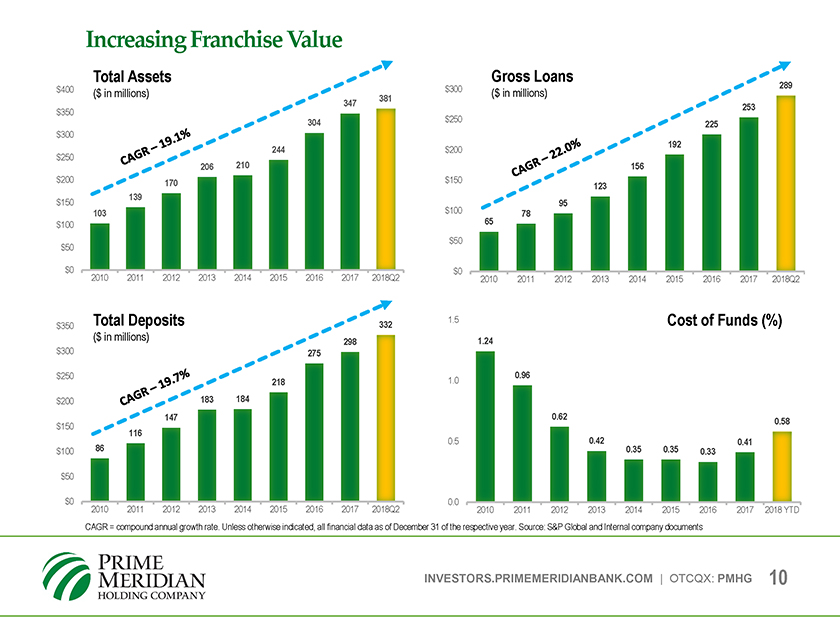
Increasing Franchise Value Total Assets Gross Loans $400 $300 289 ($ in millions) 381 ($ in millions) 347 253 $350 304 $250 225 $300 192 244 $200 $250 206 210 156 $200 170 $150 139 123 $150 95 103 $100 78 $100 65 $50 $50 $0 $0 2010 2011 2012 2013 2014 2015 2016 2017 2018Q2 2010 2011 2012 2013 2014 2015 2016 2017 2018Q2 Total Deposits 332 1.5 Cost of Funds (%) $350 ($ in millions) 298 1.24 $300 275 $250 0.96 218 1.0 $200 183 184 $150 147 0.62 0.58 116 0.5 0.42 0.41 $100 86 0.35 0.35 0.33 $50 $0 0.0 2010 2011 2012 2013 2014 2015 2016 2017 2018Q2 2010 2011 2012 2013 2014 2015 2016 2017 2018 YTD CAGR = compound annual growth rate. Unless otherwise indicated, all financial data as of December 31 of the respective year. Source: S&P Global and Internal company documents INVESTORS.PRIMEMERIDIANBANK.COM | OTCQX: PMHG 10
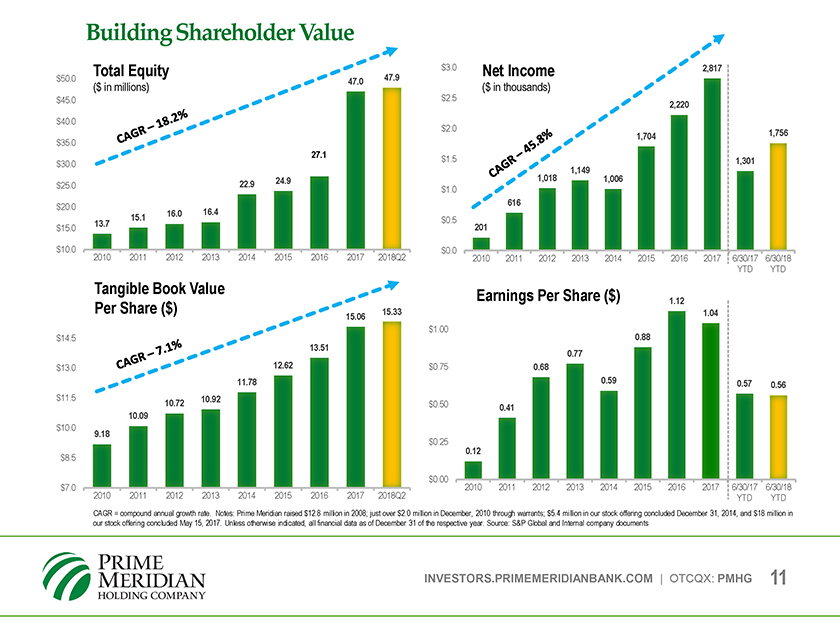
Building Shareholder Value Total Equity 47.9 $3.0 Net Income 2,817 $50.0 47.0 ($ in millions) $2.5 ($ in thousands) $45.0 2,220 $40.0 $2.0 1,756 1,704 $35.0 27.1 $1.5 $30.0 1,301 1,149 24.9 1,018 1,006 $25.0 22.9 $1.0 $20.0 616 16.0 16.4 15.1 $0.5 $15.0 13.7 201 $10.0 $0.0 2010 2011 2012 2013 2014 2015 2016 2017 2018Q2 2010 2011 2012 2013 2014 2015 2016 2017 6/30/17 6/30/18 YTD YTD Tangible Book Value Earnings Per Share ($) 1.12 Per Share ($) 15.33 1.04 15.06 $1.00 $14.5 13.51 0.88 0.77 $13.0 12.62 $0.75 0.68 11.78 0.59 0.57 0.56 $11.5 10.92 10.72 $0.50 0.41 10.09 $10.0 9.18 $0.25 0.12 $8.5 $0.00 $7.0 2010 2011 2012 2013 2014 2015 2016 2017 6/30/17 6/30/18 2010 2011 2012 2013 2014 2015 2016 2017 2018Q YTD YTD CAGR = compound annual growth rate. Notes: Prime Meridian raised $12.8 million in 2008; just over $2.0 million in December, 2010 through warrants; $5.4 million in our stock offering concluded December 31, 2014, and $18 million in our stock offering concluded May 15, 2017. Unless otherwise indicated, all financial data as of December 31 of the respective year. Source: S&P Global and Internal company documents INVESTORS.PRIMEMERIDIANBANK.COM | OTCQX: PMHG 11
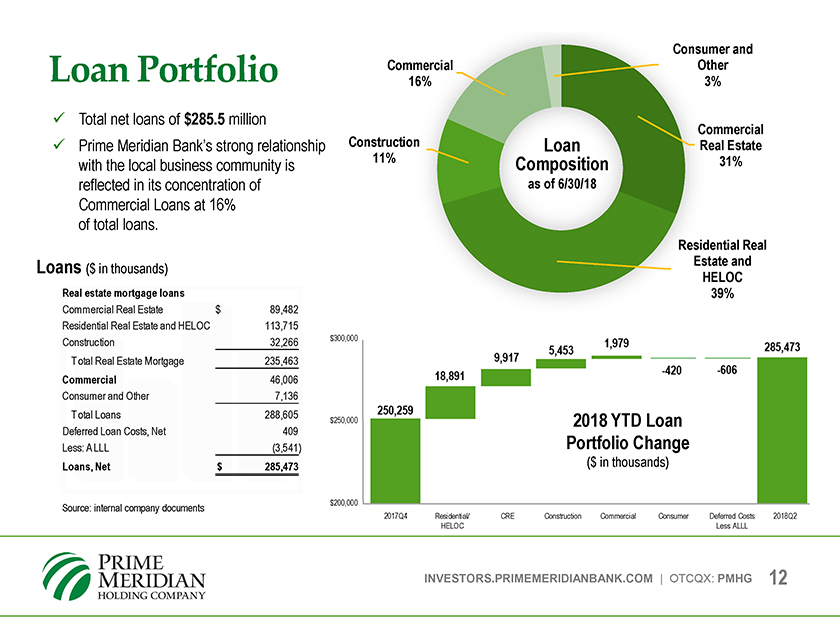
Loan Portfolio Commercial Consumer Other and 16% 3% Total net loans of $285.5 million Commercial Prime Meridian Bank’s strong relationship Construction 11% Loan Real Estate with the local business community is Composition 31% reflected in its concentration of as of 6/30/18 Commercial Loans at 16% of total loans. Residential Estate and Real Loans ($ in thousands) HELOC Real estate mortgage loans 39% Commercial Real Estate $ 89,482 Residential Real Estate and HELOC 113,715 Construction 32,266 $300,000 Total Real Estate Mortgage 235,463 Commercial 46,006 Consumer and Other 7,136 Total Loans 288,605 $250,000 2018 YTD Loan Deferred Loan Costs, Net 409 Portfolio Change Less: A LLL (3,541) ($ in thousands) Loans, Net $ 285,473 Source: internal company documents $200,000 2017Q4 Residential/ CRE Construction Commercial Consumer Deferred Costs 2018Q2 HELOC Less ALLL INVESTORS.PRIMEMERIDIANBANK.COM | OTCQX: PMHG 12
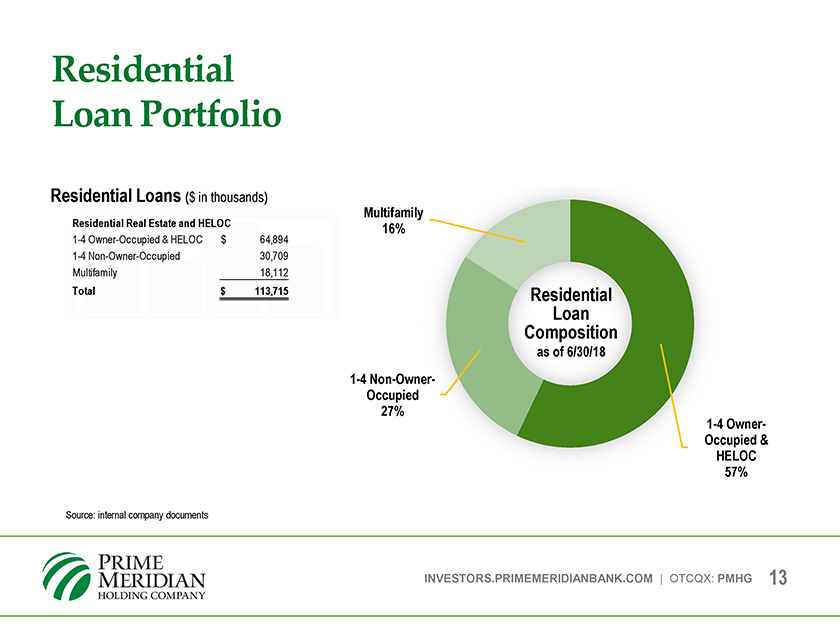
Residential Loan Portfolio Residential Loans ($ in thousands) Multifamily Residential Real Estate and HELOC 16% 1-4 OwnerOccupied & HELOC $ 64,894 1-4 Non-Owner-Occupied 30,709 Multifamily 18,112 Total $ 113,715 Residential Loan Composition as of 6/30/18 1-4Occupied Non-Owner-27% Occupied 1-4 Owner- & HELOC 57% Source: internal company documents INVESTORS.PRIMEMERIDIANBANK.COM | OTCQX: PMHG 13
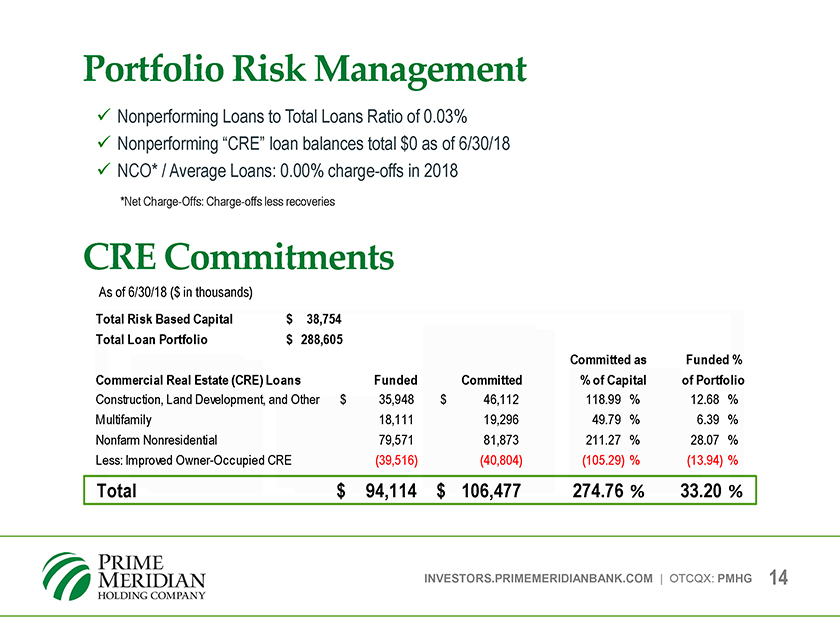
Portfolio Risk Management Nonperforming Loans to Total Loans Ratio of 0.03% Nonperforming CRE loan balances total $0 as of 6/30/18 NCO* / Average Loans: 0.00% charge-offs in 2018 *Net Charge-Offs: Charge-offs less recoveries CRE Commitments As of 6/30/18 ($ in thousands) Total Risk Based Capital $ 38,754 Total Loan Portfolio $ 288,605 Committed as Funded % Commercial Real Estate (CRE) Loans Funded Committed % of Capital of Portfolio Construction, Land Development, and Other $ 35,948 $ 46,112 118.99 % 12.68 % Multifamily 18,111 19,296 49.79 % 6.39 % Nonfarm Nonresidential 79,571 81,873 211.27 % 28.07 % Less: Improved Owner-Occupied CRE (39,516) (40,804) (105.29) % (13.94) % Total $ 94,114 $ 106,477 274.76 % 33.20 % INVESTORS.PRIMEMERIDIANBANK.COM | OTCQX: PMHG 14
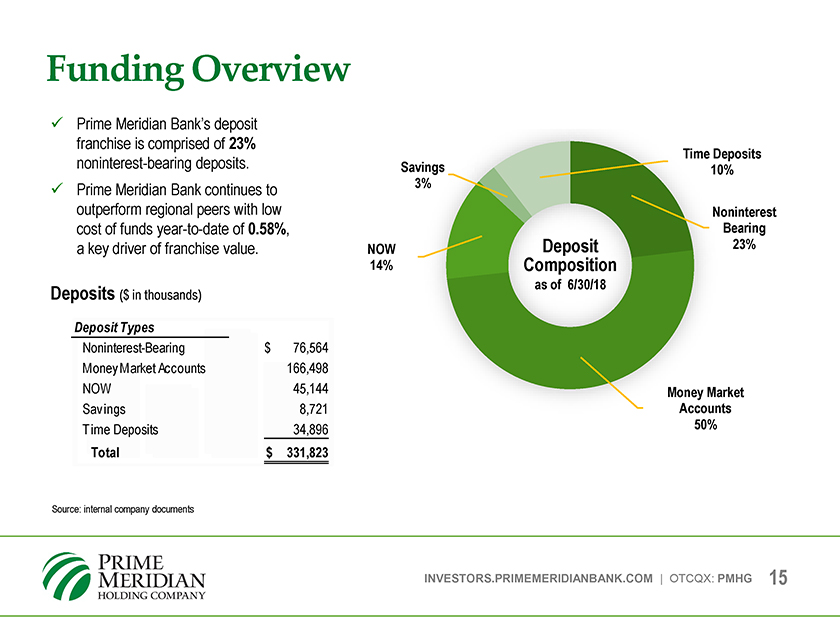
Funding Overview Prime Meridian Bank’s deposit franchise is comprised of 23% noninterest-bearing deposits. Time Deposits Savings 3% 10% Prime Meridian Bank continues to outperform regional peers with low Noninterest cost of funds year-to-date of 0.58%, Bearing 23% a key driver of franchise value. NOW Deposit 14% Composition as of 6/30/18 Deposits ($ in thousands) Deposit Types Noninterest-Bearing $ 76,564 Money Market Accounts 166,498 NOW 45,144 Money Market Sav ings 8,721 Accounts 50% Time Deposits 34,896 Total $ 331,823 Source: internal company documents INVESTORS.PRIMEMERIDIANBANK.COM | OTCQX: PMHG 15
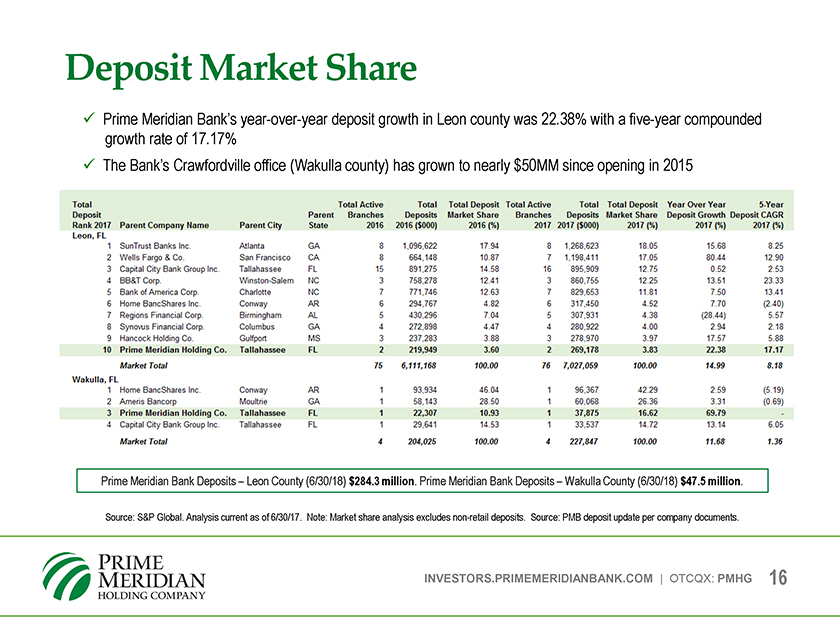
Deposit Market Share S Prime Meridian Bank’s year-over-year deposit growth in Leon county was 22.38% with a five-year compounded growth rate of 17.17% S The Bank’s Crawfordville office (Wakulla county) has grown to nearly $50MM since opening in 2015 Total Total Active Total Total Deposit Total Active Total Total Deposit Year Over Year 5-Year Deposit Parent Branches Deposits Market Share Branches Deposits Market Share Deposit Growth Deposit CAGR Rank 2017 Parent Company Name Parent City State 2016 2016 ($000) 2016(%) 2017 2017 ($000) 2017 (%) 2017 (%) 2017 (%) Leon, FL 1 SunTrust Banks Inc Atlanta GA 8 1,096,622 17.94 8 1,268,623 18 05 15.68 8.25 2 Wells Fargo & Co. San Francisco CA 8 664,148 10.87 1 1,198.411 17.05 80.44 12.90 3 Capital City Bank Group Inc. Tallahassee FL 15 891,275 14.58 16 895.909 12.75 0.52 2.53 4 BB&T Corp Winston-Salem NC 3 758,278 12.41 3 860,755 12.25 13.51 23.33 5 Bank of America Corp Charlotte NC 7 771,746 12.63 7 829,653 11.81 7.50 13.41 6 Home BancShares Inc. Conway AR S 294,767 4.82 6 317,450 4.52 7.70 (2.40) 7 Regions Financial Corp Birmingham AL 5 430,296 7.04 5 307.931 4.38 (28.44) 5.57 8 Synovus Financial Corp. Columbus GA 4 272,898 4.47 4 280,922 400 2.94 2.18 9 Hancock Holding Co Gulfport MS 3 237,283 3.88 3 278,970 3.97 17.57 5.88 10 Prime Meridian Holding Co. Tallahassee FL 2 219,949 3.60 2 269,178 3.83 22.38 17.17 Market Total 75 6,111,168 100.00 76 7,027,059 100.00 14.99 8.18 Wakulla, FL 1 Home BancShares Inc. Conway AR 1 93,934 46.04 1 96,367 42.29 2.59 (5.19) 2 Ameris Bancorp Moultrie GA 1 58,143 28.50 1 60.068 26.36 3.31 (0.69) 3 Prime Meridian Holding Co. Tallahassee FL 1 22,307 10.93 1 37,875 16.62 69.79 - 4 Capital City Bank Group Inc. Tallahassee FL 1 29,641 14.53 1 33,537 14.72 13.14 6 05 Market Total 4 204,025 100.00 4 227,847 100.00 11.68 J.36 Prime Meridian Bank Deposits -Leon County (6/30/18) $284.3 million. Prime Meridian Bank Deposits -Wakulla County (6/30/18) $47.5 million. Source: S&P Global. Analysis current as of 6/30/17. Note: Market share analysis excludes non-retail deposits. Source: PMB deposit update per company documents. INVESTORS.PRIMEMERIDIANBANK.COM | OTCQX: PMHG 16
Investment Considerations Strong Growth Potential Through 2023, Tallahassee MSA is projected to experience significant population and household income growth1 of 4.40% and 6.62%, respectively Attractive growth opportunities in North Florida, South Alabama and South Georgia markets Build-out of existing market franchise Strong infrastructure can support a much larger institution Scalable employee base helps facilitate increased market share 1 Source: Nielsen. Demographic data is provided by Nielsen based primarily on US Census data. For non-census year data, Nielsen uses samples and projections to estimate the demographic data. S&P Global Market Intelligence performs calculations on the underlying data provided by Nielsen for some of the data presented. INVESTORS.PRIMEMERIDIANBANK.COM | OTCQX: PMHG 17
Investment Considerations Economic Hub of Northern Florida Seven robust industry factors Education Aviation, aerospace, defense and national security and Health sports sciences, medicine medical education, training and research, Information technology Research and engineering Renewable energy and environment Transportation and logistics Strong Bank to local build lending market relationships share. and local decision-making allow Prime Meridian and Experienced a “deep bench” team of for 75 future employees* growth. continue to ensure a high level of client service *As of 6/30/2018 INVESTORS.PRIMEMERIDIANBANK.COM | OTCQX: PMHG 18
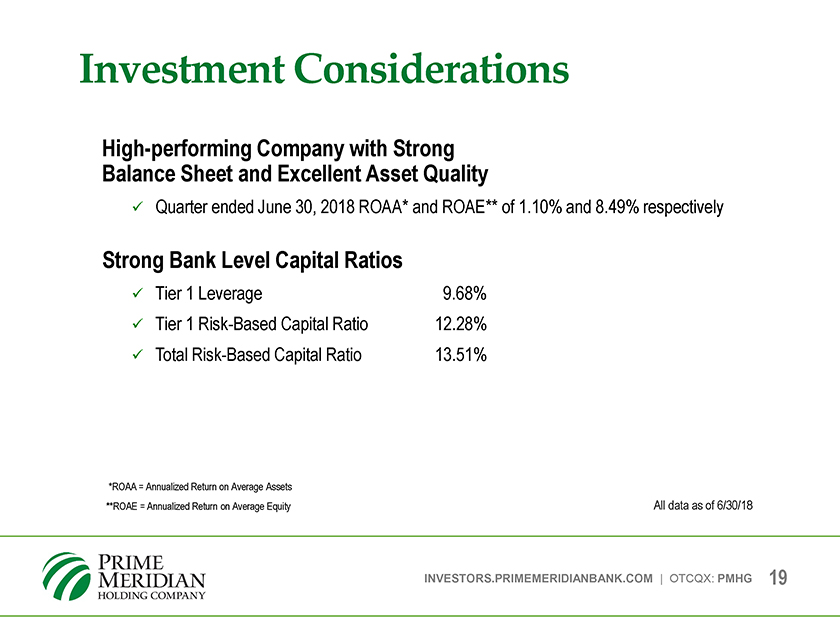
Investment Considerations High-performing Company with Strong Balance Sheet and Excellent Asset Quality Quarter ended June 30, 2018 ROAA* and ROAE** of 1.10% and 8.49% respectively Strong Bank Level Capital Ratios Tier 1 Leverage 9.68% Tier 1 Risk-Based Capital Ratio 12.28% Total Risk-Based Capital Ratio 13.51% *ROAA = Annualized Return on Average Assets **ROAE = Annualized Return on Average Equity All data as of 6/30/18 INVESTORS.PRIMEMERIDIANBANK.COM | OTCQX: PMHG 19
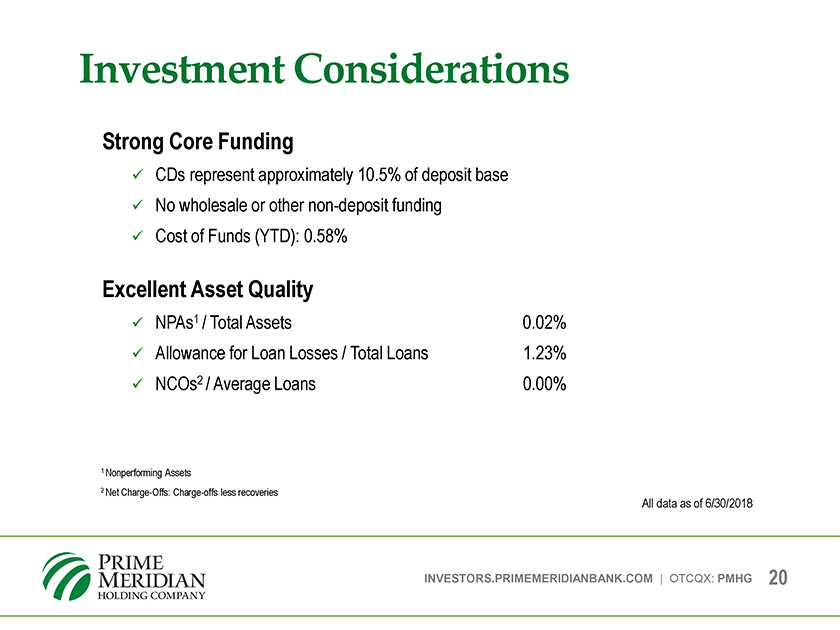
Investment Considerations Strong Core Funding CDs represent approximately 10.5% of deposit base No wholesale or other non-deposit funding Cost of Funds (YTD): 0.58% Excellent Asset Quality NPAs1 / Total Assets 0.02% Allowance for Loan Losses / Total Loans 1.23% NCOs2 / Average Loans 0.00% 1 Nonperforming Assets 2 Net Charge-Offs: Charge-offs less recoveries All data as of 6/30/2018 INVESTORS.PRIMEMERIDIANBANK.COM | OTCQX: PMHG 20

Company Culture Who We Are. What We Stand For. MISSION Building bankers to serve our clients and community in order to optimize shareholder value. PURPOSE Banking done right, right away. CORE • Passion – level of intense excellence and commitment beyond simply meeting PRINCIPLES requirements • Grace – high level of service with courtesy and compassion • Integrity – doing the right thing because it’s the right thing to do • Tenacity – culture of looking at new ideas, tackling challenges and overcoming obstacles • Accountability – personally accepting full and ultimate responsibility as well as holding one another accountable. INVESTORS.PRIMEMERIDIANBANK.COM | OTCQX: PMHG 21
Company Culture A Different Banking Model Prime Meridian Bank promotes and maintains a culture of openness and transparency to encourage exposure of team members to all aspects of banking. Team members, executive officers and board members interact to resolve issues without the typical top/down or bottom/up paths. INVESTORS.PRIMEMERIDIANBANK.COM | OTCQX: PMHG 22

Company Culture 5 Star Rating (33 nation’s consecutive leading quarters bank rating by Bauer and research Financial, firm) the Best Banks To Work For Since 2015 the top Ranked performing #19 on companies the OTCQX on Best the OTCQX 50: Best Market based average on daily 2017 dollar total volume return and growth in INVESTORS.PRIMEMERIDIANBANK.COM | OTCQX: PMHG 23

Appendix 24
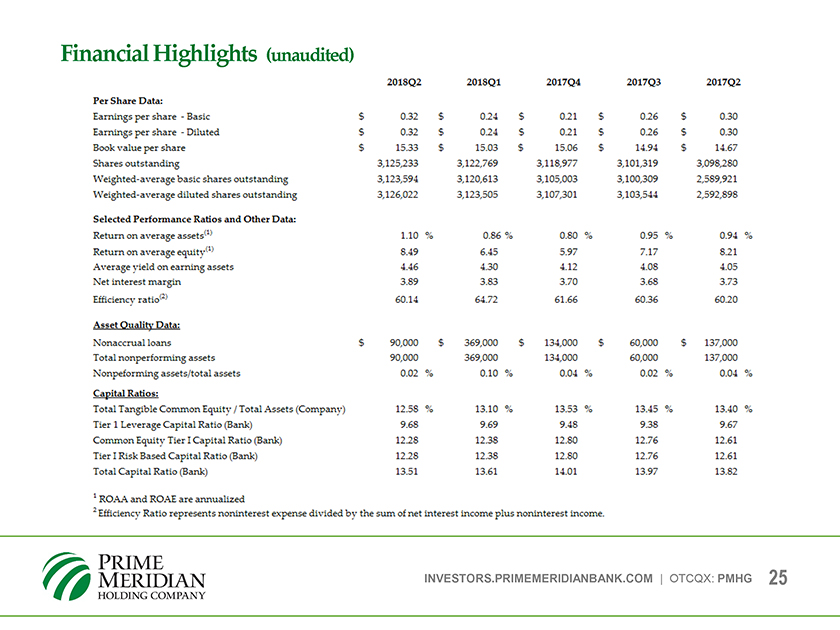
Financial Highlights (unaudited) 2018Q2 2D18Q1 2017Q4 2017Q3 2017Q2 Per Share Data: Earnings per share - Basic $ 0.32 % 024 $ 0.21 $ 026 $ 0.30 Earnings per share - Diluted $ 0.32 % 0.24 $ 0.21 $ 026 $ 030 Book value per share $ 15.33 % 15.03 $ 15.06 $ 14.94 $ 14.67 Shares outstanding 3,125,233 3,122,769 3,118,977 3,101,319 3,098,280 Weighted-average basic shares outstanding 3,123,594 3,120,613 3,105,003 3,100,309 2,589,921 Weighted-average diluted shares outstanding 3,126,022 3,123,505 3,107,301 3,103,544 2,592,898 Selected Performance Ratios and Other Data: Return on average assets11. 1.10 % 0.86 % 0.80 % 0.95 % 0.94 % Return on average equity1 8.49 6.45 5.97 7.17 8.21 Average yield on earning assets 4.46 4.30 4.12 4.08 4.05 Net interest margin 3.89 3.83 3.70 3.68 3.73 Efficiency ratio’* 60.14 64.72 61.66 60.36 6020 Asset Oualitv Data: Nonaccrual loans $ 90,000 $ 369,000 $ 134,000 $ 60,000 $ 137,000 Total nonperforming assets 90,000 369,000 134,000 60,000 137,000 Nonpeforming assets/total assets 0.02 % 0.10 % 0.04 % 0.02 % 0.04 % Capital Ratios: Total Tangible Common Equity / Total Assets (Company) 12.58 % 13.10 % 13.53 % 13.45 % 13.40 % Tier 1 Leverage Capital Ratio (Bank) 9.68 9.69 9.48 9.38 9.67 Common Equitv Tier I Capital Ratio (Bank) 1228 12.38 12.80 12.76 12.61 Tier I Risk Based Capital Ratio (Bank) 1228 12.38 12.80 12.76 12.61 Total Capital Ratio (Bank) 13.51 13.61 14.01 13.97 13.82 INVESTORS.PRIMEMERIDIANBANK.COM | OTCQX: PMHG 25
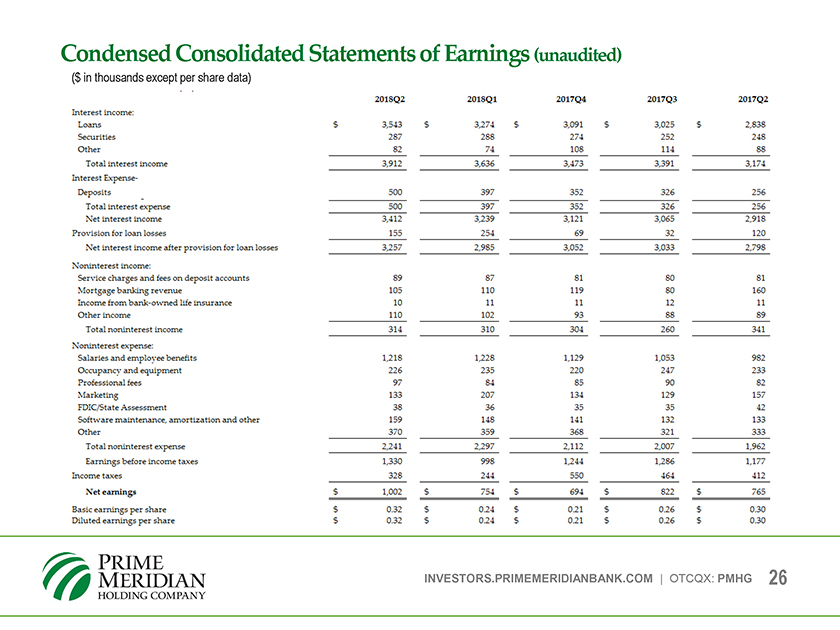
Condensed Consolidated Statements of Earnings (unaudited) ($ in thousands except per share data) 2018Q2 2018Q1 2017Q4 2017Q3 2017Q2 Interest income: Loans $ 3,543 $ 3,274 $ 3,091 $ 3,025 $ 2,838 Securities 287 288 274 252 248 Other 82 74 108 114 88 Total interest income 3,912 3,636 3,473 3,391 3,174 Interest Expense- Deposits 500 397 352 326 256 Total interest expense 500 397 352 326 256 Net interest income 3,412 3,239 3,121 3,065 2,918 Provision for loan losses 155 254 69 32 120 Net interest income after provision for loan losses 3,257 2,985 3,052 3,033 2,798 Noninterest income: Service charges and fees on deposit accounts 89 87 81 80 81 Mortgage banking revenue 105 110 119 80 160 Income from bank owned life insurance 10 11 11 12 11 Other income 110 102 93 88 89 Total noninterest income 314 310 304 260 341 Noninterest expense: Salaries and employee benefits 1,218 1,228 1,129 1,053 982 Occupancy and equipment 226 235 220 247 233 Professional fees 97 84 85 90 82 Marketing 133 207 134 129 157 FDIC/State Assessment 38 36 35 35 42 Software maintenance, amortization and other 159 148 141 132 133 Other 370 359 368 321 333 Total noninterest expense 2,241 2,297 2,112 2,007 1,962 tamings before income taxes 1,330 998 1,244 1,286 1,177 Income taxes 328 244 550 464 412 Net earnings $ 1,002 $ 754 $ 694 $ 822 $ 765 Basic earnings per share $ 0.32 $ 024 $ 0.21 $ 026 $ 0.30 Diluted earnings per share $ 0.32 $ 024 $ 0.21 $ 026 $ 030 INVESTORS.PRIMEMERIDIANBANK.COM | OTCQX: PMHG 26
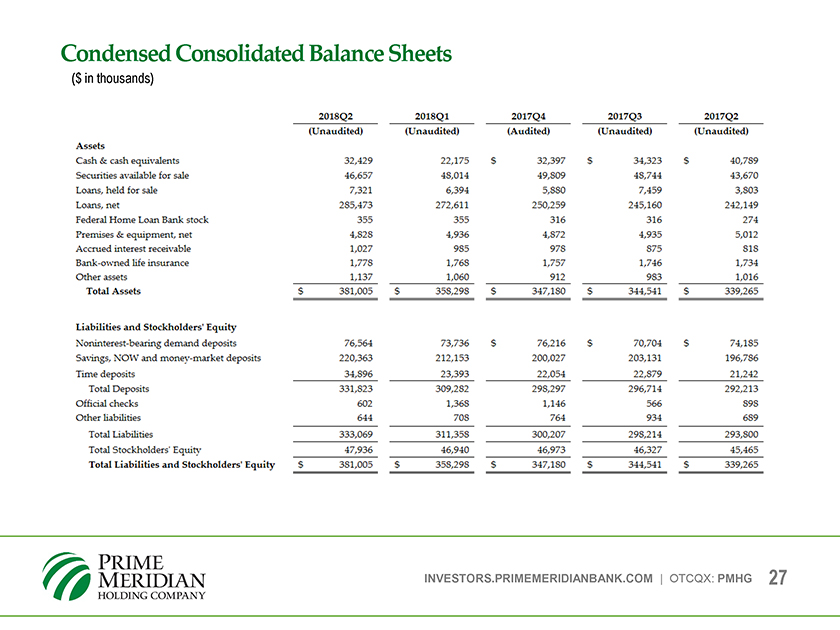
Condensed Consolidated Balance Sheets ($ in thousands) 2018Q2 2018Q1 2017Q4 2017Q3 2017Q2 (Unaudited) (Unaudited) (Audited) (Unaudited) (Unaudited) Assets Cash & cash equivalents 32,429 22,175 S 32,397 $ 34,323 S 40,789 Securities available for sale 46,657 48,014 49,809 48,744 43,670 Loans, held for sale 7,321 6,394 5,880 7,459 3,803 Loans, net 285,473 272,611 250,259 245,160 242,149 Federal Home Loan Bank stock 355 355 316 316 274 Premises & equipment, net 4,828 4,936 4,872 4,935 5,012 Accrued interest receivable 1,027 985 978 875 818 Bank-owned life insurance 1,778 1,768 1,757 1,746 1,734 Other assets 1,137 1,060 912 983 1,016 Total Assets S 381,005 $ 358,298 $ 347,180 S 344,541 S 339,265 Liabilities and Stockholders’ Equity Noninterest-bearing demand deposits 76,564 73,736 S 76,216 $ 70,704 S 74,185 Savings, NOW and money-market deposits 220,363 212,153 200,027 203,131 196,786 Time deposits 34,896 23,393 22,054 22,879 21,242 Total Deposits 331,823 309,282 298,297 296,714 292,213 Official checks 602 1,368 1,146 566 898 Other liabilities 644 70S 764 934 689 Total Liabilities 333,069 311,358 300,207 298,214 293,800 Total Stockholders’ Equity 47,936 46,940 46,973 46,327 45,465 Total Liabilities and Stockholders’ Equity $ 381,005 $ 358,298 5 347,180 $ 344,541 S 339,265 2 Efficiency Ratio represents noninterest expense divided by the sum of net interest income plus noninterest income. INVESTORS.PRIMEMERIDIANBANK.COM | OTCQX: PMHG 27