Attached files
| file | filename |
|---|---|
| 8-K - 8-K - CMS ENERGY CORP | a18-17762_28k.htm |
CMS limE NYSE. Second Quarter 2018 Results & Outlook July 26, 2018 FOCUSED ON WORLD CLASS PERFORMANCE

CMS ENERGY This presentation is made as of the date hereof and contains "forward-looking statements" as defined in Rule 3b-6 of the Securities Exchange Act of 1934, Rule 175 of the Securities Act of 1933, and relevant legal decisions. The forward-looking statements are subject to risks and uncertainties. All forward-looking statements should be considered in the context of the risk and other factors detailed from time to time in CMS Energy's and Consumers Energy's Securities and Exchange Commission filings. Forward-looking statements should be read in conjunction with "FORWARD-LOOKING STATEMENTS AND INFORMATION" and "RISK FACTORS" sections of CMS Energy's and Consumers Energy's most recent Form 10-K and as updated in reports CMS Energy and Consumers Energy file with the Securities and Exchange Commission. CMS Energy's and Consumers Energy's "FORWARD-LOOKING STATEMENTS AND INFORMATION" and "RISK FACTORS" sections are incorporated herein by reference and discuss important factors that could cause CMS Energy's and Consumers Energy's results to differ materially from those anticipated in such statements. CMS Energy and Consumers Energy undertake no obligation to update any of the information presented herein to reflect facts, events or circumstances after the date hereof. The presentation also includes non-GAAP measures when describing CMS Energy's results of operations and financial performance. A reconciliation of each of these measures to the most directly comparable GAAP measure is included in the appendix and posted on our website at www.cmsenergy.com. CMS Energy provides historical financial results on both a reported (GAAP) and adjusted (non-GAAP) basis and provides forward-looking guidance on an adjusted basis. During an oral presentation, references to "earnings" are on an adjusted basis. Adjustments could include items such as discontinued operations, asset sales, impairments, restructuring costs, regulatory items from prior years, or other items. Management views adjusted earnings as a key measure of the company's present operating financial performance and uses adjusted earnings for external communications with analysts and investors. Internally, the company uses adjusted earnings to measure and assess performance. Because the company is not able to estimate the impact of specific line items, which have the potential to significantly impact, favorably or unfavorably, the company's reported earnings in future periods, the company is not providing reported earnings guidance nor is it providing a reconciliation for the comparable future period earnings. Adjusted weather normalized measures are provided to show the impact of deviations from normal weather. The adjusted earnings should be considered supplemental information to assist in understanding our business results, rather than as a substitute for the reported earnings. Similarly, management views the ratio of Funds From Operations (FFO)/Average Debt as a key measure of the company's operating financial performance and its financial position, and uses the ratio for external communications with analysts and investors. Because the company does not establish its target FFO/Average Debt ratio based on a specific target numerator and target denominator, the company is unable to provide a reconciliation to a comparable GAAP financial measure for future periods. Investors and others should note that CMS Energy routinely posts important information on its website and considers the Investor Relations section, www.cmsenergy.com/investor-relations, a channel of distribution. 2
CMS ENERGY Agenda 3 Financial Results & Outlook Rejji Hayes Executive VP & CFO Business UpdatePatti Poppe President & CEO
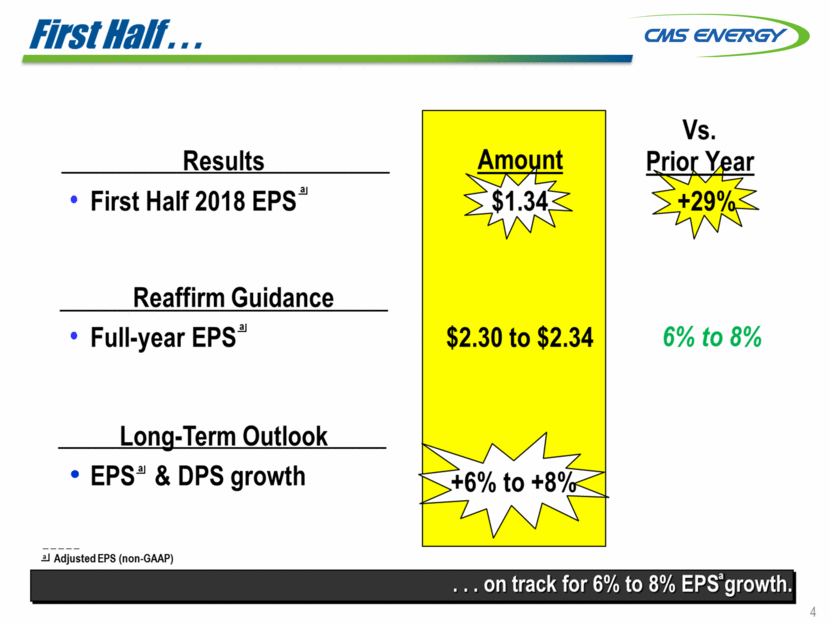
CMS ENERGY First Half... Results First Half 2018 EPS Reaffirm Guidance to 8% Full-year EPS.ru 6% Long-Term Outlook EPS.ru & DPS growth .!.! Adjusted EPS (non-GAAP) agrowth. 4 ... on track for 6°/o to 8°/o EPS $2.30 to $2.34
CMS ENERGY The Triple Bottom line... 5 world class performance delivering hometown service. PEOPLE PLANET PROFIT PERFORMANCE

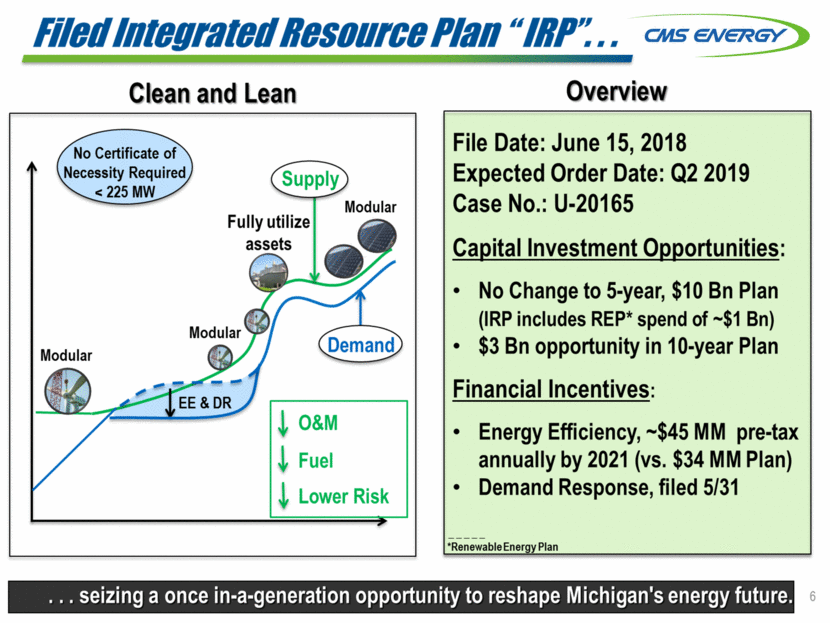
CMS ENERGY Filed Integrated Resource Plan “IRP”..: Overview Clean and Lean future. 6 ... seizing a once in-a-generation opportunity to reshape Michigan's energy File Date: June 15, 2018 Expected Order Date: Q2 2019 Case No.: U-20165 Capital Investment Opportunities:No Change to 5-year, $10 Bn Plan (IRP includes REP* spend of ....$1 Bn)$3 Bn opportunity in 10-year Plan Financial Incentives:Energy Efficiency, -$45 MM pre-tax annually by 2021 (vs. $34 MM Plan)Demand Response, filed 5/31 RenewableEnergy Plan Modular Fully utilize assets O&M Fuel Lower Risk
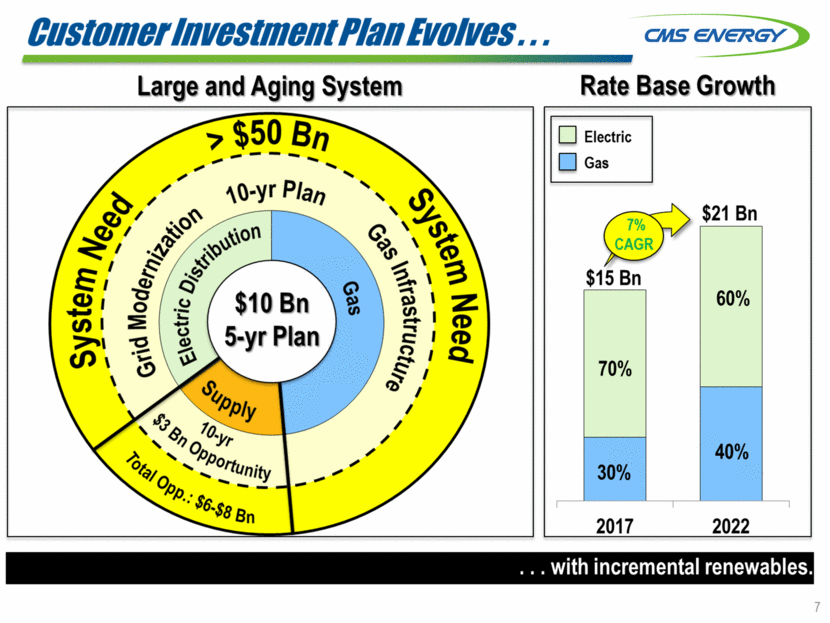
CMS ENERGY Rate Base Growth Customer Investment Plan Evolves.. Large and Aging System ? $50 Bn $10 Bn 5-yr Plan ... with incremental renewables. 7 $21 Bn 20172022 $15 Bn 30o/o D Electric D Gas
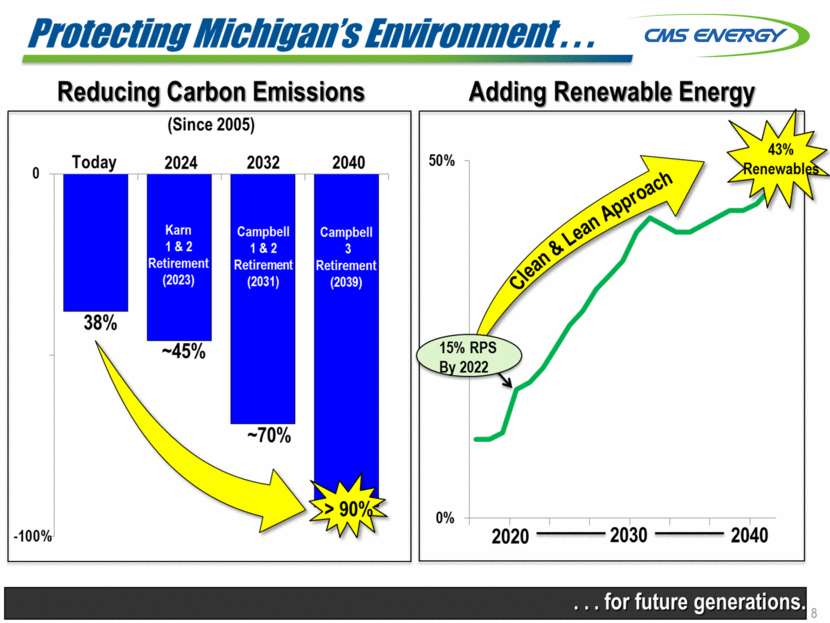
CMS NERGEY Protecting Michigan's Environment... Adding Renewable Energy Reducing Carbon Emissions 8 ... for future generations. (Sinee 2005) 0Today2024 20322040 -100
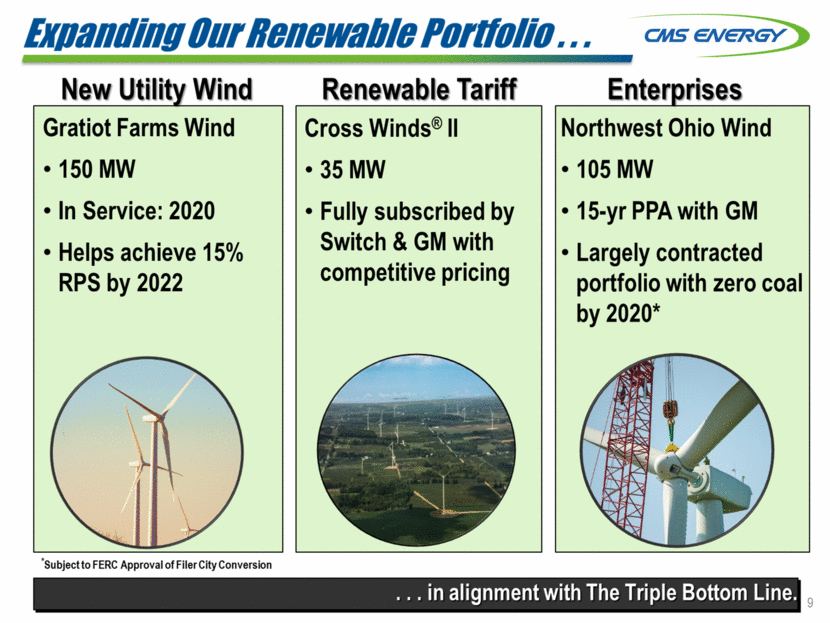
CMS ENERGY Expanding Our Renewable Portfolio New Utility Wind Renewable Tariff Enter rises Cross Winds® II35MWFully subscribed by Switch & GM with competitive pricing Gratiot Farms Wind150 MWIn Service: 2020Helps achieve 15o/o Northwest Ohio Wind105 MW15-yr PPA with GMLargely contracted portfolio with zero coal by 2020* RPS by 2022 *subject to FERC Approvalof Filer City Conversion Line. 9 ... in alignment with The Triple Bottom
CMS ENERGY UtilitY Driven,lowRiskGrowth CMS Energy Long-Term Growth Plan Segments: - Utility Needed system upgrades I robust backlog Affordable prices driven by cost controls Largely contracted & utility-like Contracted generation & renewables 0-1 - Enterprises Refinancing high coupon debt Tax planning Supportive EnerBank contribution & tax shield - Parent & Other 1 - {1) CJ-ai) IT=otal EPS G= r=o wth.!l I aJAdjusted EPS (non-GAAP) . . delivers consistent, industry-leading financial performance .10
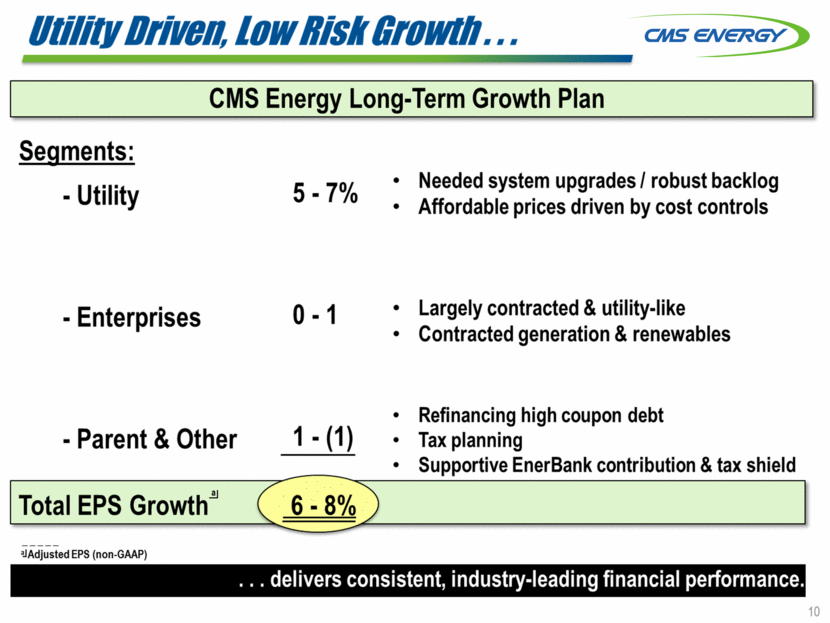
CMS ENERGY First HalF 2018 EPS Results By Business Segment I year. 11 ... tracking well for the I Year-to-Date I2017E2018 IEPS-(GAAP)$1.04$1.351 Adjustment Adjusted (non-GAAP)!J 33¢49¢ ill 33¢ ISecond Quarter I EPS-{GAAP) Adjustment Adjusted (non-GAAP)!J Weather-normalized!J EPSa Utility$1.39 Enterprises0.10 Parent & Other (0.15) CMS EnergyEW
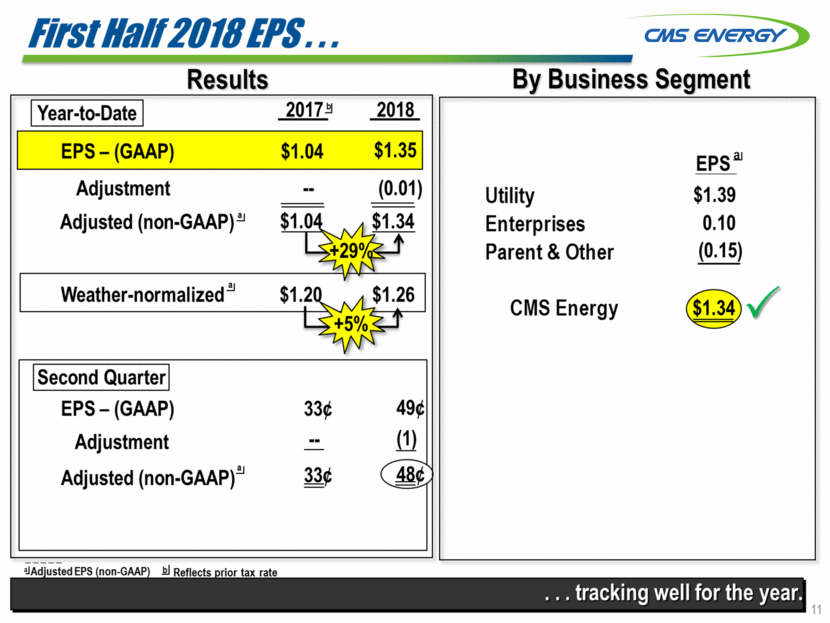
CMS ENERGY 2018 EPSa... First Half Six Months To Go 9t 1 r - _(1?l_ _(1 l-----4¢ - 100¢ Il I _ 28 - : 2¢ : {12)¢ {4)¢ Rates & Investment Cost Savings Usage, Enterprises & Other Absence of 2017 Weather Rates & Investment Cost Savings/ 2017 Weather 2018 : (Reinvestments): & Other AedEPS{nonI AAPf _ guidance. 12 ... in line with First Half $1.34 First Half $1.04
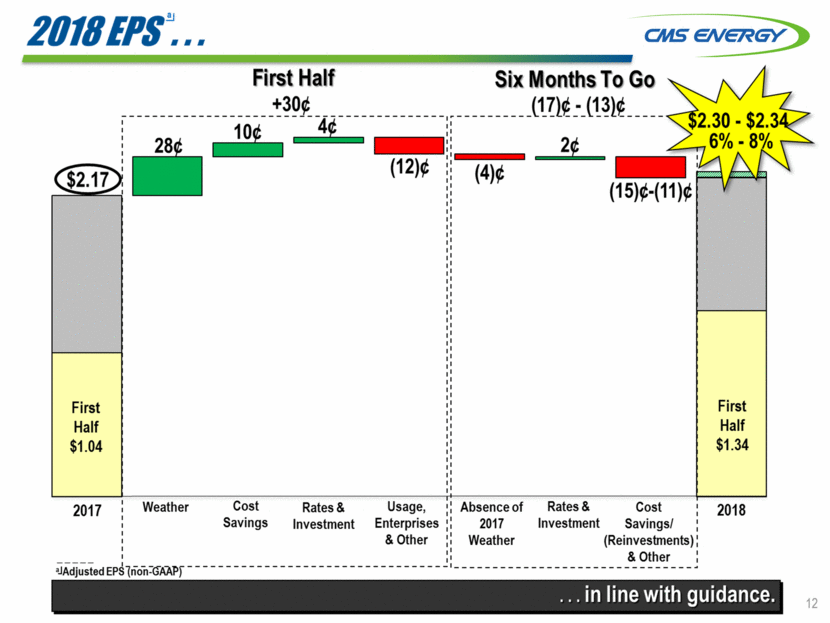
CMS ENERGY Managing Work Every Year.. 2010 2011 2012 2013 2014 2015 2016 2017 EPS.!J $2.20 Mild 2.00 Cost productivity above plan Cost 1.80 productivity above plan productivity Storms 1.60 RECORD WARM productivity above plan Hot Summer 1.40 Summer 1.20 0 investors. 13 ... maximizes benefits for customers AND
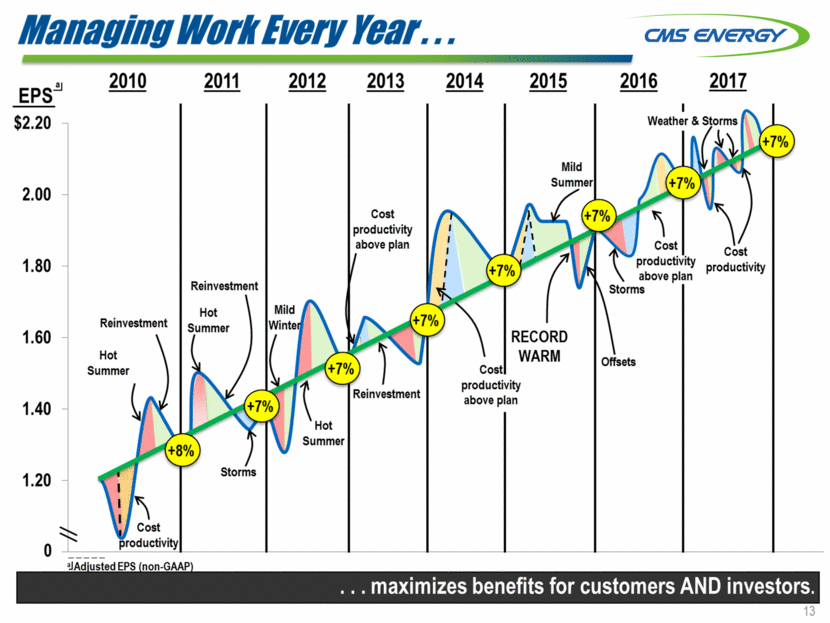
CMS ENERGY Simple, Perhaps Unigue Model... Plan I EPS Growtha 6%-a% 1 Self Funding:Cost reductions •Sales (continued economic development & EE) Other (Enterprises, tax planning, etc.) 2-3 pts 1 2 5-6 pts INVESTMENT SELF-FUNDED Adjusted EPS (non-GAAP) ... enhanced with tax reform. 14 Customer Prices "at or below inflation"
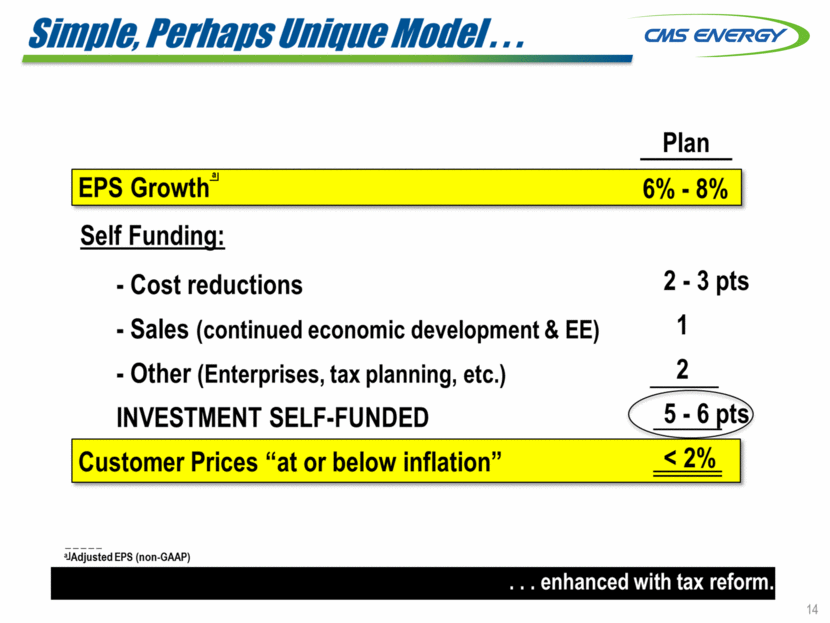
CMS ENERGY Our Entire Cost Structure Residential Electric Bills .!J Cost Components Residential Gas Bills_!j Taxes .!J Source: bls.gov for historicaldata,Bloombergfor 2018 estimate fatigue. 15 ... provides opportunities to lower costs and avoid rate Capital Investments Cost of Capital (current dollars) 85 20132018E $62 20132018E
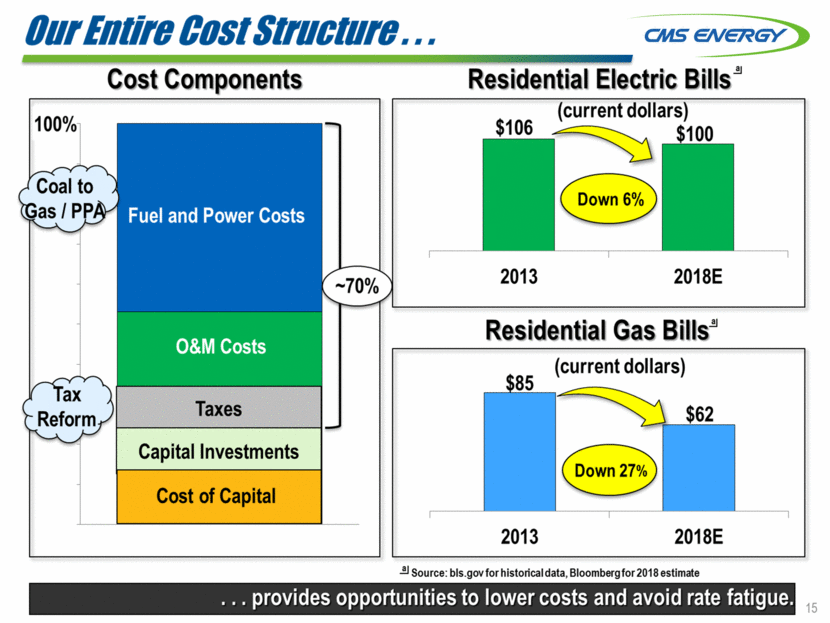
Economic Development Efforts... CMS ENERGY Examples of New Business Our Service Territory Outperforms ... are robust and helps drive our CJ Electric ContinentalDairy Building permits GOP Growth 2010--+2016 Population Growth 2010 2017 Unemployment (May 2018) aJ GrandRapids bJ Annualizednumbers May20107May2 MichiganU.S. 1914 1 5 4.6 3. 018 Grand Rapids +236°/o 29 7 3.0 16
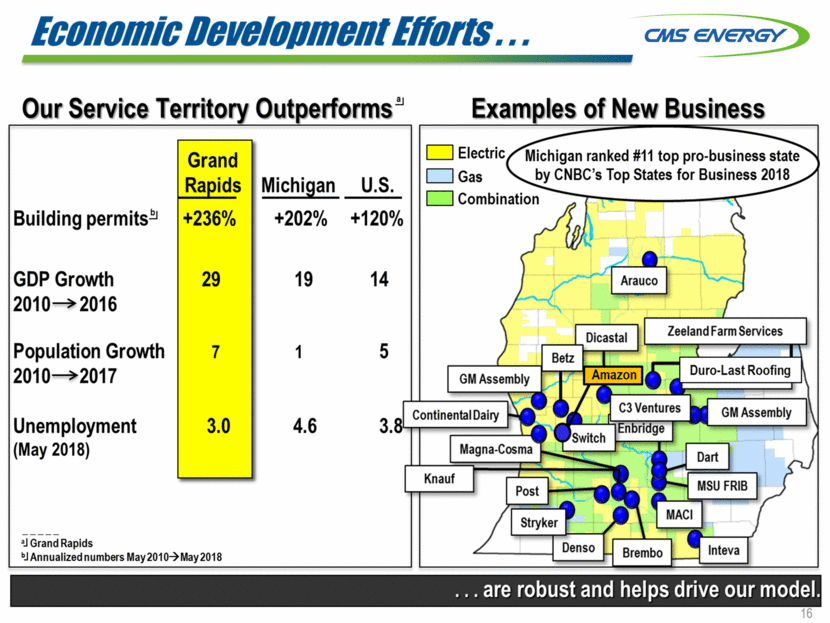
Operating Cash Flow Generation... CMS ENERGY Amount (Bn) $2.2 Cash flow before dividend 2017 2018 2019 2020 2021 2022 I NOLs & credits $0.6 $0.4 $0.3 $0.3 $0.3 $0.2 1 17 ... remains strong and supports our capital plan. Investment
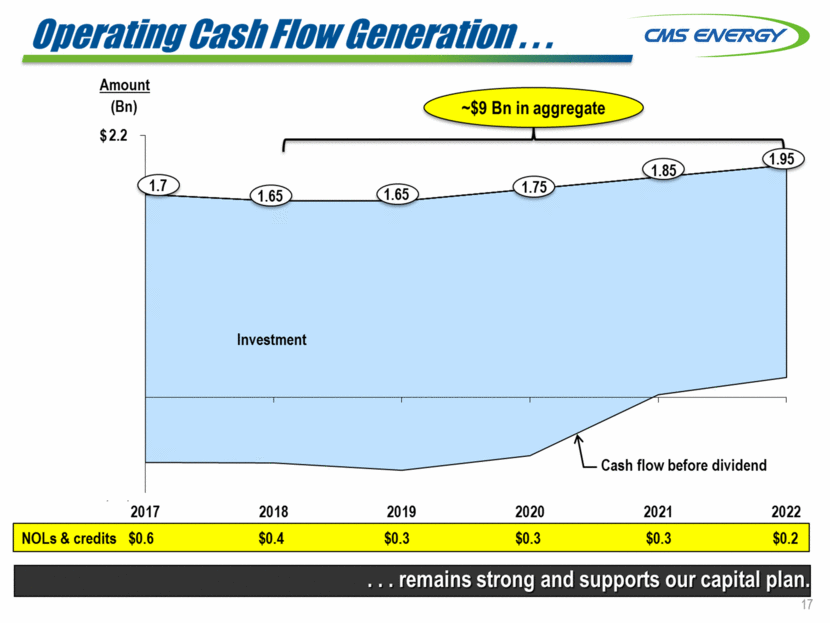
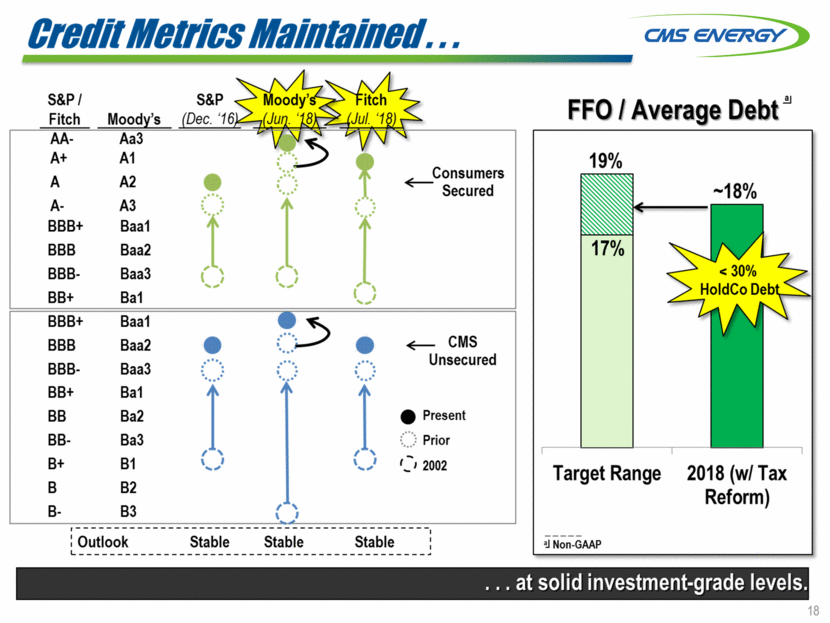
Credit Metrics Maintained ... CMS ENERGY S&P/ Fitch FFO I Average Debt.!J Moody's Consumers Secured ...••.. .. .. •r \ ,... (I 888+ 888 8aa1 8aa2 CMS Unsecured '.•••.. '.•••.. ...... 1 .. .. e Present (:} 2002 88 8a2 \ I ,1 : Outlook Stable Stable Stable : L levels. 18 ... at solid investment-grade -18o/o Target Range2018 (w/ Tax Reform) Non-GAAP AA-Aa3 A+A1 AA2 A-A3 888+ 8aa1 888 8aa2 888-8aa3 88+ 8a1( ...IJ 888-8aa3. ..... 88+ 8a1 88-8a3(.) Prior 8+ 81 \ ...I 8 82 8-83
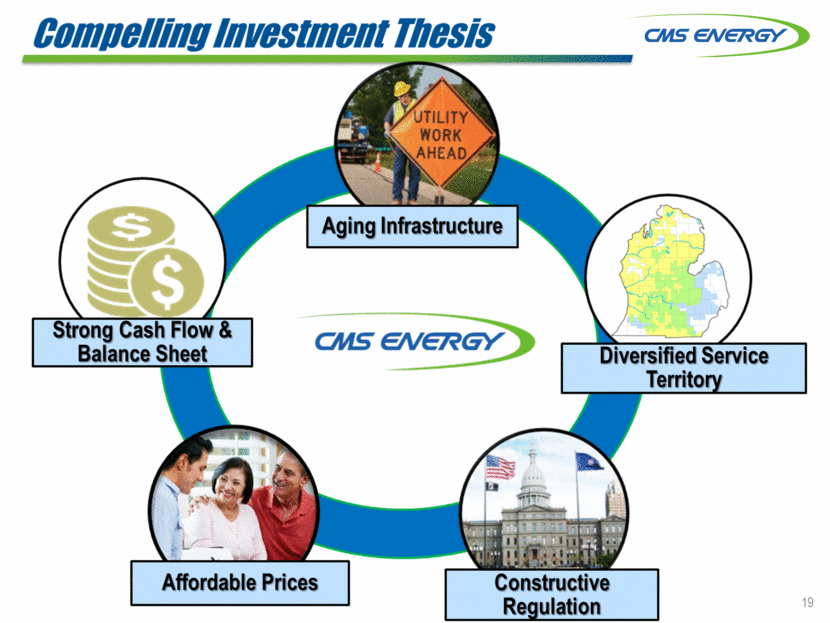
Compelling Investment Thesis CMS ENERGY Aging Infrastructure CMS ENERGY 19 Constructive ulation Affordable Prices
Appendix

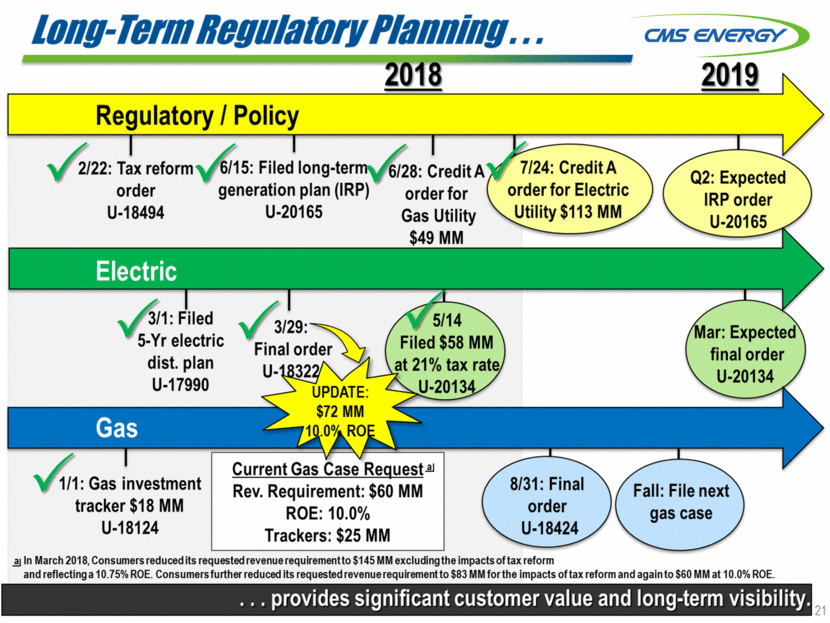
long-Term Regulatory Planning... CMS ENERGY 2018 2019 6/15: Filed long-ter generation plan (IRP) U-20165 Q2: Expected IRP order U-20165 order U-18494 order for Gas Utility $49 MM 5-Yr electric dist. plan U-17990 1/1: Gas investment tracker $18 MM U-18124 _ru In March 2018,Consumers reducedits requested revenuerequirementto $145 MM excludingthe impacts of tax reform and reflecting a 10.75% ROE.Consumersfurther reduced its requested revenuerequirement to $83 MM for the impacts oftax reform and againto $60 MM at10.0% ROE. 21 . . . provides significant customer value and long-term visibility. Current Gas Case Request.£ Rev. Requirement: $60 MM ROE: 10.0% Trackers: $25 MM Regulatory I Policy
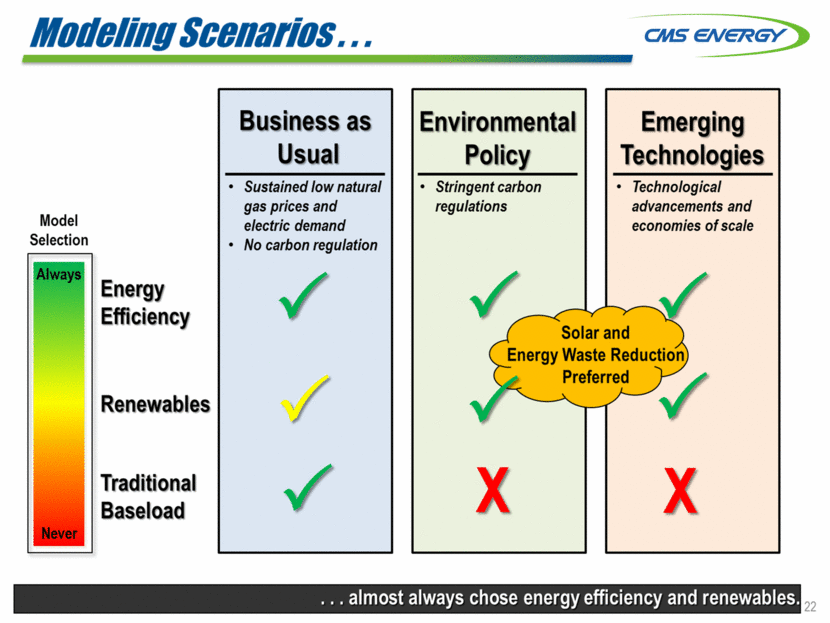
Modeling Scenarios... CMS ENERGY-Model Selection Energy Efficiency Renewables Traditional Baseload 22 ... almost always chose energy efficiency and renewables. Emerging TechnologiesTechnological advancements and economies of scale Environmental PolicyStringent carbon regulations Business as UsualSustained low natural gas prices and electric demandNo carbon regulation /
Tax Reform - Three Step Approach... CMS ENERGY Step 3: (Calculation C)To be filed to determine deferred federal income taxes treatment by Oct. 1st <1111: Credit A implemented for Gas Utility $49 MM Credit to Customers v-"7/24: Credit A approved for Electric Utility $113 MM Credit to Customers 10/1: File catch-up Credit B for Electric Utility v-"3/30: Filed forward-looking Credit A for Gas Utility File Calc. C 12/1: Credit B implemented for Gas Utility forward-looking Credit A for Electric Utility catch-up Credit B for Gas Utility 23 ... for returning benefits to customers. Step 2: (Credit B)To be filed to determine catch-up customer creditGas Utility by Sep.1st: period of Jan.-Jun. (to be implemented Dec. 2018)Electric Utility by Oct. 1st: period of Jan.-Jul. (to be implemented Jan. 2019) Step 1: (Credit A)Filed to determine forward-looking customer credit to adjust for tax reformGas Utility filed Mar. 30thElectric Utility filed Apr. 30thMPSC approval within 90 days of all filings
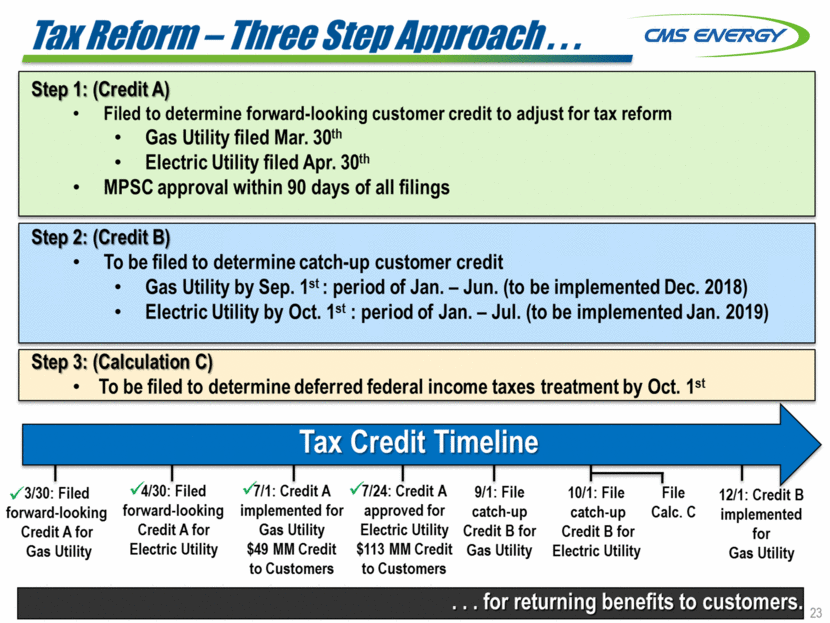
“DIF” [750MW] & Peakers [200 MW]... CMS ENERGY Opportunities Pre-Tax Income (MM) $80 $75 $45 Better 40 $30 $12 0 2018 Future 2015 2016 2017 : I 0% 25% 0% 0% 0% I I Energy - - - - - - - Plan. 24 Capacity II Available Capa ($/kW-mth)= $1.00= $2.00= $3.00< $3.00$4.50$7.50 city000<5I50%90% ""'-.= I L" "'-•""" ... offers risk mitigation to Outage Pull-ahead
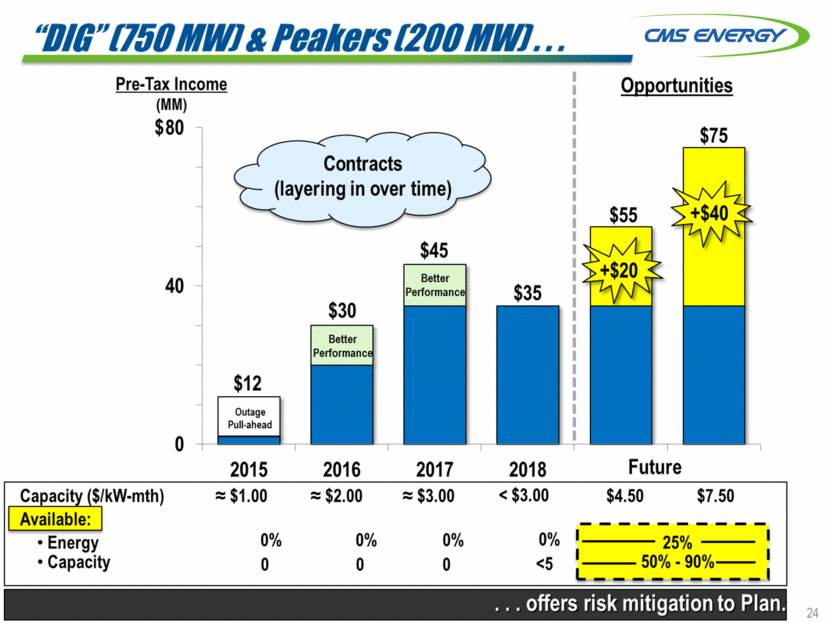
2018 Financial Targets... CMS ENERGY 2018 Long-Term Plan Adjusted EPS (non-GAAP) Operating cash flow (MM) Dividend payout ratio (non-GAAP) Customer price Electric Gas FFO/average debt (non-GAAP) Customer investment (Bn) Continuous equity (MM) .!.! Beginning in 2020 25 ...16th year of transparent, consistent, strong performance. Up $100/yr !J > $2.0/yr lncr.-$30 MM/yr 2018 $2.30 to $2.34 +6°/o to +8°/o $1,650 $1.9 No change
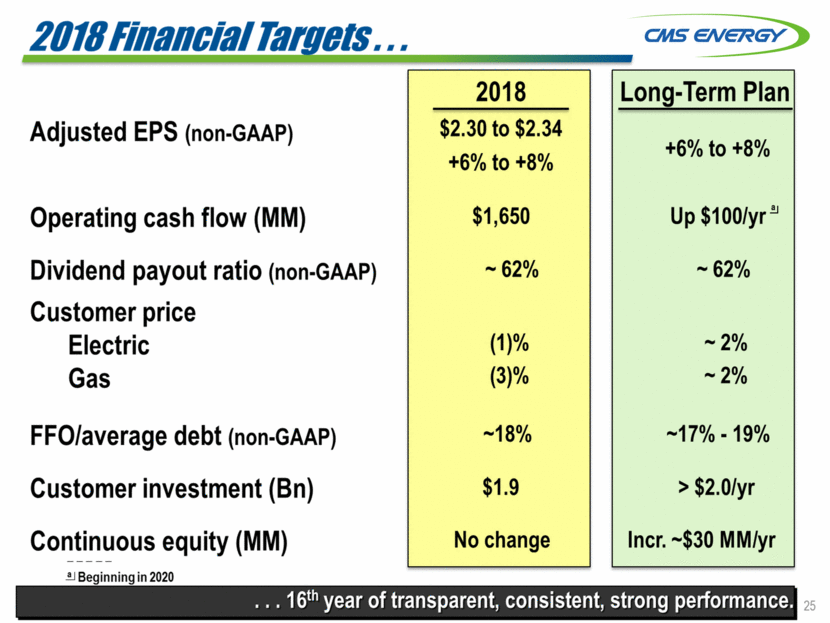
2018 Sensitivities... CMS ENERGY Full Year Impact Sensitivit EPS OCF (MM) SalesElectric (37,477 GWh)Gas (303 Bcf) Gas prices (NYMEX) -+ -+ + -+ -+ -+ 6¢ 9 0 + $20 1°/o 5 50¢ -+ -+ 40 55 Utility ROE (planned) 'fle-{.!4..9f1 o IGas (10.1o/o) Interest rates + 10 -+ % <1 +100 bps .!J Reflect 2018 sales forecast;weather-normalized mitigation. 26 ... reflect strong risk
Q & A Thank You! 27

GAAP Reconciliation

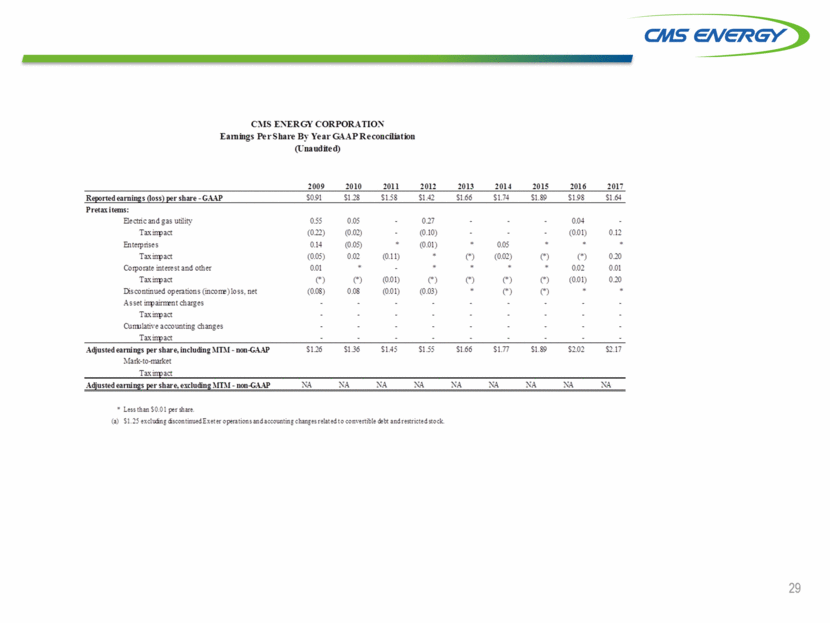
cms energy corporation earnings per share by year gaap reconciliation (unaudited) reported earnings (loss)per share-gaap pretax items electric and gas utility tax impact enterprises tax impact corporate interest and other tax impact discontinued operations (income) loss, net asset impairment charges tax impact cumulative a accounting changes tax impact adjusted earnigs per share, including mtm-non-gaap mark to market tax impact adjusted earnings per share, excluding mtm-non-gaap * lessthan $0.01 per share (a) $1.25 excluding discountinued exeter operations and accounting changes related to convertible dept and restricted stock 2009 $0.91 0.55 (0.22) 0.14 (0.05) 0.01 (*) (0.08) - - - - $1.26 na 2010 $1.28 0.05 (0.02) (0.05) 0.02 * (*) 0.08 - - - - $1.36 na 2011 $1.58 - - * (0.11) - (0.01) (0.01) - - - - $1..45 na 2012 $1.42 0.27 (0.10) (0.01) * * (*) (0.03) - - - - $1.55 na 2013 $1.66 - * (*) * (*) * - - - - $1.66 na 2014 $1.74 - - 0.05 (0.02) * (*) (*) - - - - $1.77 na 2015 $1.89 - - * (*) * (*) (*) (*) - - - - $1.77 na 2016 $1.98 0.04 (0.01) * (*) 0.02 (0.01) * - - - - $2.02 2017 $1.64 - 0.12 * 0.20 0.01 0.20 * - - - - $2.17 na
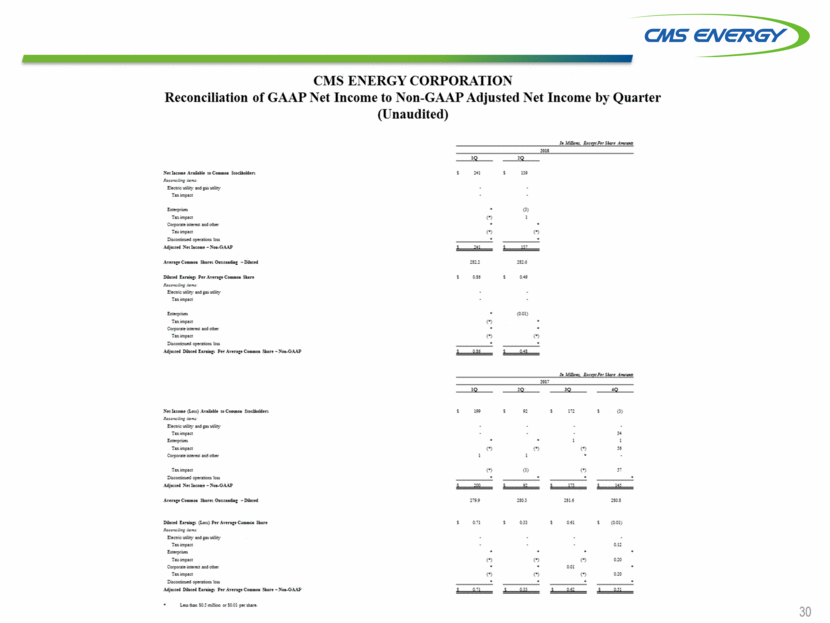
cms energy corporation reconciliation of gaap net income to non gaap adjusted net income ny quarter (naudited) net income available to common stockholders reconciling items: electric utility and gas utility tax impact enterprises tax impact corporate interest and other tax impact discontinued operations and loss adjusted net income non-gaap average common shares outstanding diluted diluted earnings per average common share reconciling items: electric utility and gas utility tax impact enterprises tax impact corporate interest and other tax impact discontinued operation loss adjusted diluted earning per average common share non-gaap net income (loss) available to common stockholders reconciling items: electric utility and gas utility tax impact enterprises tax impact corporate interest and other tax impact discontinued operation loss adjusted diluted earning per average common share non-gaap average common shares outstanding diluted diluted earnings (loss)per average common share reconciling items: electric utility and gas utility tax impact enterprises tax impact corporate interest and other tax impact discontinued operation loss adjusted diluted earnings per average common share-non-gaap * less than $0.5 million or $0.01 pe share in millions except per share amounts 2018 1Q 2Q $241 $139 - - - - * (3) (*) 1 * * (*) (*) * * $241 $137 282.2 282.6 $0.86 $0.49 - - - - * (0.01)(*) * * * (*) (*) * * $0.86 $0.48 in millions except per share amounts 2017 1Q 2Q 3Q 4Q $199 $92 $172 $(3) - - - - - - - 34 * * 1 1 (*) (*) (*) 56 1 1 * - * (1) (*) 57 * * * * $200 $93 $173 $145 279.9 280.3 281.6 280.8 $0.71 $0.33 $0.61 $(0.01) - - - - - - - 0.12 * * * * (*) (*) (*) 0.20 * * 0.01 *(*) (*) (*) 0.20 * * * * $0.71 $0.33 $0.62 $0.51
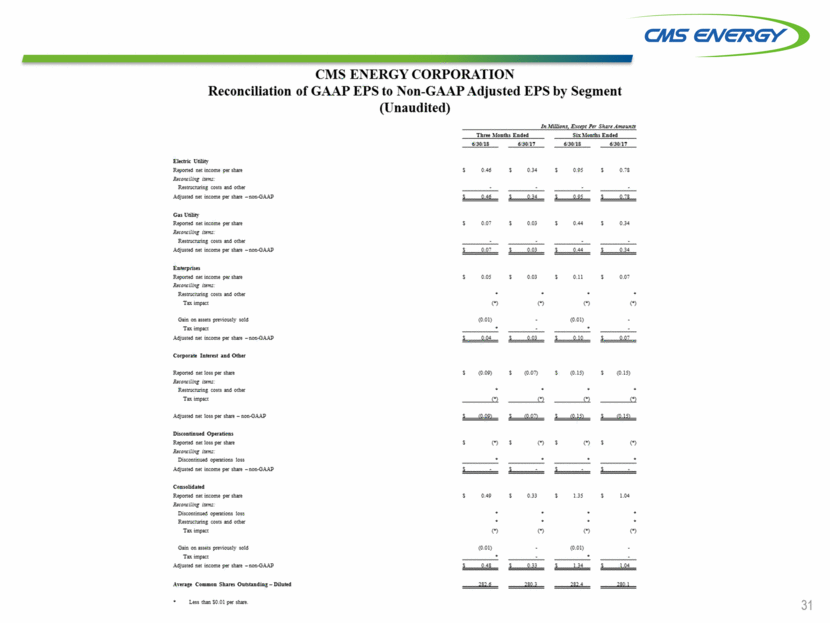
cms energy corporation reconciliation of gaap eps to non gaap adjusted eps by segment (unaudited) electric utility reported net income per share reconciling items: restructuring costs and other adjusted net income per share-non-gaap gas utility reported net income per share reconciling items: restructuring costs and other adjusted net income per share-non-gaap enterprises reported net income per share reconciling items: restructuring costs and other tax impact gain on assets previously sold tax impact adjusted net income per share-non-gaap corporate interest and other reported net loss per share reconciling items: restructuring costs and other tax impact adjusted net loss per share-non-gaap discontinued operations reported net loss per share reconciling items: discontinued operations loss adjusted net income per share-non-gaap consolidated reported net income per share reconciling items: discontinued operations loss restructuring costs and other tax impact gain on assets previously sold tax impact adjusted net income per share-non-gaap average common shares outstanding-diluted * less than $0.01 per share in million except per share amounts three months ended sis months ended 06/30/18 06/30/2017 06/30/18 06/30/2017 $0.46 $0.34 $0.95 $0.78 - - - - $0.46 $0.34 $0.95 $0.78 $0.07 $0.03 $0.44 $0.34 - - - - $0.07 $0.03 $0.44 $0.34 $0.05 $0.03 $0.11 $0.07 * * * * (*) (*) (*) (*) (0.01) - (0.01) - * - * - $0.04 $0.03 $0.10 $0.07 $0.09 $0.07 $0.15 $0.15 * * * * (*) (*) (*) (*) $0.09 $0.07 $0.15 $0.15 $(*) $(*) $(*) $(*) * * * * $- $- $- $- $0.49 $0.33 $1.35 $1.04 * * * * * * * * (*) (*) (*) (*) ( 0.01) - (0.01) - * -* - $0.48 $0.33 $1.34 $1.04 282.6 280.3 282.4 280.1
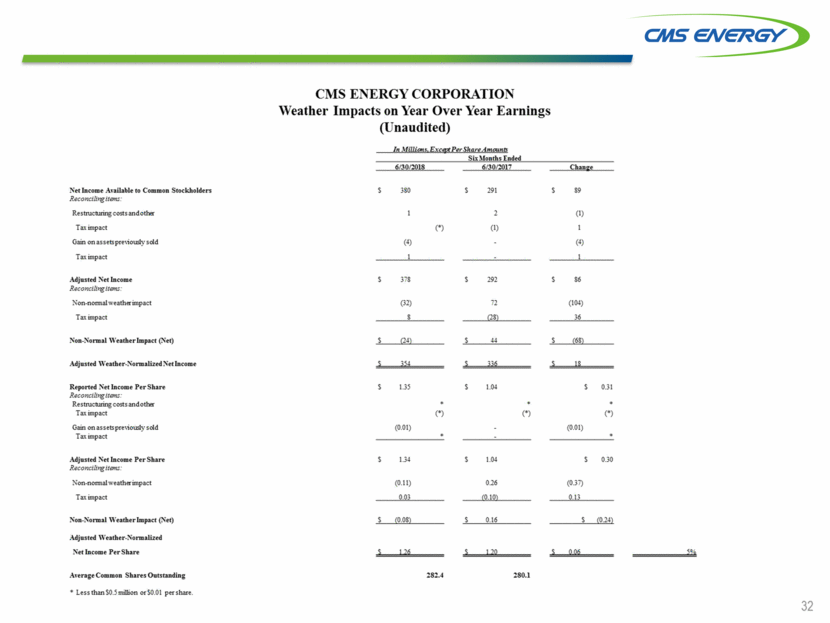
cms energy corporation weather impacts on year over year earnings (unaudited) net income available to common stockholders reconciling items: restructuring costs and other tax impact gain on assets previously sold tax impact adjusted net income reconciling items non-normal weather impact tax impact non-normal weather impact (net) adjusted weather-normalized net income reported net income per share reconciling items: restructuring costs and other tax impact gain on assets previously sold tax impact adjusted net income per share reconciling items non-normal weather impact tax impact non-normal weather impact (net) adjusted weather normalized net income per share average common shares outstanding * less than $0.5 million or $0.01 per share. in million, except per share amounts six months ended 06/30/2018 06/30/2017 change $380 $291 $89 1 2 (1) (*) (1) 1 (4) - (4) 1 - 1 $378 $292 $86 (32) 72 (104) 8 (28) 36 $(24) $44 $(68) $354 $336 $18 $1.35 $1.04 $0.31 * * * (*) (*) (*) (0.01) - (0.01) * - * $1.34 $1.04 $0.30 (0.11) 0.26 (0.37) 0.03 (0.10) 0.13 $(0.08) $0.16 $(0.24) $1.26 $1.20 $0.06 5% 282.4 280.1
