Attached files
| file | filename |
|---|---|
| EX-99.1 - EXHIBIT 99.1 - CMC Materials, Inc. | exhibit99_1.htm |
| 8-K - CMC 8-K FILED 07-25-18 - CMC Materials, Inc. | cmc8kfiled072518.htm |
Investor Presentation June 2018 Fiscal Year 2018 Third Quarter Earnings Call July 26, 2018

Safe Harbor Statement The information contained in and discussed during this presentation may include “forward-looking statements” within the meaning of federal securities regulations. These forward-looking statements involve a number of risks, uncertainties, and other factors, including those described in Cabot Microelectronics’ filings with the Securities and Exchange Commission (SEC), that could cause actual results to differ materially from those described by these forward-looking statements. Cabot Microelectronics Corporation assumes no obligation to update this forward-looking information. 2

Fiscal Year 2018 Third Quarter Highlights 3 Record Revenue of $150M; exceeded prior year by $22M, or 18%At the high end of expectations stated in previous quarterDriven by continued strong industry demand, particularly in memoryRecord revenues in tungsten and dielectrics slurriesStrong growth in Korea and ChinaRecord Net Income of $35M; exceeded prior year by $15M, or 76%Approximately 23% of revenueRecord EPS of $1.34; exceeded prior year by $0.57, or 74% * Data represented by rounded values

Revenue Overview 4 2018 Q3* 2017 Q3* % Change from Prior Year* Comments Total Revenue $150M $128M 18% Continued execution of our strategic initiatives and growing global semiconductor industry demand Tungsten Slurries $64M $55M 18% Continued strong demand in memory and logic applications Dielectrics Slurries $37M $30M 21% Growth in our high performing advanced dielectrics slurries and memory applications Polishing Pads $21M $18M 19% Driven by our NexPlanar line of products Other Metals Slurries $18M $16M 13% Metals slurry products other than tungsten Engineered Surface Finishes/Other $10M $9M 13% Includes QED Technologies * Data represented by rounded values

GAAP Results* Non-GAAP Results* Comments on Results 2018 Q3 2017 Q3 2018 Q3 2017 Q3 Revenue $150.4M $128.0M Record Revenue in the last five quarters Gross Margin 53.6% 48.9% 54.5% 49.8% Driven by increased volume combined with high-value product mix Operating Margin 27.9% 21.0% 29.1% 22.3% Record Net Income in 3QFY18Increases reflect operating leverage driven by revenue growth, combined with ongoing attention to controlling costs Net Income $35.2M $19.9M $36.0M $21.0M Diluted EPS $1.34 $0.77 $1.37 $0.81 Financial Details 5 * Data represented by rounded values
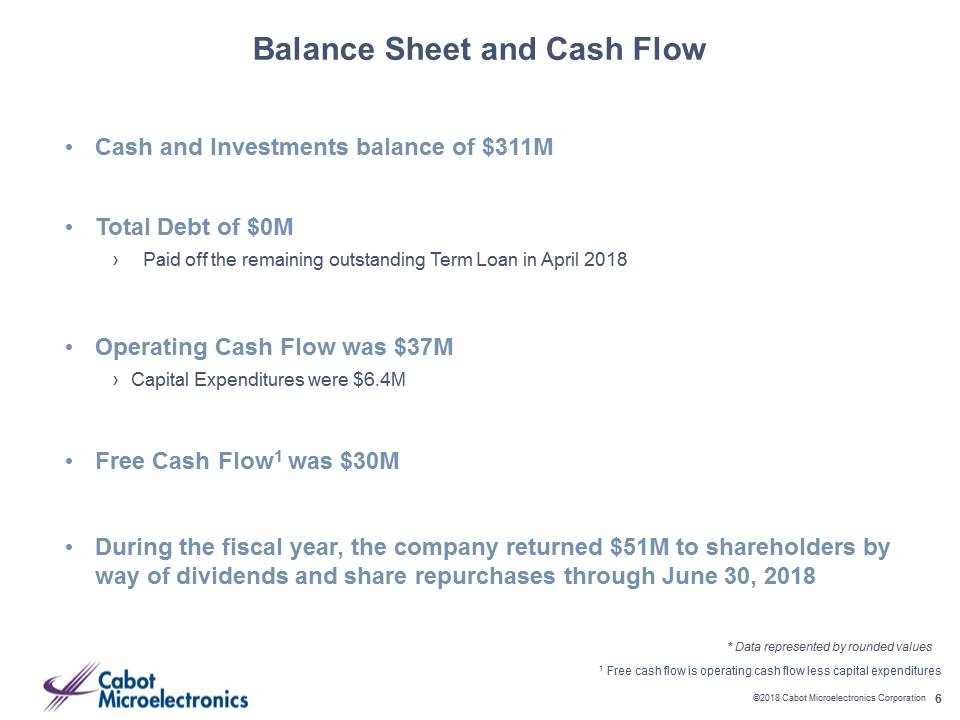
Balance Sheet and Cash Flow 6 Cash and Investments balance of $311MTotal Debt of $0M Paid off the remaining outstanding Term Loan in April 2018Operating Cash Flow was $37MCapital Expenditures were $6.4MFree Cash Flow1 was $30MDuring the fiscal year, the company returned $51M to shareholders by way of dividends and share repurchases through June 30, 2018 1 Free cash flow is operating cash flow less capital expenditures * Data represented by rounded values

Closing Remarks 7 Fifth consecutive quarter of record revenueRevenue of $150M increased by approximately $22M, or 18%, from last year, driven by growth across all product areasNet Income of $35M increased by approximately $15M, or 76%, from last yearBenefited from revenue growth, margin expansion and continued operating expense disciplineRevenue increased by approximately $22M while Operating Income increased by approximately $15M, compared with prior year This implies 67% operating leverage on the incremental revenueWe remain confident in our ability to drive continued revenue growth, sustained gross margin performance, and disciplined management of operating costs Q4 expectation is for a low single digit sequential increase in revenue for IC CMP consumables * Data represented by rounded values

Appendix 8 Quarter Guidance Full Year Guidance Q4FY2018 Previous Communication Current Communication Revenue(IC CMP Consumables) Expect low single digit sequential increase over Q3 Gross Margin (GAAP Basis) 51%-53% 52%-53% Operating Expense (GAAP Basis) $148-$153M $150-$155M Tax Rate 21%-24%(For Q3-Q4) 21%-24%(For Q4) Capital Spending $18-$22M $18-$22M

investor_relations@cabotcmp.com630.499.2600 For additional information, please contact: Thank you for your interest in Cabot Microelectronics Corporation