Attached files
| file | filename |
|---|---|
| EX-23.1 - EX-23.1 - PCB BANCORP | d554184dex231.htm |
Table of Contents
As filed with the Securities and Exchange Commission on July 25, 2018
Registration No. 333-226208
UNITED STATES
SECURITIES AND EXCHANGE COMMISSION
Washington, D.C. 20549
Amendment No. 1
to
Form S-1
REGISTRATION STATEMENT
UNDER
THE SECURITIES ACT OF 1933
PACIFIC CITY FINANCIAL CORPORATION
(Exact name of registrant as specified in its charter)
| California | 6022 | 41-2138340 | ||
| (State or other jurisdiction of incorporation or organization) |
(Primary Standard Industrial Classification Code Number) |
(I.R.S. Employer Identification No.) |
3701 Wilshire Boulevard, Suite 900
Los Angeles, California 90010
(213) 210-2000
(Address, including zip code, and telephone number, including area code, of registrant’s principal executive offices)
Henry Kim
President & Chief Executive Officer
Pacific City Financial Corporation
3701 Wilshire Boulevard, Suite 900
Los Angeles, CA 90010
(213) 210-2000
(Name, address, including zip code and telephone number, including area code, of agent for service)
with a copy to:
| Kenneth E. Moore, Esq. Michael K. Staub, Esq. Stuart | Moore | Staub 641 Higuera Street, Suite 302 San Luis Obispo, CA 93401 (805) 545-8590 |
Timothy Chang EVP & Chief Financial Officer Pacific City Financial Corporation 3701 Wilshire Boulevard, Suite 900 Los Angeles, CA 90010 |
Mike Keeley, Esq. Justin Long, Esq. Norton Rose Fulbright US LLP 2200 Ross Avenue, Suite 3600 Dallas, TX 75201 (214) 855-3906 |
Approximate date of commencement of proposed sale to the public: As soon as practicable after the effective date of this registration statement.
If any of the securities being registered on this Form are to be offered on a delayed or continuous basis pursuant to Rule 415 under the Securities Act of 1933 check the following box: ☐
If this Form is filed to register additional securities for an offering pursuant to Rule 462(b) under the Securities Act, please check the following box and list the Securities Act registration statement number of the earlier effective registration statement for the same offering. ☐
If this Form is a post-effective amendment filed pursuant to Rule 462(c) under the Securities Act, check the following box and list the Securities Act registration statement number of the earlier effective registration statement for the same offering. ☐
If this Form is a post-effective amendment filed pursuant to Rule 462(d) under the Securities Act, check the following box and list the Securities Act registration statement number of the earlier effective registration statement for the same offering. ☐
Indicate by check mark whether the registrant is a large accelerated filer, an accelerated filer, a non-accelerated filer, a smaller reporting company or an emerging growth company. See the definitions of “large accelerated filer,” “accelerated filer” “smaller reporting company” and “emerging growth company” in Rule 12b-2 of the Exchange Act.
| Large accelerated filer | ☐ | Accelerated filer | ☐ | |||
| Non-accelerated filer | ☒ (Do not check if a smaller reporting company) | Smaller reporting company | ☐ | |||
| Emerging growth company | ☒ |
If an emerging growth company, indicate by check mark if the registrant has elected not to use the extended transition period for complying with any new or revised financial accounting standards provided to Section 7(a)(2)(B) of the Securities Act. ☒
CALCULATION OF REGISTRATION FEE
|
| ||||
| Title of Each Class of Securities to be Registered |
Proposed Maximum Aggregate Offering Price(1)(2) |
Amount of Registration Fee(3) | ||
| Common Stock, without par value per share |
$50,000,000 | $6,225 | ||
|
| ||||
|
| ||||
| (1) | Estimated solely for the purpose of calculating the amount of the registration fee in accordance with Rule 457(o) under the Securities Act of 1933, as amended. This amount represents the proposed maximum aggregate offering price of the securities registered hereunder to be sold by the Registrant. |
| (2) | Includes the aggregate offering price of additional shares that may be purchased by the underwriters pursuant to their option to purchase additional shares from the Registrant. |
| (3) | Previously paid |
The Registrant hereby amends this Registration Statement on such date or dates as may be necessary to delay its effective date until the Registrant shall file a further amendment which specifically states that this registration statement shall thereafter become effective in accordance with Section 8(a) of the Securities Act of 1933, or until the Registration Statement shall become effective on such date as the Securities and Exchange Commission, acting pursuant to said Section 8(a), may determine.
Table of Contents
PRELIMINARY—SUBJECT TO COMPLETION, DATED July 25, 2018
The information in this preliminary prospectus is not complete and may be changed. We may not sell these securities until the Registration Statement filed with the Securities and Exchange Commission is effective. This preliminary prospectus is not an offer to sell nor does it seek an offer to buy these securities in any jurisdiction where the offer or sale is not permitted.
PRELIMINARY PROSPECTUS

[*] Shares
Common Stock
This prospectus relates to the initial public offering of Pacific City Financial Corporation. We are the bank holding company for Pacific City Bank, headquartered in Los Angeles, California. We are offering [*] shares of our common stock.
Prior to this offering, there has been no established public market for our common stock, although our common stock has been quoted on the OTC Pink Market under the symbol “PFCF.” We anticipate that the public offering price of our common stock will be between $[*] and $[*] per share. We have applied to list our common stock on the Nasdaq Global Market under the trading symbol “PCB.”
Investing in our common stock involves risk. See “Risk Factors” beginning on page 23.
We are an “emerging growth company” under the federal securities laws and will be subject to reduced public company reporting requirements. See “Implications of Being an Emerging Growth Company.”
| Per Share | Total | |||||||
| Initial public offering price |
$ | $ | ||||||
| Underwriting discounts(1) |
||||||||
| Proceeds to us, before expenses |
||||||||
| (1) | See “Underwriting” for additional information regarding underwriting compensation. |
We have granted the underwriters an option to purchase up to an additional [*] shares from us at the initial public offering price, less the underwriting discounts, within 30 days from the date of this prospectus.
Neither the Securities and Exchange Commission nor any other state securities commission nor any other regulatory authority has approved or disapproved of these securities or passed upon the accuracy or adequacy of this prospectus. Any representation to the contrary is a criminal offense.
Shares of our common stock are not savings accounts or deposits and are not insured or guaranteed by the Federal Deposit Insurance Corporation or any other government agency.
The underwriters expect to deliver the shares of our common stock on or about [*], 2018, subject to customary closing conditions.
Book Running Managers
| Keefe, Bruyette & Woods A Stifel Company |
||||
| RAYMOND JAMES | ||||
| Sandler O’Neill + Partners, L.P. |
The date of this prospectus is [*], 2018.
Table of Contents
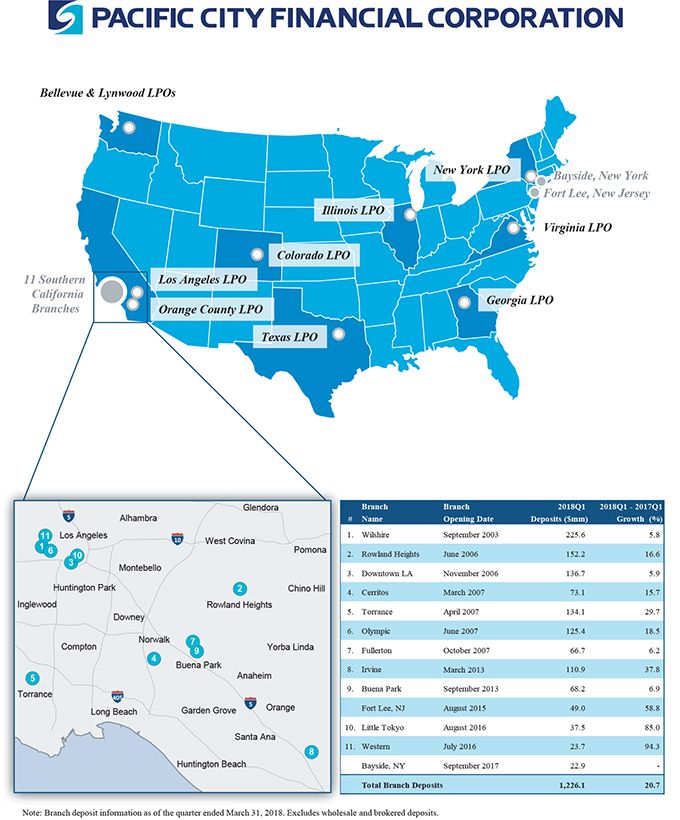
Table of Contents
| ii | ||||
| ii | ||||
| ii | ||||
| 1 | ||||
| 16 | ||||
| 18 | ||||
| 21 | ||||
| 23 | ||||
| 53 | ||||
| 55 | ||||
| 56 | ||||
| 57 | ||||
| 59 | ||||
| Management’s Discussion and Analysis of Financial Condition and Results of Operations |
61 | |||
| 105 | ||||
| 123 | ||||
| 139 | ||||
| 146 | ||||
| 154 | ||||
| Security Ownership of Certain Beneficial Owners and Management |
155 | |||
| 158 | ||||
| 162 | ||||
| Material United States Federal Income Tax Considerations For Non-U.S. Holders |
163 | |||
| 167 | ||||
| 172 | ||||
| 172 | ||||
| 172 | ||||
| Index to Consolidated Financial Statements of Pacific City Financial Corporation |
F-1 |
i
Table of Contents
You should rely only on the information contained in this prospectus or in any free writing prospectus that we authorize to be delivered to you. We and the underwriters have not authorized anyone to provide you with different or additional information. You should not assume that the information contained in this prospectus is accurate as of any date other than the date on the front of this prospectus. Our business, financial condition, results of operations and prospects may have changed since that date.
Unless we state otherwise or the context otherwise requires, references in this prospectus to “we,” “our,” “us” or “the Company” refer to Pacific City Financial Corporation, a California corporation, and our consolidated subsidiary, while references to the “Bank” refer to our banking subsidiary, Pacific City Bank, a California state chartered bank.
We and the underwriters are not making an offer of these securities in any jurisdiction where the offer is not permitted. No action is being taken in any jurisdiction outside the United States (“U.S.”) to permit a public offering of our securities or possession or distribution of this prospectus in that jurisdiction. Persons who come into possession of this prospectus in jurisdictions outside the U.S. are required to inform themselves about, and to observe, any restrictions as to the offering and the distribution of this prospectus applicable to those jurisdictions.
You should not interpret the contents of this prospectus to be legal, business, investment or tax advice. You should consult with your own advisors for that type of advice and consult with them about the legal, tax, business, financial and other issues that you should consider before investing in our common stock.
Within this prospectus, we reference certain market, industry and demographic data and other statistical information. We have obtained this data and information from various independent, third-party industry sources and publications. Nothing in the data or information used or derived from third-party sources should be construed as advice. Some data and other information are also based on our good faith estimates, which are derived from our review of internal surveys and independent sources. We believe that these external sources and estimates are reliable, but have not independently verified them. Statements as to our market position are based on market data currently available to us. Although we are not aware of any misstatements regarding the economic, employment, industry and other market data presented herein, these estimates involve inherent risks and uncertainties and are based on assumptions that are subject to change.
IMPLICATIONS OF BEING AN EMERGING GROWTH COMPANY
As a company with less than $1.07 billion in revenue during our last fiscal year, we qualify as an “emerging growth company” under the Jumpstart Our Business Startups Act of 2012 (the “JOBS Act”). An emerging growth company may take advantage of reduced reporting requirements and is relieved of certain other significant requirements that are otherwise generally applicable to public companies. As an emerging growth company:
| • | we may present as few as two years of audited financial statements and two years of related management discussion and analysis of financial condition and results of operations; |
| • | we may present fewer than five years of selected historical financial data; |
| • | we are exempt from the requirement to obtain an attestation and report from our auditors on management’s assessment of our internal control over financial reporting under the Sarbanes-Oxley Act of 2002; |
| • | we are permitted to provide less extensive disclosure about our executive compensation arrangements; and |
| • | we are not required to give our shareholders non-binding advisory votes on executive compensation or golden parachute arrangements. |
ii
Table of Contents
In this prospectus we have elected to take advantage of the reduced disclosure requirements relating to executive compensation and the number of years of financial information presented, and in the future we may take advantage of any or all of these exemptions for so long as we remain an emerging growth company. We will remain an emerging growth company until the earliest of (i) the end of the fiscal year during which we have total annual gross revenues of $1.07 billion or more, (ii) the end of the fiscal year following the fifth anniversary of the completion of this offering, (iii) the date on which we have, during the previous three-year period, issued more than $1.0 billion in non-convertible debt and (iv) the date on which we are deemed to be a “large accelerated filer” under the Securities Exchange Act of 1934, as amended (the “Exchange Act”).
In addition to the relief described above, the JOBS Act permits us an extended transition period for complying with new or revised accounting standards affecting public companies. We have irrevocably determined not to take advantage of this extended transition period, which means that the financial statements included in this prospectus, as well as any financial statements that we file in the future, will be subject to all new or revised accounting standards generally applicable to public companies.
iii
Table of Contents
This summary highlights selected information contained elsewhere in this prospectus and may not contain all of the information that you should consider before investing in our common stock. Before making an investment decision you should carefully read the entire prospectus, including the sections entitled “Risk Factors” and “Management’s Discussion and Analysis of Financial Condition and Results of Operations,” together with our consolidated financial statements and the related notes that are included herein.
Our Company
We are Pacific City Financial Corporation, a registered bank holding company headquartered in Los Angeles, California. We provide a full suite of commercial banking services through our wholly owned subsidiary, Pacific City Bank, a California state chartered bank, to small to medium-sized businesses, individuals and professionals, primarily in Southern California, and predominantly in Korean-American and other minority communities. As of March 31, 2018, we had total assets of $1.6 billion, total deposits of $1.4 billion, total loans (including loans held-for-sale) of $1.2 billion and total shareholders’ equity of $147.2 million.
Our ability to execute on our strategic plan has been supported entirely by our organic growth capabilities. Since our formation, we have sought to build a premier community bank that delivers personalized service, quick and local decision-making and convenience to customers in our target markets, particularly to Korean-American communities in the U.S. We focus both on existing businesses and individuals already established in our local market area, as well as Korean immigrants who desire to establish their own businesses, purchase homes or educate their children in the U.S.
We are led by our President and Chief Executive Officer, Henry Kim, and we have used the experience and expertise of our board of directors, officers and employees to tailor our loan and deposit products to serve this Korean-American market niche. We have thirteen full service branch locations, eleven of which are located in California and one of which is located in each of New York and New Jersey. We also have ten loan production offices (“LPOs”) in our target markets in eight different states. We have established our branch and LPO network in major metropolitan areas with significant Korean-American populations.
We believe that our scale as the third largest independent Korean-American bank, our network of banking offices located in the major Korean-American markets in the U.S., our cohesive and experienced management team and our conservative credit culture differentiate us from our competition and have laid the foundation for sustainable, profitable growth.
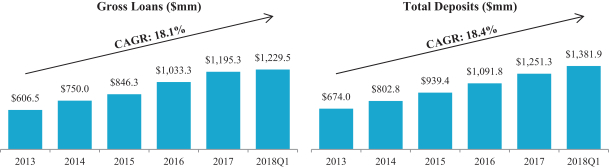
From December 31, 2013 through March 31, 2018, total loans (including loans held-for-sale) grew from $606.5 million to $1.2 billion at a compound annual growth rate (“CAGR”) of 18.1% and total deposits grew from $674.0 million to $1.4 billion at a CAGR of 18.4% as shown in the charts below.
1
Table of Contents
We offer a diversified set of lending products that includes traditional commercial property loans, secured and unsecured commercial and industrial loans (“C&I loans”), Small Business Administration guaranteed loans (“SBA loans”), residential property loans, and consumer loans in our market areas. We attract retail deposits through our branch network which offers a wide range of deposit products for business and consumer banking customers. Our deposit products and services are competitively priced with a focus on convenience and accessibility. We provide our customers a full suite of online and mobile banking solutions including remote check deposit and mobile bill pay capabilities. We also offer a full array of commercial treasury management services designed to be competitive with banks of all sizes. Treasury management services include positive pay, remote deposit capture, automated clearing house (“ACH”) origination, wire origination and stop payment initiation.
We believe the capital raised in this offering will help fund additional organic growth in our current footprint through deeper market penetration by, among other things, increasing our legal lending limit, better satisfying the loan demands from our current and prospective customers, and providing regulatory capital ratios capable of supporting our growing asset base.
Our History
We are a California corporation that was incorporated in 2007 to serve as the holding company for the Bank which was founded in 2003 by a group of experienced bankers, including our President and Chief Executive Officer, Henry Kim. Our founders, who had worked together for many years at various Korean-American banks in California in the 1980s and 1990s, identified an opportunity resulting from the strong growth of Korean-American businesses in the greater Los Angeles area and the increased level of consolidation throughout the Korean-American banking landscape. Our founders observed that, despite the existence of a few larger banking institutions serving this market, there was a tremendous opportunity to create a true community bank focused on serving the first and second generation Korean-American population.
Although we serve all ethnicities, our board and management team are comprised of Korean-Americans. Our marketing focus was initially on local Korean-American businesses and first and second generation Korean-Americans who prefer to conduct business in their native Korean language, and we developed our loan and deposit products to serve this Korean-American market niche. Initially, our market area was Los Angeles and Orange Counties in California, and, in 2006, we added our first LPO in Lynwood, Washington. Between 2006 and 2013, we expanded our Southern California branch footprint with the addition of eight full service offices and added four offices to our national SBA loan production footprint.
Since 2014, we have expanded our network of banking offices from nine full service branch locations to thirteen branch locations in what we believe are two of the most vibrant growth markets in the nation, namely Southern California and the greater New York City metropolitan area. We have also grown from five LPOs in 2013 to ten LPOs in major metropolitan areas with significant Korean-American populations. Our branch operations include eight full service branches in Los Angeles County California, three branches in Orange County California, and our first two out-of-state branches on the East Coast located in Bayside, New York and Fort Lee, New Jersey. Our ten LPOs are located in Los Angeles and Irvine, California; Lynnwood and Bellevue, Washington; Dallas, Texas; Aurora, Colorado; Atlanta, Georgia; Annandale, Virginia; Chicago, Illinois; and New York, New York.
2
Table of Contents
Our Competitive Strengths
We believe that our competitive strengths set us apart from many similarly-sized community banks and other Korean-American focused institutions, and that the following attributes are key to our success:
Cohesive and Experienced Management Team. We are led by a seven-person executive management team, consisting of our President and Chief Executive Officer, our Executive Vice President and Chief Financial Officer, our Executive Vice President and Chief Risk Officer, and our four Senior Vice Presidents, with an average of 22 years of banking experience covering the relevant disciplines of finance, lending, credit, risk, strategy and branch operations. Our executive team has been in their respective roles with the Company and the Bank for an average of 11 years, and substantially all have known and worked with Mr. Kim prior to joining the Bank. Collectively, they have been responsible for executing our strategic plan and driving our growth. Our executive management team includes:
| Name |
Current Position with the Company/Bank |
Banking Experience | ||
| Henry Kim | President and Chief Executive Officer of the Company and the Bank | 28 years of banking experience and has been with the Bank since it was founded in 2003 and the Company since its founding in 2007 | ||
| Timothy Chang | Executive Vice President and Chief Financial Officer of the Company and the Bank | 18 years of banking experience, including 8 years with the Company and the Bank | ||
| Andrew Chung | Executive Vice President and Chief Risk Officer of the Bank | 20 years of banking experience, including 4 years with the Company and the Bank | ||
| Brian Bang | Senior Vice President and Chief Credit Officer of the Bank | 17 years of banking experience, including 12 years with the Bank | ||
| John Ju | Senior Vice President and Chief Lending Officer of the Bank | 20 years of banking experience, including 11 years with the Bank | ||
| Justin Chon | Senior Vice President and Chief Consumer Lending Officer of the Bank | 23 years of banking experience, including 14 years with the Bank | ||
| Mimi Lee | Senior Vice President and Chief Operations Administrator of the Bank | 27 years of banking experience, including 13 years with the Bank |
Mr. Kim, who was promoted to President and Chief Executive Officer in January of 2018, has served as an executive officer of the Bank since its formation in 2003. He is a member of the Company’s and Bank’s boards of directors. During his 15-plus years with the Bank, Mr. Kim has held the positions of Chief Credit Officer, Chief Operating Officer and Corporate Secretary of the Bank from 2004 to 2017, and Corporate Secretary of the Company from 2007 to 2017. While serving as the Bank’s Chief Operating Officer, Mr. Kim spearheaded initiatives that have resulted in our total assets increasing from $755.9 million at December 31, 2013 to $1.6 billion at March 31, 2018, our equity increasing from $76.5 million to $147.2 million over that same time period, the expansion of our branch network in Southern California and into the greater New York City metropolitan market and the establishment and expansion of our extensive LPO network in eight different states.
The Bank is also fortunate to have a depth of vice presidents and managers at all levels of the organization, each of whom has substantial experience and generally a long employment with the Bank.
History of Organic Growth and Proven Financial Performance. Since our formation, we have grown by originating loans and sourcing deposits within the communities we serve. Although our initial focus was on the Korean-American community, we have expanded our focus to include other under-served minority communities in our markets including Chinese-American, Persian-American and Indian-American clientele. During the period from January 1, 2013 to March 31, 2018, we cumulatively originated $2.6 billion of loans. Of that number in originations,
3
Table of Contents
$1,462.8 million were commercial property loans, $521.0 million were residential property loans, $465.4 million were C&I loans, $96.2 million were consumer loans and $63.7 million were construction loans. Within the categories of commercial property loans and C&I loans were $754.2 million of SBA loan originations ($560.2 million in SBA property and $194.0 million in SBA commercial term). During this same period we sold a total of $553.4 million in SBA loans and $246.3 million in residential property loans. While growing our assets, we have also delivered increasing and sustained profitability during that time period. Our net income and return on average assets were $21.4 million and 3.14%, respectively, in 2013, $11.8 million and 1.46%, respectively, in 2014, $12.2 million and 1.25%, respectively, in 2015, $14.0 million and 1.25%, respectively, in 2016 and $16.4 million and 1.22% respectively, in 2017. For the first quarter of 2018, our net income and return on average assets were $6.3 million and 1.73%, respectively. However, both 2013 and 2017 saw material non-recurring items that impacted our reported net income and return on average assets for those years. We had a recapture of $11.5 million in deferred tax assets in 2013 and an impairment of $1.6 million in deferred tax assets due to the Tax Cuts and Jobs Act, which was enacted on December 22, 2017 (the “Tax Reform Act”). Our profitability since 2013 is detailed in the chart below and has been adjusted for 2013 and 2017 to account for those significant non-recurring items.
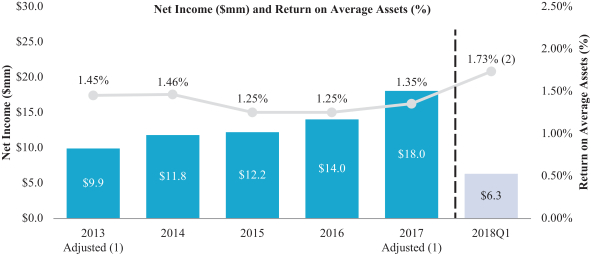
| (1) | The amounts for the years 2013 and 2017 have been adjusted for impacts related to deferred tax asset recapture of $11.5 million in 2013 and an impairment of $1.6 million following a deferred tax asset revaluation due to the passing of the Tax Reform Act. The adjusted net income and return on average assets for 2013 and 2017 are not presented in accordance with U.S. generally accepted accounting principles (“GAAP”). See “Non-GAAP Financial Measures” for a reconciliation of these measures to their most comparable GAAP measures. |
| (2) | Annualized. |
4
Table of Contents
We have been able to generate consistent increases in net interest income proportionally outpacing increases in non-interest expense. We have grown our net interest income from $26.9 million for the year ended December 31, 2013 to $55.2 million for the year ended December 31, 2017. For the first quarter of 2018, our net interest income was $15.3 million. We believe our net interest income momentum supplemented by a diversified loan mix and the origination and sale of SBA loans provides a strong platform for continued growth. The chart below shows our total revenue and gain on sale of SBA loans for 2013 through the first quarter of 2018.
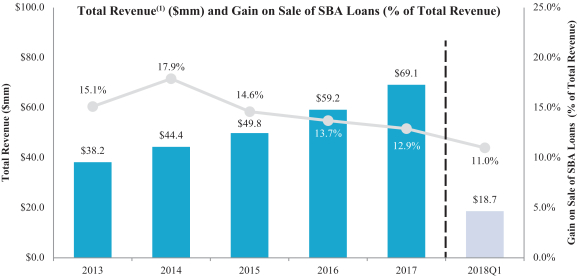
| (1) | Total revenue is the sum of net interest income and non-interest income. |
Conservative Credit Culture and Risk Profile with Diversified Loan Portfolio. We maintain a conservative credit culture with strict underwriting standards. As we have grown, we have invested in and developed a credit culture that we believe will support future growth and expansion efforts while maintaining outstanding asset quality. Led by our Chief Credit Officer and other highly experienced Senior Credit Officers, our credit departments have robust internal controls and lending policies with conservative underwriting standards. Loans are monitored on an ongoing basis in accordance with covenants and conditions that are commensurate with each loan’s size and complexity. We conduct comprehensively scoped internal loan reviews at least semi-annually using an independent loan review specialist to validate the appropriateness of risk ratings of loans by management. Our loan monitoring processes are designed to identify both the inherent and emerging risks in a timely manner so that appropriate risk ratings are assigned and, if necessary, work-out/collection activities are commenced early to minimize any potential losses. At March 31, 2018, we had $2.4 million of nonperforming assets (“NPAs”), or 0.15% of total assets. At March 31, 2018, we maintained an allowance for loan losses of $12.4 million, reflecting 1.01% of total loans.
5
Table of Contents
The following graphs depict our NPAs to total assets and allowance for loan losses to total loans as of the dates indicated:
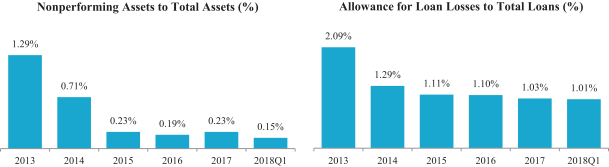
Our disciplined credit culture is also evidenced by the make-up of our loan portfolio and its consistency as we have grown. Our loan portfolio consists primarily of three major categories of loans: real estate loans, C&I loans and consumer loans. Within these three broad categories, we further segment our loan portfolio as follows:
| • | Real estate loans consist of: |
| • | Commercial property—loans secured by commercial real estate; |
| • | Residential property—loans secured by 1-4 family residential real estate; |
| • | SBA property—SBA guaranteed loans secured by commercial real estate; and |
| • | Construction loans |
| • | C&I loans consist of: |
| • | Commercial term; |
| • | Commercial lines of credit; |
| • | SBA commercial term; and |
| • | International loans |
| • | Consumer loans consist of our automobile secured loans and personal loans. |
6
Table of Contents
The charts below illustrate our loan portfolio composition as of the dates indicated, separately by type of collateral support and relevant business line.
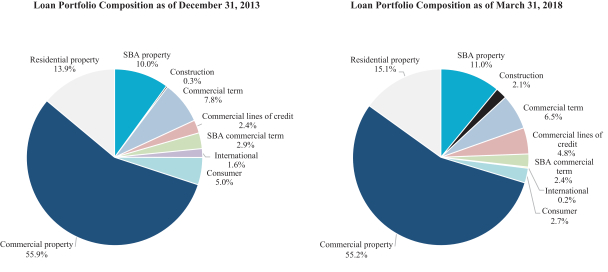
Because of our business strategy and the breadth of the economy within our primary origination markets of Los Angeles and Orange Counties in California, and Queens County, New York and Bergen County, New Jersey, our loan portfolio is widely diversified across industry lines and is not concentrated in any one particular business sector. We expect this industry diversification to continue as a result of our current practices and strategies, and for our geographic diversity to increase as our Bayside and Fort Lee branches grow. As of March 31, 2018, our commercial real estate (“CRE”) concentration ratio (as defined by the federal bank regulators) was 357.1% and we believe that we are appropriately managing our CRE concentration consistent with safe and sound banking operations. At March 31, 2018, the balance of our CRE loans for the purpose of calculating the CRE concentration ratio as defined by the federal bank regulators totaled $570.9 million, and the weighted average loan to value ratio for those loans was 52.5%. We believe the capital we raise through this offering will help us reduce our CRE concentration ratio significantly.
We have maintained a conservative amount of capital, raising capital when needed to support our growth: our regulatory capital ratios as of March 31, 2018 of 10.1% of Tier 1 leverage capital to average assets, 12.3% of common equity Tier 1 capital, 12.3% of Tier 1 risk-based capital and 13.4% of total risk-based capital are well above required fully phased-in regulatory thresholds.
In addition, we believe that we have positioned our balance sheet to benefit from a rising interest rate environment. At March 31, 2018, 73.2% of the loans in our portfolio had floating interest rates. With the gradual rise in interest rates since the November 2016 presidential election, approximately three-fourths of our loans have and will continue to reprice upwards as interest rates increase. Of our $1.2 billion in total loans at March 31, 2018, $894.9 million were variable rate loans, only $51.0 million of which contained interest rate floors, of which $49.1 million or 96% were then above their base floor rates. This means that with an increase in interest rates of 25 basis points as of such date, all but $1.9 million of such loans would have repriced. Accordingly, a continuing upward movement in interest rates should be more immediately reflected in increased yields for our loan portfolio than higher funding costs, though no assurances can be made.
Proven Branch and LPO Network Covering Seven Top Korean-American Markets. We have built a network of banking offices in attractive markets for our operations that we believe support our continued growth. We have focused our de novo branching strategy on expansion into Korean-American populated areas in the general
7
Table of Contents
markets we currently serve through either our existing branch network or LPOs. We currently service seven of the top ten Korean-American Metropolitan Statistical Areas (“MSAs”) in the U.S. (based on total population projected for 2018) through our branches or LPOs.
We have eight branches in Los Angeles County located in Koreatown/Mid-Wilshire, Koreatown/W. Olympic, Los Angeles Downtown Fashion District, Little Tokyo, Western Avenue, Cerritos, Torrance and Rowland Heights. We operate primarily in the Los Angeles-Long Beach-Anaheim, California MSA. With over 13 million residents, it is the largest MSA in California, the second largest MSA in the U.S., and one of the most significant business markets in the world. The federal government’s recently released annual accounting of business output of U.S. metro areas shows the Los Angeles-Orange County region’s gross domestic product has now exceeded $1 trillion (only the second U.S. metro area to do so, along with the New York City-New Jersey metro), which would rank it as the 16th largest economy in the world. The economic base of the area is heavily dependent on small- and medium-sized businesses, providing us with a market rich in potential customers. According to Nielsen, Asian-Americans are projected to account for 16.2% of the estimated 13.4 million residents in Los Angeles-Long Beach-Anaheim MSA in 2018.
We operate three branches in Orange County, California: two in Buena Park and one in Irvine. Orange County is considered part of the Los Angeles-Long Beach-Anaheim, California MSA and has similar market characteristics to Los Angeles County.
We also operate two branches in the New York-Newark-Jersey City, NY-NJ-PA MSA. This MSA encompasses the greater New York City region and is the largest in terms of total population. According to Nielsen, the 2018 Asian-American population is projected to account for 11.5% of the estimated 20.2 million residents within this MSA. The table below illustrates the demographic profiles in our markets of operations, substantially all of which have a high concentration of Asian-Americans and Korean-Americans relative to the total population. The table is sorted by Korean-American population size.
| U.S Population | Asian-American Population | Korean-American Population | ||||||||||||||||||||||||||||||
| 2018 | 2018-2023 | 2018 | 2018 | 2018-2023 | 2018 | 2018 | 2018-2023 | |||||||||||||||||||||||||
| MSA |
Population (actual) |
Proj. Growth (%) |
Population (actual) |
Population (%) |
Proj. Growth (%) |
Population (actual) |
Population (%) |
Proj. Growth (%) |
||||||||||||||||||||||||
| Los Angeles-Long Beach-Anaheim, CA |
13,436,808 | 3.4 | % | 2,174,892 | 16.2 | % | 9.5 | % | 333,611 | 2.5 | % | 10.2 | % | |||||||||||||||||||
| New York-Newark-Jersey City, NY-NJ-PA |
20,251,724 | 1.9 | % | 2,331,909 | 11.5 | % | 12.1 | % | 225,971 | 1.1 | % | 12.1 | % | |||||||||||||||||||
| Washington-Arlington-Alexandria, DC-VA-MD-WV |
6,224,774 | 5.2 | % | 663,583 | 10.7 | % | 14.6 | % | 90,158 | 1.4 | % | 14.3 | % | |||||||||||||||||||
| Seattle-Tacoma-Bellevue, WA |
3,885,514 | 6.7 | % | 533,416 | 13.7 | % | 18.2 | % | 62,141 | 1.6 | % | 18.2 | % | |||||||||||||||||||
| Chicago-Naperville-Elgin, IL-IN-WI |
9,504,650 | 0.3 | % | 656,618 | 6.9 | % | 12.2 | % | 57,145 | 0.6 | % | 12.2 | % | |||||||||||||||||||
| Atlanta-Sandy Springs-Roswell, GA |
5,919,767 | 6.5 | % | 358,930 | 6.1 | % | 20.4 | % | 52,800 | 0.9 | % | 20.5 | % | |||||||||||||||||||
| Dallas-Fort Worth-Arlington, TX |
7,418,556 | 7.7 | % | 506,609 | 6.8 | % | 22.7 | % | 37,036 | 0.5 | % | 23.1 | % | |||||||||||||||||||
| Denver-Aurora-Lakewood, CO |
2,933,089 | 7.7 | % | 126,656 | 4.3 | % | 17.5 | % | 15,013 | 0.5 | % | 18.1 | % | |||||||||||||||||||
|
|
|
|
|
|
|
|
|
|
|
|
|
|
|
|
|
|||||||||||||||||
| United States of America |
326,533,070 | 3.5 | % | 18,637,597 | 5.7 | % | 14.5 | % | 1,629,384 | 0.5 | % | 14.6 | % | |||||||||||||||||||
|
|
|
|
|
|
|
|
|
|
|
|
|
|
|
|
|
|||||||||||||||||
| Source: | S&P Global Market Intelligence. |
We have supplemented our branch network by establishing LPOs in Korean-American communities in major metropolitan areas, particularly to support our SBA lending operations. Since we opened our first LPO in 2006, we have added nine additional LPOs in eight different states, including LPOs in Seattle and Dallas-Fort Worth, which sit at fourth and ninth positions, respectively, in terms of Korean-American population as of 2015 according to S&P Global Market Intelligence.
8
Table of Contents
Our selection of highly capable LPO managers has been crucial in entering new markets and being successful in generating new loans in those particular markets. We see the markets where we have existing LPOs as logical places to consider opening full service branches in the future, in addition to other metro areas throughout the U.S. with large Korean-American populations. We believe our ability to attract and retain banking professionals with significant experience in, and knowledge of the communities in our marketplace is key to our expansion efforts.
Core Deposit Funded Franchise. We believe our relationship-based approach to banking enhances our ability to source core deposits to fund organic growth. Our deposit base serves as a major driver of our operating results, as we primarily utilize our core deposits to fund loan growth. We believe we have a deposit base characterized by a high level of core deposits and a high proportion of noninterest-bearing deposit accounts. As of March 31, 2018, deposits accounted for 96.5% of our total liabilities. Core deposits, which we define as all deposits excluding time deposits exceeding $250,000 and internet or brokered deposits, constituted 78.7% of our total deposits and noninterest-bearing deposits accounted for 23.2% of total deposits at March 31, 2018.
Customer Service Focus with Relationship Banking. Competition among banks focused on the Korean-American community is strong. To distinguish ourselves, we focus on exemplary customer service and diverse product offerings to attract and retain clients. We strive to differentiate ourselves from our competitors by providing the best “relationship-based” services to small- and medium-sized businesses and their owners in our target markets. Our banking team is focused on face-to-face, highly personalized service, with the goal of creating customer relationships through multiple services and/or products. Our staff at our branches and LPOs is bilingual with strong Korean language skills to assist first generation Korean-American clients. In certain of our branches we also maintain staff that speaks Mandarin and Farsi to support our Chinese-American and Persian-American clientele. Our personalized service is augmented by the convenience of technological access services, such as remote deposit capture, mobile banking, internet banking and other services utilizing telephone, texting, fax and e-mail. However, we believe that technology will never substitute for personal interaction in dealing with customers. We believe that our community connections have enhanced the Bank’s reputation and name recognition well beyond what would be typical for a bank of our size and have allowed us to attract a loyal customer base that has facilitated the Bank’s strong organic growth and strong profitability metrics.
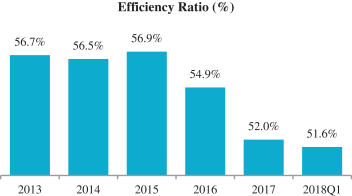
Scalable Operating Platform. We have invested meaningfully in our infrastructure, including hiring talented risk management professionals with experience in building and managing risk management programs. We believe those investments coupled with our risk management structure and conservative credit culture create a platform suitable for an organization larger than ours in anticipation of continued balance sheet and franchise growth. Even with these investments, we have maintained a relatively low efficiency ratio over the last five years as reflected in the chart below due to the expansion of our net interest income and gain on sale of loans.
9
Table of Contents
Our Strategy
Our board of directors and executive management team have focused on building a premier banking franchise serving the needs of small- and medium-sized business owners, professionals and individuals in our targeted market areas, particularly in Korean-American and other minority communities that is capable of yielding sustainable growth and long-term profitability that enhances shareholder value, which we intend to accomplish through:
Leverage Our Experience to Expand in Existing Markets. Our board of directors, executive management team and staff have an intimate knowledge of the Korean-American community and its culture and we have built a network of banking offices that we believe provides a foundation for further expanding our franchise. We currently service seven of the top ten Korean-American MSAs in the U.S. (based on total population) through our branches or LPOs. We intend to continue to enhance our customer base, increase loans and deposits and expand our overall market share, and we believe the markets in which we operate currently provide meaningful opportunities to grow organically. We plan to continue our organic growth by leveraging the extensive experience of our board of directors, executive management team and senior bankers, which give us insight and familiarity with our customers. We have a track record of attracting talented banking professionals from other financial institutions and believe that this initial public offering will enhance our ability to attract and retain this talent to further support our organic growth.
Increase Market Share. A key aspect of our operating strategy is to utilize the capital raised in this offering to further penetrate our existing markets, deepen our customer relationships and increase our market share. We believe that our existing network of banking offices, including our locations in New York and New Jersey, when coupled with our investments in infrastructure and continuity of management and culture, provides us the opportunities to continue to grow our loans and deposits organically.
Further Diversify our Loan Portfolio. We intend to continue to grow our loan portfolio including seeking to expand our C&I loans and residential property loans to further diversify our loan portfolio. Our C&I lending emphasizes commercial lines of credit, working capital loans secured by inventory, accounts receivable, fixed assets and real estate. We believe that there is an opportunity to increase our C&I lending to a greater percentage of our overall loans, through, among other things, an increased marketing emphasis on middle-market businesses in our existing markets. Further, we see C&I lending as a means of gaining new noninterest-bearing deposit accounts from our customers and in non-Asian ethnic communities located in the Los Angeles area.
The Bank is a “preferred SBA lender” and we have devoted an increasing amount of resources to SBA loans, including increasing our SBA staff and opening out-of-state LPOs in strategic locations. Our LPOs enable us to reach small businesses in a variety of geographic locations with a range of loan products to meet the individual business needs of the respective local markets. Our SBA loans provide a recurring revenue stream from the following three sources: gain on sale of loans sold; interest earned on retained loans; and servicing fees on loans sold.
We also intend to increase our residential property loans as a percentage of our loan portfolio. We believe that the range of lending solutions that we offer is more comprehensive than that of our competitors and all such loans are underwritten in-house. This retail lending is primarily made to Asian-Americans who are willing to provide higher down payment amounts and pay higher fees and interest rates in return for underwriting requirements more accommodative for self-employed borrowers and the acceptance of sometimes less established credit profiles.
Utilize Public Company Status. In addition to raising capital to support our growth as further discussed under “Use of Proceeds,” we believe becoming a public reporting company, while increasing our operating costs, will provide us with additional options and better pricing to manage our cost of capital that were previously
10
Table of Contents
unavailable to us when our shares were quoted on the OTC Pink Market. While we have not historically engaged in any merger and acquisition activity, the ability to issue publicly-traded stock as consideration may enable us to opportunistically approach potential transactions. However, as of the date of this prospectus, we do not have any immediate plans, arrangements or understandings relating to any material acquisitions. In addition, we believe the additional liquidity provided by being listed on the Nasdaq Global Market (“Nasdaq”) and being a public reporting company will enhance the equity component of our compensation programs, which will enable us to better attract and retain key employees in the competitive markets in which we operate.
Our Competition
We view the Korean-American banking market, including our Company, as comprised of 18 banks across the U.S. The table below provides more details on who we view as the current Korean-American banks as of March 31, 2018 against which we compete. The Company is currently the third largest U.S. based independent Korean-American bank.
| (Dollars in millions) Institution Name |
Headquarters |
U.S. Offices |
Total Assets |
Gross Loans |
Total Deposits |
Total Equity |
||||||||||||||||
| U.S.-Based Korean-American Banks: |
||||||||||||||||||||||
| Hope Bancorp, Inc. |
Los Angeles, CA | 63 | $ | 14,507 | $ | 11,326 | $ | 11,511 | $ | 1,945 | ||||||||||||
| Hanmi Financial Corporation |
Los Angeles, CA | 40 | 5,306 | 4,420 | 4,378 | 564 | ||||||||||||||||
| Pacific City Financial Corporation |
Los Angeles, CA | 13 | 1,579 | 1,229 | 1,382 | 147 | ||||||||||||||||
| MetroCity Bankshares, Inc. |
Doraville, GA | 16 | 1,303 | 1,131 | 1,098 | 144 | ||||||||||||||||
| CBB Bancorp, Inc. |
Los Angeles, CA | 8 | 1,070 | 833 | 931 | 118 | ||||||||||||||||
| OP Bancorp |
Los Angeles, CA | 8 | 957 | 812 | 818 | 117 | ||||||||||||||||
| First IC Corporation |
Doraville, GA | 7 | 411 | 338 | 333 | 65 | ||||||||||||||||
| Noah Bank |
Elkins Park, PA | 5 | 387 | 339 | 331 | 44 | ||||||||||||||||
| NewBank |
Flushing, NY | 5 | 344 | 225 | 292 | 45 | ||||||||||||||||
| NOA Bancorp, Inc. |
Duluth, GA | 5 | 336 | 254 | 282 | 41 | ||||||||||||||||
| US Metro Bank |
Garden Grove, CA | 4 | 330 | 228 | 277 | 50 | ||||||||||||||||
| New Millennium Bank |
Fort Lee, NJ | 6 | 317 | 261 | 271 | 32 | ||||||||||||||||
| Uniti Financial Corporation |
Buena Park, CA | 3 | 316 | 245 | 268 | 40 | ||||||||||||||||
| U&I Financial Corp. |
Lynnwood, WA | 4 | 282 | 191 | 239 | 40 | ||||||||||||||||
| Ohana Pacific Bank |
Honolulu, HI | 2 | 152 | 120 | 134 | 17 | ||||||||||||||||
| Foreign-Owned U.S. Subsidiaries: |
||||||||||||||||||||||
| Woori America Bank |
New York, NY | 19 | 1,834 | 1,437 | 1,558 | 255 | ||||||||||||||||
| Shinhan Bank America |
New York, NY | 16 | 1,403 | 1,242 | 1,216 | 162 | ||||||||||||||||
| KEB Hana Bank USA, N.A. |
Fort Lee, NJ | 3 | 204 | 137 | 158 | 45 | ||||||||||||||||
Source for bank specific data: S&P Global Market Intelligence. For each bank, data is as of the most recent available quarter.
In addition to these Korean-American banks, we also compete with other banks in our market areas. We believe we are well positioned to leverage our network of banking offices in the Korean-American markets in which we currently operate to continue to grow organically into select additional markets with significant Korean-American communities, and to further our reach into other minority communities.
11
Table of Contents
Risks Relating to Our Company
Our ability to implement our strategic plan and the success of our business are subject to numerous risks and uncertainties, which are discussed in the section titled “Risk Factors,” beginning on page 23. We urge you to carefully consider the information within “Risk Factors” and the other information in this prospectus before investing in our common stock.
Recent Developments
Preliminary Unaudited Selected Financial Results
Our unaudited consolidated financial statements as of or for the three and six months ended June 30, 2018 are not yet available. The following selected preliminary unaudited financial information regarding our performance and financial condition as of or for the three and six months ended June 30, 2018, is based solely on management’s estimates reflecting preliminary financial information, and remains subject to additional procedures and our consideration of subsequent events, particularly as it relates to material estimates and assumptions used in preparing management’s estimates, which we expect to complete following this offering. These additional procedures could result in material changes to our preliminary estimates during the course of our preparation of unaudited consolidated financial statements as of or for the three and six months ended June 30, 2018.
The preliminary information set forth below is not a complete presentation of our financial results for the three and six month periods ended June 30, 2018. The following estimates constitute forward-looking statements and are subject to risks and uncertainties, including those described under “Risk Factors” in this prospectus. In addition, our independent registered public accounting firm, has not completed review procedures with respect to these preliminary financial results. See “Risk Factors-Risks Related to Our Business” and “Cautionary Note Regarding Forward-Looking Statements.” The following information should be read together with “Management’s Discussion and Analysis of Financial Condition and Results of Operations” and our consolidated financial statements and notes thereto included elsewhere in this prospectus. In addition, you should not assume that our operating results for the three and six months ended June 30, 2018 will be indicative of our operating results for the entire year ending December 31, 2018. Any annualized figures are provided for illustrative purposes only and are not intended to be, and should not be construed as, forecasts or predictions of results for the year ending December 31, 2018.
| As of or For the Three Months Ended June 30, |
As of or For the Six Months Ended June 30, |
|||||||||||||||
| (Dollars in thousands, except share and per share data) | 2018 | 2017 | 2018 | 2017 | ||||||||||||
| Income statement data: |
||||||||||||||||
| Interest income |
$ | 20,344 | $ | 15,689 | $ | 38,972 | $ | 30,306 | ||||||||
| Interest expense |
4,462 | 2,305 | 7,796 | 4,452 | ||||||||||||
| Net interest income |
15,882 | 13,384 | 31,176 | 25,854 | ||||||||||||
| Provision (reversal) for loan losses |
425 | (274 | ) | 520 | (472 | ) | ||||||||||
| Net interest income after provision (reversal) for loan losses |
15,457 | 13,658 | 30,656 | 26,326 | ||||||||||||
| Noninterest income |
2,273 | 3,582 | 5,635 | 7,071 | ||||||||||||
| Noninterest expense |
10,940 | 8,796 | 20,571 | 17,317 | ||||||||||||
| Income before income tax expense |
6,790 | 8,444 | 15,720 | 16,080 | ||||||||||||
| Income tax expense (benefit) |
2,028 | 3,584 | 4,694 | 6,822 | ||||||||||||
| Net income |
4,762 | 4,860 | 11,026 | 9,258 | ||||||||||||
12
Table of Contents
| As of or For the Three Months Ended June 30, |
As of or For the Six Months Ended June 30, |
|||||||||||||||
| (Dollars in thousands, except share and per share data) | 2018 | 2017 | 2018 | 2017 | ||||||||||||
| Per share data (common stock): |
||||||||||||||||
| Basic earnings |
$ | 0.35 | $ | 0.36 | $ | 0.82 | $ | 0.69 | ||||||||
| Diluted earnings |
0.35 | 0.36 | 0.81 | 0.68 | ||||||||||||
| Dividends declared |
0.03 | 0.03 | 0.06 | 0.06 | ||||||||||||
| Book value(1) |
11.27 | 10.14 | 11.27 | 10.14 | ||||||||||||
| Weighted average shares outstanding |
||||||||||||||||
| Basic |
13,432,775 | 13,408,282 | 13,425,557 | 13,401,859 | ||||||||||||
| Diluted |
13,628,677 | 13,542,538 | 13,607,834 | 13,523,128 | ||||||||||||
| Shares outstanding at period end |
13,435,214 | 13,412,059 | 13,435,214 | 13,412,059 | ||||||||||||
| Performance metrics: |
||||||||||||||||
| Return on average assets(2) |
1.20 | % | 1.49 | % | 1.45 | % | 1.46 | % | ||||||||
| Yield on average interest-earning assets(2) |
5.23 | % | 4.94 | % | 5.25 | % | 4.90 | % | ||||||||
| Cost of average interest-bearing liabilities(2) |
1.60 | % | 1.08 | % | 1.48 | % | 1.06 | % | ||||||||
| Net interest margin(2) |
4.08 | % | 4.21 | % | 4.20 | % | 4.18 | % | ||||||||
| Efficiency ratio(3) |
60.26 | % | 51.84 | % | 55.88 | % | 52.60 | % | ||||||||
| (1) | Total common shareholders’ equity divided by shares outstanding at period end. |
| (2) | Annualized. |
| (3) | The efficiency ratio equals noninterest expense divided by the sum of net interest income and noninterest income. |
| As of | ||||||||
| (Dollars in thousands) | June 30, 2018 |
March 31, 2018 |
||||||
| Balance sheet data: |
||||||||
| Total assets |
$ | 1,619,169 | $ | 1,578,970 | ||||
| Loans held-for-sale |
20,331 | 6,182 | ||||||
| Loans, net of deferred loan costs (fees) |
1,254,856 | 1,223,272 | ||||||
| Allowance for loan losses |
(12,621 | ) | (12,371 | ) | ||||
| Noninterest-bearing deposits |
347,342 | 321,109 | ||||||
| Interest-bearing deposits |
1,079,903 | 1,060,816 | ||||||
| Total deposits |
1,427,245 | 1,381,925 | ||||||
| Total shareholders’ equity |
151,431 | 147,233 | ||||||
| Asset quality ratios: |
||||||||
| Nonperforming loans to gross loans(1) |
0.16 | % | 0.20 | % | ||||
| Nonperforming assets to total assets |
0.13 | % | 0.15 | % | ||||
| (1) | Gross loans exclude loans held-for-sale. |
We expect to report net income of approximately $4.8 million for the three months ended June 30, 2018 as compared to net income of $4.9 million for the three months ended June 30, 2017. The expected decrease in net income was driven primarily by:
| • | an increase in noninterest expense primarily due to additional legal and professional expense related to the preparation and filing of our S-1 registration statement with the SEC and listing our shares of common stock on the Nasdaq Global Market and an expansion of our business; |
13
Table of Contents
| • | a decrease in noninterest income primarily due a lower gain on sale of loans; and |
| • | an increase in provision for loan losses primarily due to a higher loan volume; |
partially offset by
| • | an increase in net interest income primarily due to a higher volume of interest-earning assets; and |
| • | a decrease in income tax expense primarily due to the enacted Tax Reform Act. |
We also expect to report net income of approximately $11.0 million for the six months ended June 30, 2018 as compared to net income of $9.3 million for the six months ended June 30, 2017. The expected increase in net income was driven primarily by:
| • | an increase in net interest income primarily due to a higher volume of interest-earning assets; and |
| • | a decrease in income tax expense primarily due to the enacted Tax Reform Act; |
partially offset by
| • | an increase in noninterest expense primarily due to additional legal and professional expense related to the preparation and filing of our S-1 registration statement with the SEC and listing our shares of common stock on the Nasdaq Global Market and an expansion of our business; |
| • | a decrease in noninterest income primarily due to a lower gain on sale of loans; and |
| • | an increase in provision for loan losses primarily due to a higher loan volume. |
At June 30, 2018, we had unsettled SBA loan sales commitments of approximately $16.7 million all of which were included in loans held-for-sale at June 30, 2018 and subsequently settled during early July 2018, which was the primary driver of our lower gain on sale of loans for the three and six months ended June 30, 2018 compared to the same periods in 2017. During the three months ended June 30, 2018, the SBA requested us to reimburse for a SBA loan guarantee previously paid by the SBA on a loan we originated in 2007 that subsequently defaulted, which ultimately was determined to be ineligible for SBA assistance. We incurred a one-time expense of $577 thousand for this reimbursement and a write-off of certain receivables related to collection activities of the loan.
We expect the estimated net income described above to result in an annualized return on average assets of approximately 1.20% for the three months ended June 30, 2018. We also expect the estimated net income described above to result in an annualized return on average assets of approximately 1.45% for the six months ended June 30, 2018. We expect to report diluted earnings per share of $0.35 for the three months ended June 30, 2018, as compared to $0.36 for the three month period ended June 30, 2017. We also expect to report diluted earnings per share of $0.81 for the six months ended June 30, 2018, as compared to $0.68 for the six month period ended June 30, 2017.
We expect to report an annualized net interest margin of 4.08% for the three month period ended June 30, 2018 as compared to 4.21% for the three month period ended June 30, 2017. The expected decrease in net interest margin was driven primarily by:
| • | increases in cost and average balance of interest-bearing liabilities; partially offset by |
| • | increases in yield and average balance of interest-earning assets. |
14
Table of Contents
We also expect to report an annualized net interest margin of 4.20% for the six month period ended June 30, 2018 as compared to 4.18% for the six month period ended June 30, 2017. The expected increase in net interest margin was driven primarily by:
| • | increases in yield and average balance of interest-earning assets; partially offset by |
| • | increases in cost and average balance of interest-bearing liabilities. |
Our annualized cost of interest-bearing liabilities increased to 1.60% and 1.48%, respectively, for the three and six months ended June 30, 2018 compared to 1.08% and 1.06%, respectively, for the same periods in 2017. The increases were largely due to increases in our average rate on interest-bearing deposits resulting from the current rising interest rate environment and competition for deposits in our target markets.
We expect to report that, as of June 30, 2018, total loans were $1.28 billion, representing an increase of $45.7 million, or 3.7%, from March 31, 2018. We expect to report that total deposits were $1.43 billion as of June 30, 2018, representing an increase of $45.3 million, or 3.3% from March 31, 2018.
We expect to report total common shareholders’ equity of $151.4 million as of June 30, 2018 compared to $147.2 million as of March 31, 2018. Additionally, we expect to report book value per common share (which we calculate as total shareholders’ equity at the end of the relevant period divided by the outstanding number of our common shares) of approximately $11.27 as of June 30, 2018, as compared to $10.97 as of March 31, 2018. We did not have any intangible equity component at June 30, 2018 or March 31, 2018. The estimated increase in our book value per common share was primarily due to:
| • | our net income generated for the three months ended June 30, 2018, which was partially offset by |
| • | higher net unrealized losses on securities available-for-sale at June 30, 2018. |
We expect to report nonperforming assets to total assets of approximately 0.13% at June 30, 2018 compared to 0.15% reported at March 31, 2018. We expect to report nonperforming loans to gross loans of approximately 0.16% at June 30, 2018 compared to 0.20% reported at March 31, 2018. We expect to report net charge-offs to average loans (excluding loans held-for-sale) of approximately 0.06% for the three months ended June 30, 2018 as compared to 0.00% for the three month period ended June 30, 2017. We also expect to report net charge-offs to average loans (excluding loans held-for-sale) of approximately 0.02% for the six months ended June 30, 2018 as compared to (0.03)% for the six month period ended June 30, 2017.
Declaration of Third Quarter Dividend
On July 17, 2018, our board of directors declared a dividend of $0.03 per common share that will be payable to shareholders of record on August 31, 2018, with an expected payment date of September 14, 2018. Based on 13,435,214 shares of our common stock issued and outstanding as of June 30, 2018, and assuming the issuance of [*] shares of our common stock in this offering (which includes [*] shares assuming the underwriters exercise their purchase option in full) prior to the record date for the dividend of August 31, 2018, the aggregate amount of the dividend payable to our shareholders of record would be [$ ].
Corporate Information
Our principal executive offices are located at 3701 Wilshire Boulevard, Suite 900, Los Angeles, California 90010, and our telephone number at that address is (213) 210-2000. Our website address is www.paccitybank.com. The information contained on our website is not a part of, or incorporated by reference into, this prospectus.
15
Table of Contents
| Common stock offered by us |
[*] shares of our common stock, no par value per share. | |
| Underwriters’ purchase option |
[*] shares from us. | |
| Common stock outstanding after completion of this offering |
[*] shares (or [*] shares if the underwriters exercise their purchase option in full). | |
| Use of proceeds |
Assuming an initial public offering price of $[*] per share, which is the midpoint of the price range set forth on the cover of this prospectus, we estimate that the net proceeds to us from this offering, after deducting underwriting discounts but before payment of estimated offering expenses payable by us, will be approximately $[*] million (or approximately $[*] million if the underwriters exercise their option to purchase additional shares in full). We intend to contribute $[*] million of the net proceeds that we receive from this offering to the Bank and to use the remainder for general corporate purposes, which could include future organic growth and other strategic initiatives. See “Use of Proceeds” on page 55 of this prospectus. | |
| Dividends |
Holders of our common stock are only entitled to receive dividends when, as and if declared by our board of directors out of funds legally available for dividends. It has been our policy to pay quarterly dividends to holders of our common stock, and we currently intend to generally maintain our current dividend levels of $[*]. Our dividend policy and practice may change in the future, however, and our board of directors may change or eliminate the payment of future dividends at its discretion, without notice to our shareholders. Any future determination to pay dividends to holders of our common stock will depend on our results of operations, financial condition, capital requirements, banking regulations, payment of dividends on our preferred stock (if any), contractual restrictions and any other factors that our board of directors may deem relevant. See “Market Price of Common Stock—Dividend Policy” on page 59 of this prospectus. | |
| Directed Share Program |
The underwriters have reserved for sale at the initial public offering price up to [*]% of the shares of our common stock pursuant to this prospectus for sale to certain of our employees, executive officers, directors, business associates and related persons who have expressed an interest in purchasing our common stock in this offering. | |
16
Table of Contents
| We do not know if these persons will choose to purchase all or any portion of the reserved shares, but any purchases they do make will reduce the number of shares available to the general public. See “Underwriting” on page 167 of this prospectus. | ||
| Regulatory ownership restrictions |
We are a bank holding company. A holder of shares of common stock (or group of holders acting in concert) that (i) directly or indirectly owns, controls or has the power to vote 5% or more (if the holder is an entity) or 10% or more (for any other holders) of any class of voting securities of the Company, (ii) directly or indirectly owns, controls or has the power to vote 25% or more of the total equity of the Company, or (iii) is otherwise deemed to “control” the Company under applicable regulatory standards, may be subject to important restrictions and notice or approval requirements. For a further discussion of regulatory ownership restrictions, see “Supervision and Regulation” on page 123 of this prospectus. | |
| Risk factors |
Investing in shares of our common stock involves a high degree of risk. See “Risk Factors” beginning on page 23 for a discussion of certain factors you should consider carefully before deciding to invest. | |
| Nasdaq symbol |
Our common stock is currently quoted on the OTC Pink Market under the trading symbol “PFCF.” We have applied to list our common stock on the Nasdaq Global Market under the trading symbol “PCB.” Assuming that our common stock is listed for trading on the Nasdaq Global Market, the quoting of our shares on the OTC Pink Sheets will be discontinued on or prior to the completion of this offering. | |
Unless otherwise indicated, all information in this prospectus:
| • | relating to the number of shares of common stock to be outstanding immediately after the completion of this offering is based on 13,424,777 shares outstanding as of March 31, 2018, and excludes [*] shares of common stock subject to issuance upon exercise of outstanding stock options and 633,450 shares of common stock available for future awards under our 2013 Equity Based Compensation Plan; |
| • | assumes an initial public offering of $[*] per share, which is the midpoint of the price range set forth on the cover page of this prospectus; |
| • | assumes no exercise by the underwriters of their option to purchase additional shares of our common stock; and |
| • | assumes that all shares reserved under the Directed Share Program are purchased and does not attribute to any director, executive officer or principal shareholder any purchaser of shares in the offering, including through the Directed Share Program described in “Underwriting—Directed Share Program” on page 171 of this prospectus. |
17
Table of Contents
SELECTED HISTORICAL CONSOLIDATED FINANCIAL DATA
The following table sets forth our selected historical consolidated financial data as of the dates and for the periods shown. The selected historical balance sheet data as of December 31, 2017 and 2016 and the selected historical income statement data for the years ended December 31, 2017 and 2016 have been derived from our audited consolidated financial statements included elsewhere in this prospectus, and includes all normal and recurring adjustments that we consider necessary for a fair presentation. We have derived the selected historical consolidated financial data as of or for the years ended December 31, 2015, 2014 and 2013 from our audited consolidated financial statements not included in this prospectus. The selected historical balance sheet data as of March 31, 2018 and 2017 and the selected historical income statement data for the three months ended March 31, 2018 and 2017 have been derived from our unaudited interim condensed consolidated financial statements included elsewhere in this prospectus, and includes all normal and recurring adjustments that we consider necessary for a fair presentation.
The historical consolidated financial information presented below contains certain financial measures that are not presented in accordance with U.S. GAAP and which have not been audited. See “Non-GAAP Financial Measures.”
You should read the following financial data in conjunction with the other information contained in this prospectus, including “Risk Factors,” “Management’s Discussion and Analysis of Financial Condition and Results of Operations” and in the consolidated financial statements and related notes included elsewhere in this prospectus. The selected historical consolidated financial data may not be indicative of possible future performance and the results of operations for the three months ended March 31, 2018 is not necessarily indicative of the results that may be expected for the year ending December 31, 2018.
| (Dollars in thousands, except per share data) |
As of or For the Three Months Ended March 31, |
As of or For the Year Ended December 31, | ||||||||||||||||||||||||||
| Balance Sheet |
2018 | 2017 | 2017 | 2016 | 2015 | 2014 | 2013 | |||||||||||||||||||||
| Assets: |
||||||||||||||||||||||||||||
| Cash and cash equivalents |
$ | 181,553 | $ | 88,594 | $ | 73,658 | $ | 69,951 | $ | 76,950 | $ | 67,536 | $ | 71,519 | ||||||||||||||
| Securities available-for-sale, at fair value |
125,940 | 90,370 | 129,689 | 82,838 | 84,847 | 49,645 | 56,457 | |||||||||||||||||||||
| Securities held-to-maturity, at amortized cost |
20,826 | 19,023 | 21,070 | 17,584 | 17,338 | 12,941 | 9,576 | |||||||||||||||||||||
|
|
|
|
|
|
|
|
|
|
|
|
|
|
|
|||||||||||||||
| Total investment securities |
146,766 | 109,393 | 150,759 | 100,422 | 102,185 | 62,586 | 66,033 | |||||||||||||||||||||
| Loans held-for-sale |
6,182 | 12,847 | 5,297 | 2,150 | 1,941 | 17,521 | 3,356 | |||||||||||||||||||||
| Loans, net of deferred loans costs (fees) |
1,223,272 | 1,054,194 | 1,189,999 | 1,031,112 | 844,369 | 732,520 | 603,121 | |||||||||||||||||||||
| Less: allowance for loan losses |
(12,371 | ) | (11,315 | ) | (12,224 | ) | (11,320 | ) | (9,345 | ) | (9,432 | ) | (12,606 | ) | ||||||||||||||
|
|
|
|
|
|
|
|
|
|
|
|
|
|
|
|||||||||||||||
| Net loans |
1,210,901 | 1,042,879 | 1,177,775 | 1,019,792 | 835,024 | 723,088 | 590,515 | |||||||||||||||||||||
| Premises and equipment, net |
5,069 | 4,370 | 4,723 | 4,563 | 3,613 | 2,032 | 2,083 | |||||||||||||||||||||
| Other real estate owned, net |
— | 505 | 99 | 506 | — | — | 891 | |||||||||||||||||||||
| Servicing assets |
8,890 | 8,637 | 8,973 | 8,302 | 7,405 | 6,817 | 5,793 | |||||||||||||||||||||
| Accrued interest receivables |
4,303 | 3,264 | 4,251 | 3,150 | 2,590 | 2,085 | 1,850 | |||||||||||||||||||||
| Federal Home Loan Bank stock |
6,419 | 5,516 | 6,419 | 5,516 | 4,752 | 3,866 | 3,000 | |||||||||||||||||||||
| Deferred tax assets, net |
4,239 | 5,536 | 3,847 | 5,254 | 5,195 | 6,534 | 8,474 | |||||||||||||||||||||
| Other assets |
4,648 | 4,891 | 6,198 | 7,036 | 2,862 | 1,895 | 2,396 | |||||||||||||||||||||
|
|
|
|
|
|
|
|
|
|
|
|
|
|
|
|||||||||||||||
| Total assets |
$ | 1,578,970 | $ | 1,286,432 | $ | 1,441,999 | $ | 1,226,642 | $ | 1,042,517 | $ | 893,960 | $ | 755,910 | ||||||||||||||
|
|
|
|
|
|
|
|
|
|
|
|
|
|
|
|||||||||||||||
| Liabilities: |
||||||||||||||||||||||||||||
| Noninterest-bearing deposits |
321,109 | 298,563 | 319,026 | 274,003 | 267,934 | 202,400 | 162,830 | |||||||||||||||||||||
| Interest-bearing deposits |
1,060,816 | 847,699 | 932,264 | 817,809 | 671,505 | 600,428 | 511,208 | |||||||||||||||||||||
|
|
|
|
|
|
|
|
|
|
|
|
|
|
|
|||||||||||||||
| Total deposits |
1,381,925 | 1,146,262 | 1,251,290 | 1,091,812 | 939,439 | 802,828 | 674,038 | |||||||||||||||||||||
| Borrowings from Federal Home Loan Bank |
40,000 | — | 40,000 | — | — | — | — | |||||||||||||||||||||
| Subordinated debentures |
— | — | — | — | — | — | 853 | |||||||||||||||||||||
| Other liabilities |
9,812 | 8,863 | 8,525 | 7,823 | 5,038 | 4,707 | 4,473 | |||||||||||||||||||||
|
|
|
|
|
|
|
|
|
|
|
|
|
|
|
|||||||||||||||
| Total liabilities |
1,431,737 | 1,155,125 | 1,299,815 | 1,099,635 | 944,477 | 807,535 | 679,364 | |||||||||||||||||||||
|
|
|
|
|
|
|
|
|
|
|
|
|
|
|
|||||||||||||||
18
Table of Contents
| (Dollars in thousands, except per share data) |
As of or For the Three Months Ended March 31, |
As of or For the Year Ended December 31, | ||||||||||||||||||||||||||
| Balance Sheet |
2018 | 2017 | 2017 | 2016 | 2015 | 2014 | 2013 | |||||||||||||||||||||
| Shareholders’ Equity: |
||||||||||||||||||||||||||||
| Preferred stock and warrants |
— | — | — | — | — | — | 8,354 | |||||||||||||||||||||
| Common stock |
125,511 | 125,270 | 125,430 | 125,094 | 96,074 | 84,229 | 68,702 | |||||||||||||||||||||
| Additional paid in capital |
3,072 | 2,502 | 2,941 | 2,444 | 2,362 | 2,420 | 2,283 | |||||||||||||||||||||
| Retained earnings (deficit) |
20,898 | 3,996 | 15,036 | — | — | — | (1,968 | ) | ||||||||||||||||||||
| Accumulated other comprehensive loss |
(2,248 | ) | (461 | ) | (1,223 | ) | (531 | ) | (396 | ) | (224 | ) | (825 | ) | ||||||||||||||
|
|
|
|
|
|
|
|
|
|
|
|
|
|
|
|||||||||||||||
| Total shareholders’ equity |
147,233 | 131,307 | 142,184 | 127,007 | 98,040 | 86,425 | 76,546 | |||||||||||||||||||||
|
|
|
|
|
|
|
|
|
|
|
|
|
|
|
|||||||||||||||
| Total liabilities and shareholders’ equity |
$ | 1,578,970 | $ | 1,286,432 | $ | 1,441,999 | $ | 1,226,642 | $ | 1,042,517 | $ | 893,960 | $ | 755,910 | ||||||||||||||
|
|
|
|
|
|
|
|
|
|
|
|
|
|
|
|||||||||||||||
| Selected balance sheet data: |
||||||||||||||||||||||||||||
| Loans 30-89 days past due and still accruing |
$ | 992 | $ | 4,387 | $ | 1,341 | $ | 2,094 | $ | 456 | $ | 1,279 | $ | 979 | ||||||||||||||
| Loans 30-89 days past due and still accruing to gross loans |
0.08 | % | 0.42 | % | 0.11 | % | 0.20 | % | 0.05 | % | 0.17 | % | 0.16 | % | ||||||||||||||
| Nonperforming loans(1) |
$ | 2,397 | $ | 1,700 | $ | 3,234 | $ | 1,848 | $ | 2,372 | $ | 6,452 | $ | 8,859 | ||||||||||||||
| Nonperforming loans to gross loans |
0.20 | % | 0.16 | % | 0.27 | % | 0.18 | % | 0.28 | % | 0.88 | % | 1.47 | % | ||||||||||||||
| Nonperforming assets(2) |
$ | 2,397 | $ | 2,205 | $ | 3,333 | $ | 2,354 | $ | 2,372 | $ | 6,452 | $ | 9,750 | ||||||||||||||
| Nonperforming assets to total assets |
0.15 | % | 0.17 | % | 0.23 | % | 0.19 | % | 0.23 | % | 0.72 | % | 1.29 | % | ||||||||||||||
| Allowance for loan losses to total loans |
1.01 | % | 1.07 | % | 1.03 | % | 1.10 | % | 1.11 | % | 1.29 | % | 2.09 | % | ||||||||||||||
| Allowance for loans losses to nonperforming loans |
516.10 | % | 665.59 | % | 377.98 | % | 612.55 | % | 393.97 | % | 146.19 | % | 142.30 | % | ||||||||||||||
| Net charge-offs to average loans |
-0.02 | % | -0.07 | % | 0.08 | % | 0.03 | % | 0.06 | % | 0.31 | % | 0.49 | % | ||||||||||||||
| Selected income statement data: |
||||||||||||||||||||||||||||
| Interest and fees on loans |
$ | 17,440 | $ | 13,877 | $ | 61,516 | $ | 50,058 | $ | 41,162 | $ | 35,653 | $ | 30,211 | ||||||||||||||
| Interest on investment securities |
848 | 508 | 2,614 | 1,741 | 1,420 | 1,180 | 932 | |||||||||||||||||||||
| Interest on other interest-earning assets |
340 | 232 | 1,137 | 796 | 689 | 347 | 203 | |||||||||||||||||||||
| Interest expense |
3,334 | 2,147 | 10,097 | 7,014 | 6,231 | 5,059 | 4,426 | |||||||||||||||||||||
|
|
|
|
|
|
|
|
|
|
|
|
|
|
|
|||||||||||||||
| Net interest income |
15,294 | 12,470 | 55,170 | 45,581 | 37,040 | 32,121 | 26,920 | |||||||||||||||||||||
| Provision (reversal) for loan losses |
95 | (198 | ) | 1,827 | 2,283 | 412 | (1,097 | ) | 707 | |||||||||||||||||||
|
|
|
|
|
|
|
|
|
|
|
|
|
|
|
|||||||||||||||
| Net interest income after provision (reversal) for loan losses |
15,199 | 12,668 | 53,343 | 43,298 | 36,628 | 33,218 | 26,213 | |||||||||||||||||||||
| Noninterest income |
3,362 | 3,489 | 13,894 | 13,619 | 12,779 | 12,232 | 11,319 | |||||||||||||||||||||
| Noninterest expense |
9,631 | 8,521 | 35,895 | 32,514 | 28,320 | 25,069 | 21,698 | |||||||||||||||||||||
|
|
|
|
|
|
|
|
|
|
|
|
|
|
|
|||||||||||||||
| Income before income tax expense |
8,930 | 7,636 | 31,342 | 24,403 | 21,087 | 20,381 | 15,834 | |||||||||||||||||||||
| Income tax expense (benefit) |
2,666 | 3,238 | 14,939 | 10,401 | 8,901 | 8,562 | (5,549 | ) | ||||||||||||||||||||
|
|
|
|
|
|
|
|
|
|
|
|
|
|
|
|||||||||||||||
| Net income |
6,264 | 4,398 | 16,403 | 14,002 | 12,186 | 11,819 | 21,383 | |||||||||||||||||||||
| Preferred stock dividends and discount accretion |
— | — | — | — | — | (336 | ) | (892 | ) | |||||||||||||||||||
|
|
|
|
|
|
|
|
|
|
|
|
|
|
|
|||||||||||||||
| Net income available to common shareholders |
$ | 6,264 | $ | 4,398 | $ | 16,403 | $ | 14,002 | $ | 12,186 | $ | 11,483 | $ | 20,491 | ||||||||||||||
|
|
|
|
|
|
|
|
|
|
|
|
|
|
|
|||||||||||||||
| Per share data (common stock) |
||||||||||||||||||||||||||||
| Basic earnings |
$ | 0.47 | $ | 0.33 | $ | 1.22 | $ | 1.12 | $ | 1.03 | $ | 1.00 | $ | 1.84 | ||||||||||||||
| Diluted earnings |
$ | 0.46 | $ | 0.33 | $ | 1.21 | $ | 1.11 | $ | 1.02 | $ | 1.00 | $ | 1.84 | ||||||||||||||
| Dividends declared |
$ | 0.03 | $ | 0.03 | $ | 0.12 | $ | 0.12 | $ | 0.09 | $ | — | $ | — | ||||||||||||||
| Book value(3) |
$ | 10.97 | $ | 9.79 | $ | 10.60 | $ | 9.48 | $ | 8.26 | $ | 7.31 | $ | 6.87 | ||||||||||||||
| Tangible book value(4) |
$ | 10.97 | $ | 9.79 | $ | 10.60 | $ | 9.48 | $ | 8.26 | $ | 7.31 | $ | 6.12 | ||||||||||||||
| Weighted average shares outstanding: |
||||||||||||||||||||||||||||
| Basic |
13,418,259 | 13,395,363 | 13,408,030 | 12,532,807 | 11,840,528 | 11,427,639 | 11,144,464 | |||||||||||||||||||||
| Diluted |
13,586,759 | 13,503,502 | 13,540,293 | 12,607,990 | 11,929,503 | 11,477,424 | 11,157,254 | |||||||||||||||||||||
| Shares outstanding at period end |
13,424,777 | 13,406,552 | 13,417,899 | 13,391,222 | 11,865,145 | 11,816,343 | 11,144,464 | |||||||||||||||||||||
19
Table of Contents
| (Dollars in thousands, except per share data) |
As of or For the Three Months Ended March 31, |
As of or For the Year Ended December 31, | ||||||||||||||||||||||||||
| 2018 | 2017 | 2017 | 2016 | 2015 | 2014 | 2013 | ||||||||||||||||||||||
| Adjusted earnings metrics:(4),(5) |
||||||||||||||||||||||||||||
| Adjusted earnings |
$ | 6,264 | $ | 4,398 | $ | 18,025 | $ | 14,002 | $ | 12,186 | $ | 11,819 | $ | 9,873 | ||||||||||||||
| Adjusted basic earnings per share |
$ | 0.47 | $ | 0.33 | $ | 1.34 | $ | 1.12 | $ | 1.03 | $ | 1.00 | $ | 0.81 | ||||||||||||||
| Adjusted diluted earnings per share |
$ | 0.46 | $ | 0.33 | $ | 1.33 | $ | 1.11 | $ | 1.02 | $ | 1.00 | $ | 0.80 | ||||||||||||||
| Adjusted return on average assets(9) |
1.73 | % | 1.42 | % | 1.35 | % | 1.25 | % | 1.25 | % | 1.46 | % | 1.45 | % | ||||||||||||||
| Adjusted return on average tangible common equity(9) |
17.50 | % | 13.77 | % | 13.18 | % | 12.47 | % | 13.10 | % | 15.00 | % | 15.77 | % | ||||||||||||||
| Performance metrics: |
||||||||||||||||||||||||||||
| Return on average assets(9) |
1.73 | % | 1.42 | % | 1.22 | % | 1.25 | % | 1.25 | % | 1.46 | % | 3.14 | % | ||||||||||||||
| Return on average shareholders’ equity(9) |
17.50 | % | 13.77 | % | 12.00 | % | 12.47 | % | 13.10 | % | 14.67 | % | 29.37 | % | ||||||||||||||
| Return on average tangible common equity(4), (9) |
17.50 | % | 13.77 | % | 12.00 | % | 12.47 | % | 13.10 | % | 15.00 | % | 35.99 | % | ||||||||||||||
| Yield on average interest-earning assets(9) |
5.27 | % | 4.86 | % | 4.99 | % | 4.82 | % | 4.54 | % | 4.73 | % | 4.72 | % | ||||||||||||||
| Cost of average interest-bearing liabilities(9) |
1.35 | % | 1.04 | % | 1.14 | % | 0.96 | % | 0.95 | % | 0.93 | % | 0.99 | % | ||||||||||||||
| Net interest spread |
3.92 | % | 3.82 | % | 3.85 | % | 3.86 | % | 3.59 | % | 3.80 | % | 3.73 | % | ||||||||||||||
| Net interest margin(9) |
4.33 | % | 4.15 | % | 4.22 | % | 4.18 | % | 3.89 | % | 4.09 | % | 4.05 | % | ||||||||||||||
| Efficiency ratio(6) |
51.62 | % | 53.39 | % | 51.97 | % | 54.92 | % | 56.85 | % | 56.52 | % | 56.74 | % | ||||||||||||||
| Common stock dividend payout ratio(7) |
6.38 | % | 9.09 | % | 9.84 | % | 10.71 | % | 8.74 | % | 0.00 | % | 0.00 | % | ||||||||||||||
| Total loan (including loans held for sale) to total deposit ratio |
88.97 | % | 93.09 | % | 95.53 | % | 94.64 | % | 90.09 | % | 93.42 | % | 89.98 | % | ||||||||||||||
| Core deposits to total deposits |
78.79 | % | 79.30 | % | 77.43 | % | 79.52 | % | 80.68 | % | 79.03 | % | 77.55 | % | ||||||||||||||
| Regulatory and other capital ratios—Pacific City Financial Corporation: |
||||||||||||||||||||||||||||
| Tangible common equity to tangible assets(4) |
9.3 | % | 10.2 | % | 9.9 | % | 10.4 | % | 9.4 | % | 9.7 | % | 9.0 | % | ||||||||||||||
| Tier 1 leverage ratio |
10.1 | % | 10.4 | % | 10.0 | % | 10.5 | % | 9.4 | % | 9.9 | % | 10.4 | % | ||||||||||||||
| Tier 1 common capital to risk-weighted assets(8) |
12.3 | % | 12.6 | % | 12.2 | % | 12.5 | % | 12.3 | % | NA | NA | ||||||||||||||||
| Tier 1 capital to risk-weighted assets |
12.3 | % | 12.6 | % | 12.2 | % | 12.5 | % | 12.3 | % | 12.4 | % | 13.3 | % | ||||||||||||||
| Total capital to risk-weighted assets |
13.4 | % | 13.7 | % | 13.2 | % | 13.6 | % | 13.4 | % | 13.7 | % | 14.5 | % | ||||||||||||||
| (1) | Nonperforming loans include nonaccrual loans and loans past due 90 days or more and still accruing. |
| (2) | Nonperforming assets include nonperforming loans and other real estate owned. |
| (3) | For purpose of computing book value per common share, book value equals total common shareholders’ equity. |
| (4) | Non-GAAP financial measures. See “Non-GAAP Financial Measures” for a reconciliation of these measures to their most comparable GAAP measures. |
| (5) | Adjusted to exclude nonrecurring items. |
| (6) | The efficiency ratio equals noninterest expenses divided by the sum of net interest income and noninterest income. |
| (7) | The common stock dividend payout ratio equals dividends per share divided by basic earnings per share. See “Market Price of Common Stock—Dividend Policy”. |
| (8) | Tier 1 common equity to risk-weighted assets ratio became required on January 1, 2015. |
| (9) | Annualized. |
20
Table of Contents
Some of the financial measures included in this prospectus are not measures of financial performance recognized by GAAP. These non-GAAP financial measures include “tangible common equity to tangible assets,” “tangible book value per share,” “return on average tangible common equity,” “adjusted earnings,” “adjusted basic earnings per share,” “adjusted diluted earnings per share,” “adjusted return on average assets,” and “adjusted return on average tangible common equity.” Our management uses these non-GAAP financial measures in its analysis of our performance. Non-GAAP financial measures do not include operating and other statistical measures and ratios as statistical measures calculated using exclusively one or both of (i) financial measures calculated in accordance with GAAP and (ii) operating measures or other measures that are not non-GAAP financial measures. The non-GAAP financial measures that we discuss in this prospectus should not be considered in isolation or as a substitute for the most directly comparable or other financial measures calculated in accordance with GAAP. Moreover, the manner in which we calculate these non-GAAP financial measures may differ from that of other companies reporting measures with similar names, and, therefore, may not be comparable to our non-GAAP financial measures.
Tangible Common Equity to Tangible Assets Ratio and Tangible Book Value Per Share. The tangible common equity to tangible assets ratio and tangible book value per share are non-GAAP measures generally used by financial analysts and investment bankers to evaluate capital adequacy. We calculate: (i) tangible common equity as total shareholders’ equity less preferred stock; (ii) tangible assets as total assets as the Company did not have goodwill or other intangible assets during the presented periods; and (iii) tangible book value per share as tangible common equity divided by shares of outstanding common stock.
Our management, banking regulators, many financial analysts and other investors use these measures in conjunction with more traditional bank capital ratios to compare the capital adequacy of banking organizations with significant amounts of goodwill or other intangible assets, which typically stem from the use of the purchase accounting method of accounting for mergers and acquisitions. Tangible common equity, tangible assets, tangible book value per share and related measures should not be considered in isolation or as a substitute for total shareholders’ equity, total assets, book value per share or any other measure calculated in accordance with GAAP. Moreover, the manner in which we calculate tangible common equity, tangible assets, tangible book value per share and any other related measures may differ from that of other companies reporting measures with similar names. The following table reconciles shareholders’ equity (on a GAAP basis) to tangible common equity and total assets (on a GAAP basis) to tangible assets, and calculates our tangible book value per share:
| March 31, | December 31, | |||||||||||||||||||||||||||
| (Dollars in thousands, except per share data) |
2018 | 2017 | 2017 | 2016 | 2015 | 2014 | 2013 | |||||||||||||||||||||
| Total shareholders’ equity |
$ | 147,233 | $ | 131,307 | $ | 142,184 | $ | 127,007 | $ | 98,040 | $ | 86,425 | $ | 76,546 | ||||||||||||||
| Preferred stock(1) |
— | — | — | — | — | — | (8,354 | ) | ||||||||||||||||||||
|
|
|
|
|
|
|
|
|
|
|
|
|
|
|
|||||||||||||||
| Tangible common equity |
$ | 147,233 | $ | 131,307 | $ | 142,184 | $ | 127,007 | $ | 98,040 | $ | 86,425 | $ | 68,192 | ||||||||||||||
|
|
|
|
|
|
|
|
|
|
|
|
|
|
|
|||||||||||||||
| Total assets |
$ | 1,578,970 | $ | 1,286,432 | $ | 1,441,999 | $ | 1,226,642 | $ | 1,042,517 | $ | 893,960 | $ | 755,910 | ||||||||||||||
| Adjustments |
— | — | — | — | — | — | — | |||||||||||||||||||||
|
|
|
|
|
|
|
|
|
|
|
|
|
|
|
|||||||||||||||
| Tangible asset: |
$ | 1,578,970 | $ | 1,286,432 | $ | 1,441,999 | $ | 1,226,642 | $ | 1,042,517 | $ | 893,960 | $ | 755,910 | ||||||||||||||
|
|
|
|
|
|
|
|
|
|
|
|
|
|
|
|||||||||||||||
| Total shareholders’ equity to total assets |
9.32 | % | 10.21 | % | 9.86 | % | 10.35 | % | 9.40 | % | 9.67 | % | 10.13 | % | ||||||||||||||
| Tangible common equity to tangible assets ratio |
9.32 | % | 10.21 | % | 9.86 | % | 10.35 | % | 9.40 | % | 9.67 | % | 9.02 | % | ||||||||||||||
| Common shares outstanding |
13,424,777 | 13,406,552 | 13,417,899 | 13,391,222 | 11,865,145 | 11,816,343 | 11,144,464 | |||||||||||||||||||||
| Book value per share |
$ | 10.97 | $ | 9.79 | $ | 10.60 | $ | 9.48 | $ | 8.26 | $ | 7.31 | $ | 6.87 | ||||||||||||||
| Tangible book value per share |
$ | 10.97 | $ | 9.79 | $ | 10.60 | $ | 9.48 | $ | 8.26 | $ | 7.31 | $ | 6.12 | ||||||||||||||
| (1) | At December 31, 2013, the Company had $8.4 million of preferred stock and warrants held by the U.S. Department of Treasury (“Treasury”) through the Troubled Asset Relief Program’s Capital Purchase Program, which were fully redeemed during the year ended December 31, 2014. |
21
Table of Contents
Return on Average Tangible Common Equity. Management measures return on average tangible common equity (“ROATCE”) because management believes it is useful to assess the Company’s capital strength and business performance. Average tangible equity excludes average preferred stock, and is reviewed by banking and financial institution regulators when assessing a financial institution’s capital adequacy.
Adjusted Earnings Metrics. Management uses adjusted earnings to assess the performance of our core business and the strength of our capital position. Adjusted earning is calculated by subtracting our deferred tax asset (“DTA”) recapture for the year ended December 31, 2013 and DTA impairment from tax rate change for the year ended December 31, 2017 from net income for those periods. We believe that this non-GAAP financial measure provides meaningful additional information to assist investors in evaluating our operating results.
These non-GAAP financial measures should not be considered a substitute for operating results determined in accordance with GAAP and may not be comparable to other similarly titled measures used by other companies. The following table reconciles ROATCE, adjusted ROATCE, adjusted diluted earnings per share, and adjusted return on average assets to their most comparable GAAP measures:
| Three Months Ended March 31, |
Year Ended December 31, | |||||||||||||||||||||||||||
| (Dollars in thousands, except per share data) |
2018 | 2017 | 2017 | 2016 | 2015 | 2014 | 2013 | |||||||||||||||||||||
| Net income[A] |
$ | 6,264 | $ | 4,398 | $ | 16,403 | $ | 14,002 | $ | 12,186 | $ | 11,819 | $ | 21,383 | ||||||||||||||
| Preferred stock dividend |
— | — | — | — | — | (336 | ) | (892 | ) | |||||||||||||||||||
|
|
|
|
|
|
|
|
|
|
|
|
|
|
|
|||||||||||||||
| Net income available to common shareholders[B] |
$ | 6,264 | $ | 4,398 | $ | 16,403 | $ | 14,002 | $ | 12,186 | $ | 11,483 | $ | 20,491 | ||||||||||||||
|
|
|
|
|
|
|
|
|
|
|
|
|
|
|
|||||||||||||||
| Net income |
$ | 6,264 | $ | 4,398 | $ | 16,403 | $ | 14,002 | $ | 12,186 | $ | 11,819 | $ | 21,383 | ||||||||||||||
| Less: DTA recapture |
— | — | — | — | — | — | (11,510 | ) | ||||||||||||||||||||
| Add: DTA impairment from tax rate change |
— | — | 1,622 | — | — | — | — | |||||||||||||||||||||
|
|
|
|
|
|
|
|
|
|
|
|
|
|
|
|||||||||||||||
| Adjusted earnings[C] |
6,264 | 4,398 | 18,025 | 14,002 | 12,186 | 11,819 | 9,873 | |||||||||||||||||||||
| Preferred stock dividend |
— | — | — | — | — | (336 | ) | (892 | ) | |||||||||||||||||||
|
|
|
|
|
|
|
|
|
|
|
|
|
|
|
|||||||||||||||
| Adjusted net income available to common shareholders[D] |
$ | 6,264 | $ | 4,398 | $ | 18,025 | $ | 14,002 | $ | 12,186 | $ | 11,483 | $ | 8,981 | ||||||||||||||
|
|
|
|
|
|
|
|
|
|
|
|
|
|
|
|||||||||||||||
| Average shareholders’ equity[E] |
$ | 145,201 | $ | 129,512 | $ | 136,722 | $ | 112,307 | $ | 92,998 | $ | 80,548 | $ | 72,808 | ||||||||||||||
| Less: Average preferred stock |
— | — | — | — | — | (4,006 | ) | (15,869 | ) | |||||||||||||||||||
|
|
|
|
|
|
|
|
|
|
|
|
|
|
|
|||||||||||||||
| Average tangible common equity[F] |
$ | 145,201 | $ | 129,512 | $ | 136,722 | $ | 112,307 | $ | 92,998 | $ | 76,542 | $ | 56,939 | ||||||||||||||
|
|
|
|
|
|
|
|
|
|
|
|
|
|
|
|||||||||||||||
| Return on average shareholders’ equity([A]/[E]) |
17.50 | % | 13.77 | % | 12.00 | % | 12.47 | % | 13.10 | % | 14.67 | % | 29.37 | % | ||||||||||||||
| ROATCE([B]/[F]) |
17.50 | % | 13.77 | % | 12.00 | % | 12.47 | % | 13.10 | % | 15.00 | % | 35.99 | % | ||||||||||||||
| Adjusted ROATCE([D]/[F]) |
17.50 | % | 13.77 | % | 13.18 | % | 12.47 | % | 13.10 | % | 15.00 | % | 15.77 | % | ||||||||||||||
| Weighted average basic common shares outstanding[G] |
13,418,259 | 13,395,363 | 13,408,030 | 12,532,807 | 11,840,528 | 11,427,639 | 11,144,464 | |||||||||||||||||||||
| Basic EPS([B]/[G]) |
$ | 0.47 | $ | 0.33 | $ | 1.22 | $ | 1.12 | $ | 1.03 | $ | 1.00 | $ | 1.84 | ||||||||||||||
| Adjusted Basic EPS([D]/[G]) |
$ | 0.47 | $ | 0.33 | $ | 1.34 | $ | 1.12 | $ | 1.03 | $ | 1.00 | $ | 0.81 | ||||||||||||||
| Weighted average diluted common shares outstanding[H] |
13,586,759 | 13,503,502 | 13,540,293 | 12,607,990 | 11,929,503 | 11,477,424 | 11,157,254 | |||||||||||||||||||||
| Diluted EPS([B]/[H]) |
$ | 0.46 | $ | 0.33 | $ | 1.21 | $ | 1.11 | $ | 1.02 | $ | 1.00 | $ | 1.84 | ||||||||||||||
| Adjusted diluted EPS([D]/[H]) |
$ | 0.46 | $ | 0.33 | $ | 1.33 | $ | 1.11 | $ | 1.02 | $ | 1.00 | $ | 0.80 | ||||||||||||||
| Average assets[I] |
$ | 1,467,948 | $ | 1,251,738 | $ | 1,340,128 | $ | 1,122,410 | $ | 977,267 | $ | 809,616 | $ | 680,688 | ||||||||||||||
| Return on average assets([A]/[I]) |
1.73 | % | 1.42 | % | 1.22 | % | 1.25 | % | 1.25 | % | 1.46 | % | 3.14 | % | ||||||||||||||
| Adjusted return on average assets([C]/[I]) |
1.73 | % | 1.42 | % | 1.35 | % | 1.25 | % | 1.25 | % | 1.46 | % | 1.45 | % | ||||||||||||||
| * | The capital letters following certain line items in the table above are used to identify the components of the calculated performance metrics to aid the reader. |
22
Table of Contents
Investing in our common stock involves a high degree of risk. Before you decide to invest, you should carefully consider the risks described below, together with all other information included in this prospectus. Any of the following risks, as well as risks that we do not know or currently deem immaterial, could have a material adverse effect on our business, financial condition, results of operations and growth prospects. As a result, the trading price of our common stock could decline and you could experience a partial or complete loss of your investment. Further, to the extent that any of the information in this prospectus constitutes forward-looking statements, the risk factors below also are cautionary statements identifying important factors that could cause actual results to differ materially from those expressed in any forward-looking statements made by us or on our behalf. See “Cautionary Note Regarding Forward-Looking Statements” beginning on page 53.
Risks Related to Our Business
Our business depends on our ability to successfully manage credit risk.
The operation of our business requires us to manage credit risk. As a lender, we are exposed to the risk that our borrowers will be unable to repay their loans according to their terms, and that the collateral securing repayment of their loans, if any, may not be sufficient to ensure repayment. In addition, there are risks inherent in making any loan, including risks with respect to the period of time over which the loan may be repaid, risks relating to proper loan underwriting, risks resulting from changes in economic and industry conditions and risks inherent in dealing with individual borrowers. In order to successfully manage credit risk, we must, among other things, maintain disciplined and prudent underwriting standards and ensure that our bankers follow those standards. The weakening of these standards for any reason, such as an attempt to attract higher yielding loans, a lack of discipline or diligence by our employees in underwriting and monitoring loans, the inability of our employees to adequately adapt policies and procedures to changes in economic or any other conditions affecting borrowers and the quality of our loan portfolio, may result in loan defaults, foreclosures and additional charge-offs and may necessitate that we significantly increase our allowance for loan losses, each of which could adversely affect our net income. As a result, our inability to successfully manage credit risk could have a material adverse effect on our business, financial condition or results of operations.
An important feature of our credit risk management system is our use of an internal credit risk rating and control system through which we identify, measure, monitor and mitigate existing and emerging credit risk of our borrowers. As this process involves detailed analysis of the borrower or credit risk, taking into account both quantitative and qualitative factors, it is subject to human error. In exercising their judgment, our employees may not always be able to assign an accurate credit rating to a borrower or credit risk, which may result in our exposure to higher credit risks than indicated by our risk rating and control system. The credit risk rating and control system may not identify credit risk in our loan portfolio and we may fail to manage credit risk effectively.
Some of our tools and metrics for managing credit risk and other risks are based upon our use of observed historical market behavior and assumptions. We rely on quantitative models to measure risks and to estimate certain financial values. Models may be used in such processes as determining the pricing of various products, grading loans and extending credit, measuring interest rates and other market risks, predicting losses, assessing capital adequacy and calculating regulatory capital levels, as well as estimating the value of financial instruments and balance sheet items. Poorly designed or implemented models present the risk that our business decisions based on information incorporating such models will be adversely affected due to the inadequacy of that information. Moreover, our models may fail to predict future risk exposures if the information used in the model is incorrect, obsolete or not sufficiently comparable to actual events as they occur, or if our model assumptions prove incorrect. We seek to incorporate appropriate historical data in our models, but the range of market values and behaviors reflected in any period of historical data is not at all times predictive of future developments in any particular period and the period of data we incorporate into our models may turn out to be inappropriate for the future period being modeled. In such case, our ability to manage risk would be limited and our risk exposure and losses could be significantly greater than our models indicated.
23
Table of Contents
Fluctuations in interest rates may reduce net interest income and otherwise negatively impact our financial condition and results of operations.
Shifts in short-term interest rates may reduce net interest income, which is the principal component of our earnings. Net interest income is the difference between the amounts received by us on our interest-earning assets and the interest paid by us on our interest-bearing liabilities. When interest rates rise, the rate of interest we earn on our assets, such as loans, typically rises more quickly than the rate of interest that we pay on our interest-bearing liabilities, such as deposits, which may cause our profits to increase. When interest rates decrease, the rate of interest we earn on our assets, such as loans, typically declines more quickly than the rate of interest that we pay on our interest-bearing liabilities, such as deposits, which may cause our profits to decrease. The impact on earnings is more adverse when the slope of the yield curve flattens, that is, when short-term interest rates increase more than long-term interest rates or when long-term interest rates decrease more than short-term interest rates. Many factors impact interest rates, including governmental monetary policies, inflation, recession, changes in unemployment, the money supply and international disorder and instability in domestic and foreign financial markets.
Interest rate increases often result in larger payment requirements for our borrowers, which increases the potential for default. At the same time, the marketability of the underlying property may be adversely affected by any reduced demand resulting from higher interest rates. In a declining interest rate environment, there may be an increase in prepayments on loans as borrowers refinance their mortgages and other indebtedness at lower rates. For the three months ended March 31, 2018, total loans were 85.1% of our average interest-earning assets. Our net interest income exhibited a positive 11.8% sensitivity to rising interest rates in a 100 basis point parallel shock at March 31, 2018.
Changes in interest rates also can affect the value of loans, securities and other assets. An increase in interest rates that adversely affects the ability of borrowers to pay the principal or interest on loans may lead to an increase in nonperforming assets and a reduction of income recognized, which could have a material adverse effect on our results of operations and cash flows. Further, when we place a loan on nonaccrual status, we reverse any accrued but unpaid interest receivable, which decreases interest income. Subsequently, we continue to have a cost to fund the loan, which is reflected as interest expense, without any interest income to offset the associated funding expense. Thus, an increase in the amount of nonperforming assets would have an adverse impact on net interest income.
Rising interest rates will result in a decline in value of the fixed-rate debt securities we hold in our investment securities portfolio. The unrealized losses resulting from holding these securities would be recognized in accumulated other comprehensive income (loss) and reduce total shareholders’ equity. Unrealized losses do not negatively impact our regulatory capital ratios; however, tangible common equity and the associated ratios would be reduced. If debt securities in an unrealized loss position are sold, such losses become realized and will reduce our regulatory capital ratios.
If short-term interest rates decline, and assuming longer term interest rates fall faster, we could experience net interest margin compression as our interest-earning assets would continue to reprice downward while our interest-bearing liability rates could fail to decline in tandem. This would have a material adverse effect on our net interest income and our results of operations.
Liquidity risks could affect operations and jeopardize our business, financial condition and results of operations.
Liquidity is essential to our business. An inability to raise funds through deposits, borrowings, the sale of loans and/or investment securities and from other sources could have a substantial negative effect on our liquidity. Our most important source of funds consists of our customer deposits, a significant portion of which are time deposits. Such deposit balances can decrease when customers perceive they can earn higher interest on their interest-bearing deposits elsewhere, or alternative investments, such as the stock market, provide a better risk/return tradeoff. If customers move money to other financial institutions, or out of bank deposits and into other
24
Table of Contents
investments, we could lose a relatively low cost source of funds, which would require us to seek wholesale funding alternatives in order to continue to grow, thereby increasing our funding costs and reducing our net interest income and net income.
Other primary sources of funds consist of cash from operations, investment maturities and sales and proceeds from the issuance and sale of our equity and debt securities to investors. Additional liquidity is provided by the ability to borrow from the Federal Reserve Bank and the Federal Home Loan Bank of San Francisco. We also may borrow from third-party lenders from time to time. Our access to funding sources in amounts adequate to finance or capitalize our activities or on terms that are acceptable to us could be impaired by factors that affect us directly or the financial services industry or economy in general, such as disruptions in the financial markets or negative views and expectations about the prospects for the financial services industry.
Any decline in available funding could adversely impact our ability to continue to implement our strategic plan, including originate loans, invest in securities, meet our expenses, pay dividends to our shareholders or to fulfill obligations such as repaying our borrowings or meeting deposit withdrawal demands, any of which could have a material adverse impact on our liquidity, business, financial condition and results of operations.
We could recognize losses on securities held in our securities portfolio, particularly if interest rates increase or economic and market conditions deteriorate.
As of March 31, 2018, the fair value of our securities portfolio was approximately $146.2 million. Factors beyond our control can significantly influence the fair value of securities in our portfolio and can cause potential adverse changes to the fair value of these securities. For example, fixed-rate securities acquired by us are generally subject to decreases in market value when interest rates rise. Additional factors include, but are not limited to, rating agency downgrades of the securities or our own analysis of the value of the security, defaults by the issuer or individual mortgagors with respect to the underlying securities and continued instability in the credit markets. Any of the foregoing factors could cause other-than-temporary impairment in future periods and result in realized losses. The process for determining whether impairment is other-than-temporary usually requires difficult, subjective judgments about the future financial performance of the issuer and any collateral underlying the security in order to assess the probability of receiving all contractual principal and interest payments on the security. Because of changing economic and market conditions affecting interest rates, the financial condition of issuers of the securities, the performance of the underlying collateral, and the inherent difficulties in determining expected impairment in future periods, we may recognize realized and/or unrealized losses in future periods, which could have a material and adverse effect on our financial condition and results of operations.
Our business depends on our ability to attract and retain Korean-American immigrants as clients.
A significant portion of our business is based on successfully attracting and retaining Asian-American immigrants generally, and first and second generation Korean-American immigrants specifically, as clients for our commercial loans, residential property loans, consumer loans and deposits. We may be limited in our ability to attract Asian-American clients to the extent the U.S. adopts restrictive domestic immigration laws. Changes to U.S. immigration policies as proposed by the Trump Administration that restrain the flow of immigrants may inhibit our ability to meet our goals and budgets for commercial loans, residential property loans, consumer loans and deposits, which may adversely affect our net interest income and net income.
A decline in general business and economic conditions and any regulatory responses to such conditions could have a material adverse effect on our business, financial position, results of operations and growth prospects.
Our business and operations are sensitive to general business and economic conditions in the U.S., generally, and particularly the state of California and the Los Angeles/Orange County region, as well as the greater New York City/New Jersey metropolitan area, where our branch offices are located. Unfavorable or uncertain economic and market conditions in these areas could lead to credit quality concerns related to repayment ability
25
Table of Contents
and collateral protection as well as reduced demand for the products and services we offer. In recent years there has been a gradual improvement in the U.S. economy as evidenced by a rebound in the housing market, lower unemployment and higher equities markets; however, economic growth has been uneven, and opinions vary on the strength and direction of the economy. The impact of the Trump administration’s policy changes regarding international trade, tariffs, renewable energy, immigration, domestic taxation, among other actions and policies of the current administration, may have on economic and market conditions is uncertain. In addition, concerns about the performance of international economies, especially in Europe and emerging markets, and economic conditions in Asia can impact the economy and financial markets here in the U.S. If the national, regional and local economies experience worsening economic conditions, including high levels of unemployment, our growth and profitability could be constrained. Weak economic conditions are characterized by, among other indicators, deflation, elevated levels of unemployment, fluctuations in debt and equity capital markets, increased delinquencies on mortgage, commercial and consumer loans, residential and commercial real estate price declines, lower home sales and commercial activity and fluctuations in the commercial Federal Housing Administration (“FHA”) financing sector. All of these factors are generally detrimental to our business. Our business is significantly affected by monetary and other regulatory policies of the U.S. federal government, its agencies and government-sponsored entities. Changes in any of these policies are influenced by macroeconomic conditions and other factors that are beyond our control, are difficult to predict and could have a material adverse effect on our business, financial position, results of operations and growth prospects.
Our business could be adversely affected by unfavorable economic and market conditions.
U.S. economic conditions affect our operating results. The U.S. economy has been in a slow-paced nine-year expansion since the Great Recession ended in 2009. This current expansion has been longer than most U.S. expansionary periods in recent history, increasing the probability of a near-term U.S. economic recession. An economic recession adversely affects our operating results because we experience higher loan and lease charge-offs and higher operating costs. Global economic conditions also affect our operating results because global economic conditions directly influence the U.S. economic conditions. Various market conditions may also negatively affect our operating results. Real estate market conditions directly affect performance of our loans secured by real estate. Debt markets affect the availability of credit which impacts the rates and terms at which we offer loans and leases. Stock market downturns affect businesses’ ability to raise capital and invest in business expansion. Stock market downturns often signal broader economic deterioration and/or a downward trend in business earnings which adversely affects businesses’ ability to service their debts.
An economic recession or a downturn in various markets could have one or more of the following adverse effects on our business:
| • | a decrease in the demand for our loans, leases and other products and services offered by us; |
| • | a decrease in our deposit balances due to overall reductions in the accounts of customers; |
| • | a decrease in the value of our investment securities, loans and leases; |
| • | an increase in the level of nonperforming and classified loans and leases: |
| • | an increase in provisions for credit losses and loan and lease charge-offs; |
| • | a decrease in net interest income derived from our lending and deposit gathering activities; |
| • | a decrease in the Company’s stock price; |
| • | an increase in our operating expenses associated with attending to the effects of the above-listed circumstances; and/or |
| • | a decrease in real estate values or a general decrease in capital available to finance real estate transactions, which could have a negative impact on borrowers’ ability to pay off their loans at maturity. |
26
Table of Contents
Risks Related to Our Loans
Because a significant portion of our loan portfolio is comprised of real estate loans, negative changes in the economy affecting real estate values and liquidity could impair the value of collateral securing our real estate loans and result in loan and other losses.
At March 31, 2018, approximately 83.4% of our loan portfolio was comprised of loans with real estate as a primary or secondary component of collateral. As a result, adverse developments affecting real estate values in our market areas could increase the credit risk associated with our real estate loan portfolio. The market value of real estate can fluctuate significantly in a short period of time as a result of market conditions in the geographic area in which the real estate is located. Real estate values and real estate markets are generally affected by changes in national, regional or local economic conditions, the rate of unemployment, fluctuations in interest rates and the availability of loans to potential purchasers, changes in tax laws and other governmental statutes, regulations and policies and acts of nature, such as earthquakes and natural disasters. Adverse changes affecting real estate values and the liquidity of real estate in one or more of our markets could increase the credit risk associated with our loan portfolio, significantly impair the value of property pledged as collateral on loans and affect our ability to sell the collateral upon foreclosure without a loss or additional losses, which could result in losses that would adversely affect profitability. Such declines and losses would have a material adverse impact on our business, results of operations and growth prospects. In addition, if hazardous or toxic substances are found on properties pledged as collateral, the value of the real estate could be impaired. If we foreclose on and take title to such properties, we may be liable for remediation costs, as well as for personal injury and property damage. Environmental laws may require us to incur substantial expenses to address unknown liabilities and may materially reduce the affected property’s value or limit our ability to use or sell the affected property.
We may suffer losses in our loan portfolio despite our underwriting practices.
We mitigate the risks inherent in our loan portfolio by adhering to sound and proven underwriting practices, managed by experienced and knowledgeable credit professionals. These practices include analysis of a borrower’s prior credit history, financial statements, tax returns, cash flow projections, valuations of collateral based on reports of independent appraisers and verifications of liquid assets. Nonetheless, we may incur losses on loans that meet our underwriting criteria, and these losses may exceed the amounts set aside as reserves in our allowance for loan loss.
Lack of seasoning of our loan portfolio could increase risk of credit defaults in the future.
As a result of the organic growth of our loan portfolio over the past several years, a large portion of our loans and of our lending relationships are of relatively recent origin. In general, loans do not begin to show signs of credit deterioration or default until they have been outstanding for some period of time, a process referred to as “seasoning.” As a result, a portfolio of older loans will usually behave more predictably than a newer portfolio. Because a large portion of our portfolio is relatively new, the current level of delinquencies and defaults may not represent the level that may prevail as the portfolio becomes more seasoned. If delinquencies and defaults increase, we may be required to increase our provision for loan losses, which could materially and adversely affect our business, financial condition and results of operations. For information about the average age of our loans, see “Management’s Discussion and Analysis of Financial Condition and Results of Operations—Financial Condition—Loans”.
The recognition of gains on the sale of loans and servicing asset valuations reflect certain assumptions.
We expect that gains on the sale of U.S. government guaranteed loans, primarily 7(a) loans, will comprise a significant component of our revenue. The gains on such sales recognized for the three months ended March 31, 2018 and the year ended December 31, 2017 were $2.0 million and $8.9 million, respectively. The determination of these gains is based on assumptions regarding the value of unguaranteed loans retained, servicing rights retained and deferred fees and costs, and net premiums paid by purchasers of the guaranteed portions of U.S.
27
Table of Contents
government guaranteed loans. The value of retained unguaranteed loans and servicing rights are determined based on market derived factors such as prepayment rates, and current market conditions. Deferred fees and costs are determined using internal analysis of the cost to originate loans. Significant errors in assumptions used to compute gains on sale of loans or servicing asset valuations could result in material revenue misstatements, which may have a material adverse effect on our business, results of operations and profitability.
If we breach any of the representations or warranties we make to a purchaser of our mortgage loans, we may be liable to the purchaser for certain costs and damages.
When we sell or securitize mortgage loans in the ordinary course of business, we are required to make certain representations and warranties to the purchaser about the mortgage loans and the manner in which they were originated. Under these agreements, we may be required to repurchase mortgage loans if we have breached any of these representations or warranties, in which case we may record a loss. In addition, if repurchase and indemnity demands increase on loans that we sell from our portfolios, our liquidity, results of operations and financial condition could be adversely affected.
Many of our loans are to commercial borrowers, which have a higher degree of risk than other types of loans.
At March 31, 2018 we had $1.0 billion of commercial loans, consisting of $675.7 million of commercial property loans, $169.4 million of C&I loans for which real estate is not the primary source of collateral, $134.2 million of SBA property loans, and $26.1 million of construction loans. Commercial loans represented 82.2% of our total loan portfolio at March 31, 2018. Commercial loans are often larger and involve greater risks than other types of lending. Because payments on such loans are often dependent on the successful operation or development of the property or business involved, repayment of such loans is often more sensitive than other types of loans to adverse conditions in the real estate market or the general business climate and economy. Accordingly, a downturn in the real estate market and a challenging business and economic environment may increase our risk related to commercial loans. Unlike residential property loans, which generally are made on the basis of the borrowers’ ability to make repayment from their employment and other income and which are secured by real property whose value tends to be more easily ascertainable, commercial loans typically are made on the basis of the borrowers’ ability to make repayment from the cash flow of the commercial venture. Our C&I loans are primarily made based on the identified cash flow of the borrower and secondarily on the collateral underlying the loans. Most often, this collateral consists of accounts receivable, inventory and equipment. Inventory and equipment may depreciate over time, may be difficult to appraise and may fluctuate in value based on the success of the business. If the cash flow from business operations is reduced, the borrower’s ability to repay the loan may be impaired. Due to the larger average size of each commercial loan as compared with other loans such as residential loans, as well as collateral that is generally less readily-marketable, losses incurred on a small number of commercial loans could have a material adverse impact on our financial condition and results of operations.
Our high concentration in commercial real estate could cause our regulators to restrict our ability to grow and could adversely affect our results of operations and financial condition.
As a part of their regulatory oversight, in 2006 federal bank regulators issued guidance titled, “Concentrations in Commercial Real Estate Lending, Sound Risk Management,” which we refer to as the CRE Concentration Guidance. Additional guidance which focused on CRE lending, including an Interagency Statement titled, “Statement on Prudent Risk Management for Commercial Real Estate Lending,” has been issued from time to time since 2006 and CRE lending continues to be a significant focus of federal and state bank regulators. These various guidelines and pronouncements were issued in response to the agencies’ concerns that rising CRE concentrations might expose institutions to unanticipated earnings and capital volatility in the event of adverse changes in the commercial real estate market. The CRE Concentration Guidance identifies certain concentration levels that, if exceeded, will expose the institution to additional supervisory analysis with regard to the institution’s CRE concentration risk. The CRE Concentration Guidance is designed to promote appropriate levels
28
Table of Contents
of capital and sound loan and risk management practices for institutions with a concentration of CRE loans. In general, the CRE Concentration Guidance establishes the following supervisory criteria as preliminary indications of possible CRE concentration risk: (1) the institution’s total construction, land development and other land loans represent 100% or more of total risk-based capital; or (2) total CRE loans as defined in the regulatory guidelines represent 300% or more of total risk-based capital, and the institution’s CRE loan portfolio has increased by 50% or more during the prior 36-month period. Pursuant to the CRE Concentration Guidelines, loans secured by owner-occupied commercial real estate are not included for purposes of CRE Concentration calculation. As of March 31, 2018, using regulatory definitions in the CRE Concentration Guidance, our CRE loans represented 357.1% of our total risk-based capital, as compared to 355.1%, 352.1%, 359.2% and 355.4% as of December 31, 2017, 2016, 2015 and 2014, respectively. The Federal Deposit Insurance Corporation (“FDIC”) could become concerned about our CRE loan concentrations, and they could inhibit our organic growth by restricting our ability to execute on our strategic plan.
Our residential property loan product consists primarily of non-qualified residential mortgage loans which may be considered less liquid and riskier than qualified residential mortgage loans.
As of March 31, 2018, our residential property loan portfolio amounted to $184.8 million or 15.1% of our total loan portfolio. As of such date, all of our residential property loans consisted of non-qualified mortgage loans. Non-qualified loans are residential loans that do not comply with certain standards set by the Dodd-Frank Wall Street Reform and Consumer Protection Act (“Dodd-Frank Act”) and its related regulations. These non-qualified loans are considered to have a higher degree of risk and are less liquid than qualified mortgage loans. We offer two residential mortgage products: a lower loan-to-value, alternative document non-qualified residential mortgage loan, and a qualified residential mortgage loan. We originated $24.2 million and $66.1 million, respectively, for the three months ended March 31, 2018 and the year ended December 31, 2017 of non-qualified residential mortgage loans. We originated $1.6 million for the three months ended March 31, 2018 and $12.8 million for the year ended December 31, 2017 of qualified residential mortgage loans. As of March 31, 2018, our non-qualified residential mortgage loans had an weighted average loan-to-value of 56.9% and an weighted average Fair Isaac Corporation (“FICO”) score of 743.
The non-qualified residential mortgage loans that we originate are designed to assist Asian-Americans who have recently immigrated to the U.S. or are self-employed business owners and as such are willing to provide higher down payment amounts and pay higher interest rates and fees in return for documentation requirements more accommodative for self-employed borrowers. Non-qualified residential mortgage loans are considered less liquid than qualified residential mortgage loans because such loans cannot be securitized and can only be sold directly to other financial institutions. Such non-qualified loans may be considered riskier than qualified mortgage loans.
Despite the original intention to hold to maturity for our non-qualified residential mortgage loans at the time of origination, we may sell these loans in the secondary market if opportunity arises. However, these loans also present pricing risk as rates change, and our sale premiums cannot be guaranteed. Further, the criteria for our loans to be purchased by other investors may change from time to time, which could limit our ability to sell these loans in the secondary market.
Mortgage production, including refinancing activity, historically declines in rising interest rate environments. While we have been experiencing historically low interest rates over the last five years, this low interest rate environment likely will not continue indefinitely. Consequently, when interest rates increase further, our mortgage production may not continue at current levels.
The non-guaranteed portion of SBA loans that we retain on our balance sheet as well as the guaranteed portion of SBA loans that we sell could expose us to various credit and default risks.
We originated $38.2 million and $182.5 million, respectively, of SBA loans during the three months ended March 31, 2018 and the year ended December 31, 2017. During the same time periods, we sold $29.9 million and $127.3 million, respectively, of the guaranteed portion of our SBA loans. As of March 31, 2018, we held $163.6
29
Table of Contents
million of SBA loans on our balance sheet, $152.6 million of which consisted of the non-guaranteed portion of SBA loans and $10.9 million or 6.7% consisted of the guaranteed portion of SBA loans. The non-guaranteed portion of SBA loans have a higher degree of risk of loss as compared to the guaranteed portion of such loans, and these non-guaranteed loans make up a substantial majority of our remaining SBA loans.
When we sell the guaranteed portion of SBA loans in the ordinary course of business, we are required to make certain representations and warranties to the purchaser about the SBA loan and the manner in which they were originated. Under these agreements, we may be required to repurchase the guaranteed portion of the SBA loan if we have breached any of these representations or warranties, in which case we may record a loss. In addition, if repurchase and indemnity demands increase on loans that we sell from our portfolios, our liquidity, results of operations and financial condition could be adversely affected. Further, we generally retain the non-guaranteed portions of the SBA loans that we originate and sell, and to the extent the borrowers of such loans experience financial difficulties, our financial condition and results of operations could be adversely impacted.
Curtailment of government guaranteed loan programs could affect a segment of our business.
A significant segment of our business consists of originating and periodically selling U.S. government guaranteed loans, in particular those guaranteed by the SBA. Presently, the SBA guarantees 75% to 85% of the principal amount of each qualifying SBA loan originated under the SBA’s 7(a) loan program. The U.S. government may not maintain the SBA 7(a) loan program, and even if it does, such guaranteed portion may not remain at its current level. In addition, from time to time, the government agencies that guarantee these loans reach their internal limits and cease to guarantee future loans. In addition, these agencies may change their rules for qualifying loans or Congress may adopt legislation that would have the effect of discontinuing or changing the loan guarantee programs. Non-governmental programs could replace government programs for some borrowers, but the terms might not be equally acceptable. Therefore, if these changes occur, the volume of loans to small business and industrial borrowers of the types that now qualify for government guaranteed loans could decline. Also, the profitability of the sale of the guaranteed portion of these loans could decline as a result of market displacements due to increases in interest rates, and premiums realized on the sale of the guaranteed portions could decline from current levels. As the funding and sale of the guaranteed portion of SBA 7(a) loans is a major portion of our business and a significant portion of our noninterest income, any significant changes to the funding for the SBA 7(a) loan program may have an unfavorable impact on our prospects, future performance and results of operations. The gain on sale of SBA loans was $2.0 million and $8.9 million, respectively, or 61.0% and 63.8%, respectively, of the total non-interest income, for the three months ended March 31, 2018 and the year ended December 31, 2017.
The small- and medium-sized businesses that we lend to may have fewer resources to weather adverse business developments, which may impair a borrower’s ability to repay a loan, and such impairment could adversely affect our results of operations and financial condition.
We target our business development and marketing strategy primarily to serve the banking and financial services needs of small- to medium-sized businesses. These businesses generally have fewer financial resources in terms of capital or borrowing capacity than larger entities, frequently have smaller market shares than their competitors, may be more vulnerable to economic downturns, often need substantial additional capital to expand or compete and may experience substantial volatility in operating results, any of which may impair a borrower’s ability to repay a loan. In addition, the success of a small and medium-sized business often depends on the management talents and efforts of one or two people or a small group of people, and the death, disability or resignation of one or more of these people could have a material adverse impact on the business and its ability to repay its loan. If general economic conditions negatively impact the markets in which we operate and small to medium-sized businesses are adversely affected or our borrowers are otherwise affected by adverse business developments, our business, financial condition and results of operations may be adversely affected.
30
Table of Contents
Real estate construction loans are based upon estimates of costs and values associated with the complete project. These estimates may be inaccurate, and we may be exposed to significant losses on loans for these projects.
Real estate construction loans, including land development loans, comprised approximately 2.1% of our total loan portfolio as of March 31, 2018, and such lending involves additional risks because funds are advanced upon the security of the project, which is of uncertain value prior to its completion, and costs may exceed realizable values in declining real estate markets. Because of the uncertainties inherent in estimating construction costs and the realizable market value of the completed project and the effects of governmental regulation of real property, it is relatively difficult to evaluate accurately the total funds required to complete a project and the related loan-to-value ratio. As a result, construction loans often involve the disbursement of substantial funds with repayment dependent, in part, on the success of the ultimate project and the ability of the borrower to sell or lease the property, rather than the ability of the borrower or guarantor to repay principal and interest. If our appraisal of the value of the completed project proves to be overstated or market values or rental rates decline, we may have inadequate security for the repayment of the loan upon completion of construction of the project. If we are forced to foreclose on a project prior to or at completion due to a default, we may not be able to recover all of the unpaid balance of, and accrued interest on, the loan as well as related foreclosure and holding costs. In addition, we may be required to fund additional amounts to complete the project and may have to hold the property for an unspecified period of time while we attempt to dispose of it.
The risks inherent in construction lending may affect adversely our results of operations. Such risks include, among other things, the possibility that contractors may fail to complete, or complete on a timely basis, construction of the relevant properties; substantial cost overruns in excess of original estimates and financing; market deterioration during construction; and lack of permanent take-out financing. Loans secured by such properties also involve additional risks because they have no operating history. In these loans, loan funds are advanced upon the security of the project under construction (which is of uncertain value prior to completion of construction) and the estimated operating cash flow to be generated by the completed project. Such properties may not be sold or leased so as to generate the cash flow anticipated by the borrower. A general decline in real estate sales and prices across the U.S. or locally in the relevant real estate market, a decline in demand for residential property, economic weakness, high rates of unemployment and reduced availability of mortgage credit are some of the factors that can adversely affect the borrowers’ ability to repay their obligations to us and the value of our security interest in collateral, and thereby adversely affect our results of operations and financial results.
Nonperforming assets take significant time to resolve and adversely affect our results of operations and financial condition, and could result in further losses in the future.
As of March 31, 2018, our nonperforming loans (“NPLs”) totaled $2.4 million, or 0.2% of our loan portfolio, and our NPAs, which include NPLs and other real estate owned (“OREO”), totaled $2.4 million, or 0.2% of total assets. A loan becomes an NPL if: (i) it is maintained on a cash basis because of deterioration in the financial condition of the borrower, (ii) payment in full of principal or interest is not expected, or (iii) principal or interest has been in default for a period of 90 days or more, unless the loan is both well secured and in the process of collection. In addition, we had $992 thousand in accruing loans that were 30-89 days delinquent as of March 31, 2018. Our NPAs adversely affect our net income in various ways. We do not record interest income on nonaccrual loans or OREO, which adversely affects our net income and returns on assets and equity, increases our loan administration costs and adversely affects our efficiency ratio. When we take collateral in foreclosure and similar proceedings, we are required to mark the collateral to its then-fair market value, which may result in a loss. These NPLs and OREO also increase our risk profile and the level of capital our regulators believe is appropriate for us to maintain in light of such risks. The resolution of NPAs requires significant time commitments from management and can be detrimental to the performance of their other responsibilities. If we experience increases in NPLs and NPAs, our net interest income may be negatively impacted and our loan administration costs could increase, each of which could have an adverse effect on our net income and related ratios, such as return on assets and equity.
31
Table of Contents
Our use of appraisals in deciding whether to make a loan secured by real property does not ensure the value of the real property collateral.
In considering whether to make a loan secured by real property, we generally require an appraisal of the property. However, an appraisal is only an estimate of the value of the property at the time the appraisal is made. If the appraisal does not reflect the amount that may be obtained upon any sale or foreclosure of the property, we may not realize an amount equal to the indebtedness secured by the property. Likewise, once a property goes into foreclosure, we obtain a new appraisal and use such appraisal to value such property on our books until it is subsequently sold.
Real estate market volatility and future changes in our disposition strategies could result in net proceeds that differ significantly from our other real estate owned fair value appraisals.
As of March 31, 2018 we had no OREO on our books, but in the ordinary course of our business expect to hold some level of OREO from time to time. OREO typically consists of properties that we obtain through foreclosure or through an in-substance foreclosure in satisfaction of an outstanding loan. OREO properties are valued on our books at the lesser of the recorded investment in the loan for which the property previously served as collateral or the property’s “fair value,” which represents the estimated sales price of the property on the date acquired less estimated selling costs. Generally, in determining “fair value,” an orderly disposition of the property is assumed, unless a different disposition strategy is expected. Significant judgment is required in estimating the fair value of OREO property, and the period of time within which such estimates can be considered current is significantly shortened during periods of market volatility.
In response to market conditions and other economic factors, we may utilize alternative sale strategies other than orderly disposition as part of our OREO disposition strategy, such as immediate liquidation sales. In this event, as a result of the significant judgments required in estimating fair value and the variables involved in different methods of disposition, the net proceeds realized from such sales transactions could differ significantly from the appraisals, comparable sales and other estimates used to determine the fair value of our OREO properties.
We could be exposed to risk of environmental liabilities with respect to properties to which we take title.
In the course of our business, we may foreclose and take title to real estate, and could be subject to environmental liabilities with respect to these properties. We may be held liable to a governmental entity or to third-parties for property damage, personal injury, investigation and clean-up costs incurred by these parties in connection with environmental contamination, or may be required to investigate or clean up hazardous or toxic substances, or chemical releases at a property. The costs associated with investigation or remediation activities could be substantial. In addition, if we are the owner or former owner of a contaminated site, we may be subject to common law claims by third-parties based on damages and costs resulting from environmental contamination emanating from the property. If we become subject to significant environmental liabilities, our business, financial condition, results of operations and cash flows may be materially and adversely affected.
Risks Related to Our Deposits
Competition among U.S. banks for customer deposits is intense and may increase the cost of retaining current deposits or procuring new deposits.
Any changes we make to the rates offered on our deposit products to remain competitive with other financial institutions may adversely affect our profitability and liquidity. Interest-bearing accounts earn interest at rates established by management based on competitive market factors. The demand for the deposit products we offer may also be reduced due to a variety of factors, such as demographic patterns, changes in customer preferences, reductions in consumers’ disposable income, regulatory actions that decrease customer access to particular products, or the availability of competing products.
32
Table of Contents
A large percentage of our deposits is attributable to a relatively small number of customers, which could adversely affect our liquidity, financial condition and results of operations.
Our ten largest depositor relationships accounted for approximately 4.7% of our deposits at March 31, 2018. Our largest depositor relationship accounted for approximately 1.0% of our deposits at March 31, 2018. The Bank maintained $52.5 million of brokered deposits at March 31, 2018 and December 31, 2017, which was an increase of $13.4 million from $39.1 million at December 31, 2016. Federal banking law and regulation place restrictions on depository institutions regarding brokered deposits. Due to the short-term nature of the deposit balances maintained by our large depositors, the deposit balances they maintain with us may fluctuate. The loss of one or more of our ten largest customers, or a significant decline in the deposit balances due to ordinary course fluctuations related to these customers’ businesses, would be likely to adversely affect our liquidity and require us to raise deposit interest rates to attract new deposits, purchase federal funds or borrow funds on a short term basis to replace such deposits. Depending on the interest rate environment and competitive factors, low cost deposits may need to be replaced with higher cost funding, resulting in a decrease in net interest income and net income.
The Bank’s deposit insurance premium could be higher in the future, which could have a material adverse effect on our future results of operations.
We are generally unable to control the amount of premiums that we are required to pay for FDIC insurance. As a result of economic conditions and the enactment of the Dodd-Frank Act, the FDIC has in recent years increased deposit insurance assessment rates, which in turn raised deposit premiums for many insured depository institutions. In 2010, the FDIC increased the Deposit Insurance Fund’s target reserve ratio to 2.0% of insured deposits following the Dodd-Frank Act’s elimination of the 1.5% cap on the insurance fund’s reserve ratio, and the FDIC has put in place a restoration plan to restore the Deposit Insurance Fund to its 1.35% minimum reserve ratio managed by the Dodd-Frank Act by September 30, 2020. If recent increases in premiums are insufficient for the Deposit Insurance Fund to meet its funding requirements, further special assessments or increases in deposit insurance premiums may be required. Further, if there are additional financial institution failures that affect the Deposit Insurance Fund, we may be required to pay higher FDIC premiums. Any future additional assessments, increases or required prepayments in FDIC insurance premiums could adversely affect our earnings and results of operations.
Risks Related to Our Management
We are highly dependent on key personnel and the loss of one or more of those key personnel may materially and adversely affect its prospects our ability to execute on our strategic plan, existing and prospective customer relationships, growth prospects, and results of operations.
Competition for qualified employees and personnel in the banking industry is intense and there are a limited number of qualified persons with knowledge of and experience in the community banking industry generally, and in community banking focused on Korean-Americans specifically. The process of recruiting personnel with the combination of skills and attributes required to carry out our strategies can often be lengthy. Our success depends to a significant degree upon its ability to attract and retain qualified management, loan and deposit origination, administrative, marketing and technical personnel and upon the continued contributions of its management and personnel. In addition, our continued success will be highly dependent on retaining the current executive management team, which includes, but is not limited to, C-level positions in executive management, finance, lending, credit administration, and other professionals at the Company and Bank level who work directly with the management team to implement the strategic direction of the Company’s and the Bank’s boards of directors. We believe this management team, comprised principally of long-time employees who have worked in the banking industry for a number of years, is integral to implementing our business strategy. The loss of the services of any one of them could have a material adverse effect on our business, financial condition, results of operations and cash flows.
33
Table of Contents
Risk Related to Our Allowance for Loan Losses, or Allowance
Accounting estimates and risk management processes rely on analytical models that may prove inaccurate resulting in a material adverse effect on our business, financial condition and results of operations.
The processes we use to estimate probable incurred loan losses and to measure the fair value of financial instruments, as well as the processes used to estimate the effects of changing interest rates and other market measures on our financial condition and results of operations, depends upon the use of analytical models. These models reflect assumptions that may not be accurate, particularly in times of market stress or other unforeseen circumstances. Even if these assumptions are adequate, the models using those assumptions may prove to be inadequate or inaccurate because of other flaws in their design or their implementation. If the models we use for interest rate risk and asset-liability management are inadequate, we may incur increased or unexpected losses upon changes in market interest rates or other market measures. If the models we use for determining our probable loan losses are inadequate, the allowance for loan losses may not be sufficient to support future charge-offs. If the models we use to measure the fair value of financial instruments are inadequate, the fair value of such financial instruments may fluctuate unexpectedly or may not accurately reflect what we could realize upon sale or settlement of such financial instruments. Any such failure in our analytical models could result in losses that could have a material adverse effect on our business, financial condition and results of operations.
Our allowance for loan losses may not be adequate to cover potential losses in our loan portfolio.
A significant source of risk arises from the possibility that losses could be sustained because borrowers, guarantors and related parties may fail to perform in accordance with the terms of their loans and leases. The underwriting and credit monitoring policies and procedures that the Bank has adopted to address this risk may not prevent unexpected losses and such losses could have a material adverse effect on our business, financial condition, results of operations and cash flows. These unexpected losses may arise from a wide variety of specific or systemic factors, many of which are beyond our ability to predict, influence or control.
Like all financial institutions, the Bank maintains an allowance for loan losses to provide for loan defaults and non-performance. This allowance, expressed as a percentage of loans, was 1.01%, 1.03% and 1.10%, respectively, at March 31, 2018, and December 31, 2017 and 2016. Allowance for loan losses is funded from a provision for loan losses, which is a charge to our income statement. Our provision for loan losses, was $95 thousand, $1.8 million and $2.3 million, respectively, for the three months ended March 31, 2018 and the years ended December 31, 2017 and 2016.
Our allowance for loan losses may not be adequate to cover actual loan losses, and future provisions for loan losses could materially and adversely affect our business, financial condition, results of operations and cash flows. The allowance for loan losses reflects our estimate of the probable incurred losses in our loan portfolio at the relevant balance sheet date. Our allowance for loan losses is based on our prior experience, as well as an evaluation of the known risks in the current portfolio, composition and growth of the loan portfolio and economic factors. The determination of an appropriate level of loan loss allowance is an inherently difficult process and is based on numerous assumptions. The amount of future losses is susceptible to changes in economic, operating and other conditions, including changes in interest rates that may be beyond our control, and these losses may exceed current estimates.
The process we use to estimate losses inherent in our credit exposure requires difficult, subjective and complex judgments, including how these economic conditions might impair the ability of our borrowers to repay their loans. The level of uncertainty concerning current economic conditions may adversely affect the accuracy of our estimates, which may, in turn, impact the reliability of the allowance for loan losses. If our allowance for loan losses is inaccurate, for any of the reasons discussed above (or other reasons), and is inadequate to cover the loan losses that it actually experiences, the resulting losses could have a material and adverse impact on our financial condition and results of operations. Further, we may increase the allowance for loan losses in the future, and regulators may require us to increase this allowance. Either of these occurrences could also materially and adversely affect our business, financial condition, results of operations and cash flows.
34
Table of Contents
The current expected credit loss standard established by the Financial Accounting Standards Board will require significant data requirements and changes to methodologies.
In the aftermath of the 2007-2008 financial crisis, the Financial Accounting Standards Board (“FASB”), decided to review how banks estimate losses in the Allowance calculation, and it issued the final Current Expected Credit Loss (“CECL”), standard on June 16, 2016. Currently, the impairment model used by financial institutions is based on incurred losses, and loans are recognized as impaired when there is no longer an assumption that future cash flows will be collected in full under the originally contracted terms. This model will be replaced by the CECL model that will become effective for the Bank for the fiscal year beginning after December 15, 2019. Financial institutions will be required to use historical information and current conditions to estimate the expected loss over the life of the loan. Management has established a task force to begin the implementation process. The transition to the CECL model will require significantly greater data requirements and changes to methodologies to accurately account for expected loss. The Bank may be required to increase its reserves and Allowance as a result of the implementation of CECL.
On April 13, 2018, the Federal Reserve Board, FDIC, and Office of the Comptroller of the Currency issued a Notice of Proposed Rulemaking regarding the implementation of CECL methodology for allowances and related adjustments to regulatory capital rules. This proposed rule is subject to a 60-day comment period but, if implemented as proposed, the primary impact on the Bank would be that it would be able to phase in over 3 years the adverse effects on regulatory capital that may result from the adoption of CECL. As stated above, the Bank will be required to adopt CECL beginning in the first fiscal year beginning after December 15, 2019.
Risks Related to Our Growth Strategy
We may not be able to continue growing our business, particularly if we cannot increase loans and deposits through organic growth because of constrained capital resources or other reasons.
We have grown our consolidated assets from $755.9 million as of December 31, 2013 to $1.6 billion as of March 31, 2018, and our deposits from $674.0 million as of December 31, 2013 to $1.4 billion as of March 31, 2018. We intend to continue to grow our business through organic loan and deposit growth, and we anticipate that much of our future growth will be dependent on our ability to successfully implement our organic growth strategy, which may include establishing additional branches or LPOs in new or existing markets. A risk exists, however, that we will not be able to gain regulatory approval or identify suitable locations and management teams to execute this strategy. Further, our ability to grow organically loan and deposits is dependent on the financial health of our target demographic of Korean-Americans, which is in turn based on the financial health not only of their relevant geographic locations in the U.S. but also more broadly on the economic health of Korea. A decline in economic and business conditions in our market areas or in Korea could have a material impact on our loan portfolio or the demand for our products or services, which in turn may have a material adverse effect on our financial condition and results of operations.
Moreover, our ability to continue to grow successfully will depend to a significant extent on our capital resources. It will also depend, in part, upon our ability to attract deposits, lessen our dependence on larger deposit accounts and identify favorable loan and investment opportunities and upon whether we can continue to fund growth while maintaining cost controls and asset quality, as well as upon other factors beyond our control, such as national, regional and local economic conditions and interest rate trends.
There is risk related to acquisitions.
We plan to continue to grow our business organically. However, from time to time, we may consider opportunistic strategic acquisitions that we believe support our long-term business strategy. We face significant competition from numerous other financial services institutions, many of which will have greater financial resources than we do, when considering acquisition opportunities. Accordingly, attractive acquisition
35
Table of Contents
opportunities may not be available to us. We may not be successful in identifying or completing any future acquisitions. Acquisitions of financial institutions involve operational risks and uncertainties and acquired companies may have unforeseen liabilities, exposure to asset quality problems, key employee and customer retention problems and other problems that could negatively affect our organization.
If we complete any future acquisitions, we may not be able to successfully integrate the operations, management, products and services of the entities that we acquire and eliminate redundancies. The integration process could result in the loss of key employees or disruption of the combined entity’s ongoing business or inconsistencies in standards, controls, procedures, and policies that adversely affect our ability to maintain relationships with customers and employees or achieve the anticipated benefits of the transaction. The integration process may also require significant time and attention from our management that they would otherwise direct at servicing existing business and developing new business. We may not be able to realize any projected cost savings, synergies or other benefits associated with any such acquisition we complete. We cannot determine all potential events, facts and circumstances that could result in loss and our investigation or mitigation efforts may be insufficient to protect against any such loss.
As we expand our business outside of California markets, we will encounter risks that could adversely affect us.
We primarily operate in California markets with a concentration of Korean-American individuals and businesses as customers. We also currently have branch operations in New York and New Jersey, and LPO operations in various states, and would evaluate additional branch expansion opportunities in other Korean-American populated markets. In the course of this expansion, we will encounter significant risks and uncertainties that could have a material adverse effect on our operations. These risks and uncertainties include increased expenses and operational difficulties arising from, among other things, our need to hire adequate staffing, attract sufficient business in new markets, to manage operations in noncontiguous market areas, to comply with all of the various local laws and regulations, and to anticipate events or differences in markets in which we have no current experience.
If we cannot attract deposits, our growth may be inhibited.
Our ability to increase our assets in the long term depends in large part on our ability to attract additional deposits at competitive rates. We intend to seek additional deposits by offering deposit products that are competitive with those offered by other financial institutions in our markets and by establishing personal relationships with our customers, but our efforts to do so may be unsuccessful. Our inability to attract additional deposits at competitive rates could have a material adverse effect on our business, financial condition, results of operations and cash flows.
Operations in our LPOs have positively affected our results of operations, and sustaining these operations and growing loans may be more difficult than we expect, which could adversely affect our results of operations.
We maintain ten LPOs that primarily originate SBA loans. During 2017, these LPOs accounted for approximately 21.3% of new loans originated by the Bank. Sustaining the expansion of loan production through use of these out of state LPOs depends on a number of factors, including the continued strength of the markets in which our offices are located and identifying, hiring and retaining critical personnel. The strength of these markets could be weakened by anticipated increases in interest rates and any economic downturn. Moreover, competition for successful business developers and relationship managers in the SBA loan industry is fierce, and we may not be able to attract and retain the personnel we need to profitably operate our LPOs. Unsuccessful operation of our out of state LPOs could negatively impact our financial condition and results of operation.
36
Table of Contents
Risks Related to Our Capital
As a result of the Dodd-Frank Act and related rulemaking, we are subject to more stringent capital requirements.
In July 2013, the U.S. federal banking authorities approved the implementation of the Basel III regulatory capital reforms (“Basel III”), and issued rules effecting certain changes required by the Dodd-Frank Act. Basel III is applicable to all U.S. banks that are subject to minimum capital requirements as well as to bank and saving and loan holding companies, other than “small bank holding companies” (generally bank holding companies with consolidated assets of less than $1.0 billion). Basel III not only increases most of the required minimum regulatory capital ratios but also introduces a new common equity Tier 1 capital ratio and the concept of a capital conservation buffer. Basel III also expands the current definition of capital by establishing additional criteria that capital instruments must meet to be considered additional Tier 1 and Tier 2 capital. In order to be a “well-capitalized” depository institution under the new regime, an institution must maintain a common equity Tier 1 capital ratio of 6.5% or more; a Tier 1 capital ratio of 8% or more; a total capital ratio of 10% or more; and a Tier 1 leverage ratio of 5% or more. The Basel III capital rules became effective as applied to us and the Bank on January 1, 2015 with a phase-in period that generally extends through January 1, 2019 for many of the changes.
The failure to meet applicable regulatory capital requirements could result in one or more of our regulators placing limitations or conditions on our activities, including our growth initiatives, or restricting the commencement of new activities, and could affect customer and investor confidence, our costs of funds and FDIC insurance costs, our ability to pay dividends on our common stock, our ability to make acquisitions, and our business, results of operations and financial conditions, generally.
We may need to raise additional capital in the future, and if we fail to maintain sufficient capital, whether due to losses, an inability to raise additional capital or otherwise, our financial condition, liquidity and results of operations, as well as our ability to maintain regulatory compliance, would be adversely affected.
We face significant capital and other regulatory requirements as a financial institution. We will likely need to raise additional capital in the future to provide us with sufficient capital resources and liquidity to meet our commitments and business needs. In addition, the Company, on a consolidated basis, and the Bank, on a stand-alone basis, must meet certain regulatory capital requirements and maintain sufficient liquidity. Importantly, regulatory capital requirements could increase from current levels, which could require us to raise additional capital or contract our operations. Our ability to raise additional capital depends on conditions in the capital markets, economic conditions and a number of other factors, including investor perceptions regarding the banking industry, market conditions and governmental activities, and significantly on our financial condition and performance. Accordingly, we may not be able to raise additional capital if needed or, if we can raise capital, we may not be able to do so on terms acceptable to us. If we fail to maintain capital to meet regulatory requirements or if we fail to raise capital for operations when needed or opportune, our financial condition, liquidity and results of operations would be materially and adversely affected.
We may not be able to efficiently deploy all of our capital, which would decrease our return on equity.
Following this offering, we will have equity capital that is well in excess of our required regulatory amounts. As a result, unless we are able to grow through organic growth in the near term by implementing our business plan successfully or other strategic transactions, it is likely that our return on equity will decline in the near future. See “Our management will have broad discretion as to the use of proceeds from this offering, and we may not use the proceeds effectively.”
37
Table of Contents
Other Risks Related to Our Business
Our ability to maintain our reputation is critical to the success of our business, and the failure to do so may materially adversely affect our business and the value of our common stock.
We are a community bank, and our reputation is one of the most valuable components of our business. As such, we strive to conduct our business in a manner that enhances our reputation. This is done, in part, by recruiting, hiring and retaining employees who share our core values of being an integral part of the communities we serve, delivering superior service to our customers and caring about our customers and associates. If our reputation is negatively affected, by the actions of our employees or otherwise, our business and, therefore, our operating results and the value of our common stock may be materially adversely affected. See “Our ability to access markets for funding and acquire and retain customers could be adversely affected by the deterioration of other financial institutions or the financial service industry’s reputation.”
System failure or breaches of our network security could subject us to increased operating costs as well as litigation and other liabilities.
The computer systems and network infrastructure we use could be vulnerable to hardware and cyber-security issues. Our operations are dependent upon our ability to protect our computer equipment against damage from fire, power loss, telecommunications failure or a similar catastrophic event. We could also experience a breach by intentional or negligent conduct on the part of employees or other internal or external sources, including our third-party vendors. Any damage or failure that causes an interruption in our operations could have an adverse effect on our financial condition and results of operations. In addition, our operations are dependent upon our ability to protect the computer systems and network infrastructure utilized by us, including our internet banking activities, against damage from physical break-ins, cyber-security breaches and other disruptive problems caused by the internet or other users. Such computer break-ins and other disruptions would jeopardize the security of information stored in and transmitted through our computer systems and network infrastructure, which may result in significant liability, damage our reputation and inhibit the use of our internet banking services by current and potential customers.
We rely heavily on communications, information systems (both internal and provided by third-parties) and the internet to conduct our business. Our business is dependent on our ability to process and monitor large numbers of daily transactions in compliance with legal, regulatory and internal standards and specifications. In addition, a significant portion of our operations relies heavily on the secure processing, storage and transmission of personal and confidential information, such as the personal information of our customers and clients. In recent periods, several governmental agencies and large corporations, including financial service organizations and retail companies, have suffered major data breaches, in some cases exposing not only their confidential and proprietary corporate information, but also sensitive financial and other personal information of their clients or clients and their employees or other third-parties, and subjecting those agencies and corporations to potential fraudulent activity and their clients, clients and other third-parties to identity theft and fraudulent activity in their credit card and banking accounts. Therefore, security breaches and cyber-attacks can cause significant increases in operating costs, including the costs of compensating clients and customers for any resulting losses they may incur and the costs and capital expenditures required to correct the deficiencies in and strengthen the security of data processing and storage systems. These risks may increase in the future as we continue to increase mobile payments and other internet-based product offerings and expand our internal usage of web-based products and applications.
In addition to well-known risks related to fraudulent activity, which take many forms, such as check “kiting” or fraud, wire fraud, and other dishonest acts, information security breaches and cyber-security related incidents have become a material risk in the financial services industry. For example, several U.S. financial institutions have recently experienced significant distributed denial-of-service attacks, some of which involved sophisticated and targeted attacks intended to disable or degrade service, or sabotage systems. Other potential attacks have
38
Table of Contents
attempted to obtain unauthorized access to confidential information, steal money, or manipulate or destroy data, often through the introduction of computer viruses or malware, cyber-attacks and other means. Other threats of this type may include fraudulent or unauthorized access to data processing or data storage systems used by us or by our clients, electronic identity theft, “phishing,” account takeover, and malware or other cyber-attacks. To date, none of these type of attacks have had a material effect on our business or operations. Such security attacks can originate from a wide variety of sources, including persons who are involved with organized crime or who may be linked to terrorist organizations or hostile foreign governments. Those same parties may also attempt to fraudulently induce employees, customers or other users of our systems to disclose sensitive information in order to gain access to our data or that of our customers or clients.
We are also subject to the risk that our employees may intercept and transmit unauthorized confidential or proprietary information. An interception, misuse or mishandling of personal, confidential or proprietary information being sent to or received from a customer or third-party could result in legal liabilities, remediation costs, regulatory actions and reputational harm.
Unfortunately, it is not always possible to anticipate, detect, or recognize these threats to our systems, or to implement effective preventative measures against all breaches, whether those breaches are malicious or accidental. Cyber-security risks for banking organizations have significantly increased in recent years and have been difficult to detect before they occur because of the following, among other reasons:
| • | the proliferation of new technologies, and the use of the Internet and telecommunications technologies to conduct financial transactions; |
| • | these threats arise from numerous sources, not all of which are in our control, including among others human error, fraud or malice on the part of employees or third-parties, accidental technological failure, electrical or telecommunication outages, failures of computer servers or other damage to our property or assets, natural disasters or severe weather conditions, health emergencies or pandemics, or outbreaks of hostilities or terrorist acts; |
| • | the techniques used in cyber-attacks change frequently and may not be recognized until launched or until well after the breach has occurred; |
| • | the increased sophistication and activities of organized crime groups, hackers, terrorist organizations, hostile foreign governments, disgruntled employees or vendors, activists and other external parties, including those involved in corporate espionage; |
| • | the vulnerability of systems to third-parties seeking to gain access to such systems either directly or using equipment or security passwords belonging to employees, customers, third-party service providers or other users of our systems; and |
| • | our frequent transmission of sensitive information to, and storage of such information by, third-parties, including our vendors and regulators, and possible weaknesses that go undetected in our data systems notwithstanding the testing we conduct of those systems. |
Our investments in systems and processes that are designed to detect and prevent security breaches and cyber-attacks and our conduct of periodic tests of our security systems and processes, may not succeed in anticipating or adequately protecting against or preventing all security breaches and cyber-attacks from occurring. Even the most advanced internal control environment may be vulnerable to compromise. Targeted social engineering attacks are becoming more sophisticated and are extremely difficult to prevent. Additionally, the existence of cyber-attacks or security breaches at third-parties with access to our data, such as vendors, may not be disclosed to us in a timely manner. As cyber-threats continue to evolve, we may be required to expend significant additional resources to continue to modify or enhance our protective measures or to investigate and remediate any information security vulnerabilities or incidents. We maintain a system of internal controls and insurance coverage to mitigate against operational risks, including data processing system failures and errors and customer or employee fraud. If our internal controls fail to prevent or detect an occurrence, or if any resulting loss is not insured or exceeds applicable insurance limits, it could have a material adverse effect on our business, financial condition and results of operations.
39
Table of Contents
As is the case with non-electronic fraudulent activity, cyber-attacks or other information or security breaches, whether directed at us or third-parties, may result in a material loss or have material consequences. Furthermore, the public perception that a cyber-attack on our systems has been successful, whether or not this perception is correct, may damage our reputation with customers and third-parties with whom we do business. A successful penetration or circumvention of system security could cause us negative consequences, including loss of customers and business opportunities, disruption to our operations and business, misappropriation or destruction of our confidential information and/or that of our customers, or damage to our customers’ and/or third-parties’ computers or systems, and could expose us to additional regulatory scrutiny and result in a violation of applicable privacy laws and other laws, litigation exposure, regulatory fines, penalties or intervention, loss of confidence in our security measures, reputational damage, reimbursement or other compensatory costs, additional compliance costs, and could adversely impact our results of operations, liquidity and financial condition.
Our operations could be interrupted if our third-party service providers experience difficulty in providing their services, terminate their services or fail to comply with banking regulations.
We depend to a significant extent on a number of relationships with third-party service providers. Specifically, we receive core systems processing, essential web hosting and other internet systems, deposit processing and other processing services from third-party service providers. If these third-party service providers experience difficulties in providing their services or terminate their services and we are unable to replace them with other service providers, our operations could be interrupted. If an interruption were to continue for a significant period of time, our business, financial condition and results of operations could be adversely and materially affected. Even if we are able to replace them, it may be at a higher cost to us, which could adversely affect our business, financial condition and results of operations.
We are subject to certain operational risks, including, but not limited to, customer or employee fraud and data processing system failures and errors.
Employee errors and employee and customer misconduct could subject us to financial losses or regulatory sanctions and seriously harm our reputation. Employee errors could also subject us to financial claims for negligence. Misconduct by our employees could include hiding unauthorized activities from us, conducting improper or unauthorized activities on behalf of our customers or using confidential information improperly. It is not always possible to prevent employee errors and misconduct, and the precautions we take to prevent and detect this activity may not be effective in all cases.
If our internal controls against operational risks fail to prevent or detect an occurrence of such employee error or misconduct, or if any resulting loss is not insured or exceeds applicable insurance limits, it could have a material adverse effect on our business, financial condition and results of operations.
Changes in accounting standards could materially impact our financial statements.
From time to time, the FASB or the Securities and Exchange Commission (the “SEC”), may change the financial accounting and reporting standards that govern the preparation of our financial statements. Such changes may result in us being subject to new or changing accounting and reporting standards. In addition, the bodies that interpret the accounting standards (such as banking regulators or outside auditors) may change their interpretations or positions on how these standards should be applied. These changes may be beyond our control, can be hard to predict and can materially impact how we record and report our financial condition and results of operations. In some cases, we could be required to apply a new or revised standard retrospectively, or apply an existing standard differently, also retrospectively, in each case resulting in our need to revise or restate prior period financial statements.
We have a limited service area. This lack of geographic and ethnic diversification increases our risk profile.
Our operations are conducted through thirteen branches located principally in Los Angeles and Orange Counties of Southern California and to a lesser extent in the New York/New Jersey region. As a result of these
40
Table of Contents
geographic concentrations, our results depend largely upon economic and business conditions in these areas. Any significant deterioration in economic and business conditions in our service areas could have a material adverse impact on the quality of our loan portfolio and the demand for our products and services, which in turn could have a material adverse effect on our results of operations. We have attempted to diversify some of our loan business through LPOs in seven other states; however, this diversification strategy may not be effective to reduce our geographic and ethnic concentrations.
A major disaster in our service area could result in a material loss to us. California is prone to earthquakes, fires, drought, flooding, mud slides and other natural disasters. Many of our borrowers could suffer uninsured property damage, experience interruption of their businesses or lose their jobs after a major disaster. Those borrowers might not be able to repay their loans, and the collateral for loans could decline significantly in value.
Further, we have a primary focus of serving the Korean-American business community and certain other ethnic communities within our geographic markets. As a result, negative economic, business or political factors in these ethnic communities as well as in Asia, specifically South Korea, could severely impact our customers and business.
Liabilities from environmental regulations could materially and adversely affect our business and financial condition.
In the course of our business, we may foreclose and take title to real estate, and could be subject to environmental liabilities with respect to these properties. We may be held liable to a governmental entity or to third-parties for property damage, personal injury, investigation and clean-up costs incurred by these parties in connection with environmental contamination, or may be required to investigate or clean up hazardous or toxic substances, or chemical releases at a property. The costs associated with investigation or remediation activities could be substantial. In addition, as the owner or former owner of any contaminated site, we may be subject to common law claims by third-parties based on damages, and costs resulting from environmental contamination emanating from the property. If we ever become subject to significant environmental liabilities, our business, financial condition, liquidity and results of operations could be materially and adversely affected.
Our ability to access markets for funding and acquire and retain customers could be adversely affected by the deterioration of other financial institutions or the financial service industry’s reputation.
Reputation risk is the risk to liquidity, earnings and capital arising from negative publicity regarding us or the financial services industry generally. The financial services industry was featured in negative headlines about the global and national credit crisis which commenced in 2007 and the resulting stabilization legislation enacted by the U.S. federal government. These reports, and subsequent negative press regarding systemic fee-churning problems at other institutions, continue to be damaging to the industry’s image and potentially erode confidence in insured financial institutions, such as our banking subsidiary.
In addition, our ability to engage in routine funding transactions could be adversely affected by the actions and commercial soundness of other financial institutions. Financial services companies are interrelated as a result of trading, clearing, counterparty and other relationships. We have exposure to different industries and counterparties, and through transactions with counterparties in the financial services industry, including brokers and dealers, commercial banks, investment banks and other institutional clients. As a result, defaults by, or even rumors or questions about, one or more financial services companies, or the financial services industry generally, have led to market-wide liquidity problems and could lead to losses or defaults by us or by other institutions. These losses or defaults could have a material adverse effect on our business, financial condition, results of operations and growth prospects. Additionally, if our competitors were extending credit on terms we found to pose excessive risks, or at interest rates which we believed did not warrant the credit exposure, we may not be able to maintain our business volume and could experience deteriorating financial performances.
41
Table of Contents
The obligations associated with being a public company will require significant resources and management attention, which may divert from our business operations.
As a result of this offering, we will become subject to the reporting requirements of the Exchange Act, and the Sarbanes-Oxley Act of 2002 (the “Sarbanes-Oxley Act”). The Exchange Act requires that we file annual, quarterly and current reports with respect to our business and financial condition with the SEC. The Sarbanes-Oxley Act requires, among other things, that we establish and maintain effective internal controls and procedures for financial reporting. As a result, we will incur significant legal, accounting and other expenses that we did not previously incur. We anticipate that these costs will materially increase our general and administrative expenses. Furthermore, the need to establish the corporate infrastructure demanded of a public company may divert management’s attention from implementing our strategic plan, which could prevent us from successfully implementing our growth initiatives and improving our business, results of operations and financial condition.
As an “emerging growth company” as defined in the JOBS Act, we intend to take advantage of certain temporary exemptions from various reporting requirements, including reduced disclosure obligations regarding executive compensation in our periodic reports and proxy statements and an exemption from the requirement to obtain an attestation from our auditors on management’s assessment of our internal control over financial reporting. When these exemptions cease to apply, we expect to incur additional expenses and devote increased management effort toward ensuring compliance with them. We cannot predict or estimate the amount of additional costs we may incur as a result of becoming a public company or the timing of such costs.
We have a continuing need for technological change, and we may not have the resources to effectively implement new technology or we may experience operational challenges when implementing new technology.
The financial services industry is undergoing rapid technological changes with frequent introductions of new technology-driven products and services. In addition to allowing us to better serve customers, the effective use of technology increases efficiency and enables financial institutions to reduce costs. Our future success will depend in part upon our ability to address the needs of our customers by using technology to provide products and services that will satisfy customer demands for convenience as well as to create additional efficiencies in our operations as we continue to grow and expand our market area. We may experience operational challenges as we implement these new technology enhancements, or seek to implement them across all of our offices and business units, which could result in us not fully realizing the anticipated benefits from such new technology or require us to incur significant costs to remedy any such challenges in a timely manner.
Many of our larger competitors have substantially greater resources to invest in technological improvements. As a result, they may be able to offer additional or superior products to those that we will be able to offer, which would put us at a competitive disadvantage. Accordingly, a risk exists that we will not be able to effectively implement new technology-driven products and services or be successful in marketing such products and services to our customers.
We depend on the accuracy and completeness of information provided by customers and counterparties.
In deciding whether to extend credit or enter into other transactions with customers and counterparties, we may rely on information furnished to us by or on behalf of customers and counterparties, including financial statements and other financial information. We also may rely on representations of customers and counterparties as to the accuracy and completeness of that information. In deciding whether to extend credit, we may rely upon our customers’ representations that their financial statements conform to GAAP and present fairly, in all material respects, the financial condition, results of operations and cash flows of the customer. We also may rely on customer representations and certifications, or other audit or accountants’ reports, with respect to the business and financial condition of our clients. Our financial condition, results of operations, financial reporting and reputation could be negatively affected if those representations are misleading, false, inaccurate or fraudulent and we rely on that materially misleading, false, inaccurate or fraudulent information.
42
Table of Contents
We face strong competition from financial service companies and other companies that offer banking services which could hurt our business.
We conduct our banking operations primarily in Los Angeles and Orange Counties of Southern California and in the New York/New Jersey region, as well as through LPOs in six other states. Increased competition in our markets may result in reduced loans and deposits. Ultimately, we may not be able to compete successfully against current and future competitors. Many competitors offer the banking services that we offer in our service areas. These competitors include national banks, regional banks and other community banks. We will also face competition from many other types of financial institutions, including savings and loan associations, finance companies, brokerage firms, insurance companies, credit unions, mortgage banks and other financial intermediaries. In particular, our competitors may have greater resources that may afford them a marketplace advantage by enabling them to maintain numerous locations and mount extensive promotional and advertising campaigns. Additionally, banks and other financial institutions with larger capitalization and financial intermediaries not subject to bank regulatory restrictions may have larger lending limits which would allow them to serve the credit needs of larger customers. Areas of competition include interest rates for loans and deposits, efforts to obtain loan and deposit customers and a range in quality of products and services provided, including new technology-driven products and services. Technological innovation continues to contribute to greater competition in domestic and international financial services markets as technological advances enable more companies to provide financial services. We also face competition from out-of-market financial intermediaries that have opened LPOs or that solicit deposits in our market areas. If we are unable to attract and retain banking customers in the face of this significant competition, we may be unable to achieve appropriate loan growth and level of deposits and our business, financial condition, results of operations and cash flows will be negatively impacted.
We have limited the circumstances in which our directors will be liable for monetary damages.
We have included in our articles of incorporation a provision to eliminate the liability of directors for monetary damages to the maximum extent permitted by California law. The effect of this provision will be to reduce the situations in which we or our shareholders will be able to seek monetary damages from our directors. Further, we have also included in our bylaws a provision to indemnify our directors and officers and advance litigation expenses to the fullest extent permitted or required by California law, including circumstances in which indemnification is otherwise discretionary.
Adverse conditions in Asia and elsewhere could adversely affect our business.
Because our business focuses on Korean-American individuals and businesses as customers, we are likely to feel the effects of adverse economic and political conditions in Asia, including the effects of rising inflation or slowing growth and volatility in the real estate and stock markets in South Korea and other regions. U.S. and global economic policies, military tensions and unfavorable global economic conditions may adversely impact the Asian economies. In addition, pandemics and other public health crises or concerns over the possibility of such crises could create economic and financial disruptions in the region. A significant deterioration of economic conditions in Asia could expose us to, among other things, economic and transfer risk, and we could experience an outflow of deposits by those of our customers with connections to Asia. Transfer risk may result when an entity is unable to obtain the foreign exchange needed to meet its obligations or to provide liquidity. This may adversely impact the recoverability of investments with, or loans made to, such entities. Adverse economic conditions in Asia, and in South Korea in particular, may also negatively impact asset values and the profitability and liquidity of our customers who operate in this region.
43
Table of Contents
Legislative and Regulatory Risks
We are subject to extensive government regulation that could limit or restrict our activities, which in turn may adversely impact our ability to increase our assets and earnings.
We operate in a highly regulated environment and are subject to supervision and regulation by a number of governmental regulatory agencies, including the Federal Reserve System (“Federal Reserve”), the California Department of Business Oversight (“DBO”) and the FDIC. Regulations adopted by these agencies, which are generally intended to provide protection for depositors and customers rather than for the benefit of shareholders, govern a comprehensive range of matters relating to ownership and control of our shares, our acquisition of other companies and businesses, permissible activities for us to engage in, maintenance of adequate capital levels, and other aspects of our operations. These bank regulators possess broad authority to prevent or remedy unsafe or unsound practices or violations of law. The laws and regulations applicable to the banking industry could change at any time and we cannot predict the effects of these changes on our business, profitability or growth strategy. Increased regulation could increase our cost of compliance and adversely affect profitability. Moreover, certain of these regulations contain significant punitive sanctions for violations, including monetary penalties and limitations on a bank’s ability to implement components of its business plan, such as expansion through mergers and acquisitions or the opening of new branch offices. In addition, changes in regulatory requirements may add costs associated with compliance efforts. Furthermore, government policy and regulation, particularly as implemented through the Federal Reserve, significantly affect credit conditions. Negative developments in the financial industry and the impact of new legislation and regulation in response to those developments could negatively impact our business operations and adversely impact our financial performance.
Legislative and regulatory actions taken now or in the future may increase our costs and impact our business, governance structure, financial condition or results of operations. Proposed legislative and regulatory actions, including changes to financial regulation, may not occur on the timeframe that is expected, or at all, which could result in additional uncertainty for our business.
We are subject to extensive regulation by multiple regulatory bodies. These regulations may affect the manner and terms of delivery of our services. If we do not comply with governmental regulations, we may be subject to fines, penalties, lawsuits or material restrictions on our businesses in the jurisdiction where the violation occurred, which may adversely affect our business operations. Changes in these regulations can significantly affect the services that we provide as well as our costs of compliance with such regulations. In addition, adverse publicity and damage to our reputation arising from the failure or perceived failure to comply with legal, regulatory or contractual requirements could affect our ability to attract and retain customers.
Current and recent economic conditions, particularly in the financial markets, have resulted in government regulatory agencies and political bodies placing increased focus and scrutiny on the financial services industry. The Dodd-Frank Act significantly changed the regulation of financial institutions and the financial services industry. The Dodd-Frank Act and the regulations thereunder affect large and small financial institutions, including several provisions that will affect how community banks, thrifts and small bank and thrift holding companies will be regulated in the future.
The Dodd-Frank Act, among other things, imposed new capital requirements on bank holding companies; changed the base for FDIC insurance assessments to a bank’s average consolidated total assets minus average tangible equity, rather than upon its deposit base; permanently raised the current standard deposit insurance limit to $250,000; and expanded the FDIC’s authority to raise insurance premiums. The Dodd-Frank Act established the Consumer Financial Protection Bureau (“CFPB”), which has broad rulemaking, supervisory and enforcement authority over consumer financial products and services, including deposit products, residential mortgages, home-equity loans and credit cards and contains provisions on mortgage-related matters, such as steering incentives, determinations as to a borrower’s ability to repay and prepayment penalties. Although the applicability of certain elements of the Dodd-Frank Act is limited to institutions with more than $10 billion in
44
Table of Contents
assets, such applicability may be extended in the future or regulators or other third-parties may seek to impose such requirements on institutions with less than $10 billion in assets, such as Pacific City Bank. Although legislation has been introduced to reduce regulatory requirements, compliance with the Dodd-Frank Act and its implementing regulations has and will continue to result in additional operating and compliance costs that could have a material adverse effect on our business, financial condition, results of operations and growth prospects.
New proposals for legislation continue to be introduced in the U.S. Congress that could further substantially increase regulation of the financial services industry, impose restrictions on the operations and general ability of firms within the industry to conduct business consistent with historical practices, including in the areas of compensation, interest rates, financial product offerings and disclosures, and have an effect on bankruptcy proceedings with respect to consumer residential property mortgages, among other things. Federal and state regulatory agencies also frequently adopt changes to their regulations or change the manner in which existing regulations are applied.
Certain aspects of current or proposed regulatory or legislative changes, including to laws applicable to the financial industry and further changes to the U.S. corporate tax code, if enacted or adopted, may impact the profitability of our business activities, require more oversight or change certain of our business practices, including the ability to offer new products, obtain financing, attract deposits, make loans and achieve satisfactory interest spreads and could expose us to additional costs, including increased compliance costs. These changes also may require us to invest significant management attention and resources to make any necessary changes to operations to comply and could have an adverse effect on our business, financial condition and results of operations. In addition, any proposed legislative or regulatory changes, including those that could benefit our business, financial condition and results of operations, may not occur on the timeframe that is proposed, or at all, which could result in additional uncertainty for our business.
Monetary policies and regulations of the Federal Reserve could adversely affect our business, financial condition and results of operations.
In addition to being affected by general economic conditions, our earnings and growth are affected by the policies of the Federal Reserve. An important function of the Federal Reserve is to regulate the money supply and credit conditions. Among the instruments used by the Federal Reserve to implement these objectives are open market purchases and sales of U.S. government securities, adjustments of the discount rate and changes in banks’ reserve requirements against bank deposits. These instruments are used in varying combinations to influence overall economic growth and the distribution of credit, bank loans, investments and deposits. Their use also affects interest rates charged on loans or paid on deposits.
The monetary policies and regulations of the Federal Reserve have had a significant effect on the operating results of commercial banks in the past and are expected to continue to do so in the future. The effects of such policies upon our business, financial condition and results of operations cannot be predicted.
Federal and state regulators periodically examine our business, and we may be required to remediate adverse examination findings.
The Federal Reserve, the FDIC and the DBO periodically examine our business, including our compliance with laws and regulations. If, as a result of an examination, a banking agency were to determine that our financial condition, capital resources, asset quality, earnings prospects, management, liquidity or other aspects of any of our operations had become unsatisfactory, or that we were in violation of any law or regulation, they may take a number of different remedial actions as they deem appropriate. These actions include the power to enjoin “unsafe or unsound” practices, to require affirmative action to correct any conditions resulting from any violation or practice, to issue an administrative order that can be judicially enforced, to direct an increase in our capital, to restrict our growth, to assess civil money penalties, to fine or remove officers and directors and, if it is concluded
45
Table of Contents
that such conditions cannot be corrected or there is an imminent risk of loss to depositors, to terminate our deposit insurance and place us into receivership or conservatorship. Any regulatory action against us could have an adverse effect on our business, financial condition and results of operations. Following a recent examination, the Bank entered into an informal agreement in January 2018 with the FDIC and DBO that requires the Bank to take certain steps and improve processes and training relating to Bank Secrecy Act and Anti-Money Laundering laws and regulations, and to improve its monitoring of high rate deposits. While we do not expect this informal agreement to change our business strategy, our failure to comply with the informal agreement could have a negative impact on our business, including our ability to establish new branches or LPOs.
We are subject to numerous laws designed to protect consumers, including the Community Reinvestment Act and fair lending laws, and failure to comply with these laws could lead to a wide variety of sanctions.
The Community Reinvestment Act of 1977, as amended (“CRA”), the Equal Credit Opportunity Act, the Fair Housing Act and other fair lending laws and regulations prohibit discriminatory lending practices by financial institutions. The U.S. Department of Justice, federal banking agencies and other federal agencies are responsible for enforcing these laws and regulations. A challenge to an institution’s compliance with fair lending laws and regulations could result in a wide variety of sanctions, including damages and civil money penalties, injunctive relief, restrictions on mergers and acquisitions activity, restrictions on expansion and restrictions on entering new business lines. Private parties may also challenge an institution’s performance under fair lending laws in private class action litigation. Such actions could have a material adverse effect on our business, financial condition, results of operations and growth prospects.
In addition, federal, state and local laws have been adopted that are intended to eliminate certain lending practices considered “predatory.” These laws prohibit practices such as steering borrowers away from more affordable products, selling unnecessary insurance to borrowers, repeatedly refinancing loans and making loans without a reasonable expectation that the borrowers will be able to repay the loans irrespective of the value of the underlying property. It is our policy not to make predatory loans, but these laws create the potential for liability with respect to our lending and loan investment activities. They increase our cost of doing business and, ultimately, may prevent us from making certain loans and cause us to reduce the average percentage rate or the points and fees on loans that we do make.
We face a risk of noncompliance and enforcement action with the Bank Secrecy Act and other anti-money laundering statutes and regulations.
The Bank Secrecy Act, the Uniting and Strengthening America by Providing Appropriate Tools Required to Intercept and Obstruct Terrorism Act of 2001 (“Patriot Act”) and other laws and regulations require financial institutions, among other duties, to institute and maintain an effective anti-money laundering program and to file reports such as suspicious activity reports and currency transaction reports. We are required to comply with these and other anti-money laundering requirements. The federal banking agencies and Financial Crimes Enforcement Network are authorized to impose significant civil money penalties for violations of those requirements and have recently engaged in coordinated enforcement efforts against banks and other financial services providers with the U.S. Department of Justice, Drug Enforcement Administration and Internal Revenue Service. We are also subject to increased scrutiny of compliance with the rules enforced by the Office of Foreign Assets Control. If our policies, procedures and systems are deemed deficient, we would be subject to liabilities, including fines and regulatory actions, which may include restrictions on our ability to pay dividends and the necessity to obtain regulatory approvals to proceed with certain aspects of our business plan, including our acquisition plans.
Failures to maintain and implement adequate programs to combat money laundering and terrorist financing could also have serious reputational consequences for us. Any of these results could reduce the Company’s ability to receive any necessary regulatory approvals for acquisitions or new branch openings. This could have a material adverse effect on our business, financial condition, results of operations and growth prospects. Following a recent examination, the Bank entered into an informal agreement in January 2018 with the FDIC and
46
Table of Contents
DBO that requires the Bank to take certain steps and improve processes and training relating to Bank Secrecy Act and Anti-Money Laundering laws and regulations, and to improve its monitoring of high rate deposits. While we do not expect this informal agreement to change our business strategy, our failure to comply with the informal agreement could have a negative impact on our business, including our ability to establish new branches or LPOs.
The Federal Reserve may require us to commit capital resources to support the Bank.
As a matter of policy, the Federal Reserve expects a bank holding company to act as a source of financial and managerial strength to a subsidiary bank and to commit resources to support such subsidiary bank. The Dodd-Frank Act codified the Federal Reserve’s policy on serving as a source of financial strength. Under the “source of strength” doctrine, the Federal Reserve may require a bank holding company to make capital injections into a troubled subsidiary bank and may charge the bank holding company with engaging in unsafe and unsound practices for failure to commit resources to a subsidiary bank. A capital injection may be required at times when the holding company may not have the resources to provide it and therefore may require the holding company to borrow the funds or raise capital. Any loans by a holding company to its subsidiary banks are subordinate in right of payment to deposits and to certain other indebtedness of such subsidiary bank. In the event of a bank holding company’s bankruptcy, the bankruptcy trustee will assume any commitment by the holding company to a federal bank regulatory agency to maintain the capital of a subsidiary bank. Moreover, bankruptcy law provides that claims based on any such commitment will be entitled to a priority of payment over the claims of the institution’s general unsecured creditors, including the holders of its note obligations. Thus, any borrowing that must be done by the Company to make a required capital injection becomes more difficult and expensive and could have an adverse effect on our business, financial condition and results of operations.
Potential limitations on incentive compensation contained in proposed federal agency rulemaking may adversely affect our ability to attract and retain our highest performing employees.
During the second quarter of 2016, the Federal Reserve and the FDIC, along with other U.S. regulatory agencies, jointly published proposed rules designed to implement provisions of the Dodd-Frank Act prohibiting incentive compensation arrangements that would encourage inappropriate risk taking at covered financial institutions, which includes a bank or bank holding company with $1 billion or more in assets. It cannot be determined at this time whether or when a final rule will be adopted and whether compliance with such a final rule will substantially affect the manner in which we structure compensation for our executives and other employees. Depending on the nature and application of the final rules, we may not be able to compete successfully with certain financial institutions and other companies that are not subject to some or all of the rules to retain and attract executives and other high performing employees. If this were to occur, relationships that we have established with our clients may be impaired and our business, financial condition and results of operations could be adversely affected, perhaps materially.
Our results of operations and financial condition could be materially affected by the enactment of legislation implementing changes in the U.S. or the adoption of other tax reform policies.
On December 22, 2017, the legislation commonly referred to as the Tax Reform Act was enacted, which contains significant changes to U.S. tax law, including, but not limited to, a reduction in the corporate tax rate and a transition to a new territorial system of taxation. The primary impact of the new legislation on our provision for income taxes was a reduction of the future tax benefits of our deferred tax assets by approximately $1.6 million as a result of the reduction in the federal corporate tax rate. The impact of the Tax Reform Act will likely be subject to ongoing technical guidance and accounting interpretation, which we will continue to monitor and assess. Provisional accounting impacts may change in future reporting periods until the accounting analysis is finalized, which will occur no later than one year from the date the Tax Reform Act was enacted.
47
Table of Contents
Risks Related to this Offering and an Investment in Our Common Stock
An active, liquid trading market for our common stock may not develop, and you may not be able to sell your common stock at or above the public offering price, or at all.
Prior to this offering, there has been no public market for our common stock despite our stock having been quoted on the OTC Pink Market. An active trading market for shares of our common stock may never develop or be sustained following this offering. If an active trading market does not develop, you may have a difficulty selling your shares of common stock at an attractive price, or at all. The public offering price for our common stock will be determined by negotiations between us and the representatives of the underwriters and may not be indicative of prices that will prevail in the open market following this offering. Consequently, you may not be able to sell your common stock at or above the public offering price or at any other price or at the time that you would like to sell. An inactive market may also impair our ability to raise capital by selling our common stock and may impair our ability to expand our business by using our common stock as consideration in an acquisition.
The price of our common stock could be volatile following this offering.
The market price of our common stock following this offering may be volatile and could be subject to wide fluctuations in price in response to various factors, some of which are beyond our control. These factors include, among other things:
| • | actual or anticipated variations in our quarterly results of operations; |
| • | changes in business and economic conditions; |
| • | actual occurrence of one or more of the risk factors outlined above; |
| • | recommendations by securities analysts or failure to meet, securities analysts’ estimates of our financial and operating performance, or lack of research reports by industry analysts or ceasing of coverage; |
| • | operating and stock price performance of other companies that investors deem comparable to us; |
| • | news reports relating to trends, concerns and other issues about us, our competitors, or in the financial services industry generally; |
| • | perceptions in the marketplace regarding us and/or our competitors; |
| • | additions or departures of key personnel; |
| • | additional or anticipated sales of our common stock or other securities by us or our existing shareholders; |
| • | significant acquisitions or business combinations, strategic partnerships, joint ventures or capital commitments by or involving our competitors or us; |
| • | the effects of, and changes in, trade, monetary and fiscal policies, including the interest rate policies of the Federal Reserve; |
| • | new technology used, or services offered, by competitors; and |
| • | changes in government regulations. |
In addition, if the market for stocks in our industry, or the stock market in general, experiences a loss of investor confidence, the trading price of our common stock could decline for reasons unrelated to our business, financial condition or results of operations. If any of the foregoing occurs, it could cause our stock price to fall and may expose us to lawsuits that, even if unsuccessful, could be costly to defend and a distraction to management.
An investment in our common stock is not an insured deposit.
An investment in our common stock is not a bank deposit and, therefore, is not insured against loss by the FDIC, any other deposit insurance fund or by any other public or private entity. Investment in our common stock
48
Table of Contents
is inherently risky for the reasons described herein, and is subject to the same market forces that affect the price of common stock in any company. As a result, if you acquire our common stock, you could lose some or all of your investment.
If equity research analysts do not publish research or reports about our business, or if they do publish such reports but issue an unfavorable commentary or downgrade our common stock, the price and trading volume of our common stock could decline.
The trading market for our common stock could be affected by equity research analysts decisions whether to publish research or reports about us and our business or not. We cannot predict at this time whether any research analysts will publish research and reports on us and our common stock. If one or more equity analysts do cover us and our common stock and publish research reports about us, the price of our stock could decline if one or more securities analysts downgrade our stock or if those analysts issue other unfavorable commentary or cease publishing reports about us or our business.
If any of the analysts who elects to cover us downgrades our stock, our stock price could decline rapidly. If any of these analysts ceases coverage of us, we could lose visibility in the market, which in turn could cause our common stock price or trading volume to decline and our common stock to be less liquid.
Our dividend policy may change without notice, and our future ability to pay dividends is subject to restrictions.
Historically, our board of directors has declared quarterly dividends on our common stock, and we currently anticipate that following this offering, we will continue paying a quarterly dividend on our common stock in an amount equal to approximately $0.03 per share per quarter. However, we have no obligation to continue doing so and may change our dividend policy at any time without notice to holders of our common stock. Holders of our common stock are only entitled to receive such cash dividends as our board of directors, in its discretion, may declare out of funds legally available for such payments. Furthermore, consistent with our strategic plans, growth initiatives, capital availability, projected liquidity needs, and other factors, we have made, and will continue to make, capital management decisions and policies that could adversely impact the amount of dividends paid to holders of our common stock.
We are a separate and distinct legal entity from the Bank. We receive substantially all of our revenue from dividends paid to us by the Bank, which we use as the principal source of funds to pay our expenses and to pay dividends to our shareholders, if any. Various federal and/or state laws and regulations limit the amount of dividends that the Bank may pay us. If the Bank does not receive regulatory approval or does not maintain a level of capital sufficient to permit it to make dividend payments to us while maintaining adequate capital levels, our ability to pay our expenses and our business, financial condition or results of operations could be materially and adversely impacted.
As a bank holding company, we are subject to regulation by the Federal Reserve. The Federal Reserve has indicated that bank holding companies should carefully review their dividend policy in relation to the organization’s overall asset quality, current and prospective earnings and level, composition and quality of capital. The guidance provides that we inform and consult with the Federal Reserve prior to declaring and paying a dividend that exceeds earnings for the period for which the dividend is being paid or that could result in an adverse change to our capital structure, including interest on our debt obligations. If required payments on our debt obligations are not made or are deferred, or dividends on any preferred stock we may issue are not paid, we will be prohibited from paying dividends on our common stock.
Shares of certain shareholders may be sold into the public market in the near future. This could cause the market price of our common stock to drop significantly.
In connection with this offering, our directors, our executive officers and certain of our shareholders have entered into lock-up agreements that restrict the sale of their holdings of our common stock for a period of
49
Table of Contents
180 days from the date of this prospectus. The underwriters, in their discretion, may release any of the shares of our common stock subject to these lock-up agreements at any time without notice. In addition, after this offering, approximately [*] shares of our common stock that are currently issued and outstanding will not be subject to lock-up. The resale of such shares could cause the market price of our stock to drop significantly, and concerns that those sales may occur could cause the trading price of our common stock to decrease or to be lower than it might otherwise be.
Immediately following this offering, we intend to file a registration statement on Form S-8 registering under the Securities Act of 1933, as amended (the “Securities Act”), the shares of common stock reserved for issuance in respect of incentive awards issued under our 2013 Equity Based Compensation Plan. If a large number of shares are sold in the public market, the sales could reduce the trading price of our common stock. These sales also could impede our ability to raise future capital.
Our management will have broad discretion as to the use of proceeds from this offering, and we may not use the proceeds effectively.
We are not required to apply any portion of the net proceeds of this offering for any particular purpose. Accordingly, our management will have broad discretion as to the application of the net proceeds of this offering and could use them for purposes other than those contemplated at the time of this offering. A portion of the proceeds are expected to be used to support balance sheet growth and to provide additional capital as a cushion against minimum regulatory capital requirements, which may tend to reduce our return on equity compared to if such proceeds were used for further growth. Our shareholders may not agree with the manner in which our management chooses to allocate and invest the net proceeds. We may not be successful in using the net proceeds from this offering to increase our profitability or market value and we cannot predict whether the proceeds will be invested to yield a favorable return.
Failure to maintain effective internal controls over financial reporting could have a material adverse effect on our business and stock price.
As a private company, we are not currently required to comply with the rules of the SEC implementing Section 404 of the Sarbanes-Oxley Act and are therefore not required to make a formal assessment of the effectiveness of our internal control over financial reporting for that purpose. Upon becoming a public company after completion of this offering, we will be required to comply with the SEC’s rules implementing Sections 302 and 404 of the Sarbanes-Oxley Act, which will require management to certify financial and other information in our quarterly and annual reports and provide an annual management report on the effectiveness of controls over financial reporting. In particular, we will be required to certify our compliance with Section 404 of the Sarbanes-Oxley Act beginning with our second annual report on Form 10-K, which will require us to furnish annually a report by management on the effectiveness of our internal control over financial reporting. Furthermore, unless we remain an emerging growth company and elect additional transitional relief available to emerging growth companies, or we qualify as a smaller reporting company under applicable SEC rules, then our independent registered public accounting firm will be required to report on the effectiveness of our internal control over financial reporting, beginning as of that second annual report.
If we identify any material weaknesses in our internal control over financial reporting or are unable to comply with the requirements of Section 404 in a timely manner or assert that our internal control over financial reporting is effective, or if our independent registered public accounting firm is unable to express an opinion as to the effectiveness of our internal control over financial reporting once we are no longer an emerging growth company, investors, counterparties and customers may lose confidence in the accuracy and completeness of our financial statements and reports; our liquidity, access to capital markets and perceptions of our creditworthiness could be adversely affected; and the market price of our common stock could decline. In addition, we could become subject to investigations by the stock exchange on which our securities are listed, the SEC, Federal Reserve, FDIC, DBO or other regulatory authorities, which could require additional financial and management
50
Table of Contents
resources. These events could have an adverse effect on our business, financial condition and results of operations.
You will incur immediate dilution as a result of this offering.
The initial public offering price is substantially higher than the net tangible book value per share of our common stock. Investors purchasing common stock in this offering will pay a price per share that substantially exceeds the book value of our tangible assets after subtracting our liabilities. As a result, investors purchasing common stock in this offering will incur immediate dilution of $[*] per share, based on the assumed initial public offering price of $[*] (the mid-point of the price range set forth on the cover page of this prospectus). Further, investors purchasing common stock in this offering will contribute approximately [*]% of the total amount invested by stockholders since our inception, but will own only approximately [*]% of the shares of common stock outstanding after giving effect to this offering. As a result of the dilution to investors purchasing shares in this offering, investors may receive significantly less than the purchase price paid in this offering, if anything, in the event of our liquidation. For a further description of the dilution that you will experience immediately after this offering, see “Dilution.”
Future equity issuances could result in dilution, which could cause our common stock price to decline.
We are generally not restricted from issuing additional shares of our common stock, up to the 60,000,000 shares of common stock and 10,000,000 shares of preferred stock authorized in our articles of incorporation, which in each case could be increased by a vote of the holders of a majority of our shares. We may issue additional shares of our common stock in the future pursuant to current or future equity compensation plans, upon conversions of preferred stock or debt, upon exercise of warrants or in connection with future acquisitions or financings. If we choose to raise capital by selling shares of our common stock for any reason, the issuance would have a dilutive effect on the holders of our common stock and could have a material negative effect on the market price of our common stock.
We may issue shares of preferred stock in the future, which could make it difficult for another company to acquire us or could otherwise adversely affect holders of our common stock, which could depress the price of our common stock.
Although there are no shares of our preferred stock issued and outstanding as of March 31, 2018, our articles of organization authorize us to issue up to 10,000,000 shares of one or more series of preferred stock. The board also has the power, without shareholder approval, to set the terms of any series of preferred stock that may be issued, including voting rights, dividend rights, preferences over our common stock with respect to dividends or in the event of a dissolution, liquidation or winding up and other terms. In the event that we issue preferred stock in the future that has preference over our common stock with respect to payment of dividends or upon our liquidation, dissolution or winding up, or if we issue preferred stock with voting rights that dilute the voting power of our common stock, the rights of the holders of our common stock or the market price of our common stock could be adversely affected. In addition, the ability of our board of directors to issue shares of preferred stock without any action on the part of our shareholders may impede a takeover of us and prevent a transaction perceived to be favorable to our shareholders.
The holders of our debt obligations and preferred stock, if any, will have priority over our common stock with respect to payment in the event of liquidation, dissolution or winding up and with respect to the payment of interest and dividends.
In any liquidation, dissolution or winding up of the Company, our common stock would rank below all claims of debt holders against us as well as any preferred stock that has been issued. As of March 31, 2018, we did not have any outstanding subordinated notes, subordinated debt or preferred stock. However, the Company could incur such debt obligations or issue preferred stock in the future to raise additional capital. In such event, holders
51
Table of Contents
of our common stock would not be entitled to receive any payment or other distribution of assets upon the liquidation, dissolution or winding up of the Company until after all of the Company’s obligations to the debt holders were satisfied and holders of subordinated debt and senior equity securities, including preferred shares, if any, had received any payment or distribution due to them. In addition, we would be required to pay interest on the subordinated notes and dividends on the trust preferred securities and preferred stock before we would be able to pay any dividends on our common stock.
Provisions in our charter documents and California law may have an anti-takeover effect, and there are substantial regulatory limitations on changes of control of bank holding companies.
Provisions of our charter documents and the California General Corporation Law (the “CGCL”) could make it more difficult for a third-party to acquire us, even if doing so would be perceived to be beneficial by our shareholders. Furthermore, with certain limited exceptions, federal regulations prohibit a person, company or a group of persons deemed to be “acting in concert” from, directly or indirectly, acquiring more than 10% (5% if the acquirer is a bank holding company) of any class of our voting stock or obtaining the ability to control in any manner the election of a majority of our directors or otherwise direct the management or policies of the Company without prior notice or application to and the approval of the Federal Reserve. Accordingly, prospective investors need to be aware of and comply with these requirements, if applicable, in connection with any purchase of shares of our common stock. Moreover, the combination of these provisions effectively inhibits certain mergers or other business combinations, which, in turn, could adversely affect the market price of our common stock.
We are an “emerging growth company,” and the reduced regulatory and reporting requirements applicable to emerging growth companies may make our common stock less attractive to investors.
We are an “emerging growth company,” as described in the JOBS Act. For as long as we continue to be an emerging growth company, we may take advantage of reduced regulatory and reporting requirements that are otherwise generally applicable to public companies. These include, without limitation, not being required to comply with the auditor attestation requirements of Section 404(b) of the Sarbanes-Oxley Act, reduced financial reporting requirements, reduced disclosure obligations regarding executive compensation and exemptions from the requirements of holding non-binding advisory votes on executive compensation and golden parachute payments. The JOBS Act also permits an “emerging growth company” such as us to take advantage of an extended transition period to comply with new or revised accounting standards applicable to public companies. However, we have irrevocably “opted out” of this provision, and we will comply with new or revised accounting standards to the same extent that compliance is required for non-emerging growth companies.
We may take advantage of these provisions for up to five years, unless we earlier cease to be an emerging growth company, which would occur if our annual gross revenues exceed $1.07 billion, if we issue more than $1.0 billion in non-convertible debt in a three-year period, or if the market value of our common stock held by non-affiliates exceeds $700.0 million as of any June 30 before that time, in which case we would no longer be an emerging growth company as of the following December 31. Investors may find our common stock less attractive if we rely on the exemptions, which may result in a less active trading market and increased volatility in our stock price.
52
Table of Contents
CAUTIONARY NOTE REGARDING FORWARD-LOOKING STATEMENTS
This prospectus contains forward-looking statements which reflect our current views with respect to, among other things, future events and our financial performance. These statements are often, but not always, made through the use of words or phrases such as “may,” “might,” “should,” “could,” “predict,” “potential,” “believe,” “expect,” “continue,” “will,” “anticipate,” “seek,” “estimate,” “intend,” “plan,” “projection,” “goal,” “target,” “outlook,” “aim,” “would,” “annualized” and “outlook,” or the negative version of those words or other comparable words or phrases of a future or forward-looking nature. These forward-looking statements are not historical facts, and are based on current expectations, estimates and projections about our industry, management’s beliefs and certain assumptions made by management, many of which, by their nature, are inherently uncertain and beyond our control. Accordingly, we caution you that any such forward-looking statements are not guarantees of future performance and are subject to risks, assumptions, estimates and uncertainties that are difficult to predict. Although we believe that the expectations reflected in these forward-looking statements are reasonable as of the date made, actual results may prove to be materially different from the results expressed or implied by the forward-looking statements.
A number of important factors could cause our actual results to differ materially from those indicated in these forward-looking statements, including those factors identified in “Risk Factors” or “Management’s Discussion and Analysis of Financial Condition and Results of Operations” or the following:
| • | business and economic conditions, particularly those affecting the financial services industry and our primary market areas; |
| • | our ability to successfully manage our credit risk and the sufficiency of our allowance for loan loss; |
| • | factors that can impact the performance of our loan portfolio, including real estate values and liquidity in our primary market areas, the financial health of our commercial borrowers and the success of construction projects that we finance, including any loans acquired in acquisition transactions; |
| • | compliance with governmental and regulatory requirements, including the Dodd-Frank Act and others relating to banking, consumer protection, securities and tax matters; |
| • | the significant portion of our loan portfolio that is comprised of real estate loans; |
| • | our ability to attract and retain Korean-American customers; |
| • | our ability to identify and address cyber-security risks, fraud and systems errors; |
| • | our ability to effectively execute our strategic plan and manage our growth; |
| • | changes in our senior management team and our ability to attract, motivate and retain qualified personnel; |
| • | governmental monetary and fiscal policies, and changes in market interest rates; |
| • | liquidity issues, including fluctuations in the fair value and liquidity of the securities we hold for sale and our ability to raise additional capital, if necessary; |
| • | costs and obligations associated with operating as a public company; |
| • | effects of competition from a wide variety of local, regional, national and other providers of financial, investment and insurance services; |
| • | the impact of any claims or legal actions to which we may be subject, including any effect on our reputation; |
| • | changes in federal tax law or policy; and |
| • | risks related to this offering. |
The foregoing factors should not be construed as exhaustive and should be read together with the other cautionary statements included in this prospectus. Because of these risks and other uncertainties, our actual future
53
Table of Contents
results, performance or achievement, or industry results, may be materially different from the results indicated by the forward looking statements in this prospectus. In addition, our past results of operations are not necessarily indicative of our future results. You should not rely on any forward looking statements, which represent our beliefs, assumptions and estimates only as of the dates on which they were made, as predictions of future events. Any forward-looking statement speaks only as of the date on which it is initially made, and we do not undertake any obligation to update or review any forward-looking statement, whether as a result of new information, future developments or otherwise.
54
Table of Contents
Assuming an initial public offering price of $[*] per share, which is the midpoint of the offering price range set forth on the cover page of this prospectus, we estimate that the net proceeds to us from this offering, after deducting underwriting discounts and estimated offering expenses, will be approximately $[*] million (or approximately $[*] million if the underwriters exercise their option to purchase additional shares from us in full).
Each $1.00 increase (decrease) in the assumed initial public offering price would increase (decrease) the net proceeds to us from this offering by $[*] million, (or $[*] million if the underwriters elect to exercise in full their option to purchase additional shares), assuming the number of shares we sell, as set forth on the cover of this prospectus, remains the same, after deducting the underwriting discounts and estimated offering expenses.
We intend to contribute $[*] million of the net proceeds that we receive from this offering to the Bank to support balance sheet growth and to provide additional capital as a cushion against minimum regulatory capital requirements, and to use the remainder for general corporate purposes, which could include future organic growth and other strategic initiatives. See “Business.” We do not have any current specific plan for such remaining net proceeds, and do not have any current plans, arrangements or understandings to make any material acquisitions or to establish any de novo bank branches. Our management will retain broad discretion to allocate the net proceeds of this offering. The precise amounts and timing of our use of the proceeds will depend upon market conditions, among other factors.
55
Table of Contents
The following table shows our capitalization and regulatory capital ratios as of March 31, 2018, on an actual basis and on an as adjusted basis after giving effect to the net proceeds from the sale by us of [*] shares of our common stock at an assumed public offering price of $[*] per share, which is the midpoint of the price range on the cover of this prospectus, after deducting underwriting discounts and estimated offering expenses. You should read the following table in conjunction with the sections titled “Summary Historical Consolidated Financial Data,” “Selected Historical Consolidated Financial Data” and “Management’s Discussion and Analysis of Financial Condition and Results of Operations,” and our consolidated financial statements and related notes appearing elsewhere in this prospectus. This table assumes the underwriters do not exercise their option to purchase additional shares from us.
| As of March 31, 2018 | ||||||||
| Actual | As Adjusted(3) |
|||||||
| (Dollars in thousands) | (unaudited) | |||||||
| Shareholders’ equity |
||||||||
| Common stock, no par value, 60,000,000 shares authorized, 13,424,777 shares outstanding actual and [*] shares outstanding as adjusted(1) |
$ | 125,511 | ||||||
| Additional paid in capital |
3,072 | |||||||
| Retained earnings |
20,898 | |||||||
| Accumulated other comprehensive loss |
(2,248 | ) | ||||||
|
|
|
|
|
|||||
| Total shareholders’ equity |
$ | 147,233 | ||||||
|
|
|
|
|
|||||
| Capital ratios (Pacific City Bank): |
||||||||
| Common tier 1 capital (to risk-weighted assets) |
12.3 | % | ||||||
| Total capital (to risk-weighted assets) |
13.3 | % | ||||||
| Tier 1 capital (to risk-weighted assets) |
12.3 | % | ||||||
| Tier 1 capital (to average assets) |
10.0 | % | ||||||
| Tangible common equity to tangible assets(2) |
9.3 | % | ||||||
| Capital ratios (Pacific City Financial Corporation): |
||||||||
| Common tier 1 capital (to risk-weighted assets) |
12.3 | % | ||||||
| Total capital (to risk-weighted assets) |
13.4 | % | ||||||
| Tier 1 capital (to risk-weighted assets) |
12.3 | % | ||||||
| Tier 1 capital (to average assets) |
10.1 | % | ||||||
| Tangible common equity to tangible assets(2) |
9.3 | % | ||||||
| (1) | References in this section to the number of shares of our common stock outstanding after this offering are based on shares of our common stock issued and outstanding as of March 31, 2018. Unless otherwise noted, these references exclude any shares reserved for issuance under the 2013 Equity Based Compensation Plan. |
| (2) | Tangible common equity ratio is a non-GAAP financial measure. The tangible common equity ratio is defined as the ratio of tangible common equity divided by total assets less goodwill and other intangible assets. For a reconciliation of the non-GAAP measure to the most directly comparable GAAP financial measure, please see “Non-GAAP Financial Measures.” |
| (3) | A $1.00 increase (decrease) in the assumed initial public offering price of $[*] per share (which is the midpoint of the price range on the cover of this prospectus) would increase (decrease) each of [*], common stock, total shareholders’ equity and total capitalization by $[*] million, assuming that the number of shares offered by us, as set forth on the cover of this prospectus, remains the same, and after deducting the underwriting discounts and commissions and estimated expenses. If the underwriters’ option to purchase additional shares is exercised in full, the pro forma as adjusted amount of each of [*], common stock, total shareholders’ equity and total capitalization would increase by approximately $[*] million, after deducting underwriting discounts and commissions and estimated expenses. |
56
Table of Contents
If you purchase shares of our common stock in this offering, your ownership interest will experience immediate book value dilution to the extent the public offering price per share exceeds our net tangible book value per share immediately after this offering. Net tangible book value per share represents the amount of our total tangible assets less our total liabilities, divided by the number of shares of common stock outstanding.
Our net tangible book value at March 31, 2018 was $147.2 million, or $10.97 per share based on the number of shares outstanding as of such date. After giving effect to our sale of [*] shares in this offering at an assumed public offering price of $[*] per share, which is the midpoint of the price range on the cover of this prospectus, and after deducting underwriting discounts and estimated offering expenses, our as adjusted net tangible book value at March 31, 2018 would have been approximately $[*] million, or $[*] per share. Therefore, this offering will result in an immediate increase of $[*] in the net tangible book value per share to our existing shareholders, and immediate dilution of $[*] in the net tangible book value per share to investors purchasing shares in this offering. The following table illustrates this per share dilution, based on the assumptions above.
| Assumed initial public offering price per share |
$ | |||||||
| Net tangible book value per share at March 31, 2018 |
$ | 10.97 | ||||||
| Increase in net tangible book value per share attributable to this offering |
||||||||
|
|
|
|||||||
| As adjusted net tangible book value per share after this offering |
||||||||
|
|
|
|||||||
| Dilution in net tangible book value per share to new investors |
$ | |||||||
|
|
|
A $1.00 increase (decrease) in the assumed public offering price of $[*] per share, which is the midpoint of the price range on the cover of this prospectus, would increase (decrease) our net tangible book value by $[*] million, or $[*] per share, and the dilution to new investors by $[*] per share, assuming no change to the number of shares offered by us as set forth on the cover of this prospectus, and after deducting underwriting discounts and estimated offering expenses.
If the underwriters exercise their option to purchase additional shares from us in full, the as adjusted net tangible book value after giving effect to this offering would be $[*] per share. This represents an increase in net tangible book value of $[*] per share to existing shareholders and dilution of $[*] per share to new investors.
The following table sets forth information regarding the shares issued to, and consideration paid by, our existing shareholders and the shares to be issued to, and consideration to be paid by, investors in this offering at an assumed public offering price of $[*] per share, which is the midpoint of the price range on the cover of this prospectus, before deducting underwriting discounts and estimated offering expenses.
| Shares purchased | Total consideration | Average price per share |
||||||||||||||||||
| Number | Percent | Amount (in thousands) |
Percent | |||||||||||||||||
| Shareholders as of March 31, 2018 |
% | $ | — | — | % | $ | — | |||||||||||||
| Investors in this offering |
||||||||||||||||||||
|
|
|
|
|
|
|
|
|
|
|
|||||||||||
| Total |
100.0 | % | $ | 100 | % | $ | ||||||||||||||
The tables above exclude 906,160 shares of common stock issuable upon exercise of stock options outstanding at March 31, 2018 at a weighted average exercise price of $9.27 per share. The table above excludes 633,450 shares of our common stock reserved for future grants under our 2013 Equity Based Compensation Plan discussed in more detail below. To the extent that such options are exercised, or other equity awards are issued, investors participating in the offering will experience further dilution.
57
Table of Contents
We may choose to raise additional capital through the sale of equity or convertible debt securities due to market conditions or strategic considerations even if we believe we have sufficient funds for our current or future operating plans. To the extent we issue additional shares of common stock or other equity or convertible debt securities in the future, there will be further dilution to investors participating in this offering.
58
Table of Contents
The common stock of the Company is quoted on the OTC Pink Market, under the symbol “PFCF.” The following table shows the high and low bid quotations of the common stock in each of the previous eight quarters. There may also have been transactions at prices other than those shown during that time. The market for our common stock is sporadic and at times very limited.
The Historical Bid Quotations of the Common Stock
| Quarters Ending |
High | Low | ||||||
| Third Quarter 2018, July 1 through July 20 |
$ | 17.70 | $ | 17.00 | ||||
| Second Quarter 2018 |
$ | 18.00 | $ | 14.90 | ||||
| First Quarter 2018 |
$ | 15.50 | $ | 14.60 | ||||
| Fourth Quarter 2017 |
$ | 15.50 | $ | 13.50 | ||||
| Third Quarter 2017 |
$ | 14.75 | $ | 13.50 | ||||
| Second Quarter 2017 |
$ | 14.90 | $ | 13.40 | ||||
| First Quarter 2017 |
$ | 14.25 | $ | 12.50 | ||||
| Fourth Quarter 2016 |
$ | 13.50 | $ | 11.37 | ||||
| Third Quarter 2016 |
$ | 11.50 | $ | 11.37 | ||||
| Second Quarter 2016 |
$ | 11.50 | $ | 10.50 | ||||
On March 31, 2018, we had approximately 397 record holders of our common stock. There has been no regular and liquid trading market for the common stock. We have applied to list our common stock on the Nasdaq Global Market under the symbol “PCB”. Assuming our common stock is listed for trading on the Nasdaq Global Market, the quoting of our shares on the OTC Pink Market will be discontinued upon or prior to the completion of this offering.
Dividend Policy
Our shareholders are entitled to receive dividends only if, when and as declared by our board of directors and out of funds legally available therefore. It has been our policy to pay quarterly dividends to holders of our common stock, and we intend to generally maintain our current dividend levels. We currently intend to continue paying quarterly dividends. However, our board of directors may change or eliminate the payment of future dividends at its discretion, without notice to our shareholders. Any future determination to pay dividends to holders of our common stock will depend on our results of operations, financial condition, capital requirements, banking regulations, payment of dividends on our preferred stock, contractual restrictions and any other factors that our board of directors may deem relevant. Our profitability and regulatory capital ratios, in addition to other financial conditions, will be key factors in determining the payment of dividends.
The following table shows recent quarterly dividends on our common stock during the periods indicated, as adjusted for stock splits and dividends.
| Quarterly Period |
Amount Per Share |
Payment Date | ||
| Second Quarter 2018 |
$0.030 | June 15, 2018 | ||
| First Quarter 2018 |
$0.030 | March 15, 2018 | ||
| Fourth Quarter 2017 |
$0.030 | December 15, 2017 | ||
| Third Quarter 2017 |
$0.030 | September 15, 2017 | ||
| Second Quarter 2017 |
$0.030 | June 15, 2017 | ||
| First Quarter 2017 |
$0.030 | March 15, 2017 | ||
| Fourth Quarter 2016 |
$0.027 | December 15, 2016 | ||
| Third Quarter 2016 |
$0.027 | September 15, 2016 | ||
| Second Quarter 2016 |
$0.027 | June 20, 2016 | ||
| First Quarter 2016 |
$0.027 | March 17, 2016 |
59
Table of Contents
Dividend Restrictions
As a bank holding company, our ability to pay dividends is affected by the policies and enforcement powers of the Federal Reserve. In addition, because we are a holding company, we are dependent upon the payment of dividends by the Bank to us as our principal source of funds to pay dividends in the future, if any, and to make other payments. The Bank is also subject to various legal, regulatory and other restrictions on its ability to pay dividends and make other distributions and payments to us. See “Supervision and Regulation—The Bank—Dividend Payments.”
60
Table of Contents
MANAGEMENT’S DISCUSSION AND ANALYSIS OF FINANCIAL CONDITION
AND RESULTS OF OPERATIONS
The following discussion and analysis of our financial condition and results of operations should be read in conjunction with the “Selected Historical Consolidated Financial Data” and our consolidated financial statements and related notes included elsewhere in this prospectus. This discussion and analysis contains forward-looking statements that involve risks, uncertainties and assumptions. Certain risks, uncertainties and other factors, including but not limited to those set forth under “Cautionary Note Regarding Forward-Looking Statements,” “Risk Factors” and elsewhere in this prospectus, may cause actual results to differ materially from those projected in the forward looking statements. We assume no obligation to update any of these forward-looking statements. For the purpose of this section, references to “we,” “our,” “Pacific City” or the “Company” means Pacific City Financial Corporation on a consolidated basis with the Bank.
Our Company
Pacific City Financial Corporation is a bank holding company headquartered in Los Angeles, California. We offer a full range of commercial banking and, to a lesser extent, consumer financial services through our wholly-owned subsidiary, Pacific City Bank, a California state-chartered bank operating as a single segment.
We primarily focus our business in Korean communities in Southern California and to a lesser extent the New York City metro area. We offer our banking services through our network of eleven full-service branches in Southern California and two full-service branches in New Jersey and New York. We also operate ten LPOs that are located in Irvine and Los Angeles, California; Lynnwood and Bellevue, Washington; Annandale, Virginia; Chicago, Illinois; Atlanta, Georgia; Aurora, Colorado; Bayside, New York; and Dallas, Texas that focus on the origination of SBA Section 7(a) and 504 loans. Our customers are typically individuals, professionals and small to medium-sized businesses in our market areas. We accept deposits and originate a variety of loans including commercial and industrial loans, commercial property loans, residential property loans, international loans and consumer loans. Our SBA lending involves both commercial and industrial and commercial property lending.
Our principal business involves earning interest on loans and investment securities that are funded by customer deposits and other borrowings. Our operating income and net income are derived primarily from the difference between interest income received from interest-earning assets and interest expense paid on interest-bearing liabilities and, to a lesser extent, from fees received in connection with servicing loan and deposit accounts and income from the sale of SBA and residential property loans. Our operating expenses are the interest we pay on deposits and borrowings, provisions for loan losses and general operating expenses, which primarily consist of salaries and employee benefits, occupancy and equipment and, to a lesser extent, general and administrative expenses. Interest rates are highly sensitive to many factors that are beyond our control, such as changes in the national economy and in the related monetary policies of the Federal Reserve, inflation, unemployment, consumer spending and political events. We cannot predict the impact that these factors and future changes in domestic and foreign economic and political conditions might have on our performance.
We have a significant business and geographic concentration in the Korean communities in Southern California and our results are affected by economic conditions in these areas and, to a lesser extent, in Korea, as certain of our customers’ businesses are influenced by the flow of funds, imports and exports and other trading activity with Korea. A decline in economic and business conditions in our market areas and in Korea could have a material impact on the quality of our loan portfolio or the demand for our products and services, which in turn may have a material adverse effect on our results of operations.
As of March 31, 2018 and December 31, 2017, the Company had total consolidated assets of $1.6 billion and $1.4 billion, respectively, total consolidated deposits of $1.4 billion and $1.3 billion, respectively, and total consolidated shareholders’ equity of $147.2 million and $142.2 million, respectively.
61
Table of Contents
Primary Factors Affecting Comparability
Each factor listed below materially affects the comparability of our results of operations for the years ended December 31, 2017, 2016 and 2015 and financial condition at December 31, 2017, 2016, 2015, 2014 and 2013, as well as our results of operations for the three months ended March 31, 2018 and 2017, and financial condition at March 31, 2018, and may affect the comparability of financial information we report in future fiscal periods.
Capital Transactions. During August 2016, the Company issued 1,400,300 shares at a share price of $10.91 per share to accredited investors through a private placement for total cash proceeds of $15.2 million, net of related expenses.
Primary Factors Used to Evaluate Our Business
Results of operations. In addition to net income, the primary factors we use to evaluate and manage our results of operations include net interest income, noninterest income and noninterest expense.
Net interest income. Net interest income represents interest income less interest expense. We generate interest income from interest, dividends and fees received on interest-earning assets, including loans and investment securities we own. We incur interest expense from interest paid on interest-bearing liabilities, including interest-bearing deposits, borrowings and other forms of indebtedness. Net interest income typically is the most significant contributor to our revenues and net income. To evaluate net interest income, we measure and monitor: (i) yields on our loans and other interest-earning assets; (ii) the costs of our deposits and other funding sources; (iii) our net interest spread; (iv) our net interest margin; and (v) our provisions for loan losses. Net interest spread is the difference between rates earned on interest-earning assets and rates paid on interest-bearing liabilities. Net interest margin is calculated as the annualized net interest income divided by average interest-earning assets. Because noninterest-bearing sources of funds, such as noninterest-bearing deposits and shareholders’ equity, also fund interest-earning assets, net interest margin includes the benefit of these noninterest-bearing sources.
Changes in market interest rates and interest we earn on interest-earning assets or pay on interest-bearing liabilities, as well as the volume and types of interest-earning assets, interest-bearing and noninterest-bearing liabilities and shareholders’ equity, usually have the largest impact on periodic changes in our net interest spread, net interest margin and net interest income. We measure net interest income before and after the provision for loan losses.
Noninterest income. Noninterest income consists of, among other things: (i) service charges, fees and other, including trade finance fees; (ii) gains on sale of loans; (iii) loan servicing income; (vi) gains on sales of securities; and (vii) gains on sales of OREO.
Our income from service charges on deposit accounts is largely impacted by the volume, growth and type of deposits we hold, which are impacted by prevailing market conditions for our deposit products, our marketing efforts and other factors.
Our gains on sale of loans are primarily from sales of residential property loans and SBA loans. Our gains on sale of loans may be effected by changes in interest rates and general market conditions. Our servicing income, which we report net of amortization of servicing assets and changes in the valuation allowance, is also primarily from our SBA and residential property loan servicing portfolio. Our servicing income, may be affected by interest rate changes. Typically, when interest rates decrease, residential property loans pay off faster, resulting in a decrease in servicing income. The opposite is true with SBA loans, as increases in interest rates result in faster SBA loans payoffs, and decrease in servicing income from the existing SBA loan servicing portfolio.
Our gains on sales of securities is income from the sale of securities within our securities portfolio and is dependent on Treasury interest rates. As Treasury rates increase, our security portfolio decreases in market value and as Treasury rates decrease, our securities portfolio increases in value. Our gain on sale of OREO reflects the
62
Table of Contents
selling price of repossessed real estate collateral, reduced by the book value of the asset and selling cost. Gains on OREO are dependent on the current real estate market and the number of repossessed properties.
Noninterest expense. Noninterest expense includes, among other things: (i) salaries and employee benefits; (ii) occupancy and equipment expenses; (iii) data processing expense; (iv) legal and professional expenses; (v) office expenses; (vi) marketing and business promotion expense; (vii) insurance and regulatory assessments; (ix) OREO expenses, net of income; and (x) other expenses.
Salaries and employee benefits includes compensation, employee benefits and tax expenses for our personnel. Occupancy expense includes depreciation expense on our owned properties, lease expense on our leased properties and other occupancy-related expenses. Equipment expense includes furniture, fixtures and equipment related expenses. Data processing expenses include expenses paid to our third-party data processing system provider and other data service providers. Legal and professional fees include legal, accounting, consulting and other outsourcing arrangements. Office expenses include telephone, office supplies and postage and delivery expenses. Marketing and business promotion expense includes costs for advertising, promotions and sponsorships. Insurance and regulatory assessments includes FDIC insurance premiums, DBO fees and corporate insurance premiums. OREO expenses are expenses to maintain OREO properties or prepare such properties for sale, net of any income generated from such properties. Other expenses include expenses associated with travel, meals, training, and directors fees. Noninterest expenses generally increase as we grow our business. Noninterest expenses have increased significantly over the past few years as we have grown organically, and as we have built out and modernized our operational infrastructure and implemented our plan to build an efficient banking operation with significant capacity for growth.
Primary Factors Used to Evaluate Our Financial Condition
The primary factors we use to evaluate and manage our financial condition include asset quality, capital and liquidity.
Asset Quality. We manage the diversification and quality of our assets based upon factors that include the level, distribution, severity and trend of problem, classified, delinquent, nonaccrual, nonperforming and restructured assets, the adequacy of our allowance for loan losses, or Allowance, the diversification and quality of loan and investment portfolios, the extent of counterparty risks, credit risk concentrations and other factors.
Capital. Financial institution regulators have established guidelines for minimum capital ratios for banks, thrifts and bank holding companies. During the first quarter of 2015, we adopted the new Basel III regulatory capital framework as approved by federal banking agencies, which are subject to a multi-year phase-in period. The adoption of this new framework modified the calculation of the various capital ratios, added a new ratio, common equity Tier 1, and revised the adequately and well capitalized thresholds. In addition, Basel III establishes a new capital conservation buffer of 2.5% of risk-weighted assets, which is phased-in over a four-year period beginning January 1, 2016. Our capital ratios at December 31, 2017 exceeded all of the current well-capitalized regulatory requirements.
We manage capital based upon factors that include: (i) the level and quality of capital and our overall financial condition; (ii) the trend and volume of problem assets; (iii) the adequacy of discounts and reserves; (iv) the level and quality of earnings; (v) the risk exposures in our balance sheet; (vi) the levels of Tier 1 and total capital; (vii) the Tier 1 capital ratio, the total capital ratio, the Tier 1 leverage ratio, and the common equity Tier 1 capital ratio; and (viii) other factors.
Liquidity. Our deposit base consists primarily of business accounts and deposits from the principals of such businesses. As a result, we have many depositors with balances over $250,000 (See “Management’s Discussion and Analysis of Financial Condition and Results of Operations—Loan Quality—Deposits”). We manage
63
Table of Contents
liquidity based upon factors that include the amount of core deposit relationships as a percentage of total deposits, the level of diversification of our funding sources, the allocation and amount of our deposits among deposit types, the short-term funding sources used to fund assets, the amount of non-deposit funding used to fund assets, the availability of unused funding sources, off-balance sheet obligations, the availability of assets to be readily converted into cash without undue loss, the amount of cash and liquid securities we hold, the re-pricing characteristics and maturities of our assets when compared to the re-pricing characteristics of our liabilities and other factors.
Material Trends and Developments
We believe the following trends and developments are material to an understanding of our business, financial condition and results of operations.
Economic and Interest Rate Environment. The results of our operations are highly dependent on economic conditions and market interest rates. Beginning in 2007, turmoil in the financial sector resulted in a reduced level of confidence in financial markets among borrowers, lenders and depositors, as well as extreme volatility in the capital and credit markets. In response to these conditions, the Federal Reserve began decreasing short-term interest rates, with eleven consecutive decreases totaling 525 basis points between September 2007 and December 2008. Since the recession ended in 2009, the economic conditions in the U.S. and our primary market areas have improved. Economic growth has been modest, the real estate market continues to recover and unemployment rates in the U.S. and our primary markets have significantly improved. The Federal Reserve has maintained historically low interest rates since their last decrease in December 2008. Since December 16, 2015, the Federal Reserve raised short-term interest rates with six 25-basis point increases from 0.25% in December 2015 to 1.75% as of March 31, 2018.
Our profitability is highly dependent on the difference between our interest income and our interest expense. Additionally, we obtain a significant portion of noninterest income through our debit card and cash management solutions business. These factors are influenced by both the pricing and mix of interest-earning assets and interest-bearing liabilities which, in turn, are impacted by external factors such as local economic conditions, competition for loans and deposits, the monetary policy of the Federal Reserve and market interest rates.
We anticipate that longer term interest rates will continue to increase over the historic lows experienced since the financial crisis. Based on our asset sensitivity, we believe that as rates increase, we will generate incrementally more interest income than the increased interest expense required to maintain our deposits and funding sources. While historical trends in rising rate environments can be used as a potential indicator for the necessity and pace of deposit repricing, deposit repricing may be required to occur more quickly and perhaps at greater levels than would have been experienced historically.
Community Banking. We believe the most important trends affecting community banks in the U.S. over the foreseeable future will be related to heightened regulatory capital requirements, increasing regulatory burdens generally, including the continuing implementation of the Dodd-Frank Act and the regulations to be promulgated thereunder, with some potential relief under the recently enacted Economic Growth, Regulatory Relief and Consumer Protection Act, and continuing interest margin compression. Despite recent legislative efforts, we expect that community banks will face increased competition for lower cost capital as a result of regulatory policies that may offer larger financial institutions greater access to government assistance than is available for smaller institutions, including community banks. We expect that troubled community banks will continue to face significant challenges when attempting to raise capital. We also believe that heightened regulatory capital requirements will make it more difficult for even well-capitalized, healthy community banks to grow in their communities by taking advantage of opportunities in their markets that result as the economy improves. We believe these trends will favor community banks that have sufficient capital, a diversified business model and a strong deposit franchise, and we believe we possess these characteristics.
We also believe that increased regulatory burdens will have a significant adverse effect on smaller community banks, which often lack the personnel, experience and technology to efficiently comply with new regulations in a
64
Table of Contents
variety of areas in the banking industry, including in the areas of deposits, lending, compensation, information security and overdraft protection. We believe the increased costs to smaller community banks from a more complex regulatory environment, coupled with challenges in the real estate lending area, present attractive opportunities for larger community banks that have already made significant investments in regulatory compliance and risk management and can acquire and quickly integrate customers from these smaller institutions into their existing platform. Furthermore, we believe that, as a result of our significant operational investments, we are well positioned to capitalize on the challenges facing smaller community banks.
Regulatory Environment. President Trump recently signed into law the Economic Growth, Regulatory Relief and Consumer Protection Act which offers potential to provide regulatory relief to community banks with total assets of less than $10 billion and to banks between $50 and $250 billion that are currently classified as systemically important financial institutions (“SIFIs”) and subject to additional regulation and stress testing under the Comprehensive Capital Analysis and Review (“CCAR”) framework. This new law may provide some substantial regulatory relief to community banks, but it is too early to measure the impacts of the law.
The Dodd-Frank Act and Basel III, as well as regulatory changes resulting from becoming a publicly traded company, may cause us to be subject to more restrictive capital requirements, more stringent asset concentration and growth limitations and new and potentially heightened examination and reporting requirements. We also expect to face a more challenging environment for customer loan demand due to the increased costs that could be ultimately borne by borrowers, and to incur higher costs to comply with these new regulations. This uncertain regulatory environment could have a detrimental impact on our ability to manage our business consistent with historical practices and cause difficulty in executing our growth plan. See “Risk Factors—Risks Related to Our Business” and “Supervision and Regulation.”
Economic Conditions. Our business and financial performance are affected by economic conditions generally in the U.S. The significant economic factors that are most relevant to our business and our financial performance include general economic conditions in the U.S., unemployment rates, real estate markets and interest rates.
In particular, commercial real estate markets have been experiencing substantial growth, and increased competitive pressures have contributed significantly to historically low capitalization rates and rising property values. Accordingly, a downturn in the real estate market and a challenging business and economic environment may increase our risk related to multifamily and commercial real estate loans. If we see negative economic conditions develop in the U.S. as a whole, we could experience higher delinquencies and loan charge-offs, which would reduce our net income and adversely affect our financial condition. Furthermore, to the extent that real estate collateral is obtained through foreclosure, the costs of holding and marketing the real estate collateral, as well as the ultimate values obtained from disposition, could reduce our earnings and adversely affect our financial condition.
General and Administrative Expenses. We expect to continue incurring increased noninterest expense attributable to general and administrative expenses, expenses related to building out and modernizing our operational infrastructure, marketing and other administrative expenses to execute our strategic initiatives, costs associated with establishing de novo branch facilities, expenses to hire additional personnel and other costs required to continue our growth.
Banking Laws and Regulations. The Bank is a commercial bank organized under the laws of the State of California. It is not a member of the Federal Reserve System and its deposits are insured by the FDIC up to applicable legal limits. Pacific City Financial Corporation is a bank holding company, due to its control of the Bank, and is therefore subject to the requirements of the Bank Holding Company Act of 1956, as amended (“BHCA”), and regulation and supervision by the Federal Reserve. The Company files reports with and is subject to periodic examination by the Federal Reserve. Any adverse finding from supervisory reviews of these operations could, among other things, reduce the Company’s ability to receive regulatory approvals for acquisitions or new branch openings. This could have a material adverse effect on our business, financial condition, results of operations and growth prospects.
65
Table of Contents
The current operating environment also has heightened supervisory expectations in areas such as consumer compliance, the Bank Secrecy Act and anti-money laundering compliance, risk management and internal audit. As a result of these heightened expectations, we expect to incur additional costs for additional compliance, risk management and audit personnel or professional fees associated with advisors and consultants. See “Supervision and Regulation—The Bank.”
Credit Trends and Uncertainties. We control credit risk both through disciplined underwriting of each transaction, as well as active credit management processes and procedures to manage risk and minimize loss throughout the life of a transaction. We seek to maintain a broadly diversified loan portfolio in terms of type of customer, type of loan product, geographic area and industries in which our business customers are engaged. However, credit trends and uncertainties in the markets in which we operate and in our loan portfolio can materially impact our financial condition and performance and are primarily driven by the economic conditions in our markets.
Competition. Our profitability and growth are affected by the highly competitive nature of the financial services industry. We compete with commercial banks, savings banks, credit unions, non-bank financial services companies and other financial institutions operating within the areas we serve, particularly with national and regional banks that often have more resources than we do to invest in growth and technology and community banks with strong local ties, all of which target the same clients we do. Recently, we have seen increased competitive pressures on loan rates and terms and increased competition for deposits. Continued loan pricing pressure may continue to negatively affect our financial results in the future.
Income Tax. On December 22, 2017, the U.S. Congress enacted the Tax Reform Act, which had a material impact on our net income. The Tax Reform Act, among other things, (i) permanently reduces the U.S. corporate income tax rate to 21% beginning in 2018, (ii) repealed the corporate alternative minimum tax (“AMT”) allowing for corresponding refunds of prior period AMT credits, (iii) provides for a five year period of 100% bonus depreciation followed by a phase-down of the bonus depreciation percentage, and (iv) imposes a new limitation on the utilization of net operating losses generated in taxable years beginning after December 31, 2017.
The Tax Reform Act is complex and far-reaching and the ultimate impact of the Tax Reform Act may differ from our estimates due to changes in interpretations and assumptions made by us as well as additional regulatory guidance that may be issued.
66
Table of Contents
Results of Operations—Comparison of Results of Operations for the Three Months Ended March 31, 2018 to March 31, 2017
Average Balance Sheet, Net Interest Income and Yield/Rate Analysis
The following table presents average balance sheet information, interest income, interest expense and the corresponding average yields earned and rates paid for the three months ended March 31, 2018 and 2017. The average balances are daily averages and, for loans, include both performing and nonperforming balances. Interest income on loans includes the effects of discount accretion and net deferred loan origination costs accounted for as yield adjustments.
| Three Months Ended March 31, | ||||||||||||||||||||||||
| 2018 | 2017 | |||||||||||||||||||||||
| (Dollars in thousands) | Average Balances |
Interest Income/ Expense |
Average Yield/ Rate |
Average Balances |
Interest Income/ Expense |
Average Yield/ Rate |
||||||||||||||||||
| Interest-earning assets: |
||||||||||||||||||||||||
| Total loans, net of deferred loan fees and costs(1) |
$ | 1,219,867 | $ | 17,440 | 5.80 | % | $ | 1,055,843 | $ | 13,877 | 5.33 | % | ||||||||||||
| U.S. government agencies |
24,350 | 137 | 2.28 | % | 22,701 | 130 | 2.32 | % | ||||||||||||||||
| Mortgage backed securities |
67,484 | 391 | 2.35 | % | 49,129 | 220 | 1.82 | % | ||||||||||||||||
| Collateralized mortgage obligation |
50,974 | 280 | 2.23 | % | 23,657 | 110 | 1.89 | % | ||||||||||||||||
| Municipal securities tax exempt(2) |
6,583 | 40 | 2.46 | % | 8,794 | 48 | 2.21 | % | ||||||||||||||||
| Interest-bearing deposits in other banks |
57,392 | 222 | 1.57 | % | 53,007 | 106 | 0.81 | % | ||||||||||||||||
| Federal Home Loan Bank and other bank stock |
6,589 | 118 | 7.26 | % | 5,686 | 126 | 8.99 | % | ||||||||||||||||
|
|
|
|
|
|
|
|
|
|||||||||||||||||
| Total interest-earning assets |
1,433,239 | 18,628 | 5.27 | % | 1,218,817 | 14,617 | 4.86 | % | ||||||||||||||||
|
|
|
|
|
|
|
|
|
|||||||||||||||||
| Noninterest-earning assets: |
||||||||||||||||||||||||
| Cash and cash equivalents |
20,329 | 16,945 | ||||||||||||||||||||||
| Allowances for loan losses |
(12,366 | ) | (11,479 | ) | ||||||||||||||||||||
| Other assets |
26,746 | 27,455 | ||||||||||||||||||||||
|
|
|
|
|
|||||||||||||||||||||
| Total noninterest earning assets |
34,709 | 32,921 | ||||||||||||||||||||||
|
|
|
|
|
|||||||||||||||||||||
| Total assets |
$ | 1,467,948 | $ | 1,251,738 | ||||||||||||||||||||
|
|
|
|
|
|||||||||||||||||||||
| Interest-bearing liabilities: |
||||||||||||||||||||||||
| Deposits: |
||||||||||||||||||||||||
| MMDA and Super NOW |
$ | 297,947 | 760 | 1.03 | % | $ | 322,261 | 776 | 0.98 | % | ||||||||||||||
| Savings |
8,632 | 6 | 0.28 | % | 8,713 | 6 | 0.28 | % | ||||||||||||||||
| Time deposits |
654,124 | 2,400 | 1.49 | % | 508,411 | 1,365 | 1.09 | % | ||||||||||||||||
| Borrowings |
40,000 | 168 | 1.70 | % | — | — | 0.00 | % | ||||||||||||||||
|
|
|
|
|
|
|
|
|
|||||||||||||||||
| Total interest-bearing liabilities |
1,000,703 | 3,334 | 1.35 | % | 839,385 | 2,147 | 1.04 | % | ||||||||||||||||
|
|
|
|
|
|
|
|
|
|||||||||||||||||
| Noninterest-bearing liabilities: |
||||||||||||||||||||||||
| Demand deposits |
313,660 | 275,151 | ||||||||||||||||||||||
| Other liabilities |
8,384 | 7,690 | ||||||||||||||||||||||
|
|
|
|
|
|||||||||||||||||||||
| Total noninterest-bearing liabilities |
322,044 | 282,841 | ||||||||||||||||||||||
|
|
|
|
|
|||||||||||||||||||||
| Total liabilities |
1,322,747 | 1,122,226 | ||||||||||||||||||||||
| Shareholders’ equity |
145,201 | 129,512 | ||||||||||||||||||||||
|
|
|
|
|
|||||||||||||||||||||
| Total liabilities and shareholders’ equity |
$ | 1,467,948 | $ | 1,251,738 | ||||||||||||||||||||
|
|
|
|
|
|||||||||||||||||||||
| Net interest income |
$ | 15,294 | $ | 12,470 | ||||||||||||||||||||
|
|
|
|
|
|||||||||||||||||||||
| Cost of funds |
1.03 | % | 0.78 | % | ||||||||||||||||||||
| Net interest spread(3) |
3.92 | % | 3.82 | % | ||||||||||||||||||||
| Net interest margin(4) |
4.33 | % | 4.15 | % | ||||||||||||||||||||
| (1) | Average balance includes loans held-for-sale and nonaccrual loans. Net amortization of deferred loan fees (cost) of $130 thousand and $134 thousand are included in the interest income for the three months ended March 31, 2018 and 2017, respectively. |
67
Table of Contents
| (2) | The yield on municipal bonds has not been computed on a tax-equivalent basis. |
| (3) | Net interest spread is calculated by subtracting average rate on interest-bearing liabilities from average yield on interest-earning assets. |
| (4) | Net interest margin is calculated by dividing net interest income by average interest-earning assets. |
Rate/Volume Analysis
Increases and decreases in interest income and interest expense result from changes in average balances (volume) of interest-earning assets and interest-bearing liabilities, as well as changes in average interest rates. The following tables show the effect that these factors had on the interest earned on our interest-earning assets and the interest incurred on our interest-bearing liabilities. The effect of changes in volume is determined by multiplying the change in volume by the previous period’s average rate. Similarly, the effect of rate changes is calculated by multiplying the change in average rate by the previous period’s volume. Changes which are not due solely to volume or rate have been allocated to these categories based on the respective percent changes in average volume and average rate as they compare to each other.
| Three Months Ended March 31, 2018 vs. 2017 |
||||||||||||
| Increase (Decrease) Due to Change In | ||||||||||||
| (Dollars in thousands) | Volume | Rate | Total | |||||||||
| Interest earned on: |
||||||||||||
| Loans |
$ | 2,156 | $ | 1,407 | $ | 3,563 | ||||||
| Investment securities |
220 | 120 | 340 | |||||||||
| Other interest-earning assets |
21 | 87 | 108 | |||||||||
|
|
|
|
|
|
|
|||||||
| Total interest income |
2,397 | 1,614 | 4,011 | |||||||||
|
|
|
|
|
|
|
|||||||
| Interest paid on: |
||||||||||||
| Savings, NOW, and money market deposits |
(58 | ) | 42 | (16 | ) | |||||||
| Other time deposits |
391 | 644 | 1,035 | |||||||||
| Other borrowings |
— | 168 | 168 | |||||||||
|
|
|
|
|
|
|
|||||||
| Total interest expense |
333 | 854 | 1,187 | |||||||||
|
|
|
|
|
|
|
|||||||
| Change in net interest income |
$ | 2,064 | $ | 760 | $ | 2,824 | ||||||
|
|
|
|
|
|
|
|||||||
Three Months Ended March 31, 2018 Compared to Three Months Ended March 31, 2017
During the three months ended March 31, 2018, we generated net interest income of $15.3 million, an increase of $2.8 million, or 22.6%, from the net interest income we produced during the three months ended March 31, 2017. This increase was largely due to a 17.6% increase in the average balance of interest-earning assets, coupled with a 41 basis point improvement in the average yield on interest-earning assets. The increase in average balance of interest-earning assets was primarily due to organic growth in SBA, commercial property and residential property loans in 2017 and the first quarter of 2018. The increase in average yield on interest-earning assets was primarily due to cumulative market rate increases by the Federal Reserve since December 2016. For the three months ended March 31, 2018 and 2017, our net interest margin was 4.33% and 4.15%, respectively.
Interest Income. Total interest income was $18.6 million for the three months ended March 31, 2018 compared to $14.6 million for the three months ended March 31, 2017. The $4.0 million, or 27.4%, increase in total interest income was due to increases in interest earned on our loan portfolio, securities portfolio and other interest-earning assets, which is consistent with the current rising interest rate environment.
Interest and fees on loans was $17.4 million for the three months ended March 31, 2018 compared to $13.9 million for the three months ended March 31, 2017. The $3.6 million, or 25.7%, increase in interest and
68
Table of Contents
fees on loans was primarily due to a 15.5% increase in average balance of loans coupled with a 47 basis point increase in average yield on loans. The increase in average balance was primarily due to organic loan growth across the entire loan portfolio during 2017 and the first quarter of 2018. The higher yield on the loan portfolio resulted primarily from the increase in market rates by the Federal Reserve from December 2016. For the three months ended March 31, 2018 and 2017, the yield on total loans was 5.80% and 5.33%, respectively.
Interest income on our securities portfolio increased $340 thousand, or 66.9%, to $848 thousand for the three months ended March 31, 2018 compared to $508 thousand for the three months ended March 31, 2017. The increase in interest income on securities was primarily due to an increased average balance of $45.1 million, or 43.3%, and a 33 basis point increase in the average yield on securities. We purchased $30.4 million in residential mortgage backed securities, $31.6 million of collateralized mortgage obligations and $2.0 million in SBA sponsored securities since March 31, 2017. These purchases increased our average yield as these securities were purchased in higher market rate environment.
Interest income on our other interest-earning assets increased $108 thousand, or 46.6%, to $340 thousand for the three months ended March 31, 2018 compared to $232 thousand for the three months ended March 31, 2017. The increase in interest income on other interest-earning assets was primarily due to a 55 basis point increase in average yield coupled with an increase in average balance of $5.3 million. The main reasons for the increased yield were the increase in the federal funds rate and placing higher balances into our interest-bearing account at the Federal Reserve Bank for liquidity management purposes.
Interest Expense. Interest expense on interest-bearing liabilities increased $1.2 million, or 55.3%, to $3.3 million for the three months ended March 31, 2018 compared to $2.1 million for the three months ended March 31, 2017, due to increases in interest expense on both deposits and borrowings.
Interest expense on deposits increased $1.0 million, or 47.5%, to $3.2 million for the three months ended March 31, 2018 compared to $2.1 million for the three months ended March 31, 2017. The increase in interest expense on deposits was primarily due to increases of average balance of interest-bearing deposits of 14.5% and average rate of 30 basis points. The increase in average balance of interest-bearing deposits resulted primarily from an increases in time deposits, partially offset by a decrease in MMDA and Super NOW accounts. The increase in the average rate paid was due to the impact of higher market rates on deposits. During the three months ended March 31, 2018, we offered a deposit promotion to increase retail deposits in our deposit mix. From this deposit promotion, we raised $122.7 million of interest-bearing deposits at a weighted average rate of 2.21%.
Interest expense on other borrowings was $168 thousand for the three months ended March 31, 2018. The Bank has utilized borrowings from the Federal Home Loan Bank (“FHLB”) since June 2017, while no borrowings from FHLB had been used during the three months ended March 31, 2017 as the Bank had a sufficient deposit growth to fund loan and investment portfolio needs. During the three months ended March 31, 2018, the Bank maintained $40.0 million of borrowings from FHLB in order to maintain a sufficient level of on-balance sheet liquidity.
Provision for Loan Losses. Provision for loan losses totaled $95 thousand for the three months ended March 31, 2018 compared to a negative provision of $198 thousand for the three months ended March 31, 2017. Allowance for loan losses to total loans was 1.01% and 1.07%, respectively, at March 31, 2018 and 2017, which was a decrease of 2 and 3 basis points, respectively, compared to each prior-period end, December 31, 2017 and 2016 due to an improvement in our credit quality.
69
Table of Contents
Noninterest Income. Noninterest income decreased $127 thousand, or 3.6%, to $3.4 million for the three months ended March 31, 2018 compared to $3.5 million for the three months ended March 31, 2017. The following table sets forth the major components of our noninterest income for the three months ended March 31, 2018 and 2017:
| Three Months Ended March 31, |
||||||||||||
| Increase (Decrease) |
||||||||||||
| (Dollars in thousands) | 2018 | 2017 | ||||||||||
| Service charges and fees |
$ | 349 | $ | 350 | $ | (1 | ) | |||||
| Loan servicing income |
626 | 566 | 60 | |||||||||
| Gain on sale of loans |
2,116 | 2,344 | (228 | ) | ||||||||
| Other income |
271 | 229 | 42 | |||||||||
|
|
|
|
|
|
|
|||||||
| Total noninterest income |
$ | 3,362 | $ | 3,489 | $ | (127 | ) | |||||
|
|
|
|
|
|
|
|||||||
The components of our noninterest income include:
Service charges and fees. Our service charges and fees decreased $1 thousand, or 0.3%, to $349 thousand for the three months ended March 31, 2018 compared to $350 thousand for the three months ended March 31, 2017. This decrease primarily resulted from a decrease in the level of transactional based deposit accounts.
Loan servicing income. Our loan servicing income increased by $60 thousand, or 10.6%, to $626 thousand for three months ended March 31, 2018 compared to $566 thousand for the three months ended March 31, 2017. Servicing income increased due to an increase in our servicing portfolio. Servicing retained sold SBA and residential property loans totaled $483.3 million and $50.6 million, respectively, at March 31, 2018 compared to $455.6 million and $64.7 million, respectively, at March 31, 2017. The increase in loan servicing for SBA loans reflected our continued growth in originations and sales of SBA loans. We did not sell any residential property loans with servicing rights retained since 2017.
Gain on sale of loans. Our gain on sale of loans decreased $228 thousand, or 9.7%, to $2.1 million for three months ended March 31, 2018 compared to $2.3 million for three months ended March 31, 2017. The decrease was primarily due to a decreased amount of SBA loans sold. We sold guaranteed portion of SBA loans of $29.9 million and $36.4 million, respectively, and recognized a gain on sale of $2.0 million and $2.3 million, respectively, for the three months ended March 31, 2018 and 2017. We also sold residential property loans of $1.2 million and $2.7 million, respectively, and recognized a gain on sale of $22 thousand and $29 thousand, respectively, for the three months ended March 31, 2018 and 2017. The reduction in sales of residential property loans reflected our desire to hold these loans in our portfolio rather than sell them. During the three months ended March 31, 2018, we sold a commercial property loan of $1.8 million and recognized a gain on sale of $45 thousand as well.
Other income. Our other income increased $42 thousand, or 18.3%, to $271 thousand for three months ended March 31, 2018 compared to $229 thousand for the three months ended March 31, 2017. Other income includes wire and remittance fees of $105 thousand and $99 thousand, respectively, and debit card interchange fees of $45 thousand and $48 thousand, respectively, for the three months ended March 31, 2018 and 2017.
70
Table of Contents
Noninterest Expense: Noninterest expense increased $1.1 million, or 13.0%, to $9.6 million for the three months ended March 31, 2018 compared $8.5 million for the three months March 31, 2017. The following table sets forth the major components of our noninterest expense for the three months ended March 31, 2018 and 2017:
| Three Months Ended March 31, |
||||||||||||
| Increase (Decrease) |
||||||||||||
| (Dollars in thousands) | 2018 | 2017 | ||||||||||
| Salaries and employee benefits |
$ | 6,246 | $ | 5,521 | $ | 725 | ||||||
| Occupancy and equipment expenses |
1,144 | 1,096 | 48 | |||||||||
| Data processing |
302 | 249 | 53 | |||||||||
| Marketing and business promotion |
388 | 301 | 87 | |||||||||
| Loan expense |
59 | 111 | (52 | ) | ||||||||
| Professional fees |
523 | 420 | 103 | |||||||||
| Regulatory assessments |
132 | 98 | 34 | |||||||||
| Director fees and expenses |
230 | 163 | 67 | |||||||||
| Provision (reversal) for off-balance-sheet items |
(3 | ) | 13 | (16 | ) | |||||||
| Other expenses |
610 | 549 | 61 | |||||||||
|
|
|
|
|
|
|
|||||||
| Total noninterest expense |
$ | 9,631 | $ | 8,521 | $ | 1,110 | ||||||
|
|
|
|
|
|
|
|||||||
The components of our noninterest expense include:
Salaries and employee benefits. Our salaries and employee benefits expense increased $725 thousand, or 13.1%, to $6.2 million for the three months ended March 31, 2018 compared to $5.5 million for the three months ended March 31, 2017. This increase in salaries and employee benefits was primarily due to an increase in the number of employees to support continued growth. The number of full-time equivalent employees was 228 at March 31, 2018 compared to 209 at March 31, 2017. The increase in expense was also impacted by annual salary increases, employee bonus and incentive compensation.
Occupancy and equipment. Our occupancy and equipment expenses increased $48 thousand, or 4.4%, to $1.1 million for the three months ended March 31, 2018 compared to $1.1 million for the three months ended March 31, 2017. The increase was related to our branch network expansion strategy. We opened the New York branch in September 2017.
Data processing. Our data processing expense increased $53 thousand, or 21.3%, to $302 thousand for the three months ended March 31, 2018 compared to $249 thousand for the three months ended March 31, 2017. This increase resulted primarily from the impact of increased processing costs as we expand with a greater number of accounts and transactions.
Marketing and business promotion. Our marketing and business promotion expense increased $87 thousand, or 28.9%, to $388 thousand for the three months ended March 31, 2018 compared to $301 thousand for the three months ended March 31, 2017. This increase was primarily due to continuing efforts to grow our exposure to the market, which we believe would help the growth of our loans and deposits.
Loan expense. Our loan expense decreased $52 thousand, or 46.8%, to $59 thousand for the three months ended March 31, 2018 compared to $111 thousand for the three months ended March 31, 2017. The decrease was primarily due to decreases in foreclosure expenses and related legal fees, and SBA guarantee fees paid by the Bank.
Professional fees. Our professional fees increased $103 thousand, or 24.5%, to $523 thousand for the three months ended March 31, 2018 compared to $420 thousand for the three months ended March 31, 2017. The increase was primarily due to an increase in audit and other professional services for our Nasdaq registration.
71
Table of Contents
Regulatory assessments. Our regulatory assessment expense increased $34 thousand, or 34.7%, to $132 thousand for the three months ended March 31, 2018 compared to $98 thousand for the three months ended March 31, 2017. The increase was primarily due to our year-over-year balance sheet growth.
Director fees and expenses. Our director fees and expenses increased $67 thousand, or 41.1%, to $230 thousand for the three months ended March 31, 2018 compared to $163 thousand for the three months ended March 31, 2017. The increase was primarily due to the increase in directors’ fee and an addition of a board member since April 2017.
Provision (reversal) for off-balance-sheet items. Our provision (reversal) for off-balance-sheet items decreased $16 thousand, or 123.1%, to $(3) thousand for the three months ended March 31, 2018 compared to $13 thousand for the three months ended March 31, 2017.
Other expense. Our other expense increased $61 thousand, or 13.0%, to $610 thousand for the three months ended March 31, 2018 compared to $549 thousand for the three months ended March 31, 2017. The increase was primarily due to an increase in general operating expense. Other expenses primarily included $315 thousand and $273 thousand in office expense, and $115 thousand and $103 thousand in armed guard expense for the three months ended March 31, 2018 and 2017, respectively.
Income Tax Expense
Income tax expense was $2.7 million for the three months ended March 31, 2018 compared to $3.2 million for the three months ended March 31, 2017. Effective tax rates were 29.9% and 42.4%, respectively, for the three months ended March 31, 2018 and 2017. The decrease in income tax expense and effective tax rate was a result of the Tax Reform Act, which was enacted on December 22, 2017, and included a number of changes to existing U.S. tax laws, most notably a reduction of the U.S. corporate tax rate from 35% to 21%, for tax years beginning in 2018.
Net Income
Net income increased $1.9 million, or 42.4%, to $6.3 million for the three months ended March 31, 2018 compared to $4.4 million for the three months ended March 31, 2017. The increase is primarily due to an increase in net interest income due to the growth in earning assets and decreases in income tax expense, partially offset by a decrease in noninterest income due to decreased gain on sales of loans, primarily SBA loans, and increases in provision for loan losses and noninterest expense.
72
Table of Contents
Results of Operations—Comparison of Results of Operations for the Years Ended December 31, 2017 to December 31, 2016
Average Balance Sheet, Net Interest Income and Yield/Rate Analysis
The following tables present average balance sheet information, interest income, interest expense and the corresponding average yields earned and rates paid for the years ended December 31, 2017, 2016 and 2015. The average balances are daily averages and, for loans, include both performing and nonperforming balances. Interest income on loans includes the effects of discount accretion and net deferred loan origination costs accounted for as yield adjustments.
| Year ended December 31, 2017 | Year ended December 31, 2016 | Year ended December 31, 2015 | ||||||||||||||||||||||||||||||||||
| (Dollars in thousands) | Average Balances |
Interest Income/ Expense |
Average Yield/ Rate |
Average Balances |
Interest Income/ Expense |
Average Yield/ Rate |
Average Balances |
Interest Income/ Expense |
Average Yield/ Rate |
|||||||||||||||||||||||||||
| Interest-earning assets: |
||||||||||||||||||||||||||||||||||||
| Total loans(1), net of deferred loan fees and costs |
$ | 1,111,248 | $ | 61,516 | 5.54 | % | $ | 961,482 | $ | 50,058 | 5.21 | % | $ | 800,150 | $ | 41,163 | 5.14 | % | ||||||||||||||||||
| U.S. government agencies |
24,762 | 571 | 2.31 | % | 20,928 | 460 | 2.20 | % | 12,919 | 238 | 1.84 | % | ||||||||||||||||||||||||
| Mortgage backed securities |
57,171 | 1,110 | 1.94 | % | 45,822 | 797 | 1.74 | % | 40,644 | 775 | 1.91 | % | ||||||||||||||||||||||||
| Collateralized mortgage obligation |
36,660 | 746 | 2.03 | % | 21,032 | 337 | 1.60 | % | 21,895 | 328 | 1.50 | % | ||||||||||||||||||||||||
| Municipal securities tax exempt(2) |
8,319 | 187 | 2.25 | % | 7,613 | 147 | 1.93 | % | 4,502 | 78 | 1.73 | % | ||||||||||||||||||||||||
| Interest-bearing deposits in other banks |
62,327 | 690 | 1.11 | % | 28,413 | 145 | 0.51 | % | 67,543 | 176 | 0.26 | % | ||||||||||||||||||||||||
| Federal Home Loan bank and other bank stock |
6,310 | 447 | 7.08 | % | 5,452 | 651 | 11.94 | % | 4,648 | 513 | 11.04 | % | ||||||||||||||||||||||||
|
|
|
|
|
|
|
|
|
|
|
|
|
|||||||||||||||||||||||||
| Total interest-earning assets |
1,306,797 | 65,267 | 4.99 | % | 1,090,742 | 52,595 | 4.82 | % | 952,301 | 43,271 | 4.54 | % | ||||||||||||||||||||||||
|
|
|
|
|
|
|
|
|
|
|
|
|
|||||||||||||||||||||||||
| Noninterest-earning assets: |
||||||||||||||||||||||||||||||||||||
| Cash and cash equivalents |
16,973 | 15,848 | 14,470 | |||||||||||||||||||||||||||||||||
| Allowances for loan losses |
(11,435 | ) | (10,170 | ) | (9,444 | ) | ||||||||||||||||||||||||||||||
| Other assets |
27,793 | 25,990 | 19,940 | |||||||||||||||||||||||||||||||||
|
|
|
|
|
|
|
|||||||||||||||||||||||||||||||
| Total noninterest earning assets |
33,331 | 31,668 | 24,966 | |||||||||||||||||||||||||||||||||
|
|
|
|
|
|
|
|||||||||||||||||||||||||||||||
| Total assets |
$ | 1,340,128 | $ | 1,122,410 | $ | 977,267 | ||||||||||||||||||||||||||||||
|
|
|
|
|
|
|
|||||||||||||||||||||||||||||||
| Interest-bearing liabilities: |
||||||||||||||||||||||||||||||||||||
| Deposits: |
||||||||||||||||||||||||||||||||||||
| MMDA and Super NOW |
$ | 320,701 | $ | 3,244 | 1.01 | % | $ | 250,736 | $ | 2,264 | 0.90 | % | $ | 208,981 | $ | 1,782 | 0.85 | % | ||||||||||||||||||
| Savings |
8,873 | 25 | 0.28 | % | 9,500 | 26 | 0.27 | % | 7,017 | 21 | 0.30 | % | ||||||||||||||||||||||||
| Time deposits |
539,068 | 6,480 | 1.20 | % | 468,953 | 4,719 | 1.01 | % | 440,300 | 4,428 | 1.01 | % | ||||||||||||||||||||||||
| Borrowings |
20,384 | 348 | 1.71 | % | 1,194 | 5 | 0.42 | % | 53 | — | — | % | ||||||||||||||||||||||||
|
|
|
|
|
|
|
|
|
|
|
|
|
|||||||||||||||||||||||||
| Total interest-bearing liabilities |
889,026 | 10,097 | 1.14 | % | 730,383 | 7,014 | 0.96 | % | 656,351 | 6,231 | 0.95 | % | ||||||||||||||||||||||||
|
|
|
|
|
|
|
|
|
|
|
|
|
|||||||||||||||||||||||||
| Noninterest-bearing liabilities: |
||||||||||||||||||||||||||||||||||||
| Demand deposits |
305,354 | 271,628 | 223,170 | |||||||||||||||||||||||||||||||||
| Other liabilities |
9,026 | 8,092 | 4,748 | |||||||||||||||||||||||||||||||||
|
|
|
|
|
|
|
|||||||||||||||||||||||||||||||
| Total noninterest-bearing liabilities |
314,380 | 279,720 | 227,918 | |||||||||||||||||||||||||||||||||
|
|
|
|
|
|
|
|||||||||||||||||||||||||||||||
| Total liabilities |
1,203,406 | 1,010,103 | 884,269 | |||||||||||||||||||||||||||||||||
| Stockholders’ equity |
136,722 | 112,307 | 92,998 | |||||||||||||||||||||||||||||||||
|
|
|
|
|
|
|
|||||||||||||||||||||||||||||||
| Total liabilities and Stockholders’ equity |
$ | 1,340,128 | $ | 1,122,410 | $ | 977,267 | ||||||||||||||||||||||||||||||
|
|
|
|
|
|
|
|||||||||||||||||||||||||||||||
| Net interest income |
$ | 55,170 | $ | 45,581 | $ | 37,040 | ||||||||||||||||||||||||||||||
|
|
|
|
|
|
|
|||||||||||||||||||||||||||||||
| Cost of funds |
0.85 | % | 0.70 | % | 0.71 | % | ||||||||||||||||||||||||||||||
|
|
|
|
|
|
|
|||||||||||||||||||||||||||||||
| Net interest spread(3) |
3.85 | % | 3.86 | % | 3.59 | % | ||||||||||||||||||||||||||||||
|
|
|
|
|
|
|
|||||||||||||||||||||||||||||||
| Net interest margin(4) |
4.22 | % | 4.18 | % | 3.89 | % | ||||||||||||||||||||||||||||||
|
|
|
|
|
|
|
|||||||||||||||||||||||||||||||
| (1) | Loans held for sale and nonaccrual loans are included in the average balance. Net amortization of deferred loan fees (cost) of $559 thousand, $639 thousand and $406 thousand are included in the interest income for the years ended December 31, 2017, 2016 and 2015, respectively. |
| (2) | The yield on municipal bonds has not been computed on a tax-equivalent basis. |
| (3) | Net interest spread is calculated by subtracting average rate on interest-bearing liabilities from average yield on interest-earning assets. |
| (4) | Net interest margin is calculated by dividing net interest income by average interest-earning assets. |
73
Table of Contents
Rate/Volume Analysis
Increases and decreases in interest income and interest expense result from changes in average balances (volume) of interest-earning assets and interest-bearing liabilities, as well as changes in average interest rates. The following tables show the effect that these factors had on the interest earned on our interest-earning assets and the interest incurred on our interest-bearing liabilities. The effect of changes in volume is determined by multiplying the change in volume by the previous period’s average rate. Similarly, the effect of rate changes is calculated by multiplying the change in average rate by the previous period’s volume. Changes which are not due solely to volume or rate have been allocated to these categories based on the respective percent changes in average volume and average rate as they compare to each other.
| For the Years Ended December 31, Increases (Decreases) |
For the Years Ended December 31, Increases (Decreases) |
|||||||||||||||||||||||
| Due to Change In |
|
|
Due to Change In |
|
|
|||||||||||||||||||
| (Dollars in thousands) | Volume | Rate | Total | Volume | Rate | Total | ||||||||||||||||||
| Interest earned on: |
||||||||||||||||||||||||
| Loans |
$ | 7,797 | $ | 3,661 | $ | 11,458 | $ | 8,300 | $ | 595 | $ | 8,895 | ||||||||||||
| Investment securities |
575 | 298 | 873 | 274 | 48 | 322 | ||||||||||||||||||
| Other interest-earning assets |
817 | (476 | ) | 341 | (366 | ) | 473 | 107 | ||||||||||||||||
|
|
|
|
|
|
|
|
|
|
|
|
|
|||||||||||||
| Total interest income |
9,189 | 3,483 | 12,672 | 8,208 | 1,116 | 9,324 | ||||||||||||||||||
|
|
|
|
|
|
|
|
|
|
|
|
|
|||||||||||||
| Interest paid on: |
||||||||||||||||||||||||
| Savings, NOW, and money market deposits |
610 | 369 | 979 | 369 | 118 | 487 | ||||||||||||||||||
| Other time deposits |
706 | 1,055 | 1,761 | 288 | 3 | 291 | ||||||||||||||||||
| Other borrowings |
80 | 263 | 343 | — | 5 | 5 | ||||||||||||||||||
|
|
|
|
|
|
|
|
|
|
|
|
|
|||||||||||||
| Total interest expense |
1,396 | 1,687 | 3,083 | 657 | 126 | 783 | ||||||||||||||||||
|
|
|
|
|
|
|
|
|
|
|
|
|
|||||||||||||
| Change in net interest income |
$ | 7,793 | $ | 1,796 | $ | 9,589 | $ | 7,551 | $ | 990 | $ | 8,541 | ||||||||||||
|
|
|
|
|
|
|
|
|
|
|
|
|
|||||||||||||
The following discussion of our results of operations compares the year ended December 31, 2017 to the year ended December 31, 2016.
Net Interest Income/Average Balance Sheet
In 2017, we generated net interest income of $55.2 million, an increase of $9.6 million, or 21.0%, from the net interest income we produced in 2016. This increase was largely due to a 19.8% increase in the average balance of interest-earning assets, coupled with a 17 basis point improvement in the average yield on interest-earning assets. The increase in the average balance of interest-earning assets was primarily due to organic growth in SBA, commercial property loans and residential property loans during 2017. The increase in the average yield on interest-earning assets was primarily due to cumulative market rate increases of a total of 100 basis points by the Federal Reserve through four rate increases in the months of December 2016, March 2017, June 3017, and December 2017. For the years ended December 31, 2017 and 2016, our net interest margin was 4.22% and 4.18%, respectively.
Interest Income. Total interest income was $65.3 million in 2017 compared to $52.6 million in 2016. The $12.7 million, or 24.1%, increase in total interest income was due to increases in interest earned on our loan portfolio, securities portfolio and other interest-bearing deposits, which is consistent with the increasing interest rate environment during 2017 as compared to 2016.
Interest and fees on loans was $61.5 million in 2017 compared to $50.1 million in 2016. The $11.5 million, or 22.9%, increase in interest income on loans was primarily due to a 15.6% increase in the average balance of
74
Table of Contents
loans outstanding coupled with a 33 basis points increase in the average yield on loans. The increase in the average balance of loans outstanding was primarily due to organic loan growth across the entire loan portfolio during 2017. The higher yield on the loan portfolio resulted primarily from the increase in market rates by the Federal Reserve from December 2016. For the years ended December 31, 2017 and 2016, the yield on total loans was 5.54% and 5.21%, respectively.
Interest income on our securities portfolio increased $873 thousand, or 50.1%, to $2.6 million in 2017. The increase in interest income on securities was primarily due to an increased average balance of $31.5 million, or 33.0%, and by a 23 basis point increase in the average yield on securities. We purchased $32.5 million in residential mortgage backed securities, $33.7 million of collateralized mortgage obligations and $6.9 million in SBA sponsored securities in 2017. These purchases increased our average yield as these securities were purchased in higher market rate environment which resulted in higher yields in our securities portfolio.
Interest income on our other interest-earning assets increased $341 thousand, or 42.8%, to $1.1 million in 2017. The increase in interest income on cash equivalents was primarily due to a 60 basis point increase in average yield of interest-bearing deposits in other banks coupled with an increase in average balance of $33.9 million. The main reasons for the increased yield were the increase in the federal funds rate and placing higher balances into an interest-bearing Federal Reserve Bank account for liquidity management purposes. The increase was partially offset by a decrease of $204 thousand in dividend income on Federal Home Loan Bank (“FHLB”) and other bank stock to $447 thousand for the year ended December 31, 2017 from $651 thousand for the year ended December 31, 2016.
Interest Expense. Interest expense on interest-bearing liabilities increased $3.1 million, or 44.0%, to $10.1 million in 2017 due to increases in interest expense on both deposits and borrowings.
Interest expense on deposits increased to $9.7 million in 2017. The $2.7 million, or 39.1%, increase in interest expense on deposits was primarily due to the average balance of interest-bearing deposits increasing 19.1% coupled with a 16 basis point increase in the average rate paid. The increase in the average balance of interest-bearing deposits resulted primarily from an increase in retail time deposits, and state and brokered time deposits. The increase in the average rate paid was due to the impact of higher market rates on deposits.
Interest expense on borrowings increased $343 thousand to $348 thousand in 2017. The increase in interest expense on other borrowed funds of $343 thousand was due to the Bank incurring average borrowings of $20.4 million of FHLB long-term advances during 2017 as compared with $1.2 million during 2016, which were utilized to fund organic loan growth during the year. In 2016, the Bank chose not to borrow funds as the deposit growth was sufficient enough to fund the loan and investment portfolio growth during the year.
Provision for Loan Losses. The provision for loan losses totaled $1.8 million in 2017 compared to $2.3 million in 2016. The $456 thousand, or 20.0%, decrease in the provision for loan losses was due primarily to a decline in the migration of loans into adversely classified asset categories in 2017 due to a healthier loan portfolio.
Noninterest Income. Noninterest income increased $275 thousand, or 2.01% to $13.9 million in 2017 compared to $13.6 million in 2016. The following table sets forth the major components of our noninterest income for the years ended December 31, 2017 and 2016:
| Years Ended December 31, | ||||||||||||
| (Dollars in thousands) | 2017 | 2016 | Increase/ (Decrease) |
|||||||||
| Noninterest income: |
||||||||||||
| Service charges and fees |
$ | 1,377 | $ | 1,457 | $ | (80 | ) | |||||
| Loan servicing income |
2,446 | 2,159 | 287 | |||||||||
| Gain on sale of loans |
9,000 | 8,912 | 88 | |||||||||
| Other income |
1,071 | 1,091 | (20 | ) | ||||||||
|
|
|
|
|
|
|
|||||||
| Total noninterest income |
$ | 13,894 | $ | 13,619 | $ | 275 | ||||||
|
|
|
|
|
|
|
|||||||
75
Table of Contents
The components of our noninterest income include:
Service charges and fees. Noninterest income from service charges and fees decreased $80 thousand, or 5.5%, to $1.4 million in 2017 compared to $1.5 million in 2016. This decrease primarily resulted from a decrease in the level of transactional based deposit accounts.
Loan servicing income. Our loan servicing income increased by $287 thousand to $2.4 million for the year ended December 31, 2017 compared to $2.2 million for the year ended December 31, 2016. Servicing income increased due to an increase in our servicing portfolio. We were servicing $474.9 million of SBA loans as of December 31, 2017 compared to $427.5 million as of December 31, 2016. We were servicing $53.3 million of residential property loans as of December 31, 2017 compared to $69.0 million as of December 31, 2016. The increase in the SBA loan servicing portfolio reflected the growth in our originations and sales of SBA loans in 2017, while the decrease in the residential property servicing portfolio reflected that the Company did not sell any residential property loans in 2017 with servicing rights retained.
Gain on sale of loans. Our gain on sale of loans increased $88 thousand to $9.0 million in 2017 compared to $8.9 million in 2016 due to an increased amount of SBA loans sold. The gain on sale of SBA loans was $8.9 million in 2017 compared to $8.1 million in 2016, accounting for a $790 thousand increase. We sold $127.3 million in SBA loans in 2017 compared to $119.3 million in 2016, resulting in a gain on sale of loans of $8.9 million in 2017 compared to $8.1 million in 2016. The gain on sale of SBA loans was partially offset by a decrease in the gain on sale of residential property loans of $702 thousand in 2017 compared to 2016. We sold $13.2 million in residential property loans in 2017 as compared to $45.3 million in 2016. The reduction in the sales of residential property loans reflected our desire to increasingly hold these loans in our portfolio rather than sell them. The overall increase in the gain on sale of loans reflected our efforts to increase our originations and sales of SBA loans to generate additional noninterest income.
Other income. Other income includes wire and remittance fees of $431 thousand in 2017 and $383 thousand in 2016, debit card interchange fees of $203 thousand in 2017 and $189 thousand in 2017, and the net gain on sale of securities available-for-sale of $0 in 2017 and $8 thousand in 2016, plus other minor balances.
Noninterest Expense
Noninterest expense increased $3.4 million, or 10.4%, to $35.9 million in 2017 compared to $32.5 million in 2016. The following table sets forth the major components of our noninterest expense for the years ended December 31, 2017 and 2016:
| Years Ended December 31, | ||||||||||||
| (Dollars in thousands) | 2017 | 2016 | Increase/ (Decrease) |
|||||||||
| Noninterest expense: |
||||||||||||
| Salaries and employee benefits |
$ | 22,829 | $ | 19,944 | $ | 2,885 | ||||||
| Occupancy and equipment expenses |
4,426 | 4,337 | 89 | |||||||||
| Data processing |
1,074 | 943 | 131 | |||||||||
| Marketing and business promotion |
1,647 | 1,449 | 198 | |||||||||
| Loan expense |
437 | 341 | 96 | |||||||||
| Professional fees |
1,842 | 1,997 | (155 | ) | ||||||||
| Regulatory assessments |
423 | 460 | (37 | ) | ||||||||
| Director fees and expenses |
757 | 708 | 49 | |||||||||
| Provision for off-balance-sheet items |
9 | 10 | (1 | ) | ||||||||
| Other expenses |
2,451 | 2,325 | 126 | |||||||||
|
|
|
|
|
|
|
|||||||
| Total noninterest expense |
$ | 35,895 | $ | 32,514 | $ | 3,381 | ||||||
|
|
|
|
|
|
|
|||||||
76
Table of Contents
The components of our noninterest expense include:
Salaries and employee benefits. Salaries and employee benefits expense increased $2.9 million, or 14.5%, to $22.8 million in 2017 compared to $19.9 million in 2016. This increase in salaries and employee benefits was primarily attributable to an increase in the number of employees to support continued growth. The number of full-time equivalent employees averaged 218.1 during 2017 compared to 203.6 in 2016. The increase in expense was also impacted by annual salary increases that took effect in 2017 at an average increase of 5.4%, employee bonus and incentive compensation, and increased benefit costs.
Occupancy and equipment. Occupancy and equipment expenses increased $89 thousand, or 2.1%, to $4.4 million in 2017 compared to $4.3 million in 2016. The increase is related to the Company’s branch network expansion strategy. We opened the New York branch in September 2017.
Data processing. Data processing expense increased $131 thousand, or 13.9%, to $1.1 million in 2017 compared to $943 thousand in 2016. This increase resulted primarily from the impact of increased processing costs as the Company expands with a greater number of accounts and transactions.
Marketing and business promotion. Marketing and business promotion expense increased $198 thousand, or 13.7%, to $1.6 million in 2017 compared to $1.4 million in 2016. This increase was primarily due to continuing efforts to grow our exposure to the market, which we believe would help the growth of our loans and deposits.
Loan expense. Loan expense increased $96 thousand, or 28.2%, to $437 thousand in 2017 compared to $341 thousand in 2016. The increase in expense resulted primarily from the increase in loan transactions that resulted from our growth in the loan portfolio and loan origination.
Professional fees. Professional fees expense decreased $155 thousand, or 7.8%, to $1.8 million in 2017. This decrease was primarily due to a decrease in audit and other professional services.
Regulatory assessments. Regulatory assessment expense totaled $423 thousand in 2017 compared to $460 thousand in 2016. The $37 thousand, or 8.0%, decrease was primarily due to a decrease in FDIC quarterly assessment rate.
Director fees and expenses. Director fees and expenses increased $49 thousand, or 6.9%, to $757 thousand in 2017 compared $708 thousand in 2016. The increase was primarily due to the increase in directors fee and an addition of board member in April 2017.
Provision for off-balance-sheet items. Provision for off-balance-sheet items decreased $1 thousand to $9 thousand in 2017.
Other expense. Other expense totaled $2.5 million in 2017 compared to $2.3 million in 2016. This increase of $126 thousand was primarily attributable to an increase in general operating expense. Other expenses primarily includes $1.3 million and $1.2 million in office expense, and $433 thousand and $363 thousand in armed guard expense in 2017 and 2016 respectively.
Income Tax Expense. Income tax expense was $14.9 million in 2017 compared to $10.4 million in 2016. The increase in income tax expense was consistent with the related growth in pre-tax income, coupled with the revaluation of deferred tax assets and liabilities in 2017. Effective tax rates were 47.7% and 42.6% in 2017 and 2016, respectively. The higher effective tax rate in 2017 was primarily due to the revaluation of deferred tax assets and liabilities as a result of the enacted Tax Cuts and Jobs Act.
On December 22, 2017, the Tax Reform Act was enacted which included a number of changes to existing U.S. tax laws, most notably a reduction of the U.S. corporate tax rate from 35% to 21%, for tax years beginning in 2018. As a result of the Tax Reform Act, we revalued our deferred tax assets and liabilities and recorded a reduction of its deferred tax assets and liabilities in the amount of $1.6 million and a corresponding increase in deferred income tax expense in 2017.
77
Table of Contents
Net Income. Net income increased $2.4 million to $16.4 million in 2017, compared to $14.0 million in 2016. The increase is primarily due to an increase in net interest income due to the growth in earning assets, an increase in noninterest income due to increased gain on sales of loans, primarily SBA loans, and an increase in loan servicing income partially offset by the reduction of our deferred tax asset of $1.6 million.
Financial Condition
Assets. Total assets increased $215.4 million, or 17.6%, to $1.4 billion at December 31, 2017 as compared to $1.2 billion at December 31, 2016. Total assets further increased $137.0 million, or 9.5%, to $1.6 billion at March 31, 2018 compared to $1.4 billion at December 31, 2017. These increases primarily resulted from net loan growth, including loans held-for-sale of $34.2 million and $162.0 million, respectively, for the three months ended March 31, 2018 and the year ended December 31, 2017. We funded our loan growth with an increase in deposits and to a lesser extent borrowings from the FHLB of San Francisco.
Loans. The loan portfolio is the largest category of our earning assets. At March 31, 2018 and December 31, 2017, loans receivable, net of allowance for loan losses, totaled $1.2 billion. The following table presents the balance and associated percentage of each major category in our loan portfolio at as of the dates indicated:
| March 31, 2018 |
December 31, | |||||||||||||||||||||||||||||||||||||||||||||||
| 2017 | 2016 | 2015 | 2014 | 2013 | ||||||||||||||||||||||||||||||||||||||||||||
| (Dollars in thousands) |
Amount | Percentage to Gross Loans |
Amount | Percentage to Gross Loans |
Amount | Percentage to Gross Loans |
Amount | Percentage to Gross Loans |
Amount | Percentage to Gross Loans |
Amount | Percentage to Gross Loans |
||||||||||||||||||||||||||||||||||||
| Real estate loans: |
||||||||||||||||||||||||||||||||||||||||||||||||
| Commercial property |
$ | 675,729 | 55.2 | % | $ | 662,840 | 55.7 | % | $ | 597,095 | 57.8 | % | $ | 485,314 | 57.5 | % | $ | 417,627 | 57.0 | % | $ | 336,731 | 55.9 | % | ||||||||||||||||||||||||
| Residential property |
184,752 | 15.1 | % | 168,898 | 14.2 | % | 140,766 | 13.7 | % | 129,585 | 15.3 | % | 115,423 | 15.8 | % | 84,722 | 14.1 | % | ||||||||||||||||||||||||||||||
| SBA property |
134,240 | 11.0 | % | 130,438 | 11.0 | % | 104,110 | 10.1 | % | 87,096 | 10.3 | % | 74,873 | 10.2 | % | 60,560 | 10.0 | % | ||||||||||||||||||||||||||||||
| Construction |
26,089 | 2.1 | % | 23,215 | 2.0 | % | 15,129 | 1.5 | % | 2,153 | 0.3 | % | 40 | 0.0 | % | 2,101 | 0.3 | % | ||||||||||||||||||||||||||||||
|
|
|
|
|
|
|
|
|
|
|
|
|
|
|
|
|
|
|
|
|
|
|
|
|
|||||||||||||||||||||||||
| Total real estate loans |
1,020,810 | 83.4 | % | 985,391 | 82.9 | % | 857,100 | 83.1 | % | 704,148 | 83.4 | % | 607,963 | 83.0 | % | 484,114 | 80.3 | % | ||||||||||||||||||||||||||||||
| Commercial and industrial loans: |
||||||||||||||||||||||||||||||||||||||||||||||||
| Commercial term |
79,763 | 6.5 | % | 77,438 | 6.5 | % | 64,926 | 6.3 | % | 51,718 | 6.1 | % | 46,368 | 6.3 | % | 45,641 | 7.6 | % | ||||||||||||||||||||||||||||||
| Commercial lines of credit |
58,195 | 4.8 | % | 60,850 | 5.1 | % | 45,171 | 4.4 | % | 30,726 | 3.6 | % | 22,475 | 3.1 | % | 15,555 | 2.6 | % | ||||||||||||||||||||||||||||||
| SBA commercial term |
29,337 | 2.4 | % | 30,199 | 2.5 | % | 26,467 | 2.6 | % | 25,302 | 3.0 | % | 21,832 | 3.0 | % | 17,578 | 2.9 | % | ||||||||||||||||||||||||||||||
| International loans |
2,115 | 0.2 | % | 1,920 | 0.2 | % | 3,545 | 0.3 | % | 3,248 | 0.4 | % | 3,405 | 0.5 | % | 9,646 | 1.6 | % | ||||||||||||||||||||||||||||||
|
|
|
|
|
|
|
|
|
|
|
|
|
|
|
|
|
|
|
|
|
|
|
|
|
|||||||||||||||||||||||||
| Total commercial and industrial loans |
169,410 | 13.9 | % | 170,407 | 14.3 | % | 140,109 | 13.6 | % | 110,994 | 13.1 | % | 94,080 | 12.9 | % | 88,420 | 14.7 | % | ||||||||||||||||||||||||||||||
| Consumer loans |
32,704 | 2.7 | % | 33,870 | 2.8 | % | 33,722 | 3.3 | % | 29,134 | 3.5 | % | 30,302 | 4.1 | % | 30,244 | 5.0 | % | ||||||||||||||||||||||||||||||
|
|
|
|
|
|
|
|
|
|
|
|
|
|
|
|
|
|
|
|
|
|
|
|
|
|||||||||||||||||||||||||
| Gross loans |
1,222,924 | 100.0 | % | 1,189,668 | 100.0 | % | 1,030,931 | 100.0 | % | 844,276 | 100.0 | % | 732,345 | 100.0 | % | 602,778 | 100.0 | % | ||||||||||||||||||||||||||||||
| Deferred loan costs (fees) |
348 | 331 | 181 | 93 | 175 | 343 | ||||||||||||||||||||||||||||||||||||||||||
|
|
|
|
|
|
|
|
|
|
|
|
|
|||||||||||||||||||||||||||||||||||||
| Total loans, net of deferred costs (fees) |
1,223,272 | 1,189,999 | 1,031,112 | 844,369 | 732,520 | 603,121 | ||||||||||||||||||||||||||||||||||||||||||
| Allowance for loan losses |
(12,371 | ) | (12,224 | ) | (11,320 | ) | (9,345 | ) | (9,432 | ) | (12,606 | ) | ||||||||||||||||||||||||||||||||||||
|
|
|
|
|
|
|
|
|
|
|
|
|
|||||||||||||||||||||||||||||||||||||
| Loans receivable, net |
$ | 1,210,901 | $ | 1,177,775 | $ | 1,019,792 | $ | 835,024 | $ | 723,088 | $ | 590,515 | ||||||||||||||||||||||||||||||||||||
|
|
|
|
|
|
|
|
|
|
|
|
|
|||||||||||||||||||||||||||||||||||||
Net loans increased $33.1 million, or 2.8%, to $1.2 billion at March 31, 2018 as compared to December 31, 2017. The increase in net loans was primarily due to organic growth in real estate loans. Net loans increased $158.0 million, or 15.5%, to $1.2 billion at December 31, 2017 as compared to December 31, 2016. This increase in net loans was primarily due to organic growth across most loan categories, primarily in commercial property
78
Table of Contents
loans. Net loans increased $184.8 million, or 22.1%, to $1.0 billion as of December 31, 2016 as compared to $835.0 million at December 31, 2015. This increase in net loans was primarily due to organic loan growth, primarily in commercial property loans.
Outstanding loan balances increased due to new loan originations, advances on outstanding commitments, net of amounts received for loan payments and payoffs, charge-offs of loans and transfers of loans to OREO.
The following table shows the contractual maturities of our loan portfolio and the distribution between fixed and adjustable interest rate loans at as of the dates indicated:
| March 31, 2018 | ||||||||||||||||
| (Dollars in thousands) | Within One Year |
Due After One Year to Five Years |
Due After Five Years |
Total | ||||||||||||
| Real estate loans; |
||||||||||||||||
| Commercial property |
$ | 95,338 | $ | 366,709 | $ | 213,682 | $ | 675,729 | ||||||||
| Residential property |
— | — | 184,752 | 184,752 | ||||||||||||
| SBA property |
6,491 | 92 | 127,657 | 134,240 | ||||||||||||
| Construction |
25,882 | 207 | — | 26,089 | ||||||||||||
|
|
|
|
|
|
|
|
|
|||||||||
| Total real estate loans |
127,711 | 367,008 | 526,091 | 1,020,810 | ||||||||||||
| Commercial and industrial loans; |
||||||||||||||||
| Commercial term |
2,670 | 35,504 | 41,589 | 79,763 | ||||||||||||
| Commercial lines of credit |
56,642 | 1,553 | — | 58,195 | ||||||||||||
| SBA commercial term |
113 | 1,944 | 27,280 | 29,337 | ||||||||||||
| International loans |
2,115 | — | — | 2,115 | ||||||||||||
|
|
|
|
|
|
|
|
|
|||||||||
| Total commercial and industrial loans |
61,540 | 39,001 | 68,869 | 169,410 | ||||||||||||
| Consumer loans |
5,726 | 26,978 | — | 32,704 | ||||||||||||
|
|
|
|
|
|
|
|
|
|||||||||
| Total gross loans |
$ | 194,977 | $ | 432,987 | $ | 594,960 | $ | 1,222,924 | ||||||||
|
|
|
|
|
|
|
|
|
|||||||||
| Loans with variable (floating) interest rates |
$ | 165,332 | $ | 325,784 | $ | 403,763 | $ | 894,879 | ||||||||
| Loans with predetermined (fixed) interest rates |
29,645 | 107,203 | 191,197 | 328,045 | ||||||||||||
|
|
|
|
|
|
|
|
|
|||||||||
| Total |
$ | 194,977 | $ | 432,987 | $ | 594,960 | $ | 1,222,924 | ||||||||
|
|
|
|
|
|
|
|
|
|||||||||
79
Table of Contents
| December 31, 2017 | ||||||||||||||||
| (Dollars in thousands) | Within One Year |
Due After One Year to Five Years |
Due After Five Years |
Total | ||||||||||||
| Real estate loans; |
||||||||||||||||
| Commercial property |
$ | 96,515 | $ | 326,301 | $ | 240,024 | $ | 662,840 | ||||||||
| Residential property |
— | — | 168,898 | 168,898 | ||||||||||||
| SBA property |
6,491 | 97 | 123,850 | 130,438 | ||||||||||||
| Construction |
22,363 | 852 | — | 23,215 | ||||||||||||
|
|
|
|
|
|
|
|
|
|||||||||
| Total real estate loans |
125,369 | 327,250 | 532,772 | 985,391 | ||||||||||||
| Commercial and industrial loans; |
||||||||||||||||
| Commercial term |
2,303 | 27,944 | 47,191 | 77,438 | ||||||||||||
| Commercial lines of credit |
60,497 | 353 | — | 60,850 | ||||||||||||
| SBA commercial term |
203 | 1,721 | 28,275 | 30,199 | ||||||||||||
| International loans |
1,920 | — | — | 1,920 | ||||||||||||
|
|
|
|
|
|
|
|
|
|||||||||
| Total commercial and industrial loans |
64,923 | 30,018 | 75,466 | 170,407 | ||||||||||||
| Consumer loans |
5,555 | 28,300 | 15 | 33,870 | ||||||||||||
|
|
|
|
|
|
|
|
|
|||||||||
| Total gross loans |
$ | 195,847 | $ | 385,568 | $ | 608,253 | $ | 1,189,668 | ||||||||
|
|
|
|
|
|
|
|
|
|||||||||
| Loans with variable (floating) interest rates |
$ | 164,792 | $ | 288,439 | $ | 420,024 | $ | 873,255 | ||||||||
| Loans with predetermined (fixed) interest rates |
31,055 | 97,129 | 188,229 | 316,413 | ||||||||||||
|
|
|
|
|
|
|
|
|
|||||||||
| Total |
$ | 195,847 | $ | 385,568 | $ | 608,253 | $ | 1,189,668 | ||||||||
|
|
|
|
|
|
|
|
|
|||||||||
The principal categories of our loan portfolio are discussed below:
Commercial property loans (excluding SBA property loans). Commercial property loans include owner-occupied and non-owner occupied commercial property, and multifamily residential property. The interest rate for the majority of these loans are prime based and have a maturity of seven years. At March 31, 2018 and December 31, 2017, approximately 16.6% and 17.2%, respectively, of the commercial property portfolio consisted of fixed-rate loans. Our policy maximum loan-to-value (“LTV”) is 70% for commercial property loans. Commercial property loan portfolio totaled $675.7 million, $662.8 million and $597.1 million as of March 31, 2018, and December 31, 2017 and 2016, respectively, of which $165.2 million, $166.5 million and $144.2 million, respectively, are secured by owner-occupied properties. These increases in commercial property loans represent growth of $12.9 million, $65.7 million and $111.8 million, respectively, or 1.9%, 11.0% and 23.0%, respectively, for the three months ended March 31, 2018 and the years ended December 31, 2017 and 2016. These increases were primarily due to the growth in loan origination. The multifamily residential property loans totaled $70.3 million, $70.6 million and $58.9 million as of March 31, 2018, and December 31, 2017 and 2016, respectively.
Residential property loans. We originate mainly non-qualified, alternative documentation residential property loans through wholesale and broker relationships, or through our branch network, or retail channel. The loan product is a five-year adjustable mortgage with a current start rate of 4.75%, as of March 31, 2018, which re-prices after five years to the one-year London Interbank Offered Rate (“LIBOR”) plus 2.875%. As of March 31, 2018 and December 31, 2017, the weighted average LTV of the portfolio was 56.9% and 56.3%, respectively, the weighted average FICO score was 743 and 741, respectively. We also offer qualified residential property loans as a correspondent to national financial institutions.
We originate these residential property loans both to sell and hold for investment. The loans held-for-investment are generally originated through our retail branch network to our customers, many of whom establish deposit relationships with us. During the three months ended March 31, 2018 and the year ended December 31, 2017, we originated $8.6 million and $22.9 million, respectively, of such loans through our retail channel and $17.2 million and $55.9 million, respectively, through our wholesale channel.
80
Table of Contents
Residential property loans totaled $184.8 million, $168.9 million and $140.8 million at March 31, 2018, and December 31, 2017 and 2016, respectively. These increases in residential property loans represented growth of $15.9 million, $28.1 million and $11.2 million, respectively, or 9.4%, 20.0% and 8.6%, respectively, for the three months ended March 31, 2018 and the years ended December 31, 2017 and 2016. These increases were due to loan originations exceeding loan repayments and sales. During 2017, we made a strategic decision to retain higher balance of residential property loans in our portfolio.
Construction loans. Our construction loans are comprised of residential construction and commercial construction. Interest reserves are generally established on real estate construction loans. These loans are typically prime rate-based and have maturities of less than 18 months. Our policy maximum LTV for construction loans is 70% and for land development loans is 50%.
Construction loans totaled $26.1 million, $23.2 million and $15.1 million at March 31, 2018, and December 31, 2017 and 2016, respectively. These increases in construction loans represented growth of $2.9 million, $8.1 million and $13.0 million, respectively, or 12.4%, 53.4% and 602.7%, respectively, for the three months ended March 31, 2018 and the years ended December 31, 2017 and 2016. These increases in construction loans were primarily due to construction loan originations exceeding loan repayments. Over the past two years, the Bank extended construction loans on selective basis under conservative underwriting standards. Most of the borrowers are high net worth individuals who contributed considerably higher amounts of capital than the Bank’s policy required minimums into their respective projects. All projects are located within the Los Angeles metropolitan areas with relatively low weighted average LTV of 51.8% based on the “as-completed” valuation of the underlying collateral properties.
Commercial and industrial loans (excluding SBA commercial term loans). We provide a mix of variable and fixed rate C&I loans. The loans are typically made to small- and medium-sized manufacturing, wholesale, retail and service businesses for working capital needs, business expansions and for international trade financing. C&I loans include commercial lines of credit with a maturity of one year or less, commercial term loans with maturities of five years or less, and international loans with a maturity of three months or less. Substantially all of our C&I loans are collateralized by business assets or by real estate.
We originated commercial lines of credit, commercial term loans and international loans in the aggregate total of $20.2 million, $57.8 million and $63.0 million during the three months ended March 31, 2018, and the years ended December 31, 2017 and 2016, respectively. The interest rate on these loans are generally Wall Street Journal Prime or prime rate based.
Total C&I loans, excluding SBA commercial term loans, totaled $140.1 million, $140.2 million and 113.6 million at March 31, 2018, and December 31, 2017 and 2016, respectively. The changes in total C&I loans, excluding SBA commercial term loans, represent a decrease of $135 thousand, or 0.1%, for the three months ended March 31, 2018 and increases of $26.6 million and $28.0 million, respectively, or 23.4% and 32.6%, respectively, for the years ended December 31, 2017 and 2016. The decrease for the three months ended March 31, 2018 resulted primarily from a reduction in commercial lines of credit of $2.7 million, partially offset by increases in commercial term loans of $2.3 million and international loans of $195 thousand. The increase for the year ended December 31, 2017 resulted primarily from organic loan growth in commercial lines of credit of $15.7 million, commercial and industrial term notes of $12.5 million, partially offset by a reduction in international loans of $1.6 million. The increase for the year ended December 31, 2016 was due primarily to increases in commercial term loans of $14.4 million, commercial lines of credit of $13.2 million and international loans of $297 thousand.
Small Business Administration guaranteed loans. We are designated a Preferred Lender under the SBA Preferred Lender Program. We offer mostly SBA 7(a) variable-rate loans. We generally sell the guaranteed portion of the SBA loans that we originate. Our SBA loans are typically made to small-sized manufacturing, wholesale, retail, hotel/motel and service businesses for working capital needs or business expansions. SBA loans
81
Table of Contents
can have any maturity up to 25 years. Typically, non-real estate secured loans mature in less than 10 years. Collateral may also include inventory, accounts receivable and equipment, and includes personal guarantees. In general, our SBA loans consist of SBA property and SBA commercial term loans. Our unguaranteed SBA loans collateralized by real estate are monitored by collateral type and included in our CRE concentration reporting and monitoring.
We originate SBA loans through our branch network, SBA departments and LPOs. For the three months ended March 31, 2018 and the year ended December 31, 2017, $12.2 million and $66.7 million, respectively of SBA loan originations were produced by the branch network and SBA departments, and $26.0 million and $115.7 million, respectively, were originated through LPOs.
As of March 31, 2018 and December 31, 2017, our SBA portfolio totaled $163.6 million and $160.6 million, respectively, of which $10.9 million and $10.8 million, respectively, were guaranteed by the SBA and $152.6 million and $149.8 million, respectively, were unguaranteed. The Bank generally sells the guaranteed portion of the SBA loans upon loans origination and as such, the aggregate balance of the guaranteed portion of SBA loans that remains on the balance sheet is relatively small. Of the total SBA loans, $134.2 million and $130.4 million, respectively, were secured by real estate (SBA property loans) and $29.3 million and $30.2 million, respectively, were unsecured or secured by business assets (SBA commercial term loans) at March 31, 2018 and December 31, 2017.
We monitor our SBA portfolio for any potential concentration issues by analyzing the composition of the portfolio based on the type of the real estate collateral as well as the geographic location of the businesses. Of those SBA property loans as of March 31, 2018, 27.4% or $36.7 million were loans secured by hotel or motel properties; 20.6% or $27.6 million were loans secured by retail type properties; 17.5% or $23.5 million were loans secured by gas station properties; and remaining 34.6% or $46.5 million were loans secured by other real estate types combined. The geographic concentration of SBA loans (both SBA property and commercial term loans) was as follows on March 31, 2018: 54.8% or $89.7 million in California; 15.0% or $24.5 million in Washington State; 7.3% or $12.0 million in Texas; and 22.8% or $37.4 million in other states combined. Of those SBA property loans as of December 31, 2017, 26.5% or $34.5 million were loans secured by hotel or motel properties; 22.4% or $29.2 million were loans secured by retail type properties; 17.0% or $22.2 million were loans secured by gas station properties; and remaining 34.1% or $44.5 million were loans secured by other real estate types combined. In terms of geographic concentration of SBA loans (both SBA property and commercial term loans) at December 31, 2017, 55.9% or $89.8 million in California; 14.4% or $23.1 million in Washington State; 8.2% or $13.1 million in Texas; and 21.5% or $34.6 million in other states combined. Of those SBA property loans as of December 31, 2016, 29.1% or $30.3 million were loans secured by retail type properties; 19.9% or $20.7 million by hotel or motel properties; 18.2% or $19.0 million by gas station properties; and remaining 32.8% or $34.1 million were loans secured by other real estate types combined. In terms of geographic concentration of SBA loans (both SBA property and commercial term loans) at December 31, 2016, 59.7% of the aggregate SBA loans or $78.0 million were located in California; 13.5% or $17.6 million in Washington State; 4.3% or $5.6 million in Georgia; and 22.5% or $29.4 million in other states combined.
SBA loans (both SBA property and commercial term loans) totaled $163.6 million, $160.6 million and $130.6 million at March 31, 2018, and December 31, 2017 and 2016, respectively. These increases in SBA loans represent growth of $2.9 million, $30.1 million and $18.2 million, respectively, or 1.8%, 23.0% and 16.2%, respectively, for the three months ended March 31, 2018 and the years ended December 31, 2017 and 2016. This increase for the three months ended March 31, 2018 was due to organic loan originations of $38.2 million, partially offset by SBA loan sales of $29.9 million and principal repayment of $28.5 million. The increase for the year ended December 31, 2017 resulted primarily from organic loan originations of $182.5 million, partially offset by SBA loan sales of $127.3 million and principal repayment of $24.1 million. This increase for the year ended December 31, 2016 was due to organic loan originations of $162.8 million, partially offset by SBA loan sales of $119.3 million and principal repayment of $14.9 million.
82
Table of Contents
CRE Concentration
We have policies and procedures in place to monitor compliance with the CRE Concentration Guidance. We have set targets for CRE concentration limits as a percentage of total capital in accordance with interagency guidelines and actively manage our exposure to CRE lending. Our construction and land development loans remain a small portion of our portfolio and as a percentage of total capital (as defined by the federal bank regulators) were 16.7%, 15.7% and 15.7%, respectively, at March 31, 2018 and, December 31, 2017 and 2016. Commercial property loans less owner-occupied real estate loans plus construction and land development loans to total capital was 357.1%, 355.1% and 352.1%, respectively, at March 31, 2018 and, December 31, 2017 and 2016. While this is above the 300% guideline in the CRE Concentration Guidance, we believe we are appropriately managing our CRE concentration consistent with safe and sound banking operations.
We believe that the Bank has robust risk management framework in place for CRE concentration issues including board approved CRE concentration contingency plans. The CRE concentration contingency plan contains overview of the Bank’s strategies to mitigate and manage the concentration risks including the plans to maintain stable capital levels, having access to additional capital, maintaining adequate amount of Allowance, potentially implementing more conservative growth/lending strategies if necessary, maintaining liquidity within the CRE portfolio, and strengthening the loan workout infrastructure.
Loan Quality
We use what we believe is a comprehensive methodology to monitor credit quality and prudently manage credit concentration within our loan portfolio. Our underwriting policies and practices govern the risk profile and credit and geographic concentration for our loan portfolio. We also have what we believe to be a comprehensive methodology to monitor these credit quality standards, including a risk classification system that identifies potential problem loans based on risk characteristics by loan type as well as the early identification of deterioration at the individual loan level. In addition to our allowance for loan losses, our purchase discounts on acquired loans provide additional protections against credit losses.
83
Table of Contents
Analysis of the Allowance for Loan Losses. The following table allocates the allowance for loan losses, or the allowance, by category as of the dates indicated:
| March 31, 2018 |
December 31, | |||||||||||||||||||||||||||||||||||||||||||||||
| 2017 | 2016 | 2015 | 2014 | 2013 | ||||||||||||||||||||||||||||||||||||||||||||
| (Dollars in thousands) | Amount | Percentage to Total Allowance |
Amount | Percentage to Gross Loans |
Amount | Percentage to Total Allowance |
Amount | Percentage to Total Allowance |
Amount | Percentage to Total Allowance |
Amount | Percentage to Total Allowance |
||||||||||||||||||||||||||||||||||||
| Real estate loans: |
||||||||||||||||||||||||||||||||||||||||||||||||
| Commercial property |
$ | 6,603 | 53.3 | % | $ | 6,366 | 52.1 | % | $ | 5,904 | 52.2 | % | $ | 3,615 | 38.7 | % | $ | 3,797 | 40.2 | % | $ | 2,227 | 17.6 | % | ||||||||||||||||||||||||
| Residential property |
929 | 7.5 | % | 833 | 6.8 | % | 674 | 6.0 | % | 527 | 5.6 | % | 691 | 7.3 | % | 631 | 5.0 | % | ||||||||||||||||||||||||||||||
| SBA property |
1,336 | 10.8 | % | 1,124 | 9.2 | % | 801 | 7.1 | % | 822 | 8.8 | % | 942 | 10.0 | % | 629 | 5.0 | % | ||||||||||||||||||||||||||||||
| Construction |
208 | 1.7 | % | 184 | 1.5 | % | 118 | 1.0 | % | 10 | 0.1 | % | 1 | 0.0 | % | 134 | 1.1 | % | ||||||||||||||||||||||||||||||
|
|
|
|
|
|
|
|
|
|
|
|
|
|
|
|
|
|
|
|
|
|
|
|
|
|||||||||||||||||||||||||
| Total real estate loans |
9,076 | 73.3 | % | 8,507 | 69.6 | % | 7,497 | 66.3 | % | 4,974 | 53.2 | % | 5,431 | 57.5 | % | 3,621 | 28.7 | % | ||||||||||||||||||||||||||||||
| Commercial and industrial loans: |
||||||||||||||||||||||||||||||||||||||||||||||||
| Commercial term |
1,327 | 10.7 | % | 1,513 | 12.4 | % | 1,828 | 16.1 | % | 1,408 | 15.1 | % | 2,146 | 22.8 | % | 5,526 | 43.8 | % | ||||||||||||||||||||||||||||||
| Commercial lines of credit |
879 | 7.1 | % | 1,091 | 8.9 | % | 777 | 6.9 | % | 1,692 | 18.1 | % | 341 | 3.6 | % | 903 | 7.2 | % | ||||||||||||||||||||||||||||||
| SBA commercial term |
860 | 7.0 | % | 909 | 7.4 | % | 990 | 8.7 | % | 1,000 | 10.7 | % | 1,180 | 12.5 | % | 1,878 | 14.9 | % | ||||||||||||||||||||||||||||||
| International loans |
34 | 0.3 | % | 35 | 0.3 | % | 62 | 0.5 | % | 52 | 0.6 | % | 34 | 0.4 | % | 199 | 1.6 | % | ||||||||||||||||||||||||||||||
|
|
|
|
|
|
|
|
|
|
|
|
|
|
|
|
|
|
|
|
|
|
|
|
|
|||||||||||||||||||||||||
| Total commercial and industrial loans |
3,100 | 25.1 | % | 3,548 | 29.0 | % | 3,657 | 32.2 | % | 4,152 | 44.5 | % | 3,701 | 39.3 | % | 8,506 | 67.5 | % | ||||||||||||||||||||||||||||||
| Consumer loans |
195 | 1.6 | % | 169 | 1.4 | % | 166 | 1.5 | % | 219 | 2.3 | % | 300 | 3.2 | % | 479 | 3.8 | % | ||||||||||||||||||||||||||||||
|
|
|
|
|
|
|
|
|
|
|
|
|
|
|
|
|
|
|
|
|
|
|
|
|
|||||||||||||||||||||||||
| Allowance for loan losses |
$ | 12,371 | 100.0 | % | $ | 12,224 | 100.0 | % | $ | 11,320 | 100.0 | % | $ | 9,345 | 100.0 | % | $ | 9,432 | 100.0 | % | $ | 12,606 | 100.0 | % | ||||||||||||||||||||||||
|
|
|
|
|
|
|
|
|
|
|
|
|
|||||||||||||||||||||||||||||||||||||
The allowance represents our estimate of probable and reasonably estimable credit losses inherent in loans held for investment as of the respective balance sheet date.
Allowance for loan losses. Our methodology for assessing the appropriateness of the allowance for loan losses includes a general allowance for performing loans, which are grouped based on similar characteristics, and a specific allowance for individual impaired loans or loans considered by management to be in a high-risk category. General allowances are established based on a number of factors, including historical loss rates, an assessment of portfolio trends and conditions, accrual status and economic conditions.
For any loan held for investment, a specific allowance may be assigned based on an impairment analysis. Loans are considered impaired when it is probable that we will be unable to collect all amounts due according to the contractual terms of the loan agreement. The amount of impairment is based on an analysis of the most probable source of repayment, including the present value of the loan’s expected future cash flows, the estimated market value or the fair value of the underlying collateral. Interest income on impaired loans is accrued as earned, unless the loan is placed on nonaccrual status.
Individual loans considered to be uncollectible are charged off against the allowance. Factors used in determining the amount and timing of charge-offs on loans include consideration of the loan type, length of delinquency, sufficiency of collateral value, lien priority and the overall financial condition of the borrower. Collateral value is determined using updated appraisals and/or other market comparable information. Charge-offs are generally taken on loans once the impairment is determined to be other-than-temporary. Recoveries on loans previously charged off are added to the allowance. Net charge-offs (recoveries) to average loans were (0.02)%, 0.08%, 0.03% and 0.06%, respectively, for the three months ended March 31, 2018, and the years ended December 31, 2017, 2016 and 2015, respectively.
Allowance for loan losses totaled $12.4 million, $12.2 million, $11.3 million and $9.3 million, respectively, at March 31, 2018, and December 31, 2017, 2016 and 2015. The increases was primarily due to an increase in general reserves and loan growth for the three months ended March 31, 2018 and the year ended December 31, 2017.
84
Table of Contents
We analyze the loan portfolio, including delinquencies, concentrations, and risk characteristics, at least quarterly in order to assess the overall level of the allowance. We also rely on internal and external loan review procedures to further assess individual loans and loan pools, and economic data for overall industry and geographic trends.
In determining the allowance and the related provision for loan losses, we consider three principal elements: (i) valuation allowances based upon probable incurred losses identified during the review of impaired C&I, commercial property and construction loans, (ii) allocations, by loan classes, on loan portfolios based on historical loan loss experience and (iii) qualitative factors. Provisions for loan losses are charged to operations to record changes to the total allowance to a level deemed appropriate by us.
The following table provides an analysis of the allowance for loan losses, provision for loan losses and net charge-offs for the periods indicated:
| As of or For the Three Months Ended March 31, 2018 | ||||||||||||||||
| (Dollars in thousands) | Real Estate | Commercial and Industrial |
Consumer | Total | ||||||||||||
| Allowance for loan losses: |
||||||||||||||||
| Beginning balances |
$ | 8,507 | $ | 3,548 | $ | 169 | $ | 12,224 | ||||||||
| Charge-offs |
(125 | ) | — | (14 | ) | (139 | ) | |||||||||
| Recoveries |
2 | 180 | 9 | 191 | ||||||||||||
| Provision (reversal) for loan losses |
692 | (628 | ) | 31 | 95 | |||||||||||
|
|
|
|
|
|
|
|
|
|||||||||
| Ending balances |
$ | 9,076 | $ | 3,100 | $ | 195 | $ | 12,371 | ||||||||
|
|
|
|
|
|
|
|
|
|||||||||
| Average loans balances |
$ | 1,017,468 | $ | 163,489 | $ | 33,147 | $ | 1,214,104 | ||||||||
|
|
|
|
|
|
|
|
|
|||||||||
| Ratios: |
||||||||||||||||
| Net charge-offs (recoveries) to average loans |
0.05 | % | -0.44 | % | 0.06 | % | -0.02 | % | ||||||||
| Allowance for loan losses to total loans |
0.89 | % | 1.83 | % | 0.60 | % | 1.01 | % | ||||||||
| As of For The Three Months Ended March 31, 2017 | ||||||||||||||||
| (Dollars in thousands) | Real Estate | Commercial and Industrial |
Consumer | Total | ||||||||||||
| Allowance for loan losses: |
||||||||||||||||
| Beginning balances |
$ | 7,497 | $ | 3,657 | $ | 166 | $ | 11,320 | ||||||||
| Charge-offs |
— | (6 | ) | (12 | ) | (18 | ) | |||||||||
| Recoveries |
1 | 195 | 15 | 211 | ||||||||||||
| Provision (reversal) for loan losses |
239 | (436 | ) | (1 | ) | (198 | ) | |||||||||
|
|
|
|
|
|
|
|
|
|||||||||
| Ending balances |
$ | 7,737 | $ | 3,410 | $ | 168 | $ | 11,315 | ||||||||
|
|
|
|
|
|
|
|
|
|||||||||
| Average loans balances |
$ | 866,793 | $ | 138,306 | $ | 33,806 | $ | 1,038,905 | ||||||||
|
|
|
|
|
|
|
|
|
|||||||||
| Ratios: |
||||||||||||||||
| Net charge-offs (recoveries) to average loans |
0.00 | % | -0.55 | % | -0.04 | % | -0.07 | % | ||||||||
| Allowance for loan losses to total loans |
0.89 | % | 2.27 | % | 0.50 | % | 1.07 | % | ||||||||
85
Table of Contents
| As of or For the Year Ended December 31, 2017 | ||||||||||||||||
| (Dollars in thousands) | Real Estate | Commercial and Industrial |
Consumer | Total | ||||||||||||
| Allowance for loan losses: |
||||||||||||||||
| Beginning balances |
$ | 7,497 | $ | 3,657 | $ | 166 | $ | 11,320 | ||||||||
| Charge-offs |
(168 | ) | (1,320 | ) | (88 | ) | (1,576 | ) | ||||||||
| Recoveries |
1 | 580 | 72 | 653 | ||||||||||||
| Provision (reversal) for loan losses |
1,177 | 631 | 19 | 1,827 | ||||||||||||
|
|
|
|
|
|
|
|
|
|||||||||
| Ending balances |
$ | 8,507 | $ | 3,548 | $ | 169 | $ | 12,224 | ||||||||
|
|
|
|
|
|
|
|
|
|||||||||
| Average loans balances |
$ | 906,020 | $ | 160,746 | $ | 32,959 | $ | 1,099,725 | ||||||||
|
|
|
|
|
|
|
|
|
|||||||||
| Ratios: |
||||||||||||||||
| Net charge-offs (recoveries) to average loans |
0.02 | % | 0.46 | % | 0.05 | % | 0.08 | % | ||||||||
| Allowance for loan losses to total loans |
0.86 | % | 2.08 | % | 0.50 | % | 1.03 | % | ||||||||
| As of or For the Year Ended December 31, 2016 | ||||||||||||||||
| (Dollars in thousands) | Real Estate | Commercial and Industrial |
Consumer | Total | ||||||||||||
| Allowance for loan losses: |
||||||||||||||||
| Beginning balances |
$ | 4,974 | $ | 4,152 | $ | 218 | $ | 9,344 | ||||||||
| Charge-offs |
— | (729 | ) | (38 | ) | (767 | ) | |||||||||
| Recoveries |
1 | 406 | 52 | 459 | ||||||||||||
| Provision (reversal) for loan losses |
2,522 | (172 | ) | (67 | ) | 2,283 | ||||||||||
|
|
|
|
|
|
|
|
|
|||||||||
| Ending balances |
$ | 7,497 | $ | 3,657 | $ | 165 | $ | 11,319 | ||||||||
|
|
|
|
|
|
|
|
|
|||||||||
| Average loans balances |
$ | 783,120 | $ | 127,672 | $ | 31,245 | $ | 942,037 | ||||||||
|
|
|
|
|
|
|
|
|
|||||||||
| Ratios: |
||||||||||||||||
| Net charge-offs (recoveries) to average loans |
0.00 | % | 0.25 | % | -0.04 | % | 0.03 | % | ||||||||
| Allowance for loan losses to total loans |
0.87 | % | 2.61 | % | 0.49 | % | 1.10 | % | ||||||||
| As of or For the Year Ended December 31, 2015 | ||||||||||||||||
| (Dollars in thousands) | Real Estate | Commercial and Industrial |
Consumer | Total | ||||||||||||
| Allowance for loan losses: |
||||||||||||||||
| Beginning balances |
$ | 5,431 | $ | 3,701 | $ | 300 | $ | 9,432 | ||||||||
| Charge-offs |
(622 | ) | (597 | ) | (131 | ) | (1,350 | ) | ||||||||
| Recoveries |
35 | 687 | 128 | 850 | ||||||||||||
| Provision (reversal) for loan losses |
130 | 361 | (78 | ) | 413 | |||||||||||
|
|
|
|
|
|
|
|
|
|||||||||
| Ending balances |
$ | 4,974 | $ | 4,152 | $ | 219 | $ | 9,345 | ||||||||
|
|
|
|
|
|
|
|
|
|||||||||
| Average loans balances |
$ | 659,177 | $ | 104,666 | $ | 28,997 | $ | 792,840 | ||||||||
|
|
|
|
|
|
|
|
|
|||||||||
| Ratios: |
||||||||||||||||
| Net charge-offs (recoveries) to average loans |
0.09 | % | -0.09 | % | 0.01 | % | 0.06 | % | ||||||||
| Allowance for loan losses to total loans |
0.71 | % | 3.74 | % | 0.75 | % | 1.11 | % | ||||||||
86
Table of Contents
| As of or For the Year Ended December 31, 2014 | ||||||||||||||||
| (Dollars in thousands) | Real Estate | Commercial and Industrial |
Consumer | Total | ||||||||||||
| Allowance for loan losses: |
||||||||||||||||
| Beginning balances |
$ | 3,622 | $ | 8,506 | $ | 478 | $ | 12,606 | ||||||||
| Charge-offs |
(488 | ) | (2,601 | ) | (114 | ) | (3,203 | ) | ||||||||
| Recoveries |
255 | 782 | 89 | 1,126 | ||||||||||||
| Provision (reversal) for loan losses |
2,042 | (2,986 | ) | (153 | ) | (1,097 | ) | |||||||||
|
|
|
|
|
|
|
|
|
|||||||||
| Ending balances |
$ | 5,431 | $ | 3,701 | $ | 300 | $ | 9,432 | ||||||||
|
|
|
|
|
|
|
|
|
|||||||||
| Average loans balances |
$ | 547,038 | $ | 92,936 | $ | 30,400 | $ | 670,374 | ||||||||
|
|
|
|
|
|
|
|
|
|||||||||
| Ratios: |
||||||||||||||||
| Net charge-offs (recoveries) to average loans |
0.04 | % | 1.96 | % | 0.08 | % | 0.31 | % | ||||||||
| Allowance for loan losses to total loans |
0.89 | % | 3.93 | % | 0.99 | % | 1.29 | % | ||||||||
| As of or For the Year Ended December 31, 2013 | ||||||||||||||||
| (Dollars in thousands) | Real Estate | Commercial and Industrial |
Consumer | Total | ||||||||||||
| Allowance for loan losses: |
||||||||||||||||
| Beginning balances |
$ | 3,713 | $ | 9,935 | $ | 1,019 | $ | 14,667 | ||||||||
| Charge-offs |
(938 | ) | (2,550 | ) | (60 | ) | (3,548 | ) | ||||||||
| Recoveries |
88 | 610 | 82 | 780 | ||||||||||||
| Provision (reversal) for loan losses |
758 | 511 | (562 | ) | 707 | |||||||||||
|
|
|
|
|
|
|
|
|
|||||||||
| Ending balances |
$ | 3,621 | $ | 8,506 | $ | 479 | $ | 12,606 | ||||||||
|
|
|
|
|
|
|
|
|
|||||||||
| Average loans balances |
$ | 439,016 | $ | 91,776 | $ | 30,384 | $ | 561,176 | ||||||||
|
|
|
|
|
|
|
|
|
|||||||||
| Ratios: |
||||||||||||||||
| Net charge-offs (recoveries) to average loans |
0.19 | % | 2.11 | % | -0.07 | % | 0.49 | % | ||||||||
| Allowance for loan losses to total loans |
0.75 | % | 9.62 | % | 1.58 | % | 2.09 | % | ||||||||
Problem Loans. Loans are considered delinquent when principal or interest payments are past due 30 days or more; delinquent loans may remain on accrual status between 30 days and 89 days past due. Loans on which the accrual of interest has been discontinued are designated as nonaccrual loans. Typically, the accrual of interest on loans is discontinued when principal or interest payments are past due 90 days or when, in the opinion of management, there is a reasonable doubt as to collectability in the normal course of business. When loans are placed on nonaccrual status, all interest previously accrued but not collected is reversed against current period interest income. Income on nonaccrual loans is subsequently recognized only to the extent that cash is received and the loan’s principal balance is deemed collectible. Loans are restored to accrual status when loans become well-secured and management believes full collectability of principal and interest is probable.
A loan is considered impaired when it is probable that we will be unable to collect all amounts due according to the contractual terms of the loan agreement. Impaired loans include loans on nonaccrual status and performing restructured loans. Income from loans on nonaccrual status is recognized to the extent cash is received and when the loan’s principal balance is deemed collectible. Depending on a particular loan’s circumstances, we measure impairment of a loan based upon either the present value of expected future cash flows discounted at the loan’s effective interest rate, the loan’s observable market price, or the fair value of the collateral less estimated costs to sell if the loan is collateral dependent. A loan is considered collateral dependent when repayment of the loan is based solely on the continued operation of the collateral or liquidation of the collateral. Fair value, where possible, is determined by independent appraisals, typically on a semiannual basis. Between appraisal periods, the fair value may be adjusted based on specific events, such as if deterioration of quality of the collateral comes to our attention as part of our problem loan monitoring process, or if discussions with the borrower lead us to believe the last appraised value no longer reflects the actual market for the collateral. The impairment amount on
87
Table of Contents
a collateral-dependent loan is charged-off to the allowance if deemed not collectible and the impairment amount on a loan that is not collateral-dependent is set up as a specific reserve.
In cases where a borrower experiences financial difficulties and we make certain concessionary modifications to contractual terms, the loan is classified as a troubled debt restructuring, or TDR. These concessions may include a reduction of the interest rate, principal or accrued interest, extension of the maturity date or other actions intended to minimize potential losses. Loans restructured at a rate equal to or greater than that of a new loan with comparable risk at the time the loan is modified may be excluded from restructured loan disclosures in years subsequent to the restructuring if the loans are in compliance with their modified terms. A restructured loan is considered impaired despite its accrual status and a specific reserve is calculated based on the present value of expected cash flows discounted at the loan’s effective interest rate or the fair value of the collateral less estimated costs to sell if the loan is collateral dependent.
Real estate we acquire as a result of foreclosure or by deed-in-lieu of foreclosure is classified as OREO until sold, and is carried at the balance of the loan at the time of foreclosure or at estimated fair value less estimated costs to sell, whichever is less.
The following table sets forth the allocation of our TDRs and NPAs among our different asset categories as of the dates indicated. Nonperforming loans include nonaccrual loans, loans past due 90 days or more and still accruing interest. The balances of nonperforming loans reflect the net investment in these assets.
| March 31, |
December 31, | |||||||||||||||||||||||
| (Dollars in thousands) | 2018 | 2017 | 2016 | 2015 | 2014 | 2013 | ||||||||||||||||||
| Troubled debt restructured loans: |
||||||||||||||||||||||||
| Real estate: |
||||||||||||||||||||||||
| Commercial property |
$ | 311 | $ | 318 | $ | 435 | $ | 486 | $ | 531 | $ | 1,992 | ||||||||||||
| SBA property |
328 | 1,373 | 1,540 | 1,899 | 2,177 | 2,690 | ||||||||||||||||||
| Commercial and industrial |
||||||||||||||||||||||||
| Commercial term |
183 | 199 | 458 | 1,189 | 4,692 | 6,844 | ||||||||||||||||||
| Commercial lines of credit |
10 | 115 | — | — | — | |||||||||||||||||||
| SBA commercial term |
327 | 367 | 311 | 512 | 782 | 902 | ||||||||||||||||||
| Consumer |
— | — | — | — | 104 | 141 | ||||||||||||||||||
|
|
|
|
|
|
|
|
|
|
|
|
|
|||||||||||||
| Total troubled debt restructured loans |
$ | 1,149 | $ | 2,267 | $ | 2,859 | $ | 4,086 | $ | 8,286 | $ | 12,569 | ||||||||||||
|
|
|
|
|
|
|
|
|
|
|
|
|
|||||||||||||
| Nonaccrual loans: |
||||||||||||||||||||||||
| Real estate: |
||||||||||||||||||||||||
| Commercial property |
$ | 311 | $ | 318 | $ | 57 | $ | 78 | $ | 534 | $ | 1,514 | ||||||||||||
| Residential property |
730 | 730 | — | — | — | — | ||||||||||||||||||
| SBA property |
1,022 | 1,810 | 602 | 998 | 1,109 | 1,332 | ||||||||||||||||||
| Commercial and industrial |
||||||||||||||||||||||||
| Commercial term |
— | 4 | 169 | 706 | 3,905 | 2,166 | ||||||||||||||||||
| Commercial lines of credit |
— | 10 | 115 | — | 90 | 549 | ||||||||||||||||||
| SBA commercial term |
318 | 338 | 866 | 554 | 723 | 1,508 | ||||||||||||||||||
| International loans |
— | — | — | — | — | 1,740 | ||||||||||||||||||
| Consumer |
16 | 24 | 39 | 36 | 91 | 50 | ||||||||||||||||||
|
|
|
|
|
|
|
|
|
|
|
|
|
|||||||||||||
| Total nonaccrual loans |
$ | 2,397 | $ | 3,234 | $ | 1,848 | $ | 2,372 | $ | 6,452 | $ | 8,859 | ||||||||||||
| Loans past due 90 days or more and still accruing |
— | — | — | — | — | — | ||||||||||||||||||
|
|
|
|
|
|
|
|
|
|
|
|
|
|||||||||||||
| Total nonperforming loans |
$ | 2,397 | $ | 3,234 | $ | 1,848 | $ | 2,372 | $ | 6,452 | $ | 8,859 | ||||||||||||
| Other real estate owned |
— | 99 | 506 | — | — | 891 | ||||||||||||||||||
|
|
|
|
|
|
|
|
|
|
|
|
|
|||||||||||||
| Nonperforming assets |
$ | 2,397 | $ | 3,333 | $ | 2,354 | $ | 2,372 | $ | 6,452 | $ | 9,750 | ||||||||||||
|
|
|
|
|
|
|
|
|
|
|
|
|
|||||||||||||
| Ratios: |
||||||||||||||||||||||||
| Nonperforming loans to total loans |
0.20 | % | 0.27 | % | 0.18 | % | 0.28 | % | 0.88 | % | 1.47 | % | ||||||||||||
| Nonperforming assets to total assets |
0.15 | % | 0.23 | % | 0.19 | % | 0.23 | % | 0.72 | % | 1.29 | % | ||||||||||||
88
Table of Contents
We did not recognize any interest income on nonaccrual loans during the three months ended March 31, 2018 or 2017, or the years ended December 31, 2017 or 2016, while the loans were in nonaccrual status. Additional interest income that we would have recognized on impaired loans had they been current in accordance with their original terms was $82 thousand, $78 thousand, $294 thousand, $243 thousand and $412 thousand during the three months ended March 31, 2018 and 2017, and the years ended December 31, 2017, 2016 and 2015, respectively. We recognized interest income on impaired loans in the amount of $14 thousand, $20 thousand, $134 thousand, $161 thousand and none during the three months ended March 31, 2018 and 2017, and the years ended December 31, 2017, 2016 and 2015, respectively. We recognized interest income on loans modified under troubled debt restructurings of $10 thousand, $20 thousand, $83 thousand, $160 thousand and none during the three months ended March 31, 2018 and 2017, and the years ended December 31, 2017, 2016 and 2015, respectively.
We utilize an asset risk classification system in compliance with guidelines established by the FDIC as part of our efforts to improve asset quality. In connection with examinations of insured institutions, examiners have the authority to identify problem assets and, if appropriate, classify them. There are three classifications for problem assets: “substandard,” “doubtful,” and “loss.” Substandard assets have one or more defined weaknesses and are characterized by the distinct possibility that the insured institution will sustain some loss if the deficiencies are not corrected. Doubtful assets have the weaknesses of substandard assets with the additional characteristic that the weaknesses make collection or liquidation in full questionable and there is a high probability of loss based on currently existing facts, conditions and values. An asset classified as loss is not considered collectable and is of such little value that continuance as an asset is not warranted.
We use a risk grading system to categorize and determine the credit risk of our loans. Potential problem loans include loans with a risk grade of 5, which are is “special mention,” and loans with a risk grade of 6, which are “substandard” loans. Potential problem loans with a risk grade of 7, are “doubtful,” and generally considered to be impaired. These loans generally require more frequent loan officer contact and receipt of financial data to closely monitor borrower performance. Potential problem loans are managed and monitored regularly through a number of processes, procedures and committees, including oversight by a loan administration committee comprised of executive officers and other members of the Bank’s senior management.
The following tables present the recorded investment of potential problem loans by loan category as of the dates indicated:
| March 31, 2018 | ||||||||||||||||
| (Dollars in thousands) | Pass | Special Mention |
Substandard | Total | ||||||||||||
| Real estate loans: |
||||||||||||||||
| Commercial property |
$ | 670,441 | $ | 4,787 | $ | 501 | $ | 675,729 | ||||||||
| Residential property |
184,022 | — | 730 | 184,752 | ||||||||||||
| SBA property |
129,062 | 2,812 | 2,366 | 134,240 | ||||||||||||
| Construction |
26,089 | — | — | 26,089 | ||||||||||||
| Commercial and industrial loans: |
||||||||||||||||
| Commercial term |
79,625 | — | 138 | 79,763 | ||||||||||||
| Commercial lines of credit |
58,195 | — | — | 58,195 | ||||||||||||
| SBA commercial term |
28,707 | 1 | 629 | 29,337 | ||||||||||||
| International loans |
2,115 | — | — | 2,115 | ||||||||||||
| Consumer |
32,688 | — | 16 | 32,704 | ||||||||||||
|
|
|
|
|
|
|
|
|
|||||||||
| Gross Loans |
$ | 1,210,944 | $ | 7,600 | $ | 4,380 | $ | 1,222,924 | ||||||||
|
|
|
|
|
|
|
|
|
|||||||||
89
Table of Contents
| December 31, 2017 | ||||||||||||||||
| (Dollars in thousands) | Pass | Special Mention |
Substandard | Total | ||||||||||||
| Real estate loans: |
||||||||||||||||
| Commercial property |
$ | 657,511 | $ | 4,819 | $ | 510 | $ | 662,840 | ||||||||
| Residential property |
168,168 | — | 730 | 168,898 | ||||||||||||
| SBA property |
124,837 | 2,435 | 3,166 | 130,438 | ||||||||||||
| Construction |
23,215 | — | — | 23,215 | ||||||||||||
| Commercial and industrial loans: |
||||||||||||||||
| Commercial term |
77,261 | — | 177 | 77,438 | ||||||||||||
| Commercial lines of credit |
60,840 | — | 10 | 60,850 | ||||||||||||
| SBA commercial term |
29,831 | 4 | 364 | 30,199 | ||||||||||||
| International loans |
1,920 | — | — | 1,920 | ||||||||||||
| Consumer |
33,845 | — | 25 | 33,870 | ||||||||||||
|
|
|
|
|
|
|
|
|
|||||||||
| Gross Loans |
$ | 1,177,428 | $ | 7,258 | $ | 4,982 | $ | 1,189,668 | ||||||||
|
|
|
|
|
|
|
|
|
|||||||||
| December 31, 2016 | ||||||||||||||||
| (Dollars in thousands) | Pass | Special Mention |
Substandard | Total | ||||||||||||
| Real estate loans: |
||||||||||||||||
| Commercial property |
$ | 589,717 | $ | 5,768 | $ | 1,610 | $ | 597,095 | ||||||||
| Residential property |
140,766 | — | — | 140,766 | ||||||||||||
| SBA property |
100,599 | 63 | 3,448 | 104,110 | ||||||||||||
| Construction |
15,129 | — | — | 15,129 | ||||||||||||
| Commercial and industrial loans: |
||||||||||||||||
| Commercial term |
63,417 | — | 1,509 | 64,926 | ||||||||||||
| Commercial lines of credit |
43,556 | — | 1,615 | 45,171 | ||||||||||||
| SBA commercial term |
25,611 | 11 | 845 | 26,467 | ||||||||||||
| International loans |
3,545 | — | — | 3,545 | ||||||||||||
| Consumer |
33,683 | — | 39 | 33,722 | ||||||||||||
|
|
|
|
|
|
|
|
|
|||||||||
| Gross Loans |
$ | 1,016,023 | $ | 5,842 | $ | 9,066 | $ | 1,030,931 | ||||||||
|
|
|
|
|
|
|
|
|
|||||||||
| December 31, 2015 | ||||||||||||||||
| (Dollars in thousands) | Pass | Special Mention |
Substandard | Total | ||||||||||||
| Real estate loans: |
||||||||||||||||
| Commercial property |
$ | 478,866 | $ | 6,158 | $ | 290 | $ | 485,314 | ||||||||
| Residential property |
129,585 | — | — | 129,585 | ||||||||||||
| SBA property |
84,208 | — | 2,888 | 87,096 | ||||||||||||
| Construction |
2,153 | — | — | 2,153 | ||||||||||||
| Commercial and industrial loans: |
||||||||||||||||
| Commercial term |
50,263 | — | 1,455 | 51,718 | ||||||||||||
| Commercial lines of credit |
29,297 | — | 1,429 | 30,726 | ||||||||||||
| SBA commercial term |
24,862 | — | 440 | 25,302 | ||||||||||||
| International loans |
3,248 | — | — | 3,248 | ||||||||||||
| Consumer |
29,098 | — | 36 | 29,134 | ||||||||||||
|
|
|
|
|
|
|
|
|
|||||||||
| Gross Loans |
$ | 831,580 | $ | 6,158 | $ | 6,538 | $ | 844,276 | ||||||||
|
|
|
|
|
|
|
|
|
|||||||||
90
Table of Contents
| December 31, 2014 | ||||||||||||||||
| (Dollars in thousands) | Pass | Special Mention |
Substandard | Total | ||||||||||||
| Real estate loans: |
||||||||||||||||
| Commercial property |
$ | 414,566 | $ | 2,307 | $ | 754 | $ | 417,627 | ||||||||
| Residential property |
115,423 | — | — | 115,423 | ||||||||||||
| SBA property |
71,253 | — | 3,620 | 74,873 | ||||||||||||
| Construction |
40 | — | — | 40 | ||||||||||||
| Commercial and industrial loans: |
||||||||||||||||
| Commercial term |
41,297 | — | 5,071 | 46,368 | ||||||||||||
| Commercial lines of credit |
22,325 | — | 150 | 22,475 | ||||||||||||
| SBA commercial term |
21,193 | — | 639 | 21,832 | ||||||||||||
| International loans |
3,405 | — | — | 3,405 | ||||||||||||
| Consumer |
30,109 | — | 193 | 30,302 | ||||||||||||
|
|
|
|
|
|
|
|
|
|||||||||
| Gross Loans |
$ | 719,611 | $ | 2,307 | $ | 10,427 | $ | 732,345 | ||||||||
|
|
|
|
|
|
|
|
|
|||||||||
| December 31, 2013 | ||||||||||||||||
| (Dollars in thousands) | Pass | Special Mention |
Substandard | Total | ||||||||||||
| Real estate loans: |
||||||||||||||||
| Commercial property |
$ | 330,115 | $ | 4,958 | $ | 1,658 | $ | 336,731 | ||||||||
| Residential property |
84,722 | — | — | 84,722 | ||||||||||||
| SBA property |
55,877 | 332 | 4,351 | 60,560 | ||||||||||||
| Construction |
2,101 | — | — | 2,101 | ||||||||||||
| Commercial and industrial loans: |
||||||||||||||||
| Commercial term |
36,063 | 1,635 | 7,943 | 45,641 | ||||||||||||
| Commercial lines of credit |
15,006 | — | 549 | 15,555 | ||||||||||||
| SBA commercial term |
16,696 | — | 882 | 17,578 | ||||||||||||
| International loans |
7,906 | — | 1,740 | 9,646 | ||||||||||||
| Consumer |
30,071 | — | 173 | 30,244 | ||||||||||||
|
|
|
|
|
|
|
|
|
|||||||||
| Gross Loans |
$ | 578,557 | $ | 6,925 | $ | 17,296 | $ | 602,778 | ||||||||
|
|
|
|
|
|
|
|
|
|||||||||
Securities. Our investment strategy aims to maximize earnings while maintaining liquidity in securities with minimal credit risk. The types and maturities of securities purchased are primarily based on our current and projected liquidity and interest rate sensitivity positions.
The following table sets forth the amortized cost and fair value of each category of securities as of the dates indicated.
| March 31, 2018 |
December 31, | |||||||||||||||||||||||||||||||
| 2017 | 2016 | 2015 | ||||||||||||||||||||||||||||||
| (Dollars in thousands) | Amortized Cost |
Fair Value |
Amortized Cost |
Fair Value |
Amortized Cost |
Fair Value |
Amortized Cost |
Fair Value |
||||||||||||||||||||||||
| Securities available-for-sale |
||||||||||||||||||||||||||||||||
| U.S. government and agency securities |
$ | 24,200 | $ | 23,701 | $ | 25,231 | $ | 24,925 | $ | 20,891 | $ | 20,579 | $ | 23,729 | $ | 23,571 | ||||||||||||||||
| Municipal bonds |
1,306 | 1,306 | 2,376 | 2,375 | 2,654 | 2,663 | 2,706 | 2,724 | ||||||||||||||||||||||||
| Mortgage-backed securities |
51,936 | 50,558 | 52,565 | 51,904 | 37,091 | 36,732 | 35,735 | 35,434 | ||||||||||||||||||||||||
| Collateralized mortgage obligations |
51,885 | 50,375 | 51,459 | 50,485 | 23,366 | 22,864 | 23,610 | 23,118 | ||||||||||||||||||||||||
|
|
|
|
|
|
|
|
|
|
|
|
|
|
|
|
|
|||||||||||||||||
| Total securities available-for-sale |
$ | 129,327 | $ | 125,940 | $ | 131,631 | $ | 129,689 | $ | 84,002 | $ | 82,838 | $ | 85,780 | $ | 84,847 | ||||||||||||||||
|
|
|
|
|
|
|
|
|
|
|
|
|
|
|
|
|
|||||||||||||||||
| Securities held-to-maturity |
||||||||||||||||||||||||||||||||
| Municipal bonds |
$ | 5,254 | $ | 5,273 | $ | 5,263 | $ | 5,439 | $ | 6,137 | $ | 6,075 | $ | 4,782 | $ | 4,802 | ||||||||||||||||
| Mortgage-backed securities |
15,572 | 14,979 | 15,807 | 15,558 | 11,447 | 11,261 | 12,556 | 12,465 | ||||||||||||||||||||||||
|
|
|
|
|
|
|
|
|
|
|
|
|
|
|
|
|
|||||||||||||||||
| Total securities held-to-maturity |
$ | 20,826 | $ | 20,252 | $ | 21,070 | $ | 20,997 | $ | 17,584 | $ | 17,336 | $ | 17,338 | $ | 17,267 | ||||||||||||||||
|
|
|
|
|
|
|
|
|
|
|
|
|
|
|
|
|
|||||||||||||||||
91
Table of Contents
The following tables set forth the book value, expected maturities and weighted average yields for our securities portfolio as of the dates indicated. The book value for securities classified as available for sale is equal to fair market value and the book value for securities classified as held to maturity is equal to amortized cost.
| March 31, 2018 | ||||||||||||||||||||||||||||||||||||||||
| Within One Year | After One Year But Within Five Years |
After Five Years But Within Ten Years |
After Ten Years | Total | ||||||||||||||||||||||||||||||||||||
| (Dollars in thousands) | Book Value |
Yield | Book Value |
Yield | Book Value |
Yield | Book Value |
Yield | Book Value |
Yield | ||||||||||||||||||||||||||||||
| Securities available-for-sale |
||||||||||||||||||||||||||||||||||||||||
| U.S. government and agency securities |
$ | — | 0.00 | % | $ | — | 0.00 | % | $ | 1,685 | 2.55 | % | $ | 22,016 | 2.30 | % | $ | 23,701 | 2.32 | % | ||||||||||||||||||||
| Municipal bonds(1) |
506 | 1.25 | % | — | 0.00 | % | 601 | 2.67 | % | 199 | 2.81 | % | 1,306 | 2.14 | % | |||||||||||||||||||||||||
| Mortgage-backed securities |
— | 0.00 | % | — | 0.00 | % | 10,014 | 1.93 | % | 40,544 | 2.29 | % | 50,558 | 2.22 | % | |||||||||||||||||||||||||
| Collateralized mortgage obligations |
— | 0.00 | % | — | 0.00 | % | 3,535 | 0.00 | % | 46,840 | 0.00 | % | 50,375 | 0.00 | % | |||||||||||||||||||||||||
|
|
|
|
|
|
|
|
|
|
|
|||||||||||||||||||||||||||||||
| Total securities available-for-sale |
$ | 506 | 1.25 | % | $ | — | 0.00 | % | $ | 15,835 | 2.05 | % | $ | 109,599 | 2.30 | % | $ | 125,940 | 2.25 | % | ||||||||||||||||||||
|
|
|
|
|
|
|
|
|
|
|
|||||||||||||||||||||||||||||||
| Securities held-to-maturity |
||||||||||||||||||||||||||||||||||||||||
| Municipal bonds |
$ | 127 | 1.25 | % | $ | 586 | 2.01 | % | $ | 1,944 | 2.77 | % | $ | 2,597 | 4.71 | % | $ | 5,254 | 3.61 | % | ||||||||||||||||||||
| Mortgage-backed securities |
— | 0.00 | % | 946 | 1.82 | % | 1,760 | 1.91 | % | 12,866 | 2.86 | % | 15,572 | 2.69 | % | |||||||||||||||||||||||||
|
|
|
|
|
|
|
|
|
|
|
|||||||||||||||||||||||||||||||
| Total securities held-to-maturity |
$ | 127 | 1.25 | % | $ | 1,532 | 1.89 | % | $ | 3,704 | 2.36 | % | $ | 15,463 | 3.17 | % | $ | 20,826 | 2.92 | % | ||||||||||||||||||||
|
|
|
|
|
|
|
|
|
|
|
|||||||||||||||||||||||||||||||
| December 31, 2017 | ||||||||||||||||||||||||||||||||||||||||
| Within One Year |
After One Year But Within Five Years |
After Five Years But Within Ten Years |
After Ten Years |
Total | ||||||||||||||||||||||||||||||||||||
| (Dollars in thousands) | Book Value |
Yield | Book Value |
Yield | Book Value |
Yield | Book Value |
Yield | Book Value |
Yield | ||||||||||||||||||||||||||||||
| Securities available-for-sale |
||||||||||||||||||||||||||||||||||||||||
| U.S. government and agency securities |
$ | — | 0.00 | % | $ | — | 0.00 | % | $ | 1,850 | 2.55 | % | $ | 23,075 | 2.24 | % | $ | 24,925 | 2.26 | % | ||||||||||||||||||||
| Municipal bonds(1) |
510 | 1.44 | % | 1,060 | 4.39 | % | 605 | 3.16 | % | 200 | 3.33 | % | 2,375 | 3.35 | % | |||||||||||||||||||||||||
| Mortgage-backed securities |
— | 0.00 | % | — | 0.00 | % | 7,871 | 1.85 | % | 44,033 | 2.15 | % | 51,904 | 2.10 | % | |||||||||||||||||||||||||
| Collateralized mortgage obligations |
— | 0.00 | % | — | 0.00 | % | 3,642 | 1.70 | % | 46,843 | 2.23 | % | 50,485 | 2.20 | % | |||||||||||||||||||||||||
|
|
|
|
|
|
|
|
|
|
|
|||||||||||||||||||||||||||||||
| Total securities available-for-sale |
$ | 510 | 1.44 | % | $ | 1,060 | 4.39 | % | $ | 13,968 | 1.96 | % | $ | 114,151 | 2.20 | % | $ | 129,689 | 2.19 | % | ||||||||||||||||||||
|
|
|
|
|
|
|
|
|
|
|
|||||||||||||||||||||||||||||||
| Securities held-to-maturity |
||||||||||||||||||||||||||||||||||||||||
| Municipal bonds |
$ | 128 | 1.44 | % | $ | 590 | 2.37 | % | $ | 1,950 | 3.29 | % | $ | 2,595 | 5.65 | % | $ | 5,263 | 4.30 | % | ||||||||||||||||||||
| Mortgage-backed securities |
— | 0.00 | % | 952 | 1.82 | % | 1,856 | 1.90 | % | 12,999 | 2.73 | % | 15,807 | 2.58 | % | |||||||||||||||||||||||||
|
|
|
|
|
|
|
|
|
|
|
|||||||||||||||||||||||||||||||
| Total securities held-to-maturity |
$ | 128 | 1.44 | % | $ | 1,542 | 2.03 | % | $ | 3,806 | 2.61 | % | $ | 15,594 | 3.22 | % | $ | 21,070 | 3.01 | % | ||||||||||||||||||||
|
|
|
|
|
|
|
|
|
|
|
|||||||||||||||||||||||||||||||
| (1) | The yield on municipal bonds has not been computed on a tax-equivalent basis. |
Management evaluates securities for other-than-temporary impairment (“OTTI”), on a quarterly basis, and more frequently when economic or market conditions warrant such an evaluation. For securities in an unrealized loss position, management considers the extent and duration of the unrealized loss, and the financial condition and near-term prospects of the issuer. As of March 31, 2018, and December 31, 2017 and 2016, 134, 124 and 87 securities, respectively, are in a loss position and the total unrealized loss on these securities was $4.0 million, $2.3 million and $1.5 million, respectively. Management also assesses whether it intends to sell, or it is more likely than not that it will be required to sell, a security in an unrealized loss position before recovery of its amortized cost basis. If either of the criteria regarding intent or requirement to sell is met, the entire difference between amortized cost and fair value is recognized as impairment through earnings. For debt securities that do not meet the aforementioned criteria, the amount of impairment is split into two components as follows; OTTI
92
Table of Contents
related to credit loss, which must be recognized in the income statement and; OTTI related to other factors, which is recognized in other comprehensive income. The credit loss is defined as the difference between the present value of the cash flows expected to be collected and the amortized cost basis. For equity securities, the entire amount of impairment is recognized through earnings.
Cash and Cash Equivalents. Cash and cash equivalents increased $107.9 million, or 146.5%, to $181.6 million as of March 31, 2018 as compared to December 31, 2017. The increase was due to $130.3 million of net cash provided by financing activities and $10.1 million of net cash provided by operating activities, partially offset by $32.5 million of net cash used in investing activities. Net cash provided by financing activities consisted primarily of an increase in deposits and net cash provided by operating activities consisted primarily of proceeds from sales of loans held-for-sale exceeding originations of loans held-for-sale. Net cash used by investing activities consisted primarily of a net increase in loans.
Cash and cash equivalents increased $3.7 million, or 5.3%, to $73.7 million as of December 31, 2017 as compared to December 31, 2016. The increase was due to $198.0 million of net cash provided by financing activities and $25.2 million of net cash provided by operating activities, partially offset by $219.5 million of net cash used in investing activities. Net cash provided by financing activities consisted primarily of an increase in deposits. Net cash provided by operating activities was primarily due to proceeds from sales of loans held-for-sale exceeding originations of loans held-for-sale. Net cash used in investing activities was primarily due to net increase in loans of $165.7 million and purchase of $66.9 million in securities available-for-sale.
Cash and cash equivalents decreased $7.0 million, or 9.1%, to $70.0 million as of December 31, 2016 as compared to December 31, 2015. This decrease was due to $214.6 million of net cash used in investing activities, partially offset by $40.8 million of net cash provided by operating activities and $166.8 million of net cash provided by financing activities Net cash used in investing activities primarily reflected $212.7 million in net loan increases. Net cash provided by investing activities consisted primarily of an increase in deposits and proceeds from issuance of common stock through private placement and net cash provided by operating activities was primarily due to proceeds from sales of loans held-for-sale exceeding originations of loans held-for-sale.
Liabilities. Total liabilities increased $131.9 million to $1.4 billion at March 31, 2018 as compared to $1.3 billion at December 31, 2017. The increase was primarily due to an increase of $130.6 million in deposits.
Total liabilities increased $200.2 million to $1.3 billion at December 31, 2017 as compared to $1.1 billion at December 31, 2016. This increase was primarily due to increases of $159.5 million in deposits and $40.0 million of borrowings from FHLB of San Francisco initiated in June 2017.
Deposits. We gather deposits primarily through our branch locations. We offer a variety of deposit products including demand deposits accounts, NOW and money market accounts, savings accounts and certificates of deposit (or time deposits). We put continued effort into gathering noninterest demand deposits accounts through marketing to our existing and new customers, customer referrals, our marketing staff and various involvement with community networks.
Total deposits increased $130.6 million, or 10.4%, to $1.4 billion at March 31, 2018 as compared to $1.3 billion at December 31, 2017. This increase was primarily due to increases in time deposits of $156.3 million and noninterest-bearing demand accounts of $2.1 million, partially offset by a decrease in savings, NOW and money market accounts of $27.8 million. As of March 31, 2018, total deposits were comprised of 23.2% noninterest-bearing demand accounts, 21.0% interest-bearing transaction accounts and 55.8% of time deposits.
93
Table of Contents
Total deposits increased $159.5 million, or 14.6%, to $1.3 billion at December 31, 2017 as compared to $1.1 billion at December 31, 2016. This increase was primarily due to increases in time deposits of $116.5 million and noninterest-bearing demand accounts of $45.0 million, partially offset by a decrease in savings, NOW and money market accounts of $2.1 million. As of December 31, 2017, total deposits were comprised of 25.5% noninterest-bearing demand accounts, 25.4% interest-bearing transaction accounts and 49.1% of time deposits.
Total deposits increased $152.4 million, or 16.2%, to $1.1 billion at December 31, 2016 as compared to $939.4 million at December 31, 2015. This increase primarily resulted from organic growth resulting from increased marketing activity surrounding our reaching $1 billion in assets. As of December 31, 2016, total deposits were comprised of 25.1% noninterest-bearing demand accounts, 29.3% interest-bearing transaction accounts and 45.6% of time deposits.
Time deposits from California State Treasurer totaled $100.0 million, $100.0 million and $78.7 million, respectively, and brokered time deposits totaled $52.5 million, $52.5 million and $39.1 million, respectively, at March 31, 2018, and December 31, 2017 and 2016. As of March 31, 2018, and December 31, 2017 and 2016, our directors and shareholders with deposits over $250,000 totaled $8.9 million, $8.2 million and $4.7 million, respectively, or 1.3%, 1.1% and 0.7%, respectively, of all of our deposit relationships over $250,000.
The following table summarizes our average deposit balances and weighted average rates for the periods indicated:
| Three Months Ended March 31, | ||||||||||||||||
| 2018 | 2017 | |||||||||||||||
| (Dollars in thousands) | Average Balance |
Average Rate |
Average Balance |
Average Rate |
||||||||||||
| Noninterest-bearing demand |
$ | 313,660 | 0.00 | % | $ | 275,151 | 0.00 | % | ||||||||
| Savings, NOW and MMA |
306,579 | 1.01 | % | 330,974 | 0.96 | % | ||||||||||
| Time deposits |
654,124 | 1.49 | % | 508,411 | 1.09 | % | ||||||||||
|
|
|
|
|
|||||||||||||
| Total deposits |
$ | 1,274,363 | 1.01 | % | $ | 1,114,536 | 0.78 | % | ||||||||
|
|
|
|
|
|||||||||||||
| Year Ended December 31, | ||||||||||||||||||||||||
| 2017 | 2016 | 2015 | ||||||||||||||||||||||
| (Dollars in thousands) | Average Balance |
Average Rate |
Average Balance |
Average Rate |
Average Balance |
Average Rate |
||||||||||||||||||
| Noninterest-bearing demand |
$ | 305,354 | 0.00 | % | $ | 271,628 | 0.00 | % | $ | 223,170 | 0.00 | % | ||||||||||||
| Savings, NOW and MMA |
329,574 | 0.99 | % | 260,236 | 0.88 | % | 215,998 | 0.83 | % | |||||||||||||||
| Time deposits |
539,068 | 1.20 | % | 468,953 | 1.01 | % | 440,300 | 1.01 | % | |||||||||||||||
|
|
|
|
|
|
|
|||||||||||||||||||
| Total deposits |
$ | 1,173,996 | 0.83 | % | $ | 1,000,817 | 0.70 | % | $ | 879,468 | 0.71 | % | ||||||||||||
|
|
|
|
|
|
|
|||||||||||||||||||
94
Table of Contents
The following table sets forth the maturity of time deposits as of the dates indicated:
| March 31, 2018 | ||||||||||||||||
| (Dollars in thousands) | Time Deposits of $250,000 or More |
Time Deposits of $100,000 or More and Less Than $250,000 |
Time Deposits Less Than $100,000 |
Total | ||||||||||||
| Three months or less |
$ | 140,626 | $ | 36,225 | $ | 18,200 | $ | 195,051 | ||||||||
| Over three months through six months |
29,031 | 46,827 | 29,485 | 105,343 | ||||||||||||
| Over six months through one year |
122,081 | 131,439 | 64,070 | 317,590 | ||||||||||||
| Over one year to three years |
43,647 | 44,394 | 62,115 | 150,156 | ||||||||||||
| Over three years |
— | — | 2,571 | 2,571 | ||||||||||||
|
|
|
|
|
|
|
|
|
|||||||||
| Total |
$ | 335,385 | $ | 258,885 | $ | 176,441 | $ | 770,711 | ||||||||
|
|
|
|
|
|
|
|
|
|||||||||
| December 31, 2017 | ||||||||||||||||
| (Dollars in thousands) | Time Deposits of $250,000 or More |
Time Deposits of $100,000 or More and Less Than $250,000 |
Time Deposits Less Than $100,000 |
Total | ||||||||||||
| Three months or less |
$ | 139,205 | $ | 49,002 | $ | 24,230 | $ | 212,437 | ||||||||
| Over three months through six months |
41,558 | 36,986 | 18,357 | 96,901 | ||||||||||||
| Over six months through one year |
68,582 | 90,321 | 53,903 | 212,806 | ||||||||||||
| Over one year to three years |
17,267 | 15,850 | 56,294 | 89,411 | ||||||||||||
| Over three years |
— | — | 2,831 | 2,831 | ||||||||||||
|
|
|
|
|
|
|
|
|
|||||||||
| Total |
$ | 266,612 | $ | 192,159 | $ | 155,615 | $ | 614,386 | ||||||||
|
|
|
|
|
|
|
|
|
|||||||||
Borrowings from FHLB. Other than deposits, we also utilized borrowings from FHLB as a supplementary funding source to finance our operations. Borrowings from the FHLB are collateralized by residential and commercial property loans. At March 31, 2018 and December 31, 2017, the borrowings amounted $40.0 million. We did not have any borrowings as of December 31, 2016. During the year ended December 31, 2016, deposit growth was sufficient enough to fund the loan and investment security growth.
The following table sets forth information on our borrowings from FHLB as of the dates or for the periods indicated:
| As of or for the Three Months Ended March 31, |
As of or for the Years Ended December 31, |
|||||||||||||||||||
| (Dollars in thousands) | 2018 | 2017 | 2017 | 2016 | 2015 | |||||||||||||||
| Amounts outstanding |
40,000 | — | 40,000 | — | — | |||||||||||||||
| Average amount outstanding during the year |
40,000 | — | 20,384 | — | — | |||||||||||||||
| Maximum amount outstanding at any month-end during the period |
40,000 | — | 40,000 | — | — | |||||||||||||||
| Weighted average interest rate at the end of the period |
1.71 | % | 0.00 | % | 1.71 | % | 0.00 | % | 0.00 | % | ||||||||||
| Average interest rate during the period |
1.70 | % | 0.00 | % | 1.71 | % | 0.00 | % | 0.00 | % | ||||||||||
Capital Resources and Liquidity Management
Capital Resources. Shareholders’ equity is influenced primarily by earnings, dividends paid on common stock and preferred stock, sales and redemptions of common stock and preferred stock and changes in accumulated other comprehensive income caused primarily by fluctuations in unrealized gains or losses, net of taxes, on securities available-for-sale.
95
Table of Contents
Shareholders’ equity increased $5.0 million, or 3.6%, to $147.2 million at March 31, 2018 as compared to December 31, 2017 mainly due to the retention of earnings, partially offset by other comprehensive loss from fair value change in securities available-for-sale and dividends declared on our common stock. During the three months ended March 31, 2018, we generated net income of $6.3 million, recognized other comprehensive loss of $1.0 million, and declared dividends of $402 thousand to our shareholders.
Shareholders’ equity increased $15.2 million, or 11.9% to $142.2 million at December 31, 2017 as compared to December 31, 2016 mainly due to the retention of earnings, partially offset by dividends declared on our common stock. During 2017, we generated net income of $16.4 million and declared dividends of $1.6 million to our shareholders.
Shareholders’ equity increased $29.0 million, or 29.5%, to $127.0 million at December 31, 2016 as compared to December 31, 2015 due to the retention of earnings and the issuance of common stock through a private placement (discussed below), partially offset by cash dividends and stock dividends declared on our common stock. During 2016, we generated net income of $14.0 million and declared cash dividends of $1.4 million to our shareholders. Additionally, in December 2016, we announced a 10% stock dividend which resulted in a decrease in retained earnings of $12.6 million. In August 2016, the Company issued 1,400,300 shares at a share price of $10.91 per share to accredited investors through a private placement for total cash proceeds of $15.2 million, net of related expenses. As part of our ongoing comprehensive capital management strategy we may continue to declare cash dividends and stock dividends on our common stock.
Liquidity Management. Liquidity refers to the measure of our ability to meet the cash flow requirements of depositors and borrowers, while at the same time meeting our operating, capital and strategic cash flow needs, all at a reasonable cost. We continuously monitor our liquidity position to ensure that assets and liabilities are managed in a manner that will meet all short-term and long-term cash requirements. We manage our liquidity position to meet the daily cash flow needs of customers, while maintaining an appropriate balance between assets and liabilities to meet the return on investment objectives of our shareholders.
Our liquidity position is supported by management of liquid assets and liabilities and access to alternative sources of funds. Liquid assets include cash, interest-bearing deposits in financial institutions, federal funds sold, and unpledged securities available-for-sale. Liquid liabilities may include core deposits, federal funds purchased, securities sold under repurchase agreements and other borrowings. Other sources of liquidity include the sale of loans, the ability to acquire additional national market noncore deposits, additional collateralized borrowings such as borrowings from FHLB, the issuance of debt securities, additional borrowings through Federal Reserve Discount Window and the issuance of preferred or common securities. Our short-term and long-term liquidity requirements are primarily to fund on-going operations, including payment of interest on deposits and debt, extensions of credit to borrowers, capital expenditures and shareholder dividends. These liquidity requirements are met primarily through cash flow from operations, redeployment of prepaying and maturing balances in our loan and investment securities portfolio, increases in debt financing and other borrowings, and increases in customer deposits. For additional information regarding our operating, investing and financing cash flows, see the consolidated statements of cash flows provided in our consolidated financial statements.
Integral to our liquidity management is the administration of borrowings. To the extent we are unable to obtain sufficient liquidity through core deposits, we seek to meet our liquidity needs through wholesale funding or other borrowings on either a short- or long-term basis.
As of March 31, 2018, and December 31, 2017 and 2016, we had $60.0 million, $60.0 million and $40.0 million, respectively, of available unused unsecured federal funds lines, respectively. In addition, available unused secured borrowing capacity from the Federal Reserve Discount Window at March 31, 2018, and December 31, 2017 and 2016 were $50.6 million, $48.1 million and $42.0 million, respectively. Federal Reserve Discount Window were collateralized by loans totaling $57.4 million, $56.2 million and $51.8 million as of March 31, 2018, and December 31, 2017 and 2016, respectively. Our borrowing capacity from the Federal Reserve Discount Window is limited by eligible collateral.
96
Table of Contents
At March 31, 2018 and December 31, 2017 we had $40.0 million of outstanding borrowings from FHLB. The $40.0 million borrowings from FHLB have varying maturity dates ranging from one to five years and varying fixed rates ranging from 1.41% to 2.07%. We did not have any borrowings from FHLB at December 31, 2016. Based on the values of loans pledged as collateral, we had $320.5 million, $311.0 million and $294.3 million of additional borrowing capacity with FHLB as of March 31, 2018, and December 31, 2017 and 2016, respectively. We also maintain relationships in the capital markets with brokers and dealers to issue certificates of deposit.
Pacific City Financial Corporation, on a stand-alone holding company basis, must provide for its own liquidity and its main source of funding is dividends from the Bank. There are statutory, regulatory and debt covenant limitations that affect the ability of the Bank to pay dividends to the holding company. Management believes that these limitations will not impact our ability to meet our ongoing short-term cash obligations.
Regulatory Capital Requirements
We are subject to various regulatory capital requirements administered by the federal and state banking regulators. Failure to meet regulatory capital requirements may result in certain mandatory and possible additional discretionary actions by regulators that, if undertaken, could have a direct material effect on our financial statements. Under capital adequacy guidelines and the regulatory framework for “prompt corrective action” (described below), we must meet specific capital guidelines that involve quantitative measures of our assets, liabilities and certain off-balance sheet items as calculated under regulatory accounting policies.
In the wake of the global financial crisis of 2008 and 2009, the role of capital has become fundamentally more important, as banking regulators have concluded that the amount and quality of capital held by banking organizations was insufficient to absorb losses during periods of severely distressed economic conditions. The Dodd-Frank Act and new banking regulations promulgated by the U.S. federal banking regulators to implement Basel III have established strengthened capital standards for banks and bank holding companies and require more capital to be held in the form of common stock. These provisions, which generally became applicable to the Company and the Bank on January 1, 2015, impose meaningfully more stringent regulatory capital requirements than those applicable to the Company and the Bank prior to that date. In addition, the Basel III regulations will implement a concept known as the “capital conservation buffer.” In general, banks and bank holding companies will be required to hold a buffer of common equity Tier 1 capital equal to 2.5% of risk-weighted assets over each minimum capital ratio to avoid being subject to limits on capital distributions (e.g., dividends, stock buybacks, etc.) and certain discretionary bonus payments to executive officers. For community banks, the capital conservation buffer requirement commenced on January 1, 2016, with a gradual phase-in. Full compliance with the capital conservation buffer will be required by January 1, 2019. As of December 31, 2017, we would have met the fully phased-in Basel III capital requirements.
97
Table of Contents
The tables below summarizes the minimum capital requirements applicable to us and the Bank pursuant to Basel III regulations as of the dates reflected, and exclusive of the capital conservation buffer as of December 31, 2017. The minimum capital requirements are only regulatory minimums and banking regulators can impose higher requirements on individual institutions. For example, banks and bank holding companies experiencing internal growth or making acquisitions generally will be expected to maintain strong capital positions substantially above the minimum supervisory levels. Higher capital levels may also be required if warranted by the particular circumstances or risk profiles of individual banking organizations. The tables below also summarizes the capital requirements applicable to us and the Bank in order to be considered “well-capitalized” from a regulatory perspective, as well as our and the Bank’s capital ratios as of March 31, 2018, and December 31, 2017 and 2016. We and the Bank exceeded all regulatory capital requirements under Basel III and were considered to be “well-capitalized” as of the dates reflected in the table below. For additional information on capital requirements, see “Supervision and Regulation—Regulatory Capital Requirements.”
| Amount of capital required | ||||||||||||||||||||||||
| Actual | For Capital Adequacy Purpose |
To Be Well Capitalized Under Prompt Corrective Provisions |
||||||||||||||||||||||
| (Dollars in thousands) | Amount | Ratio | Amount | Ratio | Amount | Ratio | ||||||||||||||||||
| Pacific City Bank |
||||||||||||||||||||||||
| As of March 31, 2018: |
||||||||||||||||||||||||
| Common tier 1 capital (to risk-weighted assets) |
147,376 | 12.3 | % | 54,130 | 4.5 | % | 78,187 | 6.5 | % | |||||||||||||||
| Total capital (to risk-weighted assets) |
159,864 | 13.3 | % | 96,230 | 8.0 | % | 120,288 | 10.0 | % | |||||||||||||||
| Tier 1 capital (to risk-weighted assets) |
147,376 | 12.3 | % | 72,173 | 6.0 | % | 96,230 | 8.0 | % | |||||||||||||||
| Tier 1 capital (to average assets) |
147,376 | 10.0 | % | 58,783 | 4.0 | % | 73,479 | 5.0 | % | |||||||||||||||
| As of December 31, 2017: |
||||||||||||||||||||||||
| Common tier 1 capital (to risk-weighted assets) |
141,361 | 12.1 | % | 52,747 | 4.5 | % | 76,189 | 6.5 | % | |||||||||||||||
| Total capital (to risk-weighted assets) |
153,705 | 13.1 | % | 93,723 | 8.0 | % | 117,153 | 10.0 | % | |||||||||||||||
| Tier 1 capital (to risk-weighted assets) |
141,361 | 12.1 | % | 70,329 | 6.0 | % | 93,772 | 8.0 | % | |||||||||||||||
| Tier 1 capital (to average assets) |
141,361 | 9.9 | % | 56,886 | 4.0 | % | 71,107 | 5.0 | % | |||||||||||||||
| As of December 31, 2016: |
||||||||||||||||||||||||
| Common tier 1 capital (to risk-weighted assets) |
125,634 | 12.4 | % | 45,593 | 4.5 | % | 65,857 | 6.5 | % | |||||||||||||||
| Total capital (to risk-weighted assets) |
137,066 | 13.5 | % | 81,224 | 8.0 | % | 101,530 | 10.0 | % | |||||||||||||||
| Tier 1 capital (to risk-weighted assets) |
125,634 | 12.4 | % | 60,791 | 6.0 | % | 81,054 | 8.0 | % | |||||||||||||||
| Tier 1 capital (to average assets) |
125,634 | 10.4 | % | 48,321 | 4.0 | % | 60,401 | 5.0 | % | |||||||||||||||
| Amount of capital required | ||||||||||||||||||||||||
| Actual | For Capital Adequacy Purpose |
To Be Well Capitalized Under Prompt Corrective Provisions |
||||||||||||||||||||||
| (Dollars in thousands) | Amount | Ratio | Amount | Ratio | Amount | Ratio | ||||||||||||||||||
| Pacific City Financial Corporation |
||||||||||||||||||||||||
| As of March 31, 2018: |
||||||||||||||||||||||||
| Common tier 1 capital (to risk-weighted assets) |
148,255 | 12.3 | % | 54,132 | 4.5 | % | N/A | N/A | ||||||||||||||||
| Total capital (to risk-weighted assets) |
160,743 | 13.4 | % | 96,235 | 8.0 | % | N/A | N/A | ||||||||||||||||
| Tier 1 capital (to risk-weighted assets) |
148,255 | 12.3 | % | 72,176 | 6.0 | % | N/A | N/A | ||||||||||||||||
| Tier 1 capital (to average assets) |
148,255 | 10.1 | % | 58,832 | 4.0 | % | N/A | N/A | ||||||||||||||||
| As of December 31, 2017: |
||||||||||||||||||||||||
| Common tier 1 capital (to risk-weighted assets) |
142,370 | 12.2 | % | 52,730 | 4.5 | % | N/A | N/A | ||||||||||||||||
| Total capital (to risk-weighted assets) |
154,715 | 13.2 | % | 93,766 | 8.0 | % | N/A | N/A | ||||||||||||||||
| Tier 1 capital (to risk-weighted assets) |
142,370 | 12.2 | % | 70,306 | 6.0 | % | N/A | N/A | ||||||||||||||||
| Tier 1 capital (to average assets) |
142,370 | 10.0 | % | 56,891 | 4.0 | % | N/A | N/A | ||||||||||||||||
| As of December 31, 2016: |
||||||||||||||||||||||||
| Common tier 1 capital (to risk-weighted assets) |
126,817 | 12.5 | % | 45,654 | 4.5 | % | N/A | N/A | ||||||||||||||||
| Total capital (to risk-weighted assets) |
138,248 | 13.6 | % | 81,322 | 8.0 | % | N/A | N/A | ||||||||||||||||
| Tier 1 capital (to risk-weighted assets) |
126,817 | 12.5 | % | 60,872 | 6.0 | % | N/A | N/A | ||||||||||||||||
| Tier 1 capital (to average assets) |
126,817 | 10.5 | % | 48,311 | 4.0 | % | N/A | N/A | ||||||||||||||||
98
Table of Contents
The Basel III regulations also revise the definition of capital and describe the capital components and eligibility criteria for common equity Tier 1 capital, additional Tier 1 capital and Tier 2 capital. The most significant changes to the capital criteria are that: (i) the prior concept of unrestricted Tier 1 capital and restricted Tier 1 capital has been replaced with additional Tier 1 capital and a regulatory capital ratio that is based on common equity Tier 1 capital; and (ii) trust preferred securities and cumulative perpetual preferred stock issued after May 19, 2010 no longer qualify as Tier 1 capital. This change is already effective due to the Dodd-Frank Act, although such instruments issued prior to May 19, 2010 continue to qualify as Tier 1 capital (assuming they qualified as such under the prior regulatory capital standards), subject to the 25% of Tier 1 capital limit.
Contractual Obligations
The following table contains supplemental information regarding our total contractual obligations as of the dates indicated:
| March 31, 2018 | ||||||||||||||||||||
| (Dollars in thousands) | Within One Year |
One to Three Years |
Three to Five Years |
Over Five Years |
Total | |||||||||||||||
| Time deposits |
$ | 617,984 | $ | 150,156 | $ | 2,571 | $ | — | $ | 770,711 | ||||||||||
| Borrowing from FHLB |
10,000 | 20,000 | 10,000 | — | 40,000 | |||||||||||||||
| Operating leases |
2,312 | 4,478 | 1,831 | 3,916 | 12,537 | |||||||||||||||
|
|
|
|
|
|
|
|
|
|
|
|||||||||||
| Total |
$ | 630,296 | $ | 174,634 | $ | 14,402 | $ | 3,916 | $ | 823,248 | ||||||||||
|
|
|
|
|
|
|
|
|
|
|
|||||||||||
| December 31, 2017 | ||||||||||||||||||||
| (Dollars in thousands) | Within One Year |
One to Three Years |
Three to Five Years |
Over Five Years |
Total | |||||||||||||||
| Time deposits |
$ | 564,644 | $ | 46,911 | $ | 2,831 | $ | — | $ | 614,386 | ||||||||||
| Borrowing from FHLB |
10,000 | 20,000 | 10,000 | — | 40,000 | |||||||||||||||
| Operating leases |
2,289 | 4,395 | 3,498 | 2,533 | 12,715 | |||||||||||||||
|
|
|
|
|
|
|
|
|
|
|
|||||||||||
| Total |
$ | 576,933 | $ | 71,306 | $ | 16,329 | $ | 2,533 | $ | 667,101 | ||||||||||
|
|
|
|
|
|
|
|
|
|
|
|||||||||||
We believe that we will be able to meet our contractual obligations as they come due through the maintenance of adequate cash levels. We expect to maintain adequate cash levels through profitability, loan and securities repayment and maturity activity and continued deposit gathering activities. We have in place various borrowing mechanisms for both short-term and long-term liquidity needs.
Off-Balance Sheet Arrangements
We have limited off-balance sheet arrangements that have, or are reasonably likely to have, a current or future material effect on our financial condition, results of operations, liquidity, capital expenditures or capital resources.
In the ordinary course of business, the Company enters into financial commitments to meet the financing needs of its customers. These financial commitments include commitments to extend credit, unused lines of credit, commercial and similar letters of credit and standby letters of credit. Those instruments involve to varying degrees, elements of credit and interest rate risk not recognized in the Company’s financial statements.
The Company’s exposure to loan loss in the event of nonperformance on these financial commitments is represented by the contractual amount of those instruments. The Company uses the same credit policies in making commitments as it does for loans reflected in the financial statements.
99
Table of Contents
Commitments to extend credit are agreements to lend to a customer as long as there is no violation of any condition established in the contract. Since many of the commitments are expected to expire without being drawn upon, the total amounts do not necessarily represent future cash requirements. The Company evaluates each client’s credit worthiness on a case-by-case basis. The amount of collateral obtained if deemed necessary by the Company is based on management’s credit evaluation of the customer.
| (Dollars in thousands) | March 31, 2018 |
December 31, 2017 |
||||||
| Commitments to extend credit |
$ | 121,432 | $ | 109,835 | ||||
| Stand by letters of credit |
3,308 | 3,309 | ||||||
| Commercial letters of credit |
76 | 233 | ||||||
|
|
|
|
|
|||||
| Total |
$ | 124,816 | $ | 113,377 | ||||
|
|
|
|
|
|||||
Quantitative and Qualitative Disclosures about Market Risk
Market Risk. Market risk represents the risk of loss due to changes in market values of assets and liabilities. We incur market risk in the normal course of business through exposures to market interest rates, equity prices, and credit spreads. We have identified two primary sources of market risk: interest rate risk and price risk.
Interest Rate Risk
Overview. Interest rate risk is the risk to earnings and value arising from changes in market interest rates. Interest rate risk arises from timing differences in the repricings and maturities of interest-earning assets and interest-bearing liabilities (repricing risk), changes in the expected maturities of assets and liabilities arising from embedded options, such as borrowers’ ability to prepay residential mortgage loans at any time and depositors’ ability to redeem certificates of deposit before maturity (option risk), changes in the shape of the yield curve where interest rates increase or decrease in a nonparallel fashion (yield curve risk), and changes in spread relationships between different yield curves, such as U.S. Treasuries and LIBOR (basis risk).
Our asset liability committee (“ALCO”) establishes broad policy limits with respect to interest rate risk. ALCO establishes specific operating guidelines within the parameters of the board of directors’ policies. In general, we seek to minimize the impact of changing interest rates on net interest income and the economic values of assets and liabilities. Our ALCO meets quarterly to monitor the level of interest rate risk sensitivity to ensure compliance with the board of directors’ approved risk limits.
Interest rate risk management is an active process that encompasses monitoring loan and deposit flows complemented by investment and funding activities. Effective management of interest rate risk begins with understanding the dynamic characteristics of assets and liabilities and determining the appropriate interest rate risk posture given business forecasts, management objectives, market expectations, and policy constraints.
An asset sensitive position refers to a balance sheet position in which an increase in short-term interest rates is expected to generate higher net interest income, as rates earned on our interest-earning assets would reprice upward more quickly than rates paid on our interest-bearing liabilities, thus expanding our net interest margin. Conversely, a liability sensitive position refers to a balance sheet position in which an increase in short-term interest rates is expected to generate lower net interest income, as rates paid on our interest-bearing liabilities would reprice upward more quickly than rates earned on our interest-earning assets, thus compressing our net interest margin.
Income Simulation and Economic Value Analysis. Interest rate risk measurement is calculated and reported to the board and ALCO at least quarterly. The information reported includes period-end results and identifies any policy limits exceeded, along with an assessment of the policy limit breach and the action plan and timeline for resolution, mitigation, or assumption of the risk.
100
Table of Contents
We use two approaches to model interest rate risk: Net Interest Income at Risk (“NII at Risk”), and Economic Value of Equity (“EVE”). Under NII at Risk, net interest income is modeled utilizing various assumptions for assets, liabilities, and derivatives. EVE measures the period end market value of assets minus the market value of liabilities and the change in this value as rates change. EVE is a period end measurement.
We report NII at Risk to isolate the change in income related solely to interest-earning assets and interest-bearing liabilities. The NII at Risk results included in the table below reflect the analysis used quarterly by management. It models immediate -100, +100 and +200 basis point parallel shifts in market interest rates. Due to the low level of short-term interest rates during 2014 to 2016, the analysis reflects a declining interest rate scenario of 100 basis points, the point at which some assets and liabilities reach zero percent.
| Net Interest Income Sensitivity | ||||||||||||
| Immediate Change in Rates | ||||||||||||
| (Dollars in thousands) | -100 | 100 | 200 | |||||||||
| March 31, 2018: |
||||||||||||
| Dollar change |
$ | (8,051 | ) | $ | 6,942 | $ | 13,643 | |||||
| Percent change |
-13.7 | % | 11.8 | % | 23.2 | % | ||||||
| December 31, 2017: |
||||||||||||
| Dollar change |
$ | (6,553 | ) | $ | 5,378 | $ | 10,479 | |||||
| Percent change |
-11.5 | % | 9.4 | % | 18.4 | % | ||||||
| December 31, 2016: |
||||||||||||
| Dollar change |
$ | (2,792 | ) | $ | 4,613 | $ | 9,193 | |||||
| Percent change |
-6.2 | % | 10.3 | % | 20.5 | % | ||||||
| December 31, 2015: |
||||||||||||
| Dollar change |
$ | (2,822 | ) | $ | 3,238 | $ | 6,587 | |||||
| Percent change |
-7.6 | % | 8.8 | % | 17.7 | % | ||||||
| December 31, 2014: |
||||||||||||
| Dollar change |
$ | (1,389 | ) | $ | 1,861 | $ | 3,806 | |||||
| Percent change |
-4.4 | % | 5.8 | % | 11.9 | % | ||||||
We are within board policy limits for the +100 and +200 basis point scenarios, but not within the policy limit for the -100 basis point scenario, as the Bank intentionally positioned itself to be asset sensitive in preparation for the expected continuing rising rate environment over the next year. The NII at Risk reported at December 31, 2017, projects that our earnings are expected to be materially sensitive to changes in interest rates over the next year. In recent periods, the amount of variable rate assets increased resulting in a position shift from slightly asset sensitive to materially asset sensitive.
101
Table of Contents
The EVE results included in the table below reflect the analysis used quarterly by management. It models immediate -100, +100 and +200 basis point parallel shifts in market interest rates. Due to the low level of short-term interest rates during 2014 to 2016, the analysis reflects a declining interest rate scenario of 100 basis points, the point at which some assets and liabilities reach zero percent.
| Economic Value of Equity Sensitivity | ||||||||||||
| Immediate Change in Rates | ||||||||||||
| (Dollars in thousands) | -100 | 100 | 200 | |||||||||
| March 31, 2018: |
||||||||||||
| Dollar change |
$ | (6,668 | ) | $ | 4,486 | $ | 7,063 | |||||
| Percent change |
-4.0 | % | 2.6 | % | 3.9 | % | ||||||
| December 31, 2017: |
||||||||||||
| Dollar change |
$ | (5,988 | ) | $ | 3,938 | $ | 5,887 | |||||
| Percent change |
-4.0 | % | 2.6 | % | 3.9 | % | ||||||
| December 31, 2016: |
||||||||||||
| Dollar change |
$ | (5,991 | ) | $ | 5,246 | $ | 9,646 | |||||
| Percent change |
-4.8 | % | 4.2 | % | 7.7 | % | ||||||
| December 31, 2015: |
||||||||||||
| Dollar change |
$ | (3,217 | ) | $ | 2,988 | $ | 5,560 | |||||
| Percent change |
-3.4 | % | 3.1 | % | 5.8 | % | ||||||
| December 31, 2014: |
||||||||||||
| Dollar change |
$ | 921 | $ | (487 | ) | $ | (418 | ) | ||||
| Percent change |
1.1 | % | -0.6 | % | -0.5 | % | ||||||
We are within board policy limits for the +/-100 and +200 basis point scenarios. The EVE reported at December 31, 2017 projects that as interest rates increase immediately, the economic value of equity position will be expected to increase. When interest rates rise, fixed rate assets generally lose economic value; the longer the duration, the greater the value lost. The opposite is true when interest rates fall.
Price Risk. Price risk represents the risk of loss arising from adverse movements in the prices of financial instruments that are carried at fair value and subject to fair value accounting. We have price risk from our held-for-sale residential property loans and our fixed-rate securities available-for-sale.
Critical Accounting Policies and Estimates
The preparation of our consolidated financial statements in accordance with GAAP requires us to make estimates and judgments that affect our reported amounts of assets, liabilities, revenues and expenses and related disclosure of contingent assets and liabilities. We base our estimates on historical experience and on various other assumptions that are believed to be reasonable under current circumstances, results of which form the basis for making judgments about the carrying value of certain assets and liabilities that are not readily available from other sources. We evaluate our estimates on an ongoing basis. Actual results may differ from these estimates under different assumptions or conditions.
Accounting policies, as described in detail in the notes to our consolidated financial statements, are an integral part of our financial statements. A thorough understanding of these accounting policies is essential when reviewing our reported results of operations and our financial position. We believe that the critical accounting policies and estimates discussed below require us to make difficult, subjective or complex judgments about matters that are inherently uncertain. Changes in these estimates, that are likely to occur from period to period, or using different estimates that we could have reasonably used in the current period, would have a material impact on our financial position, results of operations or liquidity.
Loans Held-for-Sale. Residential property loans originated or acquired and intended for sale in the secondary market are carried at the lower of cost or fair value, as determined by outstanding commitments from investors.
102
Table of Contents
Net unrealized losses, if any, are recorded as a valuation allowance and charged to earnings. Residential property loans held-for-sale consist primarily of first trust deed mortgages on residential properties located in California.
Residential property loans held-for-sale are generally sold with servicing rights retained and we calculate the servicing assets by calculating the net present value of servicing income. Carrying value of residential property loans sold is reduced by the amount allocated to the servicing right, when applicable. Gains and losses on sales of residential property loans are based on the difference between the selling price and the carrying value of the sold loans.
We sell guaranteed portion of SBA loans with servicing rights retained and we calculate the servicing right asset by calculating the net present value of the servicing income. Gain and losses on sales of SBA loans are based on the difference between the selling price and the carrying value, offset by the discount on the retained portion of the loan. The gain on the sold portion is recorded as gain on sale income and the discount on retained portion is accreted to yield income over the expected life of the loan.
Allowance for Loan Losses. Allowance for loan losses is a valuation allowance for probable incurred credit losses. Loan losses are charged against the allowance when we believe the uncollectability of a loan balance is confirmed. Subsequent recoveries, if any, are credited to the allowance. We estimate the allowance balance required using past loan loss experience, the nature and volume of the portfolio, information about specific borrower situations and estimated collateral values, economic conditions, and other factors. Allocations of the allowance may be made for specific loans, but the entire allowance is available for any loan that, in management’s judgment, should be charged-off. Amounts are charged-off when available information confirms that specific loans or portions thereof, are uncollectible. This methodology for determining charge-offs is consistently applied to each segment.
The Company determines a separate allowance for each portfolio segment. The allowance consists of specific and general reserves. Specific reserves relate to loans that are individually classified as impaired. A loan is impaired when, based on current information and events, it is probable that the Company will be unable to collect all amounts due according to the contractual terms of the loan agreement. Factors considered in determining impairment include payment status, collateral value and the probability of collecting all amounts when due. Measurement of impairment is based on the expected future cash flows of an impaired loan, which are to be discounted at the loan’s effective interest rate, or measured by reference to an observable market value, if one exists, or the fair value of the collateral for a collateral-dependent loan. The Company selects the measurement method on a loan-by-loan basis except that collateral-dependent loans for which foreclosure is probable are measured at the fair value of the collateral.
The Company recognizes interest income on impaired loans based on its existing methods of recognizing interest income on nonaccrual loans. Loans, for which the terms have been modified resulting in a concession, and for which the borrower is experiencing financial difficulties, are considered TDRs and classified as impaired with measurement of impairment as described above.
If a loan is impaired, a portion of the allowance is allocated so that the loan is reported, net, at the present value of estimated future cash flows using the loan’s existing rate or at the fair value of collateral if repayment is expected solely from the collateral.
General reserves cover non-impaired loans and are based on our historical loss rates for each portfolio segment, adjusted for the effects of qualitative factors that are likely to cause estimated credit losses as of the evaluation date to differ from the portfolio segment’s historical loss experience. Qualitative factors include consideration of the following: changes in lending policies and procedures; changes in economic conditions, changes in the nature and volume of the portfolio; changes in the experience, ability and depth of lending management and other relevant staff; changes in the volume and severity of past due, nonaccrual and other adversely graded loans; changes in the loan review system; changes in the value of the underlying collateral for collateral-dependent loans; concentrations of credit and the effect of other external factors such as competition and legal and regulatory requirements.
103
Table of Contents
Deferred Income Taxes. We use the asset and liability method of accounting for income taxes as prescribed by GAAP. Under this method, deferred tax assets and liabilities are recognized for the future tax consequences attributable to differences between the financial statement carrying amounts of existing assets and liabilities and their respective tax bases. If current available information raises doubt as to the realization of the deferred tax assets, a valuation allowance is established. Deferred tax assets and liabilities are measured using enacted tax rates expected to apply to taxable income in the years in which those temporary differences are expected to be recovered or settled. Accounting for deferred income taxes is a critical accounting estimate because we exercise significant judgment in evaluating the amount and timing of recognition of the resulting tax liabilities and assets. Management’s determination of the realization of deferred tax assets is based upon management’s judgment of various future events and uncertainties, including the timing and amount of future income, reversing temporary differences which may offset, and the implementation of various tax plans to maximize realization of the deferred tax asset. These judgments and estimates are inherently subjective and reviewed on a continual basis as regulatory and business factors change. Any reduction in estimated future taxable income may require us to record a valuation allowance against our deferred tax assets. A valuation allowance would result in additional income tax expense in such period, which would negatively affect earnings.
Recently Issued Accounting Pronouncements. We have evaluated new accounting pronouncements that have recently been issued and have determined that there are no new accounting pronouncements that should be described in this section that will impact our operations, financial condition or liquidity in future periods. Refer to Note 1 of our audited consolidated financial statements for the years ended December 31, 2017 and 2016 for a discussion of recently issued accounting pronouncements that have been adopted by us that will require enhanced disclosures in our financial statements in future periods.
104
Table of Contents
Our Company
We are Pacific City Financial Corporation, a registered bank holding company headquartered in Los Angeles, California. We provide a full suite of commercial banking services through our wholly owned subsidiary, Pacific City Bank, a California state chartered bank, to small to medium-sized businesses, individuals and professionals, primarily in Southern California, and predominantly in Korean-American and other minority communities. As of March 31, 2018, we had total assets of $1.6 billion, total deposits of $1.4 billion, total loans (including loans held-for-sale) of $1.2 billion and total shareholders’ equity of $147.2 million.
Our ability to execute on our strategic plan has been supported entirely by our organic growth capabilities. Since our formation, we have sought to build a premier community bank that delivers personalized service, quick and local decision-making and convenience to customers in our target markets, particularly to Korean-American communities in the U.S. We focus both on existing businesses and individuals already established in our local market area, as well as Korean immigrants who desire to establish their own businesses, purchase homes or educate their children in the U.S.
We are led by our President and Chief Executive Officer, Henry Kim, and we have used the experience and expertise of our board of directors, officers and employees to tailor our loan and deposit products to serve this Korean-American market niche. We have thirteen full service branch locations, eleven of which are located in California and one of which is located in each of New York and New Jersey. We also have ten LPOs in our target markets in eight different states. We have established our branch and LPO network in major metropolitan areas with significant Korean-American populations.
We believe that our scale as the third largest independent Korean-American bank, our network of banking offices located in the major Korean-American markets in the U.S., our cohesive and experienced management team and our conservative credit culture differentiate us from our competition and have laid the foundation for sustainable, profitable growth.
From December 31, 2013 through March 31, 2018, total loans grew from $606.5 million to $1.2 billion at a compound annual growth rate (“CAGR”) of 18.1% and total deposits grew from $674.0 million to $1.4 billion at a CAGR of 18.4% as shown in the charts below.
We offer a diversified set of lending products that includes commercial property loans, secured and unsecured C&I loans, SBA loans, residential property loans, and consumer loans in our market areas. We attract retail deposits through our branch network which offers a wide range of deposit products for business and consumer banking customers. Our deposit products and services are competitively priced with a focus on convenience and accessibility. We provide our customers a full suite of online and mobile banking solutions including remote check deposit and mobile bill pay capabilities. We also offer a full array of commercial treasury management services designed to be competitive with banks of all sizes. Treasury management services include positive pay, remote deposit capture, ACH origination, wire origination and stop payment initiation.
105
Table of Contents
We believe the capital raised in this offering will help fund additional organic growth in our current footprint through deeper market penetration by, among other things, increasing our legal lending limit, better satisfying the loan demands from our current and prospective customers, and providing regulatory capital ratios capable of supporting our growing asset base.
Our History
We are a California corporation that was incorporated in 2007 to serve as the holding company for the Bank which was founded in 2003 by a group of experienced bankers, including our President and Chief Executive Officer, Henry Kim. Our founders, who had worked together for many years at various Korean-American banks in California in the 1980s and 1990s, identified an opportunity resulting from the strong growth of Korean-American businesses in the greater Los Angeles area and the increased level of consolidation throughout the Korean-American banking landscape. Our founders observed that, despite the existence of a few larger banking institutions serving this market, there was a tremendous opportunity to create a true community bank focused on serving the first and second generation Korean-American population.
Although we serve all ethnicities, our board and management team are comprised of Korean-Americans. Our marketing focus was initially on local Korean-American businesses and first and second generation Korean-Americans who prefer to conduct business in their native Korean language, and we developed our loan and deposit products to serve this Korean-American market niche. Initially, our market area was Los Angeles and Orange Counties in California, and, in 2006, we added our first LPO in Lynwood, Washington. Between 2006 and 2013, we expanded our Southern California branch footprint with the addition of eight full service offices and added four offices to our national SBA loan production footprint.
Since 2014, we have expanded our network of banking offices from nine full service branch locations to thirteen branch locations in what we believe are two of the most vibrant growth markets in the nation, namely Southern California and the greater New York City metropolitan area. We have also grown from five LPOs in 2013 to ten LPOs in major metropolitan areas with significant Korean-American populations. Our branch operations include eight full service branches in Los Angeles County California, three branches in Orange County California, and our first two out-of-state branches on the East Coast located in Bayside, New York and Fort Lee, New Jersey. Our ten LPOs are located in Los Angeles and Irvine, California; Lynnwood and Bellevue, Washington; Dallas, Texas; Aurora, Colorado; Atlanta, Georgia; Annandale, Virginia; Chicago, Illinois; and New York, New York.
Our Competitive Strengths
We believe that our competitive strengths set us apart from many similarly-sized community banks and other Korean-American focused institutions, and that the following attributes are key to our success:
106
Table of Contents
Cohesive and Experienced Management Team. We are led by a seven-person executive management team, consisting of our President and Chief Executive Officer, our Executive Vice President and Chief Financial Officer, our Executive Vice President and Chief Risk Officer, and our four Senior Vice Presidents, with an average of 22 years of banking experience covering the relevant disciplines of finance, lending, credit, risk, strategy and branch operations. Our executive team has been in their respective roles with the Company and the Bank for an average of 11 years, and substantially all have known and worked with Mr. Kim prior to joining the Bank. Collectively, they have been responsible for executing our strategic plan and driving our growth. Our executive management team includes:
| Name |
Current Position with the Company/Bank |
Banking Experience | ||
| Henry Kim | President and Chief Executive Officer of the Company and the Bank | 28 years of banking experience and has been with the Bank since it was founded in 2003 and the Company since its founding in 2007 | ||
| Timothy Chang | Executive Vice President and Chief Financial Officer of the Company and the Bank | 18 years of banking experience, including 8 years with the Company and the Bank | ||
| Andrew Chung | Executive Vice President and Chief Risk Officer of the Bank | 20 years of banking experience, including 4 years with the Company and the Bank | ||
| Brian Bang | Senior Vice President and Chief Credit Officer of the Bank | 17 years of banking experience, including 12 years with the Bank | ||
| John Ju | Senior Vice President and Chief Lending Officer of the Bank | 20 years of banking experience, including 11 years with the Bank | ||
| Justin Chon | Senior Vice President and Chief Consumer Lending Officer of the Bank | 23 years of banking experience, including 14 years with the Bank | ||
| Mimi Lee | Senior Vice President and Chief Operations Administrator of the Bank | 27 years of banking experience, including 13 years with the Bank |
Mr. Kim, who was promoted to President and Chief Executive Officer in January of 2018, has served as an executive officer of the Bank since its formation in 2003. He is a member of the Company’s and Bank’s boards of directors. During his 15-plus years with the Bank, Mr. Kim has held the positions of Chief Credit Officer, Chief Operating Officer and Corporate Secretary of the Bank from 2004 to 2017, and Corporate Secretary of the Company from 2007 to 2017. While serving as the Bank’s Chief Operating Officer, Mr. Kim spearheaded initiatives that have resulted in our total assets increasing from $755.9 million at December 31, 2013 to $1.6 billion at March 31, 2018, our equity increasing from $76.5 million to $147.2 million over that same time period, the expansion of our branch network in Southern California and into the greater New York City metropolitan market and the establishment and expansion of our extensive LPO network in eight different states.
The Bank is also fortunate to have a depth of vice presidents and managers at all levels of the organization, each of whom has substantial experience and generally a long employment with the Bank.
History of Organic Growth and Proven Financial Performance. Since our formation, we have grown by originating loans and sourcing deposits within the communities we serve. Although our initial focus was on the Korean-American community, we have expanded our focus to include other under-served minority communities in our markets including Chinese-American, Persian-American and Indian-American clientele. During the period from January 1, 2013 to March 31, 2018, we cumulatively originated $2.6 billion of loans. Of that number in originations, $1,462.8 million were commercial property loans, $521.0 million were residential property loans, $465.4 million were C&I loans, $96.2 million were consumer loans and $63.7 million were construction loans. Within the categories of commercial property loans and C&I loans were $754.2 million of SBA loan originations ($560.2 million in SBA property and $194.0 million in SBA commercial term). During this same period we sold a total of $553.4 million in SBA loans and $246.3 million in residential property loans. While growing our assets,
107
Table of Contents
we have also delivered increasing and sustained profitability during that time period. Our net income and return on average assets were $21.4 million and 3.14%, respectively, in 2013, $11.8 million and 1.46%, respectively, in 2014, $12.2 million and 1.25%, respectively, in 2015, $14.0 million and 1.25%, respectively, in 2016 and $16.4 million and 1.22% respectively, in 2017. For the first quarter of 2018, our net income and return on average assets were $6.3 million and 1.73%, respectively. However, both 2013 and 2017 saw material non-recurring items that impacted our reported net income and return on average assets for those years. We had a recapture of $11.5 million in deferred tax assets in 2013 and an impairment of $1.6 million in deferred tax assets due to the Tax Reform Act. Our profitability since 2013 is detailed in the chart below and has been adjusted for 2013 and 2017 to account for those significant non-recurring items.
| (1) | The amounts for the years 2013 and 2017 have been adjusted for impacts related to deferred tax asset recapture of $11.5 million in 2013 and an impairment of $1.6 million following a deferred tax asset revaluation due to the passing of the Tax Reform Act. The adjusted net income and return on average assets for 2013 and 2017 are non-GAAP measures. See “Non-GAAP Financial Measures” for a reconciliation of these measures to their most comparable GAAP measures. |
| (2) | Annualized. |
108
Table of Contents
We have been able to generate consistent increases in net interest income proportionally outpacing increases in non-interest expense. We have grown our net interest income from $26.9 million for the year ended December 31, 2013 to $55.2 million for the year ended December 31, 2017. For the first quarter of 2018, our net interest income was $15.3 million. We believe our net interest income momentum supplemented by a diversified loan mix and the origination and sale of SBA loans provides a strong platform for continued growth. The chart below shows our total revenue and gain on sale of SBA loans for 2013 through the first quarter of 2018.
| (1) | Total revenue is the sum of net interest income and non-interest income. |
Conservative Credit Culture and Risk Profile with Diversified Loan Portfolio. We maintain a conservative credit culture with strict underwriting standards. As we have grown, we have invested in and developed a credit culture that we believe will support future growth and expansion efforts while maintaining outstanding asset quality. Led by our Chief Credit Officer and other highly experienced Senior Credit Officers, our credit departments have robust internal controls and lending policies with conservative underwriting standards. Loans are monitored on an ongoing basis in accordance with covenants and conditions that are commensurate with each loan’s size and complexity. We conduct comprehensively scoped internal loan reviews at least semi-annually using an independent loan review specialist to validate the appropriateness of risk ratings of loans by management. Our loan monitoring processes are designed to identify both the inherent and emerging risks in a timely manner so that appropriate risk ratings are assigned and, if necessary, work-out/collection activities are commenced early to minimize any potential losses. At March 31, 2018, we had NPAs of $2.4 million, or 0.15% of total assets. At March 31, 2018, we maintained an allowance for loan losses of $12.4 million, reflecting 1.01% of total loans.
109
Table of Contents
The following graphs depict our NPAs to total assets and allowance for loan losses to total loans as of the dates indicated:
Our disciplined credit culture is also evidenced by the make-up of our loan portfolio and its consistency as we have grown. Our loan portfolio consists primarily of three major categories of loans: real estate loans, C&I loans and consumer loans. Within these three broad categories, we further segment our loan portfolio as follows:
| • | Real estate loans consist of: |
| • | Commercial property—loans secured by commercial real estate; |
| • | Residential property—loans secured by 1-4 family residential real estate; |
| • | SBA property—SBA guaranteed loans secured by commercial real estate; and |
| • | Construction loans |
| • | C&I loans consist of: |
| • | Commercial term; |
| • | Commercial lines of credit; |
| • | SBA commercial term; and |
| • | International loans |
| • | Consumer loans consist of our automobile secured loans and personal loans. |
110
Table of Contents
The charts below illustrate our loan portfolio composition as of the dates indicated, separately by type of collateral support and relevant business line.
Because of our business strategy and the breadth of the economy within our primary origination markets of Los Angeles and Orange Counties in California, and Queens County, New York and Bergen County, New Jersey, our loan portfolio is widely diversified across industry lines and is not concentrated in any one particular business sector. We expect this industry diversification to continue as a result of our current practices and strategies, and for our geographic diversity to increase as our Bayside and Fort Lee branches grow. As of March 31, 2018, our CRE concentration ratio (as defined by the federal bank regulators) was 357.1% and we believe that we are appropriately managing our CRE concentration consistent with safe and sound banking operations. At March 31, 2018, the balance of our CRE loans for the purpose of calculating the CRE concentration ratio as defined by the federal bank regulators totaled $570.9 million, and the weighted average loan to value ratio for those loans was 52.5%. We believe the capital we raise through this offering will help us reduce our CRE concentration ratio significantly.
We have maintained a conservative amount of capital, raising capital when needed to support our growth: our regulatory capital ratios as of March 31, 2018 of 10.1% of Tier 1 leverage capital to average assets, 12.3% of common equity Tier 1 capital, 12.3% of Tier 1 risk-based capital and 13.4% of total risk-based capital are well above required fully phased-in regulatory thresholds.
In addition, we believe that we have positioned our balance sheet to benefit from a rising interest rate environment. At March 31, 2018, 73.2% of the loans in our portfolio had floating interest rates. With the gradual rise in interest rates since the November 2016 presidential election, approximately three-fourths of our loans have and will continue to reprice upwards as interest rates increase. Of our $1.2 billion in total loans at March 31, 2018, $894.9 million were variable rate loans, only $51.0 million of which contained interest rate floors of which $49.1 million or 96% were then above their base floor rates. This means that with an increase in interest rates of 25 basis points as of such date, all but $1.9 million of such loans would have repriced. Accordingly, a continuing upward movement in interest rates should be more immediately reflected in increased yields for our loan portfolio than higher funding costs, though no assurances can be made.
Proven Branch and LPO Network Covering Top Korean-American Markets. We have built a network of banking offices in attractive markets for our operations that we believe support our continued growth. We have focused our de novo branching strategy on expansion into Korean-American populated areas in the general markets we currently serve through either our existing branch network or LPOs. We currently service seven of the top ten Korean-American MSAs in the U.S. (based on total population projected for 2018) through our branches or LPOs.
111
Table of Contents
We have eight branches in Los Angeles County located in Koreatown/Mid-Wilshire, Koreatown/W. Olympic, Los Angeles Downtown Fashion District, Little Tokyo, Western Avenue, Cerritos, Torrance and Rowland Heights. We operate primarily in the Los Angeles-Long Beach-Anaheim, California MSA. With over 13 million residents, it is the largest MSA in California, the second largest MSA in the U.S., and one of the most significant business markets in the world. The federal government’s recently released annual accounting of business output of U.S. metro areas shows the Los Angeles-Orange County region’s gross domestic product has now exceeded $1 trillion (only the second U.S. metro area to do so, along with the New York City-New Jersey metro), which would rank it as the 16th largest economy in the world. The economic base of the area is heavily dependent on small- and medium-sized businesses, providing us with a market rich in potential customers. According to Nielsen, Asian-Americans are projected to account for 16.2% of the estimated 13.4 million residents in Los Angeles-Long Beach-Anaheim MSA in 2018.
We operate three branches in Orange County, California: two in Buena Park and one in Irvine. Orange County is considered part of the Los Angeles-Long Beach-Anaheim, California MSA and has similar market characteristics to Los Angeles County.
We also operate two branches in the New York-Newark-Jersey City, NY-NJ-PA MSA. This MSA encompasses the greater New York City region and is the largest in terms of total population. According to Nielsen, the 2018 Asian-American population is projected to account for 11.5% of the estimated 20.2 million residents within this MSA. The table below illustrates the demographic profiles in our markets of operations, substantially all of which have a high concentration of Asian-Americans and Korean-Americans relative to the total population. The table is sorted by Korean-American population size.
| U.S Population | Asian-American Population | Korean-American Population | ||||||||||||||||||||||||||||||
| MSA |
2018 Population (actual) |
2018-2023 Proj. Growth (%) |
2018 Population (actual) |
2018 Population (%) |
2018-2023 Proj. Growth (%) |
2018 Population (actual) |
2018 Population (%) |
2018-2023 Proj. Growth (%) |
||||||||||||||||||||||||
| Los Angeles-Long Beach-Anaheim, CA |
13,436,808 | 3.4 | % | 2,174,892 | 16.2 | % | 9.5 | % | 333,611 | 2.5 | % | 10.2 | % | |||||||||||||||||||
| New York-Newark-Jersey City, NY-NJ-PA |
20,251,724 | 1.9 | % | 2,331,909 | 11.5 | % | 12.1 | % | 225,971 | 1.1 | % | 12.1 | % | |||||||||||||||||||
| Washington-Arlington-Alexandria, DC-VA-MD-WV |
6,224,774 | 5.2 | % | 663,583 | 10.7 | % | 14.6 | % | 90,158 | 1.4 | % | 14.3 | % | |||||||||||||||||||
| Seattle-Tacoma-Bellevue, WA |
3,885,514 | 6.7 | % | 533,416 | 13.7 | % | 18.2 | % | 62,141 | 1.6 | % | 18.2 | % | |||||||||||||||||||
| Chicago-Naperville-Elgin, IL-IN-WI |
9,504,650 | 0.3 | % | 656,618 | 6.9 | % | 12.2 | % | 57,145 | 0.6 | % | 12.2 | % | |||||||||||||||||||
| Atlanta-Sandy Springs-Roswell, GA |
5,919,767 | 6.5 | % | 358,930 | 6.1 | % | 20.4 | % | 52,800 | 0.9 | % | 20.5 | % | |||||||||||||||||||
| Dallas-Fort Worth-Arlington, TX |
7,418,556 | 7.7 | % | 506,609 | 6.8 | % | 22.7 | % | 37,036 | 0.5 | % | 23.1 | % | |||||||||||||||||||
| Denver-Aurora-Lakewood, CO |
2,933,089 | 7.7 | % | 126,656 | 4.3 | % | 17.5 | % | 15,013 | 0.5 | % | 18.1 | % | |||||||||||||||||||
|
|
|
|
|
|
|
|
|
|
|
|
|
|
|
|
|
|||||||||||||||||
| United States of America |
326,533,070 | 3.5 | % | 18,637,597 | 5.7 | % | 14.5 | % | 1,629,384 | 0.5 | % | 14.6 | % | |||||||||||||||||||
|
|
|
|
|
|
|
|
|
|
|
|
|
|
|
|
|
|||||||||||||||||
Source: S&P Global Market Intelligence.
We have supplemented our branch network by establishing LPOs in Korean-American communities in major metropolitan areas, particularly to support our SBA lending operations. Since we opened our first LPO in 2006, we have added nine additional LPOs in eight different states, including LPOs in Seattle and Dallas-Fort Worth, which sit at fourth and ninth positions, respectively, in terms of Korean-American population as of 2015 according to S&P Global Market Intelligence.
Our selection of highly capable LPO managers has been crucial in entering new markets and being successful in generating new loans in those particular markets. We see the markets where we have existing LPOs as logical places to consider opening full service branches in the future, in addition to other metro areas throughout the U.S. with large Korean-American populations. We believe our ability to attract and retain banking professionals with significant experience in, and knowledge of the communities in our marketplace is key to our expansion efforts.
112
Table of Contents
Core Deposit Funded Franchise. We believe our relationship-based approach to banking enhances our ability to source core deposits to fund organic growth. Our deposit base serves as a major driver of our operating results, as we primarily utilize our core deposits to fund loan growth. We believe we have a deposit base characterized by a high level of core deposits and a high proportion of noninterest-bearing deposit accounts. As of March 31, 2018, deposits accounted for 96.5% of our total liabilities. Core deposits, which we define as all deposits excluding time deposits exceeding $250,000 and internet or brokered deposits, constituted 78.7% of our total deposits and noninterest-bearing deposits accounted for 23.2% of total deposits at March 31, 2018.
Customer Service Focus with Relationship Banking. Competition among banks focused on the Korean-American community is strong. To distinguish ourselves, we focus on exemplary customer service and diverse product offerings to attract and retain clients. We strive to differentiate ourselves from our competitors by providing the best “relationship-based” services to small- and medium-sized businesses and their owners in our target markets. Our banking team is focused on face-to-face, highly personalized service, with the goal of creating customer relationships through multiple services and/or products. Our staff at our branches and LPOs is bilingual with strong Korean language skills to assist first generation Korean-American clients. In certain of our branches we also maintain staff that speaks Mandarin and Farsi to support our Chinese-American and Persian-American clientele. Our personalized service is augmented by the convenience of technological access services, such as remote deposit capture, mobile banking, internet banking and other services utilizing telephone, texting, fax and e-mail. However, we believe that technology will never substitute for personal interaction in dealing with customers. We believe that our community connections have enhanced the Bank’s reputation and name recognition well beyond what would be typical for a bank of our size and have allowed us to attract a loyal customer base that has facilitated the Bank’s strong organic growth and strong profitability metrics.
Scalable Operating Platform. We have invested meaningfully in our infrastructure, including hiring talented risk management professionals with experience in building and managing risk management programs. We believe those investments coupled with our risk management structure and conservative credit culture create a platform suitable for an organization larger than ours in anticipation of continued balance sheet and franchise growth. Even with these investments, we have maintained a relatively low efficiency ratio over the last five years as reflected in the chart below due to the expansion of our net interest income and gain on sale of loans.
Our Strategy
Our board of directors and executive management team have focused on building a premier banking franchise serving the needs of small- and medium-sized business owners, professionals and individuals in our targeted market areas, particularly in Korean-American and other minority communities that is capable of yielding sustainable growth and long-term profitability that enhances shareholder value, which we intend to accomplish through:
Leverage Our Experience to Expand in Existing Markets. Our board of directors, executive management team and staff have an intimate knowledge of the Korean-American community and its culture and we have built
113
Table of Contents
a network of banking offices that we believe provides a foundation for further expanding our franchise. We currently service seven of the top ten Korean-American MSAs in the U.S. (based on total population) through our branches or LPOs. We intend to continue to enhance our customer base, increase loans and deposits and expand our overall market share, and we believe the markets in which we operate currently provide meaningful opportunities to grow organically. We plan to continue our organic growth by leveraging the extensive experience of our board of directors, executive management team and senior bankers, which give us insight and familiarity with our customers. We have a track record of attracting talented banking professionals from other financial institutions and believe that this initial public offering will enhance our ability to attract and retain this talent to further support our organic growth.
Increase Market Share. A key aspect of our operating strategy is to utilize the capital raised in this offering to further penetrate our existing markets, deepen our customer relationships and increase our market share. We believe that our existing network of banking offices, including our locations in New York and New Jersey, when coupled with our investments in infrastructure and continuity of management and culture, provides us the opportunities to continue to grow our loans and deposits organically.
Further Diversify our Loan Portfolio. We intend to continue to grow our loan portfolio including seeking to expand our C&I loans and residential property loans to further diversify our loan portfolio. Our C&I lending emphasizes commercial lines of credit, and working capital loans secured by inventory, accounts receivable, fixed assets and real estate. We believe that there is an opportunity to increase our C&I lending to a greater percentage of our overall loans, through, among other things, an increased marketing emphasis on middle-market businesses in our existing markets. Further, we see C&I lending as a means of gaining new noninterest-bearing deposit accounts from our customers and in non-Asian ethnic communities located in the Los Angeles area through our brokered loan sources.
The Bank is a “preferred SBA lender” and we have devoted an increasing amount of resources to SBA loans, including increasing our SBA staff and opening out-of-state LPOs in strategic locations. Our LPOs enable us to reach small businesses in a variety of geographic locations with a range of loan products to meet the individual business needs of the respective local markets. Our SBA loans provide a recurring revenue stream from the following three sources: gain on sale of loans sold; interest earned on retained loans; and servicing fees on loans sold.
We also intend to increase our residential property loans as a percentage of our loan portfolio. We believe that the range of lending solutions that we offer is more comprehensive than that of our competitors and all such loans are underwritten in-house. This retail lending is made primarily to Asian-Americans who are willing to provide higher down payment amounts and pay higher fees and interest rates in return for underwriting requirements more accommodative for self-employed borrowers and the acceptance of sometimes less established credit profiles.
Utilize Public Company Status. In addition to raising capital to support our growth as further discussed under “Use of Proceeds,” we believe becoming a public reporting company, while increasing our operating costs, will provide us with additional options and better pricing to manage our cost of capital that were previously unavailable to us when our shares were quoted on the OTC Pink Market. While we have not historically engaged in any merger and acquisition activity, the ability to issue publicly-traded stock as consideration may enable us to opportunistically approach potential transactions. However, as of the date of this prospectus, we do not have any immediate plans, arrangements or understandings relating to any material acquisitions. In addition, we believe the additional liquidity provided by being listed on Nasdaq and being a public reporting company will enhance the equity component of our compensation programs, which will enable us to better attract and retain key employees in the competitive markets in which we operate.
114
Table of Contents
Our Competition
We view the Korean-American banking market, including our Company, as comprised of 18 banks across the U.S. The table below provides more details on who we view as the current Korean-American banks as of March 31, 2018 against which we compete. The Company is currently the third largest U.S. based independent Korean-American bank.
| (Dollars in millions) |
Headquarters | U.S. Offices |
Total Assets |
Gross Loans |
Total Deposits |
Total Equity |
||||||||||||||||||
| U.S.-Based Korean-American Banks: |
||||||||||||||||||||||||
| Hope Bancorp, Inc. |
Los Angeles, CA | 63 | $ | 14,507 | $ | 11,326 | $ | 11,511 | $ | 1,945 | ||||||||||||||
| Hanmi Financial Corporation |
Los Angeles, CA | 40 | 5,306 | 4,420 | 4,378 | 564 | ||||||||||||||||||
| Pacific City Financial Corporation |
Los Angeles, CA | 13 | 1,579 | 1,229 | 1,382 | 147 | ||||||||||||||||||
| MetroCity Bankshares, Inc. |
Doraville, GA | 16 | 1,303 | 1,131 | 1,098 | 144 | ||||||||||||||||||
| CBB Bancorp, Inc. |
Los Angeles, CA | 8 | 1,070 | 833 | 931 | 118 | ||||||||||||||||||
| OP Bancorp |
Los Angeles, CA | 8 | 957 | 812 | 818 | 117 | ||||||||||||||||||
| First IC Corporation |
Doraville, GA | 7 | 411 | 338 | 333 | 65 | ||||||||||||||||||
| Noah Bank |
Elkins Park, PA | 5 | 387 | 339 | 331 | 44 | ||||||||||||||||||
| NewBank |
Flushing, NY | 5 | 344 | 225 | 292 | 45 | ||||||||||||||||||
| NOA Bancorp, Inc. |
Duluth, GA | 5 | 336 | 254 | 282 | 41 | ||||||||||||||||||
| US Metro Bank |
Garden Grove, CA | 4 | 330 | 228 | 277 | 50 | ||||||||||||||||||
| New Millennium Bank |
Fort Lee, NJ | 6 | 317 | 261 | 271 | 32 | ||||||||||||||||||
| Uniti Financial Corporation |
Buena Park, CA | 3 | 316 | 245 | 268 | 40 | ||||||||||||||||||
| U&I Financial Corp. |
Lynnwood, WA | 4 | 282 | 191 | 239 | 40 | ||||||||||||||||||
| Ohana Pacific Bank |
Honolulu, HI | 2 | 152 | 120 | 134 | 17 | ||||||||||||||||||
| Foreign-Owned U.S. Subsidiaries: |
||||||||||||||||||||||||
| Woori America Bank |
New York, NY | 19 | 1,834 | 1,437 | 1,558 | 255 | ||||||||||||||||||
| Shinhan Bank America |
New York, NY | 16 | 1,403 | 1,242 | 1,216 | 162 | ||||||||||||||||||
| KEB Hana Bank USA, N.A. |
Fort Lee, NJ | 3 | 204 | 137 | 158 | 45 | ||||||||||||||||||
Source for bank specific data: S&P Global Market Intelligence. For each bank, data is as of the most recent available quarter.
In addition to these Korean-American banks, we also compete with other banks in our market areas. We believe we are well positioned to leverage our network of banking offices in the Korean-American markets in which we currently operate to continue to grow organically into select additional markets with significant Korean-American communities, and to further our reach into other minority communities.
Risks Relating to Our Company
Our ability to implement our strategic plan and the success of our business are subject to numerous risks and uncertainties, which are discussed in the section titled “Risk Factors,” beginning on page 23. We urge you to carefully consider the information within “Risk Factors” and the other information in this prospectus before investing in our common stock.
Deposit Products
We offer customers traditional retail deposit products through our branch network and the ability to access their accounts through online and mobile banking platforms. We offer a variety of deposit accounts with a wide range of interest rates and terms including demand, savings, money market and time deposits with the goal of attracting a wide variety of customers, including small to medium-sized businesses. We consider our core deposits, defined as all deposits except for time deposits exceeding $250,000 and internet or brokered deposits, to be our primary and most valuable low-cost funding source for our lending business, and as of March 31, 2018, core deposits
115
Table of Contents
represented 78.7% of our total deposits. We strive to retain an attractive deposit mix from both large and small customers as well as a broad market reach, which has resulted in our top 10 customers accounting for only 4.7% of all deposits as of March 31, 2018. We believe our competitive pricing and products, convenient branch locations, and quality personal customer service enable us to attract and retain deposits. We employ conventional marketing initiatives and advertising and in addition leverage our community and board relationships to generate new accounts. Our bankers offer our deposit products to our loan customers. We typically encourage, depending on the circumstances and the type of relationship, our borrowers to maintain deposit accounts as a condition of granting loans. To enhance our relationships with our customers and to identify and meet their particular needs, each customer is assigned a relationship officer (including our SBA borrowers). Interest rates, maturity terms, service fees and withdrawal penalties are established on a periodic basis. Deposit rates and terms are based primarily on current operating strategies, rates offered by other Korean-American focused banks, general market interest rates, liquidity requirements, and our deposit growth goals. We do utilize wholesale deposits to supplement our core retail deposits for funding purposes, including brokered accounts and State California Treasurer’s time deposits. As of March 31, 2018, wholesale deposits totaled $152.5 million, or 11.0%, of total deposits. As of March 31, 2018, our total deposits were $1.4 billion, and our cost of deposits was 1.01% for the three months ended March 31, 2018.
Lending Activities
Our core lending strategy is to build and maintain a diversified portfolio of loans based on the type of customers (e.g., businesses versus individuals), loan products (e.g., real estate loans, commercial and industrial loans, consumer loans), geographical locations, and different industries in which our business customers are engaged in (e.g., manufacturing, wholesale and retail trade, hospitality, etc.). We focus our lending activities on loans that we originate from within our primary lending areas and seek to be the premier provider of lending products and services in our market areas. As an institution, we also strive to meet the credit needs of the communities that we serve. Lending activities originate through expansion of existing relationships as well as by marketing efforts of our bankers, with an emphasis on providing banking solutions tailored to meet our customers’ needs while maintaining our underwriting standards.
Our lending activities on a high level consist of real estate loans, C&I loans, and consumer loans. The real estate loans consist of commercial property loans, SBA property loans, residential property loans, and construction loans. The C&I loan category consists of commercial term loans, commercial lines of credit, SBA commercial term loans (non-real estate secured), and international loans. We also offer various consumer loans to individuals and professionals including automobile loans and unsecured personal lines of credit.
We experienced increases across all loan types during 2017 compared to the prior year with the exception of international loan/trade finances. The interest rate applied to those adjustable rate loans are typically set at specified spreads above the selected prime rate (e.g., Wall Street Journal Prime). The spreads are fixed and thus the interest rate on these loans change in parallel with any changes in the applicable selected prime rates. As of March 31, 2018, and December 31, 2017 and 2016, approximately 73.2%, 73.4% and 69.1%, respectively, of our total loans were adjustable rate loans.
With certain exceptions, we are permitted under the applicable laws to make unsecured loans to single borrowers (including certain related persons and entities) in aggregate amounts of up to 15% of the sum of our total capital, the allowance for loan losses, and certain capital notes and debentures issued by the Bank. As of March 31, 2018, our lending limit was approximately $23.9 million per borrower for unsecured loans. In addition to unsecured loans, we are permitted to make collateral-secured loans in an additional amount of up to 10% (for combined total of 25%) for a total of approximately $39.9 million to one borrower. For lending limit purposes, a secured loan is defined as a loan secured by collateral having a current fair value of at least 100% of the amount of the loan or extension of credit at all times and satisfying certain other requirements. The largest aggregate amount of loans that the Bank had outstanding to any one borrower and related entities was $24.5 million in secured loans, which were performing at March 31, 2018.
116
Table of Contents
The following table shows the composition of our loan portfolio by type of loan on the dates indicated:
| (Dollars in thousands) | March 31, 2018 |
December 31, | ||||||||||
| 2017 | 2016 | |||||||||||
| Real estate loans: |
||||||||||||
| Commercial property |
$ | 675,729 | $ | 662,840 | $ | 597,095 | ||||||
| Residential property |
184,752 | 168,898 | 140,766 | |||||||||
| SBA property |
134,240 | 130,438 | 104,110 | |||||||||
| Construction |
26,089 | 23,215 | 15,129 | |||||||||
|
|
|
|
|
|
|
|||||||
| Total real estate loans |
1,020,810 | 985,391 | 857,100 | |||||||||
| Commercial and industrial loans: |
||||||||||||
| Commercial term |
79,763 | 77,438 | 64,926 | |||||||||
| Commercial lines of credit |
58,195 | 60,850 | 45,171 | |||||||||
| SBA commercial term |
29,337 | 30,199 | 26,467 | |||||||||
| International loans |
2,115 | 1,920 | 3,545 | |||||||||
|
|
|
|
|
|
|
|||||||
| Total commercial and industrial loans |
169,410 | 170,407 | 140,109 | |||||||||
| Consumer loans |
32,704 | 33,870 | 33,722 | |||||||||
|
|
|
|
|
|
|
|||||||
| Gross loans |
1,222,924 | 1,189,668 | 1,030,931 | |||||||||
| Deferred loan costs (fees) |
348 | 331 | 181 | |||||||||
|
|
|
|
|
|
|
|||||||
| Total loans, net of deferred loans costs (fees) |
1,223,272 | 1,189,999 | 1,031,112 | |||||||||
| Allowance for loan losses |
(12,371 | ) | (12,224 | ) | (11,320 | ) | ||||||
|
|
|
|
|
|
|
|||||||
| Loans receivable, net |
$ | 1,210,901 | $ | 1,177,775 | $ | 1,019,792 | ||||||
|
|
|
|
|
|
|
|||||||
For additional information concerning our loan portfolio, see “Management’s Discussion and Analysis of Financial Condition and Results of Operations—Financial Condition—Loans.”
Real Estate Loans. Our real estate loans consist of commercial property loans, which are secured by commercial real estate (e.g., retail shopping centers, industrial/manufacturing properties, multifamily apartment properties, office buildings etc.), residential properties, SBA property loans, which are secured by owner-occupied commercial real estate, and construction loans. Majority of our real estate lending activities originate from businesses and individuals from within our primary lending areas.
For commercial property loans, the maturities are generally up to seven years with payments determined on the basis of principal amortization schedules of up to 25 years with a balloon payment due at maturity. SBA property loans and residential property loans are typically fully amortized with terms up to 25 years and 30 years respectively. Terms for construction loans vary depending on the complexity and size of the project. On average however, construction loans have term of 18 months.
Satisfactory repayments of loans secured by commercial real estate are often dependent on the successful operation of the underlying businesses (in the case of owner occupied real estate) or management of the properties (in the case of non-owner occupied real estate). Accordingly, repayment of these loans may be subject to adverse conditions in the real estate market or the economy to a greater extent than other types of loans. In underwriting loans secured by commercial real estate, we seek to minimize these risks in a variety of ways, including giving careful consideration to the property’s age, condition, operating history, future operating projections, current and projected market rental rates, vacancy rates, location and physical condition. The underwriting analysis may also include credit verification, reviews of appraisals, environmental hazard reports, the borrower’s liquidity and leverage, management experience of the owners or principals, economic condition and industry trends. Also, tertiary sources of repayment in the form of personal guarantees from responsible parties are generally required on our loans secured by commercial real estate. We believe that our management team has extensive knowledge of the market areas where we operate and takes a conservative approach to commercial real estate lending. We focus on what we believe to be high quality credits with low loan-to-value
117
Table of Contents
ratio income-producing properties with strong cash flow characteristics and strong collateral profiles. We require our loans secured by commercial real estate to be secured by what we believe to be well-managed properties with adequate margins.
We originate residential property loans typically collateralized by primary residential properties located in our market areas to enable borrowers to purchase or refinance existing homes. We offer adjustable-rate mortgage loans with the interest rate fixed for the first five years followed by rate adjustments each year with terms up to 30 years. The relative amount of adjustable-rate mortgage loans that can be originated at any time is largely determined by the demand for each in a competitive environment and the effect each has on our interest rate risk. Loans collateralized by residential property generally are originated in amounts of no more than 70% of appraised value. In connection with such loans, we retain a valid lien on the real estate, obtain a title insurance policy that insures that the property is free from encumbrances and require hazard insurance. Loan fees on these products, interest rates and other provisions of residential loans are determined by us on the basis of our own pricing criteria and competitive market conditions. Interest rates and payments on our adjustable-rate loans generally are adjusted annually based on the 1 year-LIBOR rate. While residential property loans are normally originated with up to 30-year terms, such loans typically remain outstanding for substantially shorter periods because borrowers often prepay their loans in full upon sale of the property pledged as security or upon refinancing the original loan. In addition, all of the residential property loans in our loan portfolio contain due-on-sale clauses providing that the Bank may declare the unpaid amount due and payable upon the sale of the property securing the loan. Residential property loans comprise approximately 15.1% and 14.2%, respectively, of the total loan portfolio at March 31, 2018 and December 31, 2017.
Our construction loans are comprised of residential construction and commercial construction. Interest reserves are generally established on real estate construction loans. These loans are typically prime based and have maturities of less than 18 months. Our policy maximum LTV for construction loans is 70% and for land development loans is 50%. Construction loans comprise approximately 2.1% and 2.0% of the total loan portfolio at March 31, 2018 and December 31, 2017.
Total real estate loans totaled $1.0 billion, $985.4 million and $857.1 million, respectively, at March 31, 2018, and December 31, 2017 and 2016.
Commercial and Industrial Loans. Our C&I loan category includes commercial term loans, commercial lines of credit, SBA commercial term loans, and international loans. Commercial term loans are typically extended to finance business acquisitions, permanent working capital needs, and/or equipment purchases. Commercial lines of credit are generally provided to finance short-term working capital needs. SBA commercial term loans are provided to small businesses under the U.S. SBA guarantee program to finance permanent working capital needs and/or equipment purchases. Commercial lines of credit (payable within one year) typically provide for periodic interest payments, with principal payable at maturity. Commercial term loans (usually 5 to 7 years) normally provide for monthly payments of both principal and interest. SBA commercial term usually have a longer maturity (7 to 10 years). These C&I credits are reviewed on a periodic basis with the review frequencies commensurate with the size and complexity of the loans. Most C&I loans are collateralized by perfected security interest on business assets.
In general, C&I loans may involve increased credit risk and, therefore, typically yield a higher return. The increased risk in C&I loans derives from the expectation that such loans generally are serviced principally from the operations of the business, and those operations may not be successful. Any interruption or discontinuance of operating cash flows from the business, which may be influenced by events not under the control of the borrower such as economic events and changes in governmental regulations, could materially affect the ability of the borrower to repay the loan. In addition, the collateral securing C&I loans generally includes moveable properties such as equipment and inventory, which may decline in value more rapidly than we anticipate exposing us to increased credit risks. As a result of these additional complexities, variables and risks, C&I loans require extensive underwriting and servicing.
118
Table of Contents
Total C&I loans totaled $169.4 million, $170.4 million and $140.1 million, respectively, at March 31, 2018, and December 31, 2017 and 2016.
Small Business Administration Loans (reported in our financial statements as either Real Estate Loans or Commercial and Industrial Loans). We offer SBA loan originations for qualifying businesses for loan amounts up to $5.0 million. The Bank primarily extends SBA loans known as SBA 7(a) loans and SBA 504 loans. SBA 7(a) loans are typically extended for working capital needs, purchase of inventory, purchases of machinery and equipment, debt refinance, business acquisitions, start-up financing or the purchase or construction of owner-occupied commercial property. SBA 7(a) loans are typically term loans with maturities up to 10 years for loans not secured by real estate and up to 25 years for real estate secured loans. SBA loans are fully amortizing with monthly payments of principal and interest. SBA 7(a) loans are typically floating rate loans that are secured by business assets and/or real estate. Depending on the loan amount, each loan is typically guaranteed 75% to 85% by the SBA, with a maximum gross loan amount to any one small business borrower of $5.0 million and a maximum SBA guaranteed amount of $3.75 million.
We are generally able to sell the guaranteed portion of the SBA 7(a) loans in the secondary market at a premium. In addition to the interest yield earned on the unguaranteed portion of the SBA 7(a) loans that are not sold, we recognize income from gains on sales and from loan servicing on the SBA 7(a) loans that are sold.
SBA 504 loans are typically extended for the purpose of purchasing owner-occupied commercial real estate or long-term capital equipment. SBA 504 loans are typically extended for up to 20 years or the life of the asset being financed. SBA 504 loans are financed as a participation loan between the Bank and the SBA through a Certified Development Company (“CDC”). Generally, the loans are structured to give the Bank a 50% first deed of trust (“T/D”), the CDC a 40% second T/D, and the remaining 10% is funded by the borrower. Interest rates for the first T/D loans are subject to normal bank commercial rates and terms and the second T/D CDC loans are fixed for the life of the loans based on certain indices.
All of our SBA loan underwriting is centralized and processed through our Los Angeles headquarters SBA Loan Department. The SBA Loan Department is staffed by loan officers who provide assistance to qualified businesses. The Bank has been designated as an SBA Preferred Lender, which is the highest designation awarded by the SBA. This designation generally facilitates a more efficient marketing and approval process for SBA loans. We have attained SBA Preferred Lender status nationwide. We originate SBA loans through our branch staff, lending officers, LPO managers, marketing officers, and brokers.
We originated $38.2 million and $182.5 million, respectively, of SBA loans during the three months ended March 31, 2018 and the year ended December 31, 2017. During the same periods, we sold $29.9 million and $127.3 million, respectively, of the guaranteed portion of our SBA loans. As of March 31, 2018 and December 31, 2017, we held $163.6 million and $160.6 million, respectively, of SBA loans on our balance sheet, $152.6 million and $149.8 million, respectively, of which consisted of the non-guaranteed portion of SBA loans and $10.9 million and $10.8 million, respectively, consisted of the guaranteed portion of loans.
Consumer Loans. The vast majority of our consumer loans portfolio consist of automobile loans with unsecured lines of credit and term loans to high net worth individuals making up small portion of the subject portfolio. Consumer loans are underwritten primarily based on the individual borrower’s income, current debt level, and past credit history. Our consumer auto loans have relatively lower loan-to-value ratios on average, and carry higher interest rates to offset for the inherently higher default risks associated with consumer loans.
Consumer loans totaled $32.7 million, $33.9 million and $33.7 million, respectively, at March 31, 2018, and December 31, 2017 and 2016.
Loan Participations. When the extension of a new loan causes the aggregate exposure to a borrowing relationship to exceed or approach the Bank’s legal lending limits, management on selective basis sells/
119
Table of Contents
participates out a portion(s) of the loan(s) in order to remain within acceptable range below the Bank’s lending limits. As the lead lender in the participation, the Bank retains the servicing rights and the participating lender(s) are prohibited from any direct contact with the borrowers under the terms of the loan participation agreements. Loan participations are also utilized under certain circumstances to reduce and mitigate credit concentrations risks. Loan participations are generally made with local peer group banks. We do not participate in syndicated loans (loans made by a group of lenders who share or participate in a specific loan) with a larger regional financial institution as the lead lender.
Large Credit Relationships. The aggregate amount of loans to our 10 and 30 largest borrowers (including related entities) amounted to approximately $155.7 million, or 12.7% of total loans, and $336.4 million, or 27.5% of total loans, respectively at March 31, 2018 and $153.2 million, or 12.9% of total loans, and $334.9 million, or 28.2% of total loans, respectively at December 31, 2017.
Loan Underwriting and Approval. Historically, we believe we have made sound, high quality loans while recognizing that lending money involves a degree of business risk. We have loan policies designed to assist us in managing this business risk. These policies provide a general framework for our loan origination, monitoring and funding activities, while recognizing that not all risks can be anticipated.
Our board of directors delegates loan authority up to board-approved limits collectively to its Directors’ Loan Committee, which is comprised of members of its board of directors and executive management. Our board of directors also delegates limited lending authority to our internal management loan committee, which is comprised of members of our senior management team and the Chief Executive Officer. The objective of our approval process is to provide a disciplined, collaborative approach to larger credits while maintaining responsiveness to client needs.
Loan decisions are documented as to the borrower’s business, purpose of the loan, evaluation of the repayment source and the associated risks, evaluation of collateral, covenants and monitoring requirements, and the risk rating rationale. Our strategy for approving or disapproving loans is to follow conservative loan policies and consistent underwriting practices which include:
| • | maintaining close relationships among our customers and their designated banker to ensure ongoing credit monitoring and loan servicing; |
| • | granting credit on a sound basis with full knowledge of the purpose and source of repayment for such credit ensuring that primary and secondary sources of repayment are adequate in relation to the amount of the loan; |
| • | developing and maintaining targeted levels of diversification for our loan portfolio as a whole and for loans within each category; and |
| • | ensuring that each loan is properly documented and that any insurance coverage requirements are satisfied. |
Managing credit risk is an enterprise-wide process. Our strategy for credit risk management includes well-defined, centralized credit policies, uniform underwriting criteria, and ongoing risk monitoring and review processes for all credit exposures. Our processes emphasize early-stage review of loans, regular credit evaluations and management reviews of loans, which supplement the ongoing and proactive credit monitoring and loan servicing provided by our bankers. We attempt to identify potential problem loans early in an effort to seek aggressive resolution of these situations before the loans become a loss, record any necessary charge-offs promptly and maintain adequate allowance levels for probable loan losses inherent in the loan portfolio. Our Chief Credit Officer provides company-wide credit oversight and periodically reviews all credit risk portfolios to ensure that the risk identification processes are functioning properly and that our credit standards are followed. In addition, third-party loan reviews are performed at least on semiannual basis to validate our internal risk rating of loans.
Our loan policies generally include other underwriting guidelines for loans collateralized by real estate. These underwriting standards are designed to determine the maximum loan amount that a borrower has the capacity to
120
Table of Contents
repay based upon the type of collateral securing the loan and the borrower’s income. Such loan policies include maximum amortization schedules and loan terms for each category of loans collateralized by liens on real estate. In addition, our loan policies provide guidelines for: personal guarantees; an environmental review; loans to employees, executive officers and directors; problem loan identification; maintenance of an adequate allowance for loan losses and other matters relating to lending practices.
Investment Activities
We manage our securities portfolio and cash to maintain adequate liquidity and to ensure the safety and preservation of invested principal, with a secondary focus on yield and returns. Specific goals of our investment portfolio are as follows:
| • | provide a ready source of balance sheet liquidity, ensuring adequate availability of funds to meet fluctuations in loan demand, deposit balances and other changes in balance sheet volumes and composition; |
| • | serve as a tool to manage asset-quality diversification of our assets; and |
| • | provide a vehicle to help manage our interest rate risk profile pursuant to our established policies and maximize our overall return. |
Our investment portfolio is comprised primarily of U.S. government agency securities, mortgage-backed securities backed by government-sponsored entities and tax exempt municipal securities.
The Bank’s board of directors is responsible for the oversight of investment activities and has delegated the responsibility of monitoring our investment activities to the Asset Liability Committee (“ALCO”). Our investment policy is reviewed and approved annually by ALCO and ratified by our board of directors.
ALCO establishes risk limits and policy for conducting investment activities and approves investment strategies and meets quarterly to review investment reports and monitor investment activities. ALCO receives investment related reports and any policy exceptions from the investment officer, who is appointed by ALCO and responsible for ensuring compliance and implementation of investment policy guidelines. Day-to-day activities pertaining to the securities portfolio are conducted by the investment officer under the supervision of our Chief Executive Officer and Chief Financial Officer. We actively monitor our investments on an ongoing basis to identify any material changes in the securities. We also review our securities for potential other-than-temporary impairment at least quarterly.
Limits for investment transactions are based on total transaction amount and require approval if they exceed designated thresholds. Investment transactions up to $10 million require the approval of both the Chief Executive Officer and Chief Financial Officer. Investment transactions that exceed $10 million, up to $20 million, require management ALCO approval and investment transactions that exceed $20 million require Board ALCO approval.
Other Products and Services
We offer banking products and services that are competitively priced with a focus on convenience and accessibility. We offer a full suite of online banking solutions including access to account balances, online transfers, online bill payment and electronic delivery of customer statements, mobile banking solutions for iPhone and Android phones, including remote check deposit with mobile bill pay. We offer ATMs and banking by telephone, mail and personal appointment. We offer debit cards, direct deposit, cashier’s checks, as well as treasury management services, wire transfer services and ACH services.
We offer a full array of commercial treasury management services designed to be competitive with banks of all sizes. Treasury management services include balance reporting (including current day and previous day activity), transfers between accounts, purchase rewards, finance works, wire transfer initiation, ACH origination
121
Table of Contents
and stop payments. Cash management deposit products consist of remote deposit capture, courier deposit services, positive pay, zero balance accounts and sweep accounts.
We evaluate our services on an ongoing basis, and will add or remove services based upon the perceived needs and financial requirements of our customers, competitive factors and our financial and other capabilities. Future services may also be significantly influenced by improvements and developments in technology and evolving state and federal laws and regulations.
Employees
As of March 31, 2018, we employed 228 full-time equivalent persons. As part of the customer-centric culture initiative of our strategic plan, we provide extensive training to our employees in an effort to ensure that our customers receive superior customer service. None of our employees are represented by any collective bargaining unit or are parties to a collective bargaining agreement. We believe that our relations with our employees are good.
Properties
Our headquarters office is located at 3701 Wilshire Boulevard, Suite 900, Los Angeles, California 90010. This office is located in the Wilshire Center/Koreatown District of Los Angeles and houses our management unit, including compliance and BSA groups, IT, SBA lending management, branch management, commercial real estate and commercial and industrial lending groups, trade finance, credit administration and administrative groups. The lease expires in September 2023. We lease all of our LPO and retail branch locations. The Bank maintains thirteen branch locations, with eight in Los Angeles County (Koreatown/Mid-Wilshire, Koreatown/W. Olympic, Rowland Heights, Downtown Fashion District, Cerritos, Torrance, Little Tokyo and Western Avenue), three in Orange County (Fullerton, Buena Park and Irvine), and two on the East Coast (Bayside, New York and Fort Lee, New Jersey). The Bank also maintains ten LPO’s located in Los Angeles and Irvine, California, Lynnwood, WA, Bellevue, Washington, Dallas, Texas, Aurora, Colorado, Atlanta, Georgia, Annandale, Virginia, Chicago, Illinois and New York, New York.
We believe that the leases to which we are subject are generally on terms consistent with prevailing market terms. None of the leases are with our directors, officers, beneficial owners of more than 5% of our voting securities or any affiliates of the foregoing.
Legal Proceedings
We are from time to time subject to claims and litigation arising in the ordinary course of business. We are not currently plaintiffs or defendants in any material pending litigation matter. Further, we do not have knowledge of any threatened litigation matter which would be expected to have any material adverse effect on our assets, business, cash flow, condition (financial or otherwise), liquidity, prospects, or results of operations. However, given the nature, scope and complexity of the extensive legal and regulatory landscape applicable to our business (including laws and regulations governing consumer protection, fair lending, fair labor, privacy, information security and anti-money laundering and anti-terrorism laws), we, like all banking organizations, are subject to heightened legal and regulatory compliance and litigation risk.
Corporate Information
Our principal executive offices are located at 3701 Wilshire Boulevard, Suite 900, Los Angeles, California 90010, and our telephone number at that address is (213) 210-2000. Our website address is www.paccitybank.com. The information contained on our website is not a part of, or incorporated by reference into, this prospectus.
122
Table of Contents
General
Financial institutions, their holding companies and their affiliates are extensively regulated under U.S. federal and state law. As a result, the growth and earnings performance of the Company and its subsidiaries may be affected not only by management decisions and general economic conditions, but also by the requirements of federal and state statutes and by the regulations and policies of various bank regulatory agencies, including the DBO, the Federal Reserve, the FDIC, and the CFPB. Furthermore, tax laws administered by the Internal Revenue Service and state taxing authorities, accounting rules developed by the FASB, securities laws administered by the SEC and state securities authorities, anti-money laundering laws enforced by the Treasury, and mortgage related rules, including with respect to loan securitization and servicing by the U.S. Department of Housing and Urban Development (“HUD”), and agencies such as Fannie Mae and Freddie Mac, have an impact on our business. The effect of these statutes, regulations, regulatory policies and rules are significant to the financial condition and results of operations of the Company and its subsidiaries, including the Bank, and the nature and extent of future legislative, regulatory or other changes affecting financial institutions are impossible to predict with any certainty.
Federal and state banking laws impose a comprehensive system of supervision, regulation and enforcement on the operations of financial institutions, their holding companies and affiliates intended primarily for the protection of the FDIC-insured deposits and depositors of banks, rather than their shareholders. These federal and state laws, and the related regulations of the bank regulatory agencies, affect, among other things, the scope of business, the kinds and amounts of investments banks may make, reserve requirements, capital levels relative to operations, the nature and amount of collateral for loans, the establishment of branches, the ability to merge, consolidate and acquire, dealings with insiders and affiliates and the payment of dividends.
This supervisory and regulatory framework subjects banks and bank holding companies to regular examination by their respective regulatory agencies, which results in examination reports and ratings that, while not publicly available, can affect the conduct and growth of their businesses. These examinations consider not only compliance with applicable laws and regulations, but also capital levels, asset quality and risk, management ability and performance, earnings, liquidity, and various other factors. The regulatory agencies generally have broad discretion to impose restrictions and limitations on the operations of a regulated entity where the agencies determine, among other things, that such operations are unsafe or unsound, fail to comply with applicable law or are otherwise inconsistent with laws and regulations or with the supervisory policies of these agencies.
The following is a summary of the material elements of the supervisory and regulatory framework applicable to the Company and its subsidiaries, including the Bank. It does not describe all of the statutes, regulations and regulatory policies that apply, nor does it restate all of the requirements of those that are described. The descriptions are qualified in their entirety by reference to the particular statutory and regulatory provision.
Financial Regulatory Reform
The Dodd-Frank Act implemented sweeping reform across the U.S. financial regulatory framework, including, among other changes:
| • | creating a Financial Stability Oversight Council tasked with identifying and monitoring systemic risks in the financial system; |
| • | creating the CFPB, which is responsible for implementing, examining and enforcing compliance with federal consumer financial protection laws; |
| • | requiring the FDIC to make its capital requirements for insured depository institutions countercyclical, so that capital requirements increase in times of economic expansion and decrease in times of economic contraction; |
123
Table of Contents
| • | imposing more stringent capital requirements on bank holding companies and subjecting certain activities, including interstate mergers and acquisitions, to heightened capital conditions; |
| • | with respect to mortgage lending: |
| • | significantly expanding requirements applicable to loans secured by 1-4 family residential real property; |
| • | imposing strict rules on mortgage servicing, and |
| • | requiring the originator of a securitized loan, or the sponsor of a securitization, to retain at least 5% of the credit risk of securitized exposures unless the underlying exposures are qualified residential mortgages or meet certain underwriting standards; |
| • | changing the assessment base for federal deposit insurance from the amount of the insured deposits held by the depository institution to the depository institution’s average total consolidated assets less tangible equity, eliminating the ceiling on the size of the FDIC’s Deposit Insurance Fund and increasing the floor of the size of the FDIC’s Deposit Insurance Fund; |
| • | eliminating all remaining restrictions on interstate banking by authorizing state banks to establish de novo banking offices in any state that would permit a bank chartered in that state to open a banking office at that location; |
| • | repealing the federal prohibitions on the payment of interest on demand deposits, thereby permitting depository institutions to pay interest on business transaction and other accounts; and |
| • | in the so-called “Volcker Rule,” subject to numerous exceptions, prohibiting depository institutions and affiliates from certain investments in, and sponsorship of, hedge funds and private equity funds and from engaging in proprietary trading. |
On February 3, 2017, President Trump signed an executive order calling for his administration to review existing U.S. financial laws and regulations, including the Dodd-Frank Act, in order to determine their consistency with a set of “core principles” of financial policy. The core financial principles identified in the executive order include the following: empowering Americans to make independent financial decisions and informed choices in the marketplace, save for retirement, and build individual wealth; preventing taxpayer-funded bailouts; fostering economic growth and vibrant financial markets through more rigorous regulatory impact analysis that addresses systemic risk and market failures, such as moral hazard and information asymmetry; enabling American companies to be competitive with foreign firms in domestic and foreign markets; advancing American interests in international financial regulatory negotiations and meetings; and restoring public accountability within Federal financial regulatory agencies and “rationalizing” the Federal financial regulatory framework.
Many aspects of the Dodd-Frank Act are subject to rulemaking and will take effect over several years, making it difficult to anticipate the overall financial impact on us. Although the reforms primarily target systemically important financial service providers, the Dodd-Frank Act’s influence has and is expected to continue to filter down in varying degrees to smaller institutions over time. We will continue to evaluate the effect of the Dodd-Frank Act; however, in many respects, the ultimate impact of the Dodd-Frank Act will not be fully known for years, and no current assurance may be given that the Dodd-Frank Act, or any other new legislative changes, will not have a negative impact on the results of operations and financial condition of the Company and the Bank.
President Trump recently signed the Economic Growth, Regulatory Relief and Consumer Protection Act (the “Economic Growth Act”), which repeals or modifies certain provisions of the Dodd-Frank Act and eases regulations on all but the largest banks. The Economic Growth Act’s highlights include improving consumer access to mortgage credit that, among other things, (i) exempt banks with less than $10 billion in assets from the ability-to-repay requirements for certain qualified residential mortgage loans; (ii) not require appraisals for certain transactions valued at less than $400,000 in rural areas; (iii) exempt banks and credit unions that originate fewer than 500 open-end and 500 closed-end mortgages from the Home Mortgage Disclosure Act’s (“HMDA”) expanded data disclosures (the provision would not apply to nonbanks and would not exempt institutions from
124
Table of Contents
HMDA reporting altogether; (iv) amend the SAFE Mortgage Licensing Act by providing registered mortgage loan originators in good standing with 120 days of transitional authority to originate loans when moving from a federal depository institution to a non-depository institution or across state lines; (v) require the CFPB to clarify how TRID applies to mortgage assumption transactions and construction-to-permanent home loans as well as outline certain liabilities related to model disclosure use, and (vi) provide that federal banking regulators may not impose higher capital standards on High Volatility Commercial Real Estate exposures unless they are for acquisition, development or construction (ADC), and clarifies ADC status. In addition, the Economic Growth Act’s highlights also include regulatory relief for certain institutions, whereby among other things, it simplifies capital calculations by requiring regulators to adopt a threshold for a community bank leverage ratio of between 8% to 10%, institutions under $10 billion in assets that meet such community bank leverage ratio will automatically be deemed to be well-capitalized, although regulators retain the flexibility to determine that a depository institution may not qualify for the community bank leverage ratio test based on the institution’s risk profile, and exempts community banks from Section 13 of the Bank Holding Company Act if they have less than $10 billion in total consolidated assets; and exempts banks with less than $10 billion in assets, and total trading assets and liabilities not exceeding more than five percent of their total assets, from the Volcker Rule restrictions on trading with their own capital. The Economic Growth Act also adds certain protections for consumers, including veterans and active duty military personnel, expanded credit freezes and creation of an identity theft protection database. The Economic Growth Act also makes changes for bank holding companies, as it raises the threshold for automatic designation as a systemically important financial institution from $50 billion to $250 billion in assets, subjects banks with $100 billion to $250 billion in total assets to periodic stress tests, exempts from stress test requirements entirely banks with under $100 billion in assets, and requires the federal banking regulators to, within 180 days of passage, raise the asset threshold under the Small Bank Holding Company Policy Statement from $1 billion to $3 billion. The Economic Growth Act also adds certain protections for student borrowers.
Other legislative and regulatory initiatives which could affect the Company, the Bank and the banking industry in general may be proposed or introduced before the U.S. Congress, the California legislature and other governmental bodies in the future. In addition, the various banking regulatory agencies often adopt new rules and regulations to implement and enforce existing legislation. It cannot be predicted whether, or in what form, any such legislation or regulations may be enacted or the extent to which the business of the Company or the Bank would be affected thereby.
Regulatory Capital Requirements
The federal banking agencies have risk-based capital adequacy guidelines intended to provide a measure of capital adequacy that reflects the degree of risk associated with a banking organization’s operations, both for transactions reported on the balance sheet as assets and for transactions, such as letters of credit and recourse arrangements, that are recorded as off-balance sheet items. In 2013, the Federal Reserve, FDIC, and Office of the Comptroller of the Currency issued final rules (the “Basel III Capital Rules”) establishing a new comprehensive capital framework for U.S. banking organizations. The rules implement the Basel Committee’s December 2010 framework, commonly referred to as Basel III, for strengthening international capital standards, as well as implementing certain provisions of the Dodd-Frank Act.
The Basel III Capital Rules became effective for the Company and the Bank on January 1, 2015 (subject to phase-in periods for some of their components). The Basel III Capital Rules: (i) introduce a new capital measure called Common Equity Tier 1 (“CET1”), and a related regulatory capital ratio of CET1 to risk-weighted assets; (ii) specify that Tier 1 capital consists of CET1 and “Additional Tier 1 capital” instruments, which are instruments treated as Tier 1 instruments under the prior capital rules that meet certain revised requirements; (iii) mandate that most deductions or adjustments to regulatory capital measures be made to CET1 and not to the other components of capital; and (iv) expand the scope of the deductions from and adjustments to capital, as compared to existing regulations. Under the Basel III Capital Rules, for most banking organizations, the most common form of additional Tier 1 capital is noncumulative perpetual preferred stock and the most common
125
Table of Contents
form of Tier 2 capital is subordinated notes and a portion of the allowance for loan and lease losses, in each case, subject to the Basel III Capital Rules’ specific requirements.
Under the Basel III Capital Rules, the following are the initial minimum capital ratios applicable to the Company and the Bank as of January 1, 2015:
| • | 4.0% Tier 1 leverage ratio; |
| • | 4.5% CET1 to risk-weighted assets; |
| • | 6.0% Tier 1 capital (that is, CET1 plus Additional Tier 1 capital) to risk-weighted assets; and |
| • | 8.0% total capital (that is, Tier 1 capital plus Tier 2 capital) to risk-weighted assets. |
The Basel III Capital Rules also introduced a “capital conservation buffer,” composed entirely of CET1, on top of these minimum risk-weighted asset ratios. The capital conservation buffer is designed to absorb losses during periods of economic stress. Banking institutions with a ratio of CET1 to risk-weighted assets above the minimum but below the capital conservation buffer will face constraints on dividends, equity repurchases and compensation based on the amount of the shortfall. The implementation of the capital conservation buffer began on January 1, 2016 at 0.625% and will be phased in over a three-year period (increasing by that amount on each subsequent January 1, until it reaches 2.5% on January 1, 2019). In 2017, banking organizations, including the Company and the Bank, were required to maintain a CET1 capital ratio of at least 5.75%, a Tier 1 capital ratio of at least 7.25%, and a total capital ratio of at least 9.25% to avoid limitations on capital distributions and certain discretionary incentive compensation payments. During 2018, banking organizations, including the Company and the Bank, are required to maintain a CET1 capital ratio of at least 6.375%, a Tier 1 capital ratio of at least 7.875%, and a total capital ratio of at least 9.875% to avoid limitations on capital distributions and certain discretionary incentive compensation payments. When fully phased-in on January 1, 2019, the Company and the Bank must maintain the following minimum capital ratios:
| • | 4.0% Tier 1 leverage ratio; |
| • | 4.5% CET1 to risk-weighted assets, plus the capital conservation buffer, effectively resulting in a minimum ratio of CET1 to risk-weighted assets of at least 7%; |
| • | 6.0% Tier 1 capital to risk-weighted assets, plus the capital conservation buffer, effectively resulting in a minimum Tier 1 capital ratio of at least 8.5%; and |
| • | 8.0% total capital to risk-weighted assets, plus the capital conservation buffer, effectively resulting in a minimum total capital ratio of at least 10.5%. |
The Basel III Capital Rules provide for a number of deductions from and adjustments to CET1. These include, for example, the requirement that (i) mortgage servicing rights, (ii) deferred tax assets arising from temporary differences that could not be realized through net operating loss carrybacks, and (iii) significant investments in non-consolidated financial entities be deducted from CET1 to the extent that any one such category exceeds 10% of CET1 or all such items, in the aggregate, exceed 15% of CET1. Implementation of the deductions and other adjustments to CET1 began on January 1, 2015 and would be phased-in over a four-year period (beginning at 40% on January 1, 2015 and an additional 20% per year thereafter). Under the Basel III Capital Rules, the effects of certain accumulated other comprehensive income or loss items are not excluded for the purposes of determining regulatory capital ratios; however, non-advanced approaches banking organizations (i.e., banking organizations with less than $250 billion in total consolidated assets or with less than $10 billion of on-balance sheet foreign exposures), including the Company and the Bank, may make a one-time permanent election to exclude these items. The Company and the Bank made this election in the first quarter of 2015’s call reports in order to avoid significant variations in the level of capital depending upon the impact of interest rate fluctuations on the fair value of its available-for-sale investment securities portfolio.
The Basel III Capital Rules prescribe a new standardized approach for risk weightings that expands the risk weighting categories from the previous four Basel I-derived categories (0%, 20%, 50% and 100%) to a larger and
126
Table of Contents
more risk-sensitive number of categories, generally ranging from 0% for U.S. Government and agency securities, to 600% for certain equity exposures, depending on the nature of the assets. The new capital rules generally result in higher risk weights for a variety of asset classes, including certain CRE mortgages. Additional aspects of the Basel III Capital Rules that are relevant to the Company and the Bank include:
| • | consistent with the Basel I risk-based capital rules, assigning exposures secured by single-family residential properties to either a 50% risk weight for first-lien mortgages that meet prudent underwriting standards or a 100% risk weight category for all other mortgages; |
| • | providing for a 20% credit conversion factor for the unused portion of a commitment with an original maturity of one year or less that is not unconditionally cancellable (set at 0% under the Basel I risk-based capital rules); |
| • | assigning a 150% risk weight to all exposures that are nonaccrual or 90 days or more past due (set at 100% under the Basel I risk-based capital rules), except for those secured by single-family residential properties, which will be assigned a 100% risk weight, consistent with the Basel I risk-based capital rules; |
| • | applying a 150% risk weight instead of a 100% risk weight for certain high volatility CRE acquisition, development and construction loans; and |
| • | applying a 250% risk weight to the portion of mortgage servicing rights and deferred tax assets arising from temporary differences that could not be realized through net operating loss carrybacks that are not deducted from CET1 capital (set at 100% under the Basel I risk-based capital rules). |
As of March 31, 2018, the Company’s and the Bank’s capital ratios exceeded the minimum capital adequacy guideline percentage requirements of the federal banking agencies for “well capitalized” institutions under the Basel III capital rules on a fully phased-in basis.
With respect to the Bank, the Basel III Capital Rules also revise the prompt corrective action (“PCA”), regulations pursuant to Section 38 of the Federal Deposit Insurance Act, as discussed below under “PCA.”
PCA
The Federal Deposit Insurance Act, as amended (“FDIC”), requires federal banking agencies to take PCA in respect of depository institutions that do not meet minimum capital requirements. The FDIA includes the following five capital tiers: “well capitalized,” “adequately capitalized,” “undercapitalized,” “significantly undercapitalized,” and “critically undercapitalized.” A depository institution’s capital tier will depend upon how its capital levels compare with various relevant capital measures and certain other factors, as established by regulation. The Basel III Capital Rules, revised the PCA requirements effective January 1, 2015. Under the revised PCA provisions of the FDIA, an insured depository institution generally will be classified in the following categories based on the capital measures indicated:
| PCA Category |
Total Risk- Based Capital Ratio |
Tier 1 Risk- Based Capital Ratio |
CET1 Risk- Based Ratio |
Tier 1 Leverage Ratio |
||||||||||||
| Well capitalized |
10 | % | 8 | % | 6.5 | % | 5 | % | ||||||||
| Adequately capitalized |
8 | % | 6 | % | 4.5 | % | 4 | % | ||||||||
| Undercapitalized |
< 8 | % | < 6 | % | < 4.5 | % | < 4 | % | ||||||||
| Significantly undercapitalized |
< 6 | % | < 4 | % | < 3.0 | % | < 3 | % | ||||||||
| Critically undercapitalized |
Tangible Equity/Total Assets £ 2% | |||||||||||||||
An institution may be downgraded to, or deemed to be in, a capital category that is lower than indicated by its capital ratios, if it is determined to be in an unsafe or unsound condition or if it receives an unsatisfactory examination rating with respect to certain matters. A bank’s capital category is determined solely for the purpose of applying PCA regulations and the capital category may not constitute an accurate representation of the bank’s overall financial condition or prospects for other purposes.
127
Table of Contents
The FDIA generally prohibits a depository institution from making any capital distributions (including payment of a dividend) or paying any management fee to its parent holding company, if the depository institution would thereafter be “undercapitalized.” “Undercapitalized” institutions are subject to growth limitations and are required to submit capital restoration plans. If a depository institution fails to submit an acceptable plan, it is treated as if it is “significantly undercapitalized.” “Significantly undercapitalized” depository institutions may be subject to a number of requirements and restrictions, including orders to sell sufficient voting stock to become “adequately capitalized,” requirements to reduce total assets, and cessation of receipt of deposits from correspondent banks. “Critically undercapitalized” institutions are subject to the appointment of a receiver or conservator.
The capital classification of a bank holding company and a bank affects the frequency of regulatory examinations, the bank holding company’s and the bank’s ability to engage in certain activities and the deposit insurance premium paid by the bank. As of December 31, 2017, we met the requirements to be “well-capitalized” based upon the aforementioned ratios for purposes of the prompt corrective action regulations, as currently in effect.
The Company
General. The Company, as the sole shareholder of the Bank, is a registered bank holding company under the BHCA. As a registered bank holding company, the Company is subject to regulation by the Federal Reserve. In accordance with Federal Reserve policy, and as now codified by the Dodd-Frank Act, the Company is legally obligated to act as a source of financial strength to the Bank and to commit resources to support the Bank in circumstances where the Company might not otherwise do so. For a discussion of the source of strength requirements, see “Supervision and Regulation—The Company—Source of Strength Doctrine” below. Under the BHCA, the Company is subject to periodic examination by the Federal Reserve. The Company is required to file with the Federal Reserve periodic reports of the Company’s operations and such additional information regarding the Company and its subsidiaries as the Federal Reserve may require.
The Company is also a bank holding company within the meaning of Section 1280 of the California Financial Code. Consequently, the Company is subject to examination by, and may be required to file reports with, the DBO.
Acquisitions, Activities and Change in Control. The primary purpose of a bank holding company is to control and manage banks. The BHCA generally requires the prior approval by the Federal Reserve for any merger involving a bank holding company, any bank holding company’s acquisition of more than 5% of a class of voting securities of any additional bank or bank holding company or the acquisition of all or substantially all the assets of any additional bank or bank holding company. In reviewing applications seeking approval of merger and acquisition transactions, the Federal Reserve considers, among other things, the competitive effect and public benefits of the transactions, the capital position and managerial resources of the combined organization, the risks to the stability of the U.S. banking or financial system, the applicant’s performance record under the CRA, the applicant’s compliance with fair housing and other consumer protection laws and the effectiveness of all organizations involved in combating money laundering activities. In addition, failure to implement or maintain adequate compliance programs could cause bank regulators not to approve an acquisition where regulatory approval is required or to prohibit an acquisition even if approval is not required. Subject to certain conditions (including deposit concentration limits established by the BHCA and the Dodd-Frank Act), the Federal Reserve may allow a bank holding company to acquire banks located in any state of the U.S. In approving interstate acquisitions, the Federal Reserve is required to give effect to applicable state law limitations on the aggregate amount of deposits that may be held by the acquiring bank holding company and its insured depository institution affiliates in the state in which the target bank is located (provided that those limits do not discriminate against out-of-state depository institutions or their holding companies) and state laws that require that the target bank have been in existence for a minimum period of time (not to exceed five years) before being acquired by an out-of-state bank holding company. Furthermore, in accordance with the Dodd-Frank Act, bank holding companies must be well-capitalized and well-managed in order to effect interstate mergers or acquisitions. For a discussion of the capital requirements, see “Supervision and Regulation—Regulatory Capital Requirements” above.
128
Table of Contents
The BHCA generally prohibits the Company from acquiring direct or indirect ownership or control of more than 5% of the voting shares of any company that is not a bank and from engaging in any business other than that of banking, managing and controlling banks or furnishing services to banks and their subsidiaries. This general prohibition is subject to a number of exceptions. The principal exception allows bank holding companies to engage in, and to own shares of companies engaged in, certain businesses found by the Federal Reserve prior to November 11, 1999 to be “so closely related to banking as to be a proper incident thereto.” This authority would permit the Company to engage in a variety of banking-related businesses, including the ownership and operation of a savings association, or any entity engaged in consumer finance, equipment leasing, the operation of a computer service bureau (including software development) and mortgage banking and brokerage. The BHCA generally does not place territorial restrictions on the domestic activities of nonbank subsidiaries of bank holding companies.
Additionally, bank holding companies that meet certain eligibility requirements prescribed by the BHCA and elect to operate as financial holding companies may engage in, or own shares in companies engaged in, a wider range of nonbanking activities, including securities and insurance underwriting and sales, merchant banking and any other activity that the Federal Reserve, in consultation with the Secretary of the Treasury, determines by regulation or order is financial in nature or incidental to any such financial activity or that the Federal Reserve determines by order to be complementary to any such financial activity and does not pose a substantial risk to the safety or soundness of depository institutions or the financial system generally. The Company has not elected to be a financial holding company.
If the Company should elect to become a financial holding company, in order to maintain the Company’s status as a financial holding company, the Company and the Bank must be well-capitalized, well-managed, and have at least a satisfactory CRA rating. If the Company should elect to become a financial holding company and the Federal Reserve subsequently determines that the Company, a financial holding company, is not well-capitalized or well-managed, the Company would have a period of time during which to achieve compliance, but during the period of noncompliance, the Federal Reserve may place any limitations on the Company it believes to be appropriate. Furthermore, if the Company should elect to become a financial holding company and the Federal Reserve subsequently determines that the Bank, as a financial holding company subsidiary, has not received a satisfactory CRA rating, the Company would not be able to commence any new financial activities or acquire a company that engages in such activities.
Federal law also prohibits any person or company from acquiring “control” of an FDIC-insured depository institution or its holding company without prior notice to the appropriate federal bank regulator. “Control” is conclusively presumed to exist upon the acquisition of 25% or more of the outstanding voting securities of a bank or bank holding company, but may arise under certain circumstances between 5% and 24.99% ownership.
Under the California Financial Code, any proposed acquisition of “control” of the Bank by any person (including a company) must be approved by the Commissioner of the DBO. The California Financial Code defines “control” as the power, directly or indirectly, to direct the Bank’s management or policies or to vote 25% or more of any class of the Bank’s outstanding voting securities. Additionally, a rebuttable presumption of control arises when any person (including a company) seeks to acquire, directly or indirectly, 10% or more of any class of the Bank’s outstanding voting securities.
Capital Requirements. Bank holding companies are required to maintain capital in accordance with Federal Reserve capital adequacy requirements, as affected by the Dodd-Frank Act and Basel III. For a discussion of capital requirements, see “Supervision and Regulation—Regulatory Capital Requirements” above.
Source of Strength Doctrine. Federal Reserve policy historically required bank holding companies to act as a source of financial and managerial strength to their subsidiary banks. The Dodd-Frank Act codified this policy as a statutory requirement. Under this requirement the Company is expected to commit resources to support the Bank, including at times when the Company may not be in a financial position to provide it. The Company must
129
Table of Contents
stand ready to use its available resources to provide adequate capital to the subsidiary bank during periods of financial stress or adversity. The Company must also maintain the financial flexibility and capital raising capacity to obtain additional resources for assisting the Bank. The Company’s failure to meet its source of strength obligations may constitute an unsafe and unsound practice or a violation of the Federal Reserve’s regulations or both. The source of strength doctrine most directly affects bank holding companies where a bank holding company’s subsidiary bank fails to maintain adequate capital levels. In such a situation, the subsidiary bank will be required by the bank’s federal regulator to take “prompt corrective action.” Any capital loans by a bank holding company to a subsidiary bank are subordinate in right of payment to deposits and to certain other indebtedness of such bank. The BHCA provides that in the event of the bank holding company’s bankruptcy any commitment by a bank holding company to a federal bank regulatory agency to maintain the capital of its subsidiary bank will be assumed by the bankruptcy trustee and entitled to priority of payment.
Dividend Payments, Stock Redemptions and Stock Repurchases. The Company’s ability to pay dividends to its shareholders may be affected by both general corporate law considerations and the policies of the Federal Reserve applicable to bank holding companies. As a California corporation, the Company is subject to the limitations of California law, which allows a corporation to distribute cash or property to shareholders, including a dividend or repurchase or redemption of shares, if the corporation meets either a retained earnings test or a “balance sheet” test. Under the retained earnings test, the Company may make a distribution from retained earnings to the extent that its retained earnings exceed the sum of (a) the amount of the distribution plus (b) the amount, if any, of dividends in arrears on shares with preferential dividend rights. The Company may also make a distribution if, immediately after the distribution, the value of its assets equals or exceeds the sum of (a) its total liabilities plus (b) the liquidation preference of any shares which have a preference upon dissolution over the rights of shareholders receiving the distribution. Indebtedness is not considered a liability if the terms of such indebtedness provide that payment of principal and interest thereon are to be made only if, and to the extent that, a distribution to shareholders could be made under the balance sheet test. A California corporation may specify in its articles of incorporation that distributions under the retained earnings test or balance sheet test can be made without regard to the preferential rights amount. The Company’s articles of incorporation do not address distributions under either the retained earnings test or the balance sheet test. As a general matter, the Federal Reserve has indicated that the board of directors of a bank holding company should eliminate, defer or significantly reduce dividends to shareholders if: (i) the bank holding company’s net income available to shareholders for the past four quarters, net of dividends previously paid during that period, is not sufficient to fully fund the dividends; (ii) the prospective rate of earnings retention is inconsistent with the bank holding company’s capital needs and overall current and prospective financial condition; or (iii) the bank holding company will not meet, or is in danger of not meeting, its minimum regulatory capital adequacy ratios. If the Company’s fails to adhere to these policies, the Federal Reserve could find that the Company is operating in an unsafe and unsound manner. In addition, under the Basel III Rule, institutions that seek to pay dividends must maintain 2.5% in CET1 attributable to the capital conservation buffer, which is to be phased in over a three year period that began on January 1, 2016. See “Supervision and Regulation—Regulatory Capital Requirements” above.
Subject to exceptions for well-capitalized and well-managed holding companies, Federal Reserve regulations also require approval of holding company purchases and redemptions of its securities if the gross consideration paid exceeds 10 percent of consolidated net worth for any 12-month period. In addition, Federal Reserve policy requires that bank holding companies consult with and inform the Federal Reserve in advance of (i) redeeming or repurchasing capital instruments when experiencing financial weakness and (ii) redeeming or repurchasing common stock and perpetual preferred stock if the result will be a net reduction in the amount of such capital instruments outstanding for the quarter in which the reduction occurs.
The Bank
General. The Bank is a California-chartered bank, but is not a member of the Federal Reserve System (a “non-member bank”). The deposit accounts of the Bank are insured by the FDIC’s Deposit Insurance Fund
130
Table of Contents
(“DIF”) to the maximum extent provided under federal law and FDIC regulations. As a California-chartered non-member bank, the Bank is subject to examination, supervision, and regulation by the DBO, the chartering authority for California banks, and by the FDIC.
Depositor Preference. In the event of the “liquidation or other resolution” of an insured depository institution, the claims of depositors of the institution, including the claims of the FDIC as subrogee of insured depositors, and certain claims for administrative expenses of the FDIC as a receiver, will have priority over other general unsecured claims against the institution. If an insured depository institution fails, insured and uninsured depositors along with the FDIC, will have priority in payment ahead of unsecured, non-deposit creditors including the parent bank holding company with respect to any extensions of credit they have made to such insured depository institution.
Brokered Deposit Restrictions. Well capitalized institutions are not subject to limitations on brokered deposits, while adequately capitalized institutions are able to accept, renew or roll over brokered deposits only with a waiver from the FDIC and subject to certain restrictions on the yield paid on such deposits. Undercapitalized institutions are generally not permitted to accept, renew, or roll over brokered deposits. As of March 31, 2018, the Bank was eligible to accept brokered deposits without a waiver from FDIC.
Loans to One Borrower. With certain limited exceptions, the maximum amount that a California bank may lend to any borrower at any one time (including the obligations to the bank of certain related entities of the borrower) may not exceed 25% (and unsecured loans may not exceed 15%) of the bank’s shareholders’ equity, allowance for loan loss, and any capital notes and debentures of the bank.
Tie in Arrangements. Federal law prohibits a bank holding company and any subsidiary banks from engaging in certain tie in arrangements in connection with the extension of credit. For example, the Bank may not extend credit, lease or sell property, or furnish any service, or fix or vary the consideration for any of the foregoing on the condition that (i) the customer must obtain or provide some additional credit, property or service from or to the Bank other than a loan, discount, deposit or trust service, (ii) the customer must obtain or provide some additional credit, property or service from or to the Company, or (iii) the customer must not obtain some other credit, property or service from competitors, except reasonable requirements to assure soundness of credit extended.
Deposit Insurance. As an FDIC-insured institution, the Bank is required to pay deposit insurance premium assessments to the FDIC. The premiums fund the DIF. The FDIC assesses a quarterly deposit insurance premium on each insured institution based on risk characteristics of the institution and may also impose special assessments in emergency situations. Effective July 1, 2016, the FDIC changed the deposit insurance assessment system for banks, such as the Bank, with less than $10 billion in assets that have been federally insured for at least five years. Among other changes, the FDIC eliminated risk categories for such banks and now uses the “financial ratios method” to determine assessment rates for all such banks. Under the financial ratios method, the FDIC determines assessment rates based on a combination of financial data and supervisory ratings that estimate a bank’s probability of failure within three years. The assessment rate determined by considering such information is then applied to the amount of the institution’s average assets minus average tangible equity to determine the institution’s insurance premium.
The Dodd-Frank Act requires the FDIC to ensure that the DIF reserve ratio, which is the amount in the DIF as a percentage of all DIF-insured deposits, reaches 1.35% by September 3, 2020. The Dodd-Frank Act also altered the minimum designated reserve ratio for the DIF, increasing the minimum from 1.15% to 1.35%, and eliminated the requirement that the FDIC pay dividends to depository institutions when the reserve ratio exceeds certain thresholds. At least semi-annually, the FDIC updates its loss and income projections for the DIF and, if needed, may increase or decrease the assessment rates, following notice and comment on proposed rulemaking if required. As a result, the Bank’s FDIC deposit insurance premiums could increase. During the three months ended March 31, 2018 and the year ended December 31, 2017, the Bank paid $110 thousand and $349 thousand, respectively, in aggregate FDIC deposit insurance premiums.
131
Table of Contents
The FDIC may terminate insurance of deposits of any insured institution if the FDIC finds that the insured institution has engaged in unsafe and unsound practices, is in an unsafe or unsound condition, or has violated any applicable law, regulation, rule, order or condition imposed by the FDIC or any other regulatory agency.
FICO Assessments. In addition to paying basic deposit insurance assessments, insured depository institutions must pay Financing Corporation assessments (“FICO Assessments”). Financing Corporation is a mixed-ownership governmental corporation chartered by the former FHLB Board pursuant to the Competitive Equality Banking Act of 1987 to function as a financing vehicle for the recapitalization of the former Federal Savings and Loan Insurance Corporation. Financing Corporation issued 30-year noncallable bonds of approximately $8.1 billion that mature in 2017 through 2019. Financing Corporation’s authority to issue bonds ended on December 12, 1991. Since 1996, federal legislation has required that all FDIC-insured depository institutions pay assessments to cover interest payments on Financing Corporation’s outstanding obligations. The FICO Assessment rate is adjusted quarterly and for the first quarter of 2018 and the fourth quarter of 2017 was approximately 0.00110 and 0.00115 basis points, respectively, (0.11 and 0.115 cents, respectively, per $100 of assessable deposits). During the three months ended March 31, 2018 and the year ended December 31, 2017, the Bank paid $14 thousand and $60 thousand, respectively, in aggregate FICO Assessments.
Supervisory Assessments. California-chartered banks are required to pay supervisory assessments to the DBO to fund its operations. The amount of the assessment paid by a California bank to the DBO is calculated on the basis of the institution’s total assets, including consolidated subsidiaries, as reported to the DBO. During the three months ended March 31, 2018 and the year ended December 31, 2017, the Bank paid supervisory assessments to the DBO totaling none and $114 thousand, respectively.
Capital Requirements. Banks are generally required to maintain capital levels in excess of other businesses. For a discussion of capital requirements, see “Supervision and Regulation—Regulatory Capital Requirements” above.
Dividend Payments. The primary source of funds for the Company is dividends from the Bank. Under the California Financial Code, the Bank is permitted to pay a dividend in the following circumstances: (i) without the consent of either the DBO or the Bank’s shareholders, in an amount not exceeding the lesser of (a) the retained earnings of the Bank; or (b) the net income of the Bank for its last three fiscal years, less the amount of any distributions made during the prior period; (ii) with the prior approval of the DBO, in an amount not exceeding the greatest of: (a) the retained earnings of the Bank; (b) the net income of the Bank for its last fiscal year; or (c) the net income for the Bank for its current fiscal year; and (iii) with the prior approval of the DBO and the Bank’s shareholders (i.e., the Company) in connection with a reduction of its contributed capital.
The payment of dividends by any financial institution is affected by the requirement to maintain adequate capital pursuant to applicable capital adequacy guidelines and regulations, and a financial institution generally is prohibited from paying any dividends if, following payment thereof, the institution would be undercapitalized. In addition, under the Basel III Rule, institutions that seek to pay dividends must maintain over 2.5% in CET1 attributable to the capital conservation buffer, which is to be phased in over a three-year period that began on January 1, 2016. See “Supervision and Regulation—Regulatory Capital Requirements” above. As described above, the Bank exceeded its minimum capital requirements under applicable regulatory guidelines as of March 31, 2018.
Transactions with Affiliates. Transactions between depository institutions and their affiliates, including transactions between the Bank and the Company, are governed by Sections 23A and 23B of the Federal Reserve Act and the Federal Reserve’s Regulation W promulgated thereunder. Generally, Section 23A limits the extent to which a depository institution and its subsidiaries may engage in “covered transactions” with any one affiliate to an amount equal to 10% of the depository institution’s capital stock and surplus, and contains an aggregate limit on all such transactions with all affiliates of an amount equal to 20% of the depository institution’s capital stock and surplus. Section 23A also establishes specific collateral requirements for loans or extensions of credit to, or
132
Table of Contents
guarantees, acceptances or letters of credit issued on behalf of, an affiliate. Section 23B requires that covered transactions and a broad list of other specified transactions be on terms substantially the same, or at least as favorable to the depository institution and its subsidiaries, as those for similar transactions with non-affiliates.
Loans to Directors, Executive Officers and Principal Shareholders. The authority of the Bank to extend credit to its directors, executive officers and principal shareholders, including their immediate family members and corporations and other entities that they control, is subject to substantial restrictions and requirements under the Federal Reserve’s Regulation O, as well as the Sarbanes-Oxley Act. These laws and regulations impose limits on the amount of loans the Bank may make to directors and other insiders and require, among other things, that: (i) the loans must be made on substantially the same terms, including interest rates and collateral, as prevailing at the time for comparable transactions with persons not affiliated with the Company or the Bank; (ii) the Bank follow credit underwriting procedures at least as stringent as those applicable to comparable transactions with persons who are not affiliated with the Company or the Bank; and (iii) the loans not involve a greater-than-normal risk of non-payment or include other features not favorable to the Bank. A violation of these restrictions may result in the assessment of substantial civil monetary penalties on the affected bank or any officer, director, employee, agent or other person participating in the conduct of the affairs of that bank, the imposition of a cease and desist order, and other regulatory sanctions.
Safety and Soundness Standards/Risk Management. The federal banking agencies have adopted guidelines that establish operational and managerial standards to promote the safety and soundness of federally insured depository institutions. The guidelines set forth standards for internal controls, information systems, internal audit systems, loan documentation, credit underwriting, interest rate exposure, asset growth, compensation, fees and benefits, asset quality and earnings.
In general, the safety and soundness guidelines prescribe the goals to be achieved in each area, and each institution is responsible for establishing its own procedures to achieve those goals. If an institution fails to comply with any of the standards set forth in the guidelines, the financial institution’s primary federal regulator may require the institution to submit a plan for achieving and maintaining compliance. If a financial institution fails to submit an acceptable compliance plan, or fails in any material respect to implement a compliance plan that has been accepted by its primary federal regulator, the regulator is required to issue an order directing the institution to cure the deficiency. Until the deficiency cited in the regulator’s order is cured, the regulator may restrict the financial institution’s rate of growth, require the financial institution to increase its capital, restrict the rates the institution pays on deposits or require the institution to take any action the regulator deems appropriate under the circumstances. Noncompliance with the standards established by the safety and soundness guidelines may also constitute grounds for other enforcement action by the federal bank regulatory agencies, including cease and desist orders and civil money penalty assessments.
During the past decade, the bank regulatory agencies have increasingly emphasized the importance of sound risk management processes and strong internal controls when evaluating the activities of the financial institutions they supervise. Properly managing risks has been identified as critical to the conduct of safe and sound banking activities and has become even more important as new technologies, product innovation, and the size and speed of financial transactions have changed the nature of banking markets. The agencies have identified a spectrum of risks facing a banking institution including, but not limited to, credit, market, liquidity, operational, legal, and reputational risk. In particular, recent regulatory pronouncements have focused on operational risk, which arises from the potential that inadequate information systems, operational problems, breaches in internal controls, fraud, or unforeseen catastrophes will result in unexpected losses. New products and services, third-party risk management and cyber-security are critical sources of operational risk that financial institutions are expected to address in the current environment. The Bank is expected to have active board and senior management oversight; adequate policies, procedures, and limits; adequate risk measurement, monitoring, and management information systems; and comprehensive internal controls.
Branching Authority. California banks, such as the Bank, may, under California law, establish a banking office so long as the bank’s board of directors approves the banking office and the DBO is notified of the
133
Table of Contents
establishment of the banking office. Deposit-taking banking offices must be approved by the FDIC, which considers a number of factors, including financial history, capital adequacy, earnings prospects, character of management, needs of the community and consistency with corporate power. The Dodd-Frank Act permits insured state banks to engage in de novo interstate branching if the laws of the state where the new banking office is to be established would permit the establishment of the banking office if it were chartered by such state. Finally, we may also establish banking offices in other states by merging with banks or by purchasing banking offices of other banks in other states, subject to certain restrictions.
Community Reinvestment Act Requirements. The CRA is intended to encourage banks to help meet the credit needs of their entire communities, including low- and moderate-income neighborhoods, consistent with safe and sound operations. The regulators examine banks and assign each bank a public CRA rating. The CRA then requires bank regulators to take into account the bank’s record in meeting the needs of its community when considering certain applications by a bank, including applications to establish a banking center or to conduct certain mergers or acquisitions. The Federal Reserve is required to consider the CRA records of a bank holding company’s controlled banks when considering an application by the bank holding company to acquire a bank or to merge with another bank holding company.
When we apply for regulatory approval to make certain investments, the regulators will consider the CRA record of the target institution and the Bank. An unsatisfactory CRA record could substantially delay approval or result in denial of an application. The Bank received a “satisfactory” rating on its most recent CRA performance evaluation, dated March 18, 2015.
Anti-Money Laundering and Office of Foreign Assets Control Regulation. The Patriot Act, is designed to deny terrorists and criminals the ability to obtain access to the U.S. financial system and has significant implications for depository institutions, brokers, dealers and other businesses involved in the transfer of money. The Patriot Act mandates financial services companies to have policies and procedures with respect to measures designed to address any or all of the following matters: (i) customer identification programs; (ii) money laundering; (iii) terrorist financing; (iv) identifying and reporting suspicious activities and currency transactions; (v) currency crimes; and (vi) cooperation between financial institutions and law enforcement authorities. Regulatory authorities routinely examine financial institutions for compliance with these obligations, and failure of a financial institution to maintain and implement adequate programs to combat money laundering and terrorist financing, or to comply with all of the relevant laws or regulations, could have serious legal and reputational consequences for the institution, including causing applicable bank regulatory authorities not to approve merger or acquisition transactions when regulatory approval is required or to prohibit such transactions even if approval is not required. Regulatory authorities have imposed cease and desist orders and civil money penalties against institutions found to be violating these obligations.
Treasury’s Office of Foreign Assets Control (“OFAC”), administers and enforces economic and trade sanctions against targeted foreign countries and regimes under authority of various laws, including designated foreign countries, nationals and others. OFAC publishes lists of specially designated targets and countries. Financial Institutions are responsible for, among other things, blocking accounts of and transactions with such targets and countries, prohibiting unlicensed trade and financial transactions with them and reporting blocked transactions after their occurrence. Banking regulators examine banks for compliance with the economic sanctions regulations administered by OFAC and failure of a financial institution to maintain and implement adequate OFAC programs, or to comply with all of the relevant laws or regulations, could have serious legal and reputational consequences for the institution. Following a recent examination, the Bank entered into an informal agreement in January 2018 with the FDIC and DBO that requires the Bank to take certain steps and improve processes and training relating to Bank Secrecy Act and Anti-Money Laundering laws and regulations, and to improve its monitoring of high rate deposits. While we do not expect this informal agreement to change our business strategy, our failure to comply with the informal agreement could have a negative impact on our business, including our ability to establish new branches or LPOs.
134
Table of Contents
Concentrations in Commercial Real Estate. Concentration risk exists when financial institutions deploy too many assets to any one industry or segment. Concentration stemming from commercial real estate is one area of regulatory concern. The CRE Concentration Guidance provides supervisory criteria, including the following numerical indicators, to assist bank examiners in identifying banks with potentially significant commercial real estate loan concentrations that may warrant greater supervisory scrutiny: (i) commercial real estate loans exceeding 300% of capital and increasing 50% or more in the preceding three years; or (ii) construction and land development loans exceeding 100% of capital. The CRE Concentration Guidance does not limit banks’ levels of commercial real estate lending activities, but rather guides institutions in developing risk management practices and levels of capital that are commensurate with the level and nature of their commercial real estate concentrations. As of March 31, 2018, using regulatory definitions in the CRE Concentration Guidance, our CRE loans represented 357.1% of our total risk-based capital, as compared to 355.1%, 352.1%, 359.2% and 355.4% as of December 31, 2017, 2016, 2015 and 2014, respectively. We are actively working to manage our CRE concentration and we have discussed the CRE Concentration Guidance with the FDIC and believe that our underwriting policies, management information systems, independent credit administration process, and monitoring of real estate loan concentrations are currently sufficient to address the CRE Concentration Guidance. While the capital raised in this offering will reduce these concentrations in the near term, the FDIC could nevertheless become concerned about our CRE loan concentrations, and they could limit our ability to grow by restricting their approvals for the establishment or acquisition of branches, or approvals of mergers or other acquisition opportunities.
Consumer Financial Services
Banks and other financial institutions are subject to numerous laws and regulations intended to protect consumers in their transactions with banks. These laws include, among others, laws regarding unfair and deceptive acts and practices and usury laws, as well as the following consumer protection statutes: Truth in Lending Act, Truth in Savings Act, Electronic Fund Transfer Act, Expedited Funds Availability Act, Equal Credit Opportunity Act, Fair and Accurate Credit Transactions Act, Fair Housing Act, Fair Credit Reporting Act, Fair Debt Collection Practices Act, Gramm-Leach-Bliley Act, Home Mortgage Disclosure Act, Right to Financial Privacy Act, Servicemembers Civil Relief Act, Military Lending Act and Real Estate Settlement Procedures Act.
Many states and local jurisdictions have consumer protection laws analogous, and in addition, to those listed above. These federal, state and local laws regulate the manner in which financial institutions deal with customers when taking deposits, making loans or conducting other types of transactions. Failure to comply with these laws and regulations could give rise to regulatory sanctions, customer rescission rights, action by state and local attorneys general and civil or criminal liability. Failure to comply with consumer protection requirements may also result in our failure to obtain any required bank regulatory approval for merger or acquisition transactions we may wish to pursue or our prohibition from engaging in such transactions even if approval is not required.
The structure of federal consumer protection regulation applicable to all providers of consumer financial products and services changed significantly on July 21, 2011, when the CFPB commenced operations to supervise and enforce consumer protection laws. The consumer protection provisions of the Dodd-Frank Act and the examination, supervision and enforcement of those laws and implementing regulations by the CFPB have created a more intense and complex environment for consumer finance regulation. The CFPB has significant authority to implement and enforce federal consumer protection laws and new requirements for financial services products provided for in the Dodd-Frank Act, as well as the authority to identify and prohibit unfair, deceptive or abusive acts and practices. The review of products and practices to prevent such acts and practices is a continuing focus of the CFPB, and of banking regulators more broadly. The ultimate impact of this heightened scrutiny is uncertain but could result in changes to pricing, practices, products and procedures. It could also result in increased costs related to regulatory oversight, supervision and examination, additional remediation efforts and possible penalties. In addition, the Dodd-Frank Act provides the CFPB with broad supervisory, examination and enforcement authority over various consumer financial products and services, including the ability to require
135
Table of Contents
reimbursements and other payments to customers for alleged legal violations and to impose significant penalties, as well as injunctive relief that prohibits lenders from engaging in allegedly unlawful practices. The CFPB also has the authority to obtain cease and desist orders providing for affirmative relief or monetary penalties. The Dodd-Frank Act does not prevent states from adopting stricter consumer protection standards. State regulation of financial products and potential enforcement actions could also adversely affect our business, financial condition or results of operations.
The CFPB is authorized to issue rules for both bank and nonbank companies that offer consumer financial products and services, subject to consultation with the prudential banking regulators. In general, however, banks with assets of $10 billion or less, such as the Bank, will continue to be examined for consumer compliance by their primary bank regulator.
Mortgage and Mortgage-Related Products, Generally. Because abuses in connection with residential mortgages were a significant factor contributing to the financial crisis, many new rules issued by the CFPB and required by the Dodd-Frank Act address mortgage and mortgage-related products, their underwriting, origination, servicing and sales. The Dodd-Frank Act significantly expanded underwriting requirements applicable to loans secured by 1-4 family residential real property and augmented federal law combating predatory lending practices. In addition to numerous disclosure requirements, the Dodd-Frank Act imposed new standards for mortgage loan originations on all lenders, including banks and savings associations, in an effort to strongly encourage lenders to verify a borrower’s ability to repay, while also establishing a presumption of compliance for certain “qualified mortgages.” The Dodd-Frank Act generally required lenders or securitizers to retain an economic interest in the credit risk relating to loans that the lender sells, and other asset-backed securities that the securitizer issues, if the loans do not comply with the ability-to-repay standards described below. The risk retention requirement generally is 5%, but could be increased or decreased by regulation. The CFPB’s mortgage rules have not had a significant impact on the Bank’s operations, except for higher compliance costs.
Ability-to-Repay Requirement and Qualified Mortgage Rule. On January 10, 2013, the CFPB issued a final rule implementing the Dodd-Frank Act’s ability-to-repay requirements. Under the final rule, lenders, in assessing a borrower’s ability to repay a mortgage-related obligation, must consider eight underwriting factors: (i) current or reasonably expected income or assets; (ii) current employment status; (iii) monthly payment on the subject transaction; (iv) monthly payment on any simultaneous loan; (v) monthly payment for all mortgage-related obligations; (vi) current debt obligations, alimony, and child support; (vii) monthly debt-to-income ratio or residual income; and (viii) credit history. The final rule also includes guidance regarding the application of, and methodology for evaluating, these factors.
Further, the final rule clarified that qualified mortgages do not include “no-doc” loans and loans with negative amortization, interest-only payments, balloon payments, terms in excess of 30 years, or points and fees paid by the borrower that exceed 3% of the loan amount, subject to certain exceptions. In addition, for qualified mortgages, the rule mandated that the monthly payment be calculated on the highest payment that will occur in the first five years of the loan, and required that the borrower’s total debt-to-income ratio generally may not be more than 43%. The final rule also provided that certain mortgages that satisfy the general product feature requirements for qualified mortgages and that also satisfy the underwriting requirements of Fannie Mae and Freddie Mac (while they operate under federal conservatorship or receivership), HUD, the Department of Veterans Affairs, the Department of Agriculture or the Rural Housing Service are also considered to be qualified mortgages. This second category of qualified mortgages will phase out as the aforementioned federal agencies issue their own rules regarding qualified mortgages and the conservatorship of Fannie Mae and Freddie Mac ends, and, in any event, will sunset in January 2021.
As set forth in the Dodd-Frank Act, subprime (or higher-priced) mortgage loans are subject to the ability-to-repay requirement, and the final rule provided for a rebuttable presumption of lender compliance for those loans. The final rule also applied the ability-to-repay requirement to prime loans, while also providing a conclusive presumption of compliance (i.e., a safe harbor) for prime loans that are also qualified mortgages.
136
Table of Contents
Additionally, the final rule generally prohibits prepayment penalties (subject to certain exceptions) and sets forth a 3-year record retention period with respect to documenting and demonstrating the ability-to-repay requirement and other provisions.
Mortgage Loan Originator Compensation. As a part of the overhaul of mortgage origination practices, mortgage loan originators’ compensation has been limited such that they may no longer receive compensation based on a mortgage transaction’s terms or conditions other than the amount of credit extended under the mortgage loan. Further, the total points and fees that a bank and/or a broker may charge on conforming and jumbo loans has been limited to 3.0% of the total loan amount. Mortgage loan originators may receive compensation from a consumer or from a lender, but not both. These rules contain requirements designed to prohibit mortgage loan originators from “steering” consumers to loans that provide mortgage loan originators with greater compensation. In addition, the rules contain other requirements concerning recordkeeping.
Residential Mortgage Servicing. Pursuant to the Dodd-Frank Act, the CFPB has implemented certain provisions of the Dodd-Frank Act relating to mortgage servicing through rulemaking. The servicing rules require servicers to meet certain benchmarks for loan servicing and customer service in general. Servicers must provide periodic billing statements and certain required notices and acknowledgments, promptly credit borrowers’ accounts for payments received and promptly investigate complaints by borrowers. Servicers also are required to take additional steps before purchasing insurance to protect the lender’s interest in the property. The servicing rules call for additional notice, review and timing requirements with respect to delinquent borrowers, including early intervention, ongoing access to servicer personnel and specific loss mitigation and foreclosure procedures. The rules provide for an exemption from most of these requirements for “small servicers,” which are defined as loan servicers that service 5,000 or fewer mortgage loans and service only mortgage loans that they or an affiliate originated or own.
Incentive Compensation Guidance
In 2010, the federal bank regulatory agencies issued comprehensive guidance intended to ensure that the incentive compensation policies of banking organizations do not undermine the safety and soundness of those organizations by encouraging excessive risk-taking. The incentive compensation guidance sets expectations for banking organizations concerning their incentive compensation arrangements and related risk-management, control and governance processes. The incentive compensation guidance, which covers all employees that have the ability to materially affect the risk profile of an organization, either individually or as part of a group, is based upon three primary principles: (1) balanced risk-taking incentives; (2) compatibility with effective controls and risk management; and (3) strong corporate governance. Any deficiencies in compensation practices that are identified may be incorporated into the organization’s supervisory ratings, which can affect its ability to make acquisitions or take other actions. In addition, under the incentive compensation guidance, a banking organization’s federal supervisor may initiate enforcement action if the organization’s incentive compensation arrangements pose a risk to the safety and soundness of the organization.
In 2016, several federal financial agencies (including the Federal Reserve and FDIC) re-proposed restrictions on incentive-based compensation pursuant to Section 956 of the Dodd-Frank Act for financial institutions with $1 billion or more in total consolidated assets. For institutions with at least $1 billion but less than $50 billion in total consolidated assets, the proposal would impose principles-based restrictions that are broadly consistent with existing interagency guidance on incentive-based compensation. Such institutions would be prohibited from entering into incentive compensation arrangements that encourage inappropriate risks by the institution (i) by providing an executive officer, employee, director, or principal shareholder with excessive compensation, fees, or benefits, or (ii) that could lead to material financial loss to the institution. The comment period for these proposed regulations has closed, but a final rule has not been published. Depending upon the outcome of the rule making process, the application of this rule to us could require us to revise our compensation strategy, increase our administrative costs and adversely affect our ability to recruit and retain qualified employees.
137
Table of Contents
Further, as discussed above, the Basel III Capital Rules limit discretionary bonus payments to bank executives if the institution’s regulatory capital ratios fail to exceed certain thresholds that started being phased in on January 1, 2016. See “—Regulatory Capital Requirements” above.
The scope and content of the U.S. banking regulators’ policies on executive compensation are continuing to develop and are likely to continue evolving in the near future.
Enforcement Powers of Federal and State Banking Agencies
The federal bank regulatory agencies have broad enforcement powers, including the power to terminate deposit insurance, impose substantial fines and other civil and criminal penalties, and appoint a conservator or receiver for financial institutions. Failure to comply with applicable laws and regulations could subject us and our officers and directors to administrative sanctions and potentially substantial civil money penalties. The DBO also has broad enforcement powers over us, including the power to impose orders, remove officers and directors, impose fines and appoint supervisors and conservators.
Financial Privacy
The federal bank regulatory agencies have adopted rules that limit the ability of banks and other financial institutions to disclose non-public information about consumers to non-affiliated third-parties. These limitations require disclosure of privacy policies to consumers and, in some circumstances, allow consumers to prevent disclosure of certain personal information to a non-affiliated third-party. These regulations affect how consumer information is transmitted through financial services companies and conveyed to outside vendors. In addition, consumers may also prevent disclosure of certain information among affiliated companies that is assembled or used to determine eligibility for a product or service, such as that shown on consumer credit reports and asset and income information from applications. Consumers also have the option to direct banks and other financial institutions not to share information about transactions and experiences with affiliated companies for the purpose of marketing products or services.
Monetary Policy
The monetary policy of the Federal Reserve has a significant effect on the operating results of financial or bank holding companies and their subsidiaries. Among the tools available to the Federal Reserve to affect the money supply are open market transactions in U.S. government securities, changes in the discount rate on member bank borrowings and changes in reserve requirements against member bank deposits. These means are used in varying combinations to influence overall growth and distribution of bank loans, investments and deposits, and their use may affect interest rates charged on loans or paid on deposits.
The Volcker Rule
The Volcker Rule generally prohibits banking entities, such as the Bank, the Company and their affiliates and subsidiaries, from engaging in short-term proprietary trading of financial instruments and from owning, sponsoring or having certain relationships with hedge funds or private equity funds (collectively, “covered funds”). The regulations implementing the Volcker Rule provide exemptions for certain activities, including market making, underwriting, hedging, trading in certain government obligations and organizing and offering a covered fund, among others.
Although the Volcker Rule has significant implications for many large financial institutions, it does not currently have a material effect on the operations of the Company or the Bank. The Company and the Bank may, however, incur costs if they are required to adopt additional policies and systems to ensure compliance with certain provisions of the Volcker Rule in the future.
138
Table of Contents
The following table sets forth certain information regarding our executive officers as of the date of this prospectus.
| Name |
Age | Position | ||
| Henry Kim |
51 | President, Chief Executive Officer | ||
| Timothy Chang |
49 | Executive Vice President, Chief Financial Officer | ||
| Andrew Chung |
55 | Executive Vice President, Chief Risk Officer | ||
| Brian Bang |
44 | Senior Vice President, Chief Credit Officer | ||
| John Ju |
43 | Senior Vice President, Chief Lending Officer | ||
| Justin Chon |
47 | Senior Vice President, Chief Consumer Lending Officer | ||
| Mimi Lee |
50 | Senior Vice President, Chief Operations Administrator |
Henry Kim. Mr. Kim was named President and Chief Executive Officer of the Company and the Bank in January 2018 and has served as an executive officer of the Bank since its formation in September 2003. He also became a member of the Company and the Bank’s boards of directors on January 1, 2018. During his 15-plus year tenure with the Bank, Mr. Kim has held the executive positions of Chief Credit Officer from 2003 to 2017, Chief Operating Officer from 2014 to 2017, and Corporate Secretary of the Bank from 2004 to 2016, and he was the Corporate Secretary of the Company from 2007 to 2017. Prior to joining the Bank, Mr. Kim served as First Vice President and Senior Loan Officer and Commercial Loan Center Manager at former Wilshire Bank from 2001 to 2003. Prior to joining Wilshire Bank, he served in various lending positions with Hanmi Bank including Senior Loan Officer from 1992 to 2001 and with former Center Bank from 1990 to 1992. Mr. Kim is a graduate of University of California Santa Barbara and a graduate of Pacific Coast Banking School.
Timothy Chang. Mr. Chang serves as the Executive Vice President, Chief Financial Officer and Corporate Secretary of the Company and the Bank. Mr. Chang has served as the Chief Financial Officer of the Company and the Bank since he joined us in 2010. In this role, he oversees all aspects of financial reporting including strategic planning, asset/liability management, taxation and regulatory filings. Mr. Chang has over 18 years of commercial banking experience. Prior to joining us, Mr. Chang served as the Executive Vice President and Chief Financial Officer of Mirae Bank, the Senior Vice President and Chief Planning Officer of Hanmi Bank, and the Senior Vice President, Chief Financial Officer and Treasurer of Nara Bank. Mr. Chang is a Certified Public Accountant (inactive) and holds a Bachelor’s Degree in Economics from University of California, Los Angeles.
Andrew Chung. Mr. Chung was appointed Executive Vice President and Chief Risk Officer of the Bank in April 2018. He has over 25 years of experience in banking and financial services. Prior to joining the Bank in April 2018, he served as Executive Vice President and Chief Financial Officer of Uniti Financial Corporation and Uniti Bank from November 2013 to April 2018, Senior Vice President and Controller of Wilshire Bank from July 2011 to October 2013, and Senior Vice President and Chief Financial Officer of the Bank from October 2005 to April 2010. Mr. Chung is a Certified Public Accountant (inactive) and earned his Master of Business Administration from the Marshall School of Business, University of Southern California and Bachelor of Science in Business Administration from California State University, Los Angeles.
Brian Bang. Mr. Bang serves as the Senior Vice President and Chief Credit Officer of the Bank. He joined the Bank in 2005 and served as Senior Vice President & Deputy Chief Credit Officer since 2014 before assuming his current role in January 2018. Prior to 2014, Mr. Bang served as Senior Loan Officer and Credit Administration Manager. Mr. Bang also held loan officer positions in other Korean-American banks in Southern California. He has extensive experience in community banking as commercial, consumer, SBA lender and credit administrator. Mr. Bang received his Bachelor’s Degree in Business Administration from California State University, Fullerton. He also graduated from Pacific Coast Banking School, in partnership with the Graduate School of Business at the University of Washington.
139
Table of Contents
John Ju. Mr. Ju serves as the Senior Vice President and Chief Lending Officer of the Bank. He has held this position since 2015. His primary responsibilities include managing the SBA department and the ten LPOs throughout the U.S. Specifically, he is responsible for overseeing marketing, underwriting, documentation and closing of all SBA loans. Prior to this position, he served as the SBA Manager for the Bank since 2007 when he joined the Bank. Mr. Ju has also held positions of credit administrator, loan officer, senior credit analyst, and deputy manager at various other banks over his 20-year banking career.
Justin Chon. Mr. Chon has served as Senior Vice President and Chief Consumer Lending Officer of the Bank since 2011. He has over 20 years of successful experience in community banks primarily focusing on consumer loans including Residential property loan and automobile loan. He manages all lending activities of Residential Mortgage Center and Automobile Loan Department. Mr. Chon joined the Bank in 2004 as the First Vice President and manager of automobile lending division. Prior to 2004, Mr. Chon served as the First Vice President and manager of Consumer Loan Department at Hanmi Bank. Mr. Chon graduated with a Bachelor of Science Degree in Accounting from California State University, Northridge.
Mimi Lee. Ms. Lee serves as Senior Vice President and Chief Operations Administrator for the Bank. Ms. Lee has served in this role since 2013. From 2005 to 2013, Ms. Lee served as Senior Vice President and Operations Administrator of the Bank. In her current role, she oversees all aspects of branch operations including centralized back-office operations. She brings a wide range of skills and in-depth knowledge in product development, system implementation and process enhancement and looks to provide strong operations management at Bank. Ms. Lee has over 26 years of experience in bank operations. Prior to joining us, Ms. Lee served as the First Vice President and Operations Administrator and First Vice President and Branch Operations Officer at Wilshire Bank and Vice President and Operations Administrator at Hanmi Bank. Ms. Lee graduated with a Bachelor’s Degree from University of California, Santa Barbara.
Board of Directors
Our board of directors currently consists of 8 members, all of whom are elected annually at the annual meeting of shareholders and serve one-year terms, until their successors are duly elected and qualified. Pursuant to our bylaws, our board of directors is authorized to have a range of between five and nine directors, unless changed by resolution of our board of directors. Our directors are not required to be a shareholder of the Company in order to qualify to serve as a director. All directors of the Company except Don Rhee and Suk Won Youn also serve as directors of the Bank. Sarah Jun and Daniel Cho serve as directors of the Bank, but not of the Company. As discussed in greater detail below, our board of directors has affirmatively determined that six of our eight current directors qualify as independent directors based upon the rules of the Nasdaq and the SEC. There are no arrangements or understandings between any of the directors and any other person pursuant to which he or she was selected as a director.
The following table sets forth certain summary information about our current directors, including their names, ages, and year in which they began serving as a director and committee memberships. No current director has any family relationship, as defined in Item 401 of Regulation S-K, with any other director or with any of our executive officers.
| Committee Membership | ||||||||||||||
| Name |
Age | Directors Since |
Audit |
Compensation |
Nominating & | |||||||||
| Henry Kim, President & CEO |
51 | 2018 | ||||||||||||
| Kijun Ahn, Ph.D. |
62 | 2007 | (1) | Member | Chair | |||||||||
| Kwang Jin Chung |
71 | 2007 | Member | Member | ||||||||||
| Sang Young Lee, Chairman |
67 | 2007 | Chair | |||||||||||
| Suk Won Youn |
70 | 2007 | Member | |||||||||||
| Haeyoung Cho |
63 | 2011 | ||||||||||||
| Daniel H. Park, CPA |
59 | 2015 | Chair(2) | |||||||||||
| Don Rhee |
62 | 2015 | Member | Member | ||||||||||
140
Table of Contents
| (1) | Dr. Ahn has been a director for the Company since 2007, except the year of 2014. |
| (2) | Mr. Park serves as the Audit Committee financial expert. |
None of the Company’s directors is a director of any other company with a class of securities registered pursuant to Section 12 of the Exchange Act, or subject to the requirements of Section 15(d) of such Act or any company registered as an investment company under the Investment Company Act of 1940, whose common stock is registered pursuant to Section 12 of the Exchange Act.
The business experience of each of the current directors is set forth below.
Kijun Ahn, Ph.D. As one of the founding board members of the Bank, Dr. Ahn has extensive knowledge and experience in the fields of civil engineering and construction and provides the board with valuable insights with regards to the Bank customers and issues involving these industries since 1990. Dr. Ahn is currently a project manager at Moffatt and Nichol, a global infrastructure advisory firm that specializes in structural, coastal, and civil engineering; environmental sciences; economics analysis; inspection & rehabilitation; and program management solutions. Throughout his 30 plus years of experience in the construction and development field, Dr. Ahn has managed many major projects, including public infrastructure projects in the state of California and Hawaii. Dr. Ahn earned his B.S. degree from Seoul National University in Korea and Ph. D. in Civil Engineering from Washington University in St. Louis, Missouri.
Kwang Jin Chung. As one of the founding board members of the Bank, Mr. Chung brings several decades of successful business management experience to the board, especially in the wholesale trade industry. Mr. Chung is now retired, having served as President and Chief Executive Officer of Kei Trading Co., Inc. since 1983. Kei Trading Co., Inc. is a Los Angeles based wholesale distribution company that specializes in various consumer electronic appliances. Prior to Kei, Mr. Chung founded and successfully operated numerous business ventures that specialized in import, export, and wholesale distribution of consumer electronic products. Mr. Chung also served as the President and Chief Executive Officer of Otron International, a subsidiary of Olympus Electronics Company, a manufacturer of consumer electronic products in South Korea. Mr. Chung has served as the Chairman of both the Company and the Bank between 2006 and 2009 and again between 2015 and 2017. Mr. Chung earned his B.A. degree in Sociology from Korea University in Seoul, Korea.
Sang Young Lee. Mr. Lee is one of the founding board members of the Bank and the current Chairman of the board of the Company and the Bank. Mr. Lee is the President and Chief Executive Officer of Lee’s Gold and Diamonds, Inc. since 1988. Founded in 1988, Lee’s Gold and Diamonds, Inc. specializes in wholesale distribution of various jewelry products in the greater Los Angeles area. Mr. Lee provides the board with extensive insight into the trade industry and also possesses the business acumen and knowledge of the economic environment in in that industry which is a tremendous asset to the board. Mr. Lee had also previously served as the Chairman of the board of Company and Bank from 2009 to 2012. Mr. Lee earned his B.A. degree in law from Han Yang University and an MBA in International Trade from Korea University in Seoul, Korea.
Suk Won Youn. Mr. Youn has served as a member of the board of directors of the Bank since 2005 and the Company since its formation in 2007. He also served as the chairman of both the Company and the Bank from 2012 to 2014. Mr. Youn is the founder, President and Chief Executive Officer of Unique Spectronix, Inc. (“USI”), an Irvine, California-based company. Founded in 1983, USI facilitates R&D, sourcing, procurement and liaison services for appliance conglomerates headquartered in Korea as well as appliance OEM’s in the U.S. Mr. Youn also serves as the Chief Financial Officer of Kkottongnae, a worldwide Catholic Charitable Organization, which attends to the needs and hopes of the abandoned and neglected of society. Mr. Youn conducted various fundraisers that eventually led to the launching of additional Kkottongnae facilities in various locations, including Lynwood and Temecula, California, New Jersey, New Jersey, Atlanta, Georgia, Toronto, Canada and Haiti. Mr. Youn was a student of the Hankuk University of Foreign Studies in 1966 and in 2009 was awarded the Global Award by the Alumni Association. Mr. Youn was a member of the inaugural class of Los Angeles Executive MBA of Hankuk University of Foreign Studies and served as its first Chairman in 2008. As a member of the board of directors since 2005, Mr. Youn provides the board with invaluable guidance and
141
Table of Contents
leadership in the areas of business and financial strategies with his vast knowledge of domestic and international commerce. He also possesses significant insight into the local business and philanthropic community where the Bank operates.
Haeyoung Cho. Ms. Cho was the President and Chief Executive Officer of the Company and the Bank from October 2011 until her retirement in December 2017. She also served as President and Chief Operating Officer from May 2010 to September 2011, Executive Vice President and Chief Operating Officer of the Bank from January 2006 to April 2010, and Executive Vice President and Chief Portfolio Officer of the Bank from September 2003 to December 2005. Ms. Cho is one of the founding executives of the Bank and played an instrumental role in successfully navigating the institution through the financial crisis and growing the Bank into an institution with over a billion dollars in assets. Ms. Cho earned her B.A. degree in business administration from Duksung University in Seoul, Korea and a Master’s degree in business administration from University of Phoenix. Ms. Cho also attended the Graduate School of Banking at Colorado in Denver, Colorado. Ms. Cho began her banking career in 1983 at one of the original Korean-American banks that has since merged into Hanmi Bank and brings over 35 years of Korean-American community banking experience to the board.
Daniel Park. Mr. Park began serving as a board member of both the Company and the Bank in 2015. He is a Certified Public Accountant and a managing partner of KNP, LLP, a greater Los Angeles-based accounting firm where he serves both international and domestic middle market companies since April 2017. Prior to that, Mr. Park was a partner of CKP, LLP from 2012 to 2017. Mr. Park brings over 30 years of business and accounting experience to the board, having previously served with such prestigious accounting firms as Ernst & Young, Arthur Andersen, PwC, Deloitte & Touche, and also served as the Chief Financial Officer of several private companies. Mr. Park’s in-depth knowledge of accounting principles and auditing standards generally accepted in the U.S., as well as his valuable prospective on various industries is a tremendous asset to the board. Mr. Park is currently a member of AICPA and the California CPA Society. He has also served over 10 years on the Board of Governors at City Club Los Angeles. Mr. Park earned his B.A. degree in Economics and Business from University of California at Los Angeles.
Don Rhee. Mr. Rhee began serving as a director of the Company in 2015. Mr. Rhee founded Active USA, Inc., a Los Angeles-based apparel manufacturer in 1988, and currently serves as the President and Chief Executive Officer. Mr. Rhee is a prominent leader in the Korean-American apparel business owners’ community, becoming the President of San Pedro Fashion Mart Association in 2013 and CEO of The World Korean Business Convention in 2015. Mr. Rhee was a director at Saehan Bancorp from 1999 to 2011. Saehan Bancorp merged into a bank that eventually became part of Bank of Hope. Mr. Rhee has extensive experience in the apparel manufacturing industry and a deep understanding of commercial customers’ banking needs. Mr. Rhee earned his B.S. in Architecture and an honorary doctorate in business administration from Yeungnam University in Korea.
Corporate Governance Principles and Board Matters
Corporate Governance Guidelines
We are committed to having sound corporate governance principles, which are essential to running our business efficiently and maintaining our integrity in the marketplace. Our board of directors has adopted Corporate Governance Guidelines, which set forth the framework within which our board of directors, assisted by the committees of our board of directors, oversees the affairs of our organization. The Corporate Governance Guidelines address, among other things, the composition and functions of our board of directors, director independence, compensation of directors, management succession and review, committees of our board of directors and selection of new directors. Upon completion of this offering, our Corporate Governance Guidelines will be available on our website at www.paccitybank.com under the “Investor Relations” tab.
Director Qualifications
We believe that our directors should have the highest professional and personal ethics and values. They should have broad experience at the policy-making level in business, government or banking. They should be committed
142
Table of Contents
to enhancing shareholder value and should have sufficient time to carry out their duties and to provide insight and practical wisdom based on experience. Their service on boards of other companies should be limited to a number that permits them, given their individual circumstances, to perform responsibly all director duties. Each director must represent the interests of all shareholders. When considering potential director candidates, our board of directors also considers the candidate’s character, judgment, diversity, skill-sets, specific business background and global or international experience in the context of our needs and those of the board of directors.
Director Independence
We have applied to list our common stock on the Nasdaq Global Market and, as a result, we will be required to comply with the rules of Nasdaq with respect to the independence of directors who serve on our board of directors and its committees. Under the rules of Nasdaq, independent directors must comprise a majority of our board of directors within a specified period of time following this offering. The rules of Nasdaq, as well as those of the SEC, also impose several other requirements with respect to the independence of our directors.
Our board of directors has evaluated the independence of its members based upon the rules of Nasdaq and the SEC. Applying these standards, our board of directors has affirmatively determined that six of the eight directors qualify as independent directors: Kijun Ahn, Kwang Jin Chung, Sang Young Lee, Suk Won Youn, Daniel H. Park, and Don Rhee. Haeyoung Cho and Henry Kim do not qualify as independent directors because each individual is an executive officer of the Company and/or the Bank, or has served in such capacity within the three year look-back period.
In addition, our corporate governance guidelines require that the positions of Chairman of the board of directors and the Chief Executive Officer of the Company be held by different individuals and that the Chairman satisfy the requirements for an independent director under the Nasdaq rules.
Code of Ethics and Business Conduct
Our board of directors has adopted a Code of Ethics and Business Conduct, which became effective September 22, 2016 and undergoes periodic review and revision. This code applies to all of our directors and employees. The code provides fundamental ethical principles to which these individuals are expected to adhere to and will operate as a tool to help our directors, officers and employees understand the high ethical standards required for employment by, or association with, the Company. Our Code of Ethics and Business Conduct, upon the completion of this offering, will be available on our website at www.paccitybank.com under the “Investor Relations” tab. We expect that any amendments to the code, or any waivers of its requirements, will be disclosed on our website, as well as any other means required by Nasdaq.
Compensation Committee Interlocks and Insider Participation.
No member of our Compensation Committee (i) is or has ever been an employee of ours, (ii) was, during the last completed fiscal year, a participant in any related party transaction requiring disclosure under “Certain Relationships and Related Party Transactions,” except with respects to loans made to such committee members in the ordinary course of business on substantially the same terms as those prevailing at the time for comparable transactions with unrelated parties or (iii) had, during the last completed fiscal year, any other interlocking relationship requiring disclosure under applicable SEC rules.
Risk Management and Oversight.
Our board of directors oversees our risk management process, which is a company-wide approach to risk management that is carried out by our management. Our full board of directors determines the appropriate risk for us generally, assesses the specific risks faced by us, and reviews the steps taken by management to manage those risks. While our full board of directors maintains the ultimate oversight responsibility for the risk management process, its committees oversee risk within their particular area of concern. In particular, our
143
Table of Contents
Compensation Committee is responsible for overseeing the management of risks relating to our executive compensation plans and arrangements, and the incentives created by the compensation awards it administers. Our Audit Committee is responsible for overseeing the management of risks associated with, among other things, internal controls and financial reporting. Our Nominating and Governance Committee oversees risks related to the nominees for election as directors, the functioning of our standing committees, related party transactions, and the compliance with our corporate governance guidelines. Our board of directors monitors capital adequacy in relation to risk. Pursuant to our board of directors’ instruction, management regularly reports on applicable risks to the relevant committee or the full board, as appropriate, with additional review or reporting on risks conducted as needed or as requested by our board of directors and its committees.
Board Committees
Our board of directors currently has three (3) standing committees: an Audit Committee, a Compensation Committee, and a Nominating and Governance Committee. Each committee is comprised solely of directors that meet the definition of “independent director” under the Nasdaq rules, and each member of the audit committee is independent under applicable SEC rules. Each of the committees of the board of directors meets at such times as determined to be necessary.
Our board of directors also may establish such other committees as it deems appropriate, in accordance with applicable law and regulations and our articles and bylaws.
We are not considered a “controlled company” within the meaning of the corporate governance standards of Nasdaq.
Audit Committee
Our Audit Committee currently consists of Daniel Park (Chairperson), Kijun Ahn, and Don Rhee. Our board of directors has affirmatively determined that each member of the Audit Committee also satisfies the additional independence standards under the Nasdaq rules and applicable SEC rules for audit committee service and has the ability to read and understand fundamental financial statements. In addition, our board has determined that Daniel H. Park, CPA qualifies as an “audit committee financial expert,” as that term is defined under the applicable SEC rules.
Our Audit Committee has adopted a written charter, which sets forth the committee’s duties and responsibilities. The current charter of the Audit Committee will be available on our website at www.paccitybank.com upon completion of this offering. As described in its charter, our Audit Committee has responsibility for, among other things:
| • | selecting and reviewing the performance of our independent auditors and approving, in advance, all engagements and fee arrangements; |
| • | reviewing the independence of our independent auditors; |
| • | reviewing actions by management on recommendations of the independent auditors and internal auditors; |
| • | meeting with management, the internal auditors and the independent auditors to review the effectiveness of our system of internal control and internal audit procedures and results; |
| • | reviewing earnings releases, financial statements and reports to be filed with the SEC or otherwise; |
| • | reviewing and approving transactions for potential conflicts of interest under our Code of Ethics and Business Conduct; and |
| • | preparing an audit committee report and handling other such matters that are specifically delegated to the Audit Committee by our board of directors from time to time. |
Compensation Committee.
Our Compensation Committee currently consists of Kijun Ahn (Chairperson), Kwang Jin Chung and Don Rhee.
144
Table of Contents
Our Compensation Committee has adopted a written charter, which sets forth the committee’s duties and responsibilities. The current charter of the Compensation Committee will be available on our website at www.paccitybank.com upon completion of this offering. As described in its charter, our Compensation Committee has responsibility for, among other things:
| • | reviewing, monitoring and approving our overall compensation structure, policies and programs (including benefit plans) and assessing whether the compensation structure establishes appropriate incentives for our executive officers and other employees and meets our corporate objectives; |
| • | determining the annual compensation of our Chief Executive Officer; |
| • | establishing subjective and objective criteria to serve as the basis for other executive officers’ compensation and reviewing the compensation decisions made by our Chief Executive Officer with respect to our other named executive officers; |
| • | reviewing the talent development and executive succession planning process with our Chief Executive Officer; |
| • | overseeing the administration of our equity plans and other incentive compensation plans and programs and preparing recommendations and periodic reports to our board of directors relating to these matters; |
| • | preparing the Compensation Committee report required by SEC rules to be included in our annual report; and |
| • | handling such other matters that are specifically delegated to the Compensation Committee by our board of directors from time to time. |
Nominating and Governance Committee.
Our Nominating and Governance Committee currently consists of Sang Young Lee (Chairperson), Kwang Jin Chung and Suk Won Youn.
Our Nominating and Governance Committee has adopted a written charter, which sets forth the committee’s duties and responsibilities. The current charter of the Nominating and Governance Committee will be available on our website at www.paccitybank.com upon completion of this offering. As described in its charter, our Nominating and Governance Committee has responsibility for, among other things:
| • | recommending persons to be selected by our board of directors as nominees for election as directors or to fill any vacancies on our board of directors; |
| • | monitoring the functioning of our standing committees and recommending any changes, including the creation or elimination of any committee; |
| • | conducting annual performance evaluations of the Board, including through requests and comments from all directors of the Board; |
| • | developing, reviewing and monitoring compliance with our corporate governance guidelines, requirements of applicable laws, regulations, the Nasdaq rules, the Sarbanes-Oxley Act, and other federal banking laws; |
| • | reviewing annually the composition of our board of directors and committees as a whole and making recommendations on the qualifications, independence, structure, and reporting of the same; |
| • | reviewing Company’s shareholder proposals properly submitted, including any proposed amendments to our articles of incorporation or bylaws; and |
| • | handling such other matters that are specifically delegated to the Nominating and Governance Committee by our board of directors from time to time. |
The information contained on our website is not a part of, or incorporated by reference into, this prospectus.
145
Table of Contents
As an emerging growth company under the JOBS Act, we have opted to comply with the executive compensation disclosure rules applicable to “smaller reporting companies” as such term is defined in the rules promulgated under the Securities Act, which permit us to limit reporting of executive compensation to our principal executive officer and our two other most highly compensated executive officers, which are referred to as our “named executive officers.”
The compensation reported in the Summary Compensation Table below is not necessarily indicative of how we will compensate our named executive officers in the future. We will continue to review, evaluate and modify our compensation framework to maintain a competitive total compensation package. As such, and as a result of our becoming a publicly traded company, the compensation program following this offering could vary from our historical practices.
Our named executive officers for 2017, which consist of our principal executive officer, our former principal executive officer, our principal financial officer and the other most highly compensated executive officer, are:
| • | Henry Kim, President and Chief Executive Officer |
| • | Haeyoung Cho, former President and Chief Executive Officer |
| • | Timothy Chang, Executive Vice President and Chief Financial Officer |
| • | Brian Bang, Senior Vice President and Chief Credit Officer |
Summary Compensation Table
The following table sets forth information regarding the compensation paid, awarded to, or earned for our fiscal years ended December 31, 2017 and 2016 for each of our named executive officers. All compensation is paid by the Bank.
| Name |
Year | Salary | Bonus | Option Awards(1) |
All Other Compensation(2) |
Total | ||||||||||||||||||
| Henry Kim(3) |
2017 | $ | 255,485 | $ | 221,459 | $ | — | $ | 35,893 | $ | 512,837 | |||||||||||||
| President and Chief Executive Officer |
2016 | 242,318 | 200,834 | — | 32,977 | 476,129 | ||||||||||||||||||
| Haeyoung Cho(4) |
2017 | 338,596 | 288,750 | — | 44,580 | 671,926 | ||||||||||||||||||
| Former President and Chief Executive Officer |
2016 | 312,347 | 301,250 | — | 42,538 | 656,135 | ||||||||||||||||||
| Timothy Chang |
2017 | 201,286 | 116,906 | — | 31,124 | 349,316 | ||||||||||||||||||
| Executive Vice President and Chief Financial Officer |
2016 | 194,800 | 101,414 | — | 30,998 | 327,212 | ||||||||||||||||||
| Brian Bang |
2017 | 117,117 | 32,000 | 11,430 | 160,547 | |||||||||||||||||||
| Senior Vice President and Chief Credit Officer |
2016 | 108,286 | 29,107 | — | 10,994 | 148,387 | ||||||||||||||||||
| (1) | The amounts set forth in the “Option Awards” column reflect the aggregate grant date fair value of option awards for the years ended December 31, 2017 and 2016 calculated in accordance with FASB ASC Topic 718. The fair market value of shares was determined by the board of directors. The assumptions used in calculating the option award amounts are set forth in Note 11 to our consolidated financial statements as of December 31, 2017 and 2016 and for each of the years in the three-year period ended December 31, 2017. |
| (2) | “All Other Compensation” for the named executive officers during fiscal 2017 and 2016 is summarized below. |
146
Table of Contents
| 2017 |
Auto Allowance |
Company 401(k) Match(i) |
Cellphone Reimbursement |
Club Dues | Total “All Other Compensation” |
|||||||||||||||
| Henry Kim |
$ | 15,766 | $ | 15,329 | $ | 1,128 | $ | 3,670 | $ | 35,893 | ||||||||||
| Haeyoung Cho |
13,918 | 18,000 | 782 | $ | 11,880 | 44,580 | ||||||||||||||
| Timothy Chang |
17,847 | 12,077 | 1,200 | — | 31,124 | |||||||||||||||
| Brian Bang |
10,800 | — | 630 | — | 11,430 | |||||||||||||||
| 2016 |
Auto Allowance |
401k matching |
Cellphone reimbursement |
Club Dues | Total “ All Other Compensation” |
|||||||||||||||
| Henry Kim |
$ | 14,840 | $ | 13,500 | $ | 1,100 | $ | 3,537 | $ | 32,977 | ||||||||||
| Haeyoung Cho |
13,219 | 18,000 | 1,841 | $ | 9,478 | 42,538 | ||||||||||||||
| Timothy Chang |
16,398 | 13,500 | 1,100 | — | 30,998 | |||||||||||||||
| Brian Bang |
10,154 | — | 840 | — | 10,994 | |||||||||||||||
| (i) | Amount reflects Company matching contribution under the 401(k) Plan. |
| (3) | Henry Kim was promoted to President and Chief Executive Officer effective January 1, 2018. Prior to that date, Mr. Kim served as Senior Executive Vice President, Chief Credit Officer, and Chief Operating Officer. |
| (4) | Haeyoung Cho retired as President and Chief Executive Officer effective January 1, 2018, and now serves only as a director on both the Company’s and Bank’s board of directors. |
General
We compensate our named executive officers through a combination of base salary, annual bonuses, equity awards, and other benefits. Our Compensation Committee believes the executive compensation packages that we provide to our executives, including the named executive officers, should include both cash and equity compensation that reward performance as measured against established corporate goals. Each element of compensation is designed to achieve a specific purpose and to contribute to a total package that is competitive with similar packages provided by other institutions that compete for the services of individuals like our named executive officers.
Base Salary
The Compensation Committee reviews and approves base salaries of our named executive officers and sets the compensation of our Chief Executive Officer. Base salary is the fixed portion of cash compensation and is intended to reward the day-to-day aspects of an executive’s roles and responsibilities. Our executives’ annual salaries originally are set at the time they were first hired. The initial salaries were established by taking into account several factors including, but not limited to, the executive’s experience, responsibilities, management abilities and past job performance. The Compensation Committee also retains independent consultants as it deems appropriate to advise on executive and employee compensation matters. Salary levels are typically considered annually as part of our performance review process and upon a promotion or other change in job responsibility. Our President and Chief Executive Officer is the only executive officer who has an employment agreement with the Company. All other executive officers are employed at-will.
Short Term Cash Incentive
Short term cash incentives in the form of annual cash bonuses are approved by the Compensation Committee and our board of directors annually. Generally, the Compensation Committee and our board of directors review performance against pre-established financial and non-financial goals on an annual basis to determine the short-term cash incentive compensation of our executive officers. The annual short-term cash incentive payable to our President and Chief Executive Officer is provided for in his employment agreement and is equal to the lesser of
147
Table of Contents
1.5% of pre-tax profit for that year or his then current base salary, plus discretionary bonuses to be determined by the board of directors, if any. There are no agreements controlling the participation of our other named executive officers in the annual cash bonus pool and bonuses are subject to board discretion.
Equity Awards
Equity awards, such as stock options and restricted stock, are the third key component of our executive officers’ total compensation. The board of directors believe that employee stock ownership is a significant incentive for our executive officers to build shareholders wealth, thereby aligning the interests of employees and shareholders. The board of directors also believes that equity-based compensation complements the short-term cash incentive compensation by forcing executives to recognize the impact their short-term decisions might have on long-term outcomes. This compensation approach limits an executive’s ability to reap short-term gains at the expense of the Company’s long-term success. This is also an important tool in retaining executive officers.
Benefits
401(k) Plan. The 401(k) Plan is designed to provide retirement benefits to all eligible full-time and part-time employees (including those of our subsidiaries). The 401(k) Plan provides employees with the opportunity to save for retirement on a tax-favored basis. Named executive officers, all of whom were eligible during 2017, may elect to participate in the 401(k) Plan on the same basis as all other employees. Employees may defer between 1% and 100% of their compensation to the 401(k) Plan, up to the applicable Internal Revenue Service (“IRS”) limit. We currently match, dollar for dollar, 75% of the first 8% of an employee’s contribution to the 401(k) Plan. Our match is contributed in the form of cash and is invested according to the employee’s current investment allocation.
Health and Welfare Benefits. Our named executive officers are eligible to participate in our standard health and welfare benefits program, which offers medical, dental, vision, life, accident, and disability coverage to all of our eligible employees. We do not provide the named executive officers with any health and welfare benefits that are not generally available to our other employees.
Perquisites. We pay monthly dues and assessments for country club memberships for the CEO which he uses primarily to entertain current and prospective customers. Our named executive officers also receive a monthly car allowance. We do not provide any other perquisites to our other named executive officers.
Employment Agreements
The Bank has entered into a written employment agreement with its President and Chief Executive Officer, Henry Kim. The provisions of his agreement are summarized below.
On January 1, 2018, Mr. Kim was appointed President and Chief Executive Officer after serving as the Bank’s Chief Credit Officer and Chief Operating Officer for the prior 14 years. Under the written employment agreement entered with the Company and the Bank, Mr. Kim’s employment shall continue for 4 years from January 1, 2018 through December 31, 2021, unless sooner terminated. Based on this employment agreement, Mr. Kim is entitled to receive an annual base salary of $350,000. Mr. Kim’s agreement also calls for an annual incentive bonus equal to the lesser of 1.5% of pre-tax profit for that year or his then current base salary. In addition, Mr. Kim is eligible for discretionary bonuses to be determined by the board of directors, if any. The annual base salary shall be reviewed at least annually by the board of directors or the Compensation Committee, and shall be adjusted based upon job performance and the Bank’s financial condition and performance provided, however, that in no event shall the annual base salary be less than the amount specified above and such adjustments, if any, shall be in the sole discretion of the board of directors.
Mr. Kim’s current employment agreement entitles him to participate in any retirement, profit-sharing, salary deferral and other similar plans at such time as the Bank offers these benefits to its employees and to receive
148
Table of Contents
certain compensation in the event his employment is terminated, with certain benefits payable upon severance under specific circumstances. Mr. Kim is also entitled to the use of a company car; however, he elected instead to receive an auto allowance. Mr. Kim’s employment agreement also provides for a lump sum payment of compensation at his base salary then in effect equal to the remaining term of his contract if he is terminated without cause or “resigns for good reason” following a “change in control” of the Bank and the Company. Absent a “change in control” of the Bank and the Company, termination without cause entitles Mr. Kim to a lump sum payment equal to the remaining term of his contract, not to exceed six months’ salary.
For purposes of Mr. Kim’s employment agreement, the following terms are defined as follows:
“Cause” means: (i) Executive’s personal dishonesty, incompetence or willful misconduct; (ii) Executive commits an act or acts or an omission to act which constitutes: (a) a willful breach of duty in the course of executive’s employment; (b) a habitual neglect of duty; (c) a willful violation of any applicable banking law or regulation; or (d) a willful violation of any policy, procedure, practice, method of operation or specific mode of conduct established by the board or as set forth in the Bank’s employee manual, if any; (iii) executive engages in activity which, in the opinion of the board, could materially adversely affect Bank’s or Company’s reputation in the community or which evidences the lack of executive’s fitness or ability to perform executive’s duties as determined by the board, in good faith; or (iv) executive commits any act or acts or an omission to act which would cause termination of coverage under the Bank’s bankers blanket bond as to executive or as to Bank as a whole or any act, which would give rise to a colorable claim by the Bank under its Bankers Blanket Bond as determined by the Board in good faith.
“Change in Control” means a change, in control of the Bank or Company of a nature that would be required to be the subject of prior approval by (A) the Federal Reserve Board pursuant to the Bank Holding Bank Act of 1956, as amended, (B) the Federal Deposit Insurance Corporation under the Change In Bank Control Act, (C) the appropriate federal bank regulatory agency under the Bank Merger Act or (D) the California Department of Financial Institutions pursuant to provisions of the California Financial Code; provided, that without limitation, and without consideration of regulatory exemptions from prior approval, such a Change in Control will be deemed to have occurred if and when any of the following occur: (i) there is a transfer, voluntarily or by hostile takeover or proxy contest, operation of law or otherwise, of control of the Bank or Company, (ii) individuals, who were members of the board of the Bank or Company immediately prior to a meeting of the shareholders of the Bank or Company, as the case may be, which meeting involved a contest for the election of directors, do not constitute a majority of the Board of the Bank or Company, as the case may be, following such election or meeting, (iii) an acquisition, directly or indirectly, of more than 25% of the outstanding shares of any class of voting securities of the Bank or Company by any Person, (iv) a merger (in which the Bank or Company is not the surviving entity), consolidation or sale of all, or substantially all, of the assets of the Bank or Company, or (v) there is a change, during any period of two consecutive years, of a majority of the Board of the Bank or Company as constituted as of the beginning of such period, unless the election of each director who is not a director at the beginning of such period was approved by a vote of at least two-thirds of the directors then in office who were directors at the beginning of such period. For purposes of this definition, the term “Person” shall mean and include any individual, corporation, partnership, group, association or other “person,” as such term is used in Section 14(d) of the Securities Exchange Act of 1934, other than the Bank or any employee benefit plan(s) sponsored by the Bank.
“Good Reason” The termination by executive of executive’s employment for “Good Reason” shall mean termination based on: (i) an adverse change in executive’s status or position(s) as an executive officer of the Bank or Company as in effect immediately prior to the Change in Control, including, without limitation, any adverse change in executive’s status or position as a result of a material diminution in executive’s duties or responsibilities (other than, if applicable, any such change directly attributable to the fact that the Bank or Company is no longer publicly owned) or the assignment to executive of any duties or responsibilities which, in executive’s reasonable judgment, are inconsistent with such status or position(s), or any removal of executive from or any failure to reappoint or reelect executive to such position(s) (except in connection with the
149
Table of Contents
termination of executive’s employment for cause, disability or retirement or as a result of executive’s death or by executive other than for Good Reason); (ii) a reduction by the Bank or Company in executive’s base salary as in effect immediately prior to the Change in Control; (iii) the failure by the Bank or Company to continue in effect any executive compensation plan in which executive is participating at the time of the Change in Control of the Bank or Company (or a comparable plan) other than as a result of the normal expiration of any such plan in accordance with its terms as in effect at the time of the Change in Control, or the taking of any action, or the failure to act, by the Bank or Company which would adversely affect Executive’s continued participation in any of such plans on at least as favorable a basis to executive as is the case on the date of the Change in Control or which would materially reduce executive’s benefits in the future under any of such Plans or deprive executive of any material benefit under any plan enjoyed by executive at the time of the Change in Control; (iv) the failure by the Bank or Company to provide and credit Executive with the number of paid vacation days to which executive is then entitled in accordance with the Bank’s or Company’s normal vacation policy as in effect immediately prior to the Change in Control; (v) the Bank’s or Company’s requiring Executive to be based at an office that is greater than 25 miles from where executive’s office is located immediately prior to the Change in Control except for required travel on the Bank’s or Company’s business to an extent substantially consistent with the business travel obligations which executive undertook on behalf of the Bank or Company prior to the Change in Control; or (vi) the failure by the Bank or Company to obtain from any successor the assent to continue executive’s existing employment agreement.
Mr. Kim was granted 50,000 stock options on January 2, 2018 with an exercise price of $14.75 under the Company’s 2013 Equity Based Compensation Plan, which vest equally over four years.
Long-Term Incentive Plans
Equity based incentive awards are currently made though our 2013 Equity Based Compensation Plan (the “2013 Equity Plan”), which replaced our 2003 Stock Option Plan (the “2003 Equity Plan”). As of the effective date of the 2013 Equity Plan, no further awards were granted under the 2003 Equity Plan. However, any previously outstanding option award granted under the 2003 Equity Plan remains subject to the terms of such plan until the time it is no longer outstanding.
2003 Equity Plan
As part of the formation of the Company as a bank holding company, it assumed the 2003 Equity Plan pursuant to which incentive stock options were granted to selected employees and non-qualified stock options granted to directors and selected key salaried employees. Options granted under the 2003 Equity Plan were either incentive options or non-qualified stock options. Upon adoption of the 2013 Equity Based Compensation Plan, discussed below, no further grants were made from the 2003 Equity Plan.
2013 Equity Based Compensation Plan
The 2013 Equity Plan was adopted by our board on July 25, 2013 and approved at the 2013 shareholder’s meeting held on July 25, 2013 to replace the 2003 stock option plan, which was expired on September 16, 2013. Upon the 2013 Equity Plan’s formation, there were 1,341,206 options subject to the 2013 Equity Plan. Under the original terms of the 2013 Equity Plan, the number of shares available for issuance was to be adjusted to be 10% of the then issued and outstanding common stock on each June 30 during the term of the 2013 Equity Plan. The board of directors recently amended the 2013 Equity Plan to eliminate this feature and fixed the number of shares that remained available under the 2013 Equity Plan at 686,853 at December 31, 2017.
The 2013 Equity Plan provides for grants of the stock options and shares of restricted stock. The 2013 Equity Plan is administered by the Compensation Committee. Grants of stock options may be either of incentive stock options or non-qualified options. A stock option is a privilege granted to plan participants to purchase stock from the Company on a future date at the fair market value of the stock when the stock option was granted. Incentive
150
Table of Contents
stock options are subject to certain limitations not applicable to non-qualified options. The exercise price of all stock options may not be less than the fair market value of the Company’s common stock on the date of grant. The aggregate fair market value (determined at the date of grant) of the stock subject to all incentive stock options held by an optionee that vest in any single calendar year cannot exceed $100,000. Except in limited circumstances, neither the board of directors nor the Compensation Committee may reduce the exercise price of any option granted under the 2013 Equity Plan. The Compensation Committee may grant one or more restricted stock awards to plan participants, and at the time of grant shall determine the consideration to be paid, if any, and the period over which the restrictions shall lapse. Restricted stock is stock granted to a plan participant which may not be traded or sold until its restrictions lapse. Should any restriction fail to lapse for any reason, the plan participant would forfeit the restricted stock. However, the restrictions may not lapse with respect to any restricted stock award over a period of less than six months. Unless otherwise provided in the applicable award agreement, an employee receiving a restricted stock award shall be entitled to cash dividend and voting rights for all restricted shares issued even though still subject to forfeiture, provided that such rights shall terminate immediately as to any restricted stock which cease to be eligible for vesting. Any award may include financial criteria or other performance measures that must be met in order for the award to vest and/or become exercisable. The Compensation Committee may provide for full or partial credit for the satisfaction of criteria before the end of the period of time specified or the attainment of the specified goal, in the event of the employee’s death, retirement or disability or under such circumstances as the Compensation Committee may determine.
The Compensation Committee has the authority to determine the effect of various events on awards granted under the 2013 Equity Plan. The Compensation Committee will determine the effect of the termination of employment on awards, depending on the nature of the termination, including changing the exercise period or the number of shares for which an award is vested or exercisable at the time of termination or thereafter. In the event of an extraordinary corporate transaction, such as a stock split or a stock dividend, the Compensation Committee may proportionately adjust the shares subject to the 2013 Equity Plan and outstanding awards as to the number or kind of shares to which they relate, the price payable upon the exercise of awards or the applicable performance standards or criteria. Upon the giving of notice of a change in control event, as defined in the 2013 Equity Plan, in which the Company is not the surviving Company, then all outstanding options become exercisable and all restricted stock award restrictions lapse, unless the Compensation Committee determines otherwise, in which event the Compensation Committee will make provision for continuation and, if required, assumption of the 2013 Equity Plan and outstanding awards or for the substitution of new awards therefor. The 2013 Equity Plan also provides for the issuance of substitute awards in the event the Company acquires another entity and the terms of the acquisition require issuance of substitute awards for existing equity compensation of the acquired Company.
In 2016, the Company did not grant any incentive stock options.
In 2017, the Company granted 8,000 shares of incentive stock options to employees with the grant price of $13.75. The term of each option is 10 years, 60% to vest on March 2, 2020 and 20% to vest on each of the following two anniversary dates. The Company granted 20,000 shares of non-qualified stock options to a Bank director with the grant price of $14.00. The term of option is 10 years, 20% to vest on each anniversary date.
The number of shares of common stock issuable upon the exercise of outstanding stock options, the number of shares of common stock eligible for issuance, and the per share exercise price, set forth in the preceding two paragraphs, were adjusted retroactively for the 1-for-3 reverse stock split that occurred on February 28, 2014, and 10% stock dividends that occurred on February 27, 2015, January 29, 2016, and December 30, 2016, respectively.
As of March 31, 2018, there were total of 906,160 options outstanding, no shares of restricted stock outstanding, and up to 633,450 shares remained available for grant under the 2013 Equity Plan.
U.S. Federal Income Tax Treatment. Under present U.S. federal income tax laws, awards granted under the 2013 Equity Plan generally should have the following tax consequences:
Non-Qualified Stock Options. The grant of a non-qualified option generally will not result in taxable income to the participant. The participant generally will realize ordinary income at the time of exercise in an amount equal
151
Table of Contents
to the excess of the fair market value of the shares acquired over the exercise price for those shares and we will be entitled to a corresponding income tax deduction. Gains or losses realized by the participant upon disposition of such shares generally will be treated as capital gains and losses, with the basis in such shares equal to the fair market value of the shares at the time of exercise.
Incentive Stock Options. The grant of an incentive stock option generally will not result in taxable income to the participant. The exercise of an incentive stock option generally will not result in taxable income to the participant provided that the participant was (without a break in service) an employee during the period beginning on the date of the grant of the option and ending on the date three months prior to the date of exercise (one year prior to the date of exercise if the participant is “disabled,” as that term is defined in the Internal Revenue Code).
The excess of the fair market value of the shares at the time of the exercise of an incentive stock option over the exercise price generally will be an adjustment that is included in the calculation of the participant’s alternative minimum taxable income for the tax year in which the incentive stock option is exercised. For purposes of determining the participant’s alternative minimum income tax liability for the year of disposition of the shares acquired pursuant to the incentive stock option exercise, the participant will have a basis in those shares equal to the fair market value of the shares at the time of exercise.
If the participant does not sell or otherwise dispose of the shares within two years from the date of the grant of the incentive stock option or within one year after the transfer of such stock to the participant, then, upon disposition of such shares, any amount realized in excess of the exercise price generally will be taxed to the participant as capital gain. A capital loss will be recognized to the extent that the amount realized is less than the exercise price.
If the foregoing holding period requirements are not met, the participant generally will realize ordinary income at the time of the disposition of the shares, in an amount equal to the lesser of (i) the excess of the fair market value of the shares on the date of exercise over the exercise price, or (ii) the excess, if any, of the amount realized upon disposition of the shares over the exercise price and we generally will be entitled to a corresponding deduction. If the amount realized exceeds the value of the shares on the date of exercise, any additional amount generally will be capital gain. If the amount realized is less than the exercise price, the participant generally will recognize no income, and a capital loss will be recognized equal to the excess of the exercise price over the amount realized upon the disposition of the shares.
Stock Awards. A participant who has been granted a stock award generally will not realize taxable income at the time of grant, provided that the stock subject to the award is not delivered at the time of grant, or if the stock is delivered, it is subject to restrictions that constitute a “substantial risk of forfeiture” for U.S. federal income tax purposes and the participant has not filed an Internal Revenue Code Section 83(b) election to be taxed at the time of grant. Upon the later of delivery or vesting of shares subject to an award (or the filing of a Code Section 83(b) election), the participant generally will realize ordinary income in an amount equal to the then fair market value of those shares and we will be entitled to a corresponding deduction. Gains or losses realized by the participant upon disposition of such shares generally will be treated as capital gains and losses, with the basis in such shares equal to the fair market value of the shares at the time of delivery or vesting (or the filing of an Internal Revenue Code Section 83(b) election). In the case of stock awards settled in cash, the participant generally will realize taxable income at the time the cash is distributed and we will be entitled to a corresponding income tax deduction.
Withholding of Taxes. All distributions under the 2013 Equity Plan are subject to withholding of all applicable taxes and the Committee may condition the delivery of any shares or other benefits under the 2013 Equity Plan on satisfaction of the applicable withholding obligations. Except as otherwise provided by the Committee, such withholding obligations generally may be satisfied through cash payment by the participant, through the surrender of shares of our common stock that the participant already owns or through the surrender of shares of our common stock to which the participant is otherwise entitled under the 2013 Equity Plan.
152
Table of Contents
Outstanding Equity Awards at Fiscal Year End
The following table provides information for each of our named executive officers regarding outstanding awards held by the officers as of December 31, 2017, as adjusted for stock splits. Market values are presented as of the end of 2017 (based on the assumed per share fair market value of our common stock of $15.50 on December 31, 2017).
| Outstanding Equity Awards at 2017 Fiscal Year End | ||||||||||||||||||||||||
| Option Awards | ||||||||||||||||||||||||
| Grant Date | Expiration Date |
Number of Securities Underlying Unexercised Options (1) |
Option Exercise Price ($) |
Intrinsic Value ($) |
||||||||||||||||||||
| Name |
Exercisable (#) |
Unexercisable (#) |
||||||||||||||||||||||
| Henry Kim |
03/29/13 | 03/29/23 | 5,324 | 5,324 | 4.51 | 117,022 | ||||||||||||||||||
| 10/28/15 | 10/28/25 | 54,451 | 10.33 | 281,512 | ||||||||||||||||||||
| Haeyoung Cho |
02/23/12 | 02/23/22 | 4,761 | 3.38 | 57,703 | |||||||||||||||||||
| 03/29/13 | 03/29/23 | 8,874 | 8,875 | 4.51 | 195,062 | |||||||||||||||||||
| 10/01/14 | 10/01/24 | 66,553 | 9.30 | 412,629 | ||||||||||||||||||||
| Timothy Chang |
10/21/11 | 10/21/21 | 6,875 | 3.38 | 83,325 | |||||||||||||||||||
| 03/29/13 | 03/29/23 | 14,198 | 3,551 | 4.51 | 195,062 | |||||||||||||||||||
| 10/28/15 | 10/28/25 | 36,301 | 10.33 | 187,676 | ||||||||||||||||||||
| Brian Bang |
02/23/12 | 02/23/22 | 312 | 3.38 | 3,781 | |||||||||||||||||||
| 03/29/13 | 03/29/23 | 1,775 | 1,776 | 4.51 | 39,025 | |||||||||||||||||||
| 10/28/15 | 10/28/25 | 15,126 | 10.33 | 78,201 | ||||||||||||||||||||
| (1) | All unexercised options are subject to vesting; 20% to vest on each anniversary of the date of grant for options granted on October 21, 2011, February 23, 2012 and March 29, 2013, 1/3 to vest on each anniversary date for options granted on October 1, 2014, and 60% to vest on third anniversary date and 20% to vest on following anniversary dates for options granted on October 28, 2015. |
Director Compensation
The following table sets forth information regarding 2017 compensation for each of our nonemployee directors and the two Bank directors that do not serve on the Company’s board.
| Name |
Fees Earned or Paid in Cash |
Option Award |
All Other Compensation(1) |
Total | ||||||||||||
| Kwang Jin Chung |
$ | 59,500 | — | $ | 21,072 | $ | 80,572 | |||||||||
| Sang Young Lee |
59,000 | — | 21,072 | 80,072 | ||||||||||||
| Kijun Ahn |
53,500 | — | 30,401 | 83,901 | ||||||||||||
| Suk Won Youn |
22,500 | — | 21,072 | 43,572 | ||||||||||||
| Daniel H. Park |
54,700 | — | 22,733 | 77,433 | ||||||||||||
| Don Rhee |
22,500 | — | 21,072 | 43,572 | ||||||||||||
| Daniel Cho |
33,500 | 115,378 | 22,732 | 171,610 | ||||||||||||
| Sarah Jun |
55,500 | — | 21,072 | 76,572 | ||||||||||||
| (1) | All Other Compensation reflects health insurance benefits. |
Non-executive director fees for 2017 were based upon fees for service on the Company and Bank boards of directors. Non-executive directors of the Bank are paid a monthly retainer of $4,500, while the Chairman of the Bank’s board of directors is paid a monthly retainer of $6,000. In addition, non-executive directors of the Bank that also serve on the director’s loan committee are paid an additional monthly retainer of $500. The two members of the Company’s board of directors who do not also serve on the Bank’s board of directors (Directors Rhee and Youn) are paid a monthly retainer of $3,000.
153
Table of Contents
CERTAIN RELATIONSHIPS AND RELATED PARTY TRANSACTIONS
Ordinary Banking Relationships
Certain of our directors, officers, beneficial owners of more than 5% of our voting securities and their associates were customers of ours and had transactions with us in the past, and additional transactions with these persons are expected to take place in the future. All outstanding loans and commitments to lend to these persons were made in the ordinary course of business, were made on substantially the same terms, including interest rates and collateral, as those prevailing at the time for comparable loans with persons not related to us or the Bank and did not involve more than the normal risk of collectability or present other unfavorable features. All such loans are approved by the Bank’s board of directors in accordance with the bank regulatory requirements. Similarly, all certificates of deposit and depository relationships with these persons were made in the ordinary course of business and involved substantially the same terms, including interest rates, as those prevailing at the time for comparable depository relationships with persons not related to us or the Bank.
Policies and Procedures Regarding Related Party Transactions
Transactions by us or the Bank with related parties are subject to certain regulatory requirements and restrictions, including Sections 23A and 23B of the Federal Reserve Act (which govern certain transactions by the Bank with its affiliates) and the Federal Reserve’s Regulation O (which governs certain loans by the Bank to its executive officers, directors and principal shareholders).
Under applicable SEC and Nasdaq rules, related party transactions are transactions in which we are a participant, the amount involved exceeds $120,000 and a related party has or will have a direct or indirect material interest. Our related parties include directors (including nominees for election as directors), executive officers, five percent shareholders and the immediate family members of these persons. In accordance with the Nominating and Governance Committee Charter, the Nominating and Governance Committee evaluates related party transactions and monitors compliance with our Code of Ethics and Business Conduct. In determining whether to approve a related party transaction, the Nominating and Governance Committee will consider, among other factors, the fairness of the proposed transaction, the direct or indirect nature of the related party’s interest in the transaction, the appearance of an improper conflict of interests for any director or executive officer taking into account the size of the transaction and the financial position of the related party, whether the transaction would impair an outside director’s independence, the acceptability of the transaction to our regulators and the potential violations of other corporate policies.
154
Table of Contents
SECURITY OWNERSHIP OF CERTAIN BENEFICIAL OWNERS AND MANAGEMENT
The following table sets forth information as of July 11, 2018, regarding the beneficial ownership of our common stock, and as adjusted to reflect the completion of this offering:
| • | each shareholder known by us to beneficially own more than 5% of our outstanding common stock, |
| • | each of our directors, |
| • | each of our executive officers, and |
| • | all of our directors and executive officers as a group. |
We have determined beneficial ownership in accordance with the rules of the SEC. These rules generally provide that a person is the beneficial owner of securities if such person has or shares the power to vote or direct the voting of securities, or to dispose or direct the disposition of securities, or has the right to acquire such powers within 60 days. Except as disclosed in the footnotes to this table, we believe that each person identified in the table has sole voting and investment power over all of the shares shown opposite such person’s name.
The percentage of beneficial ownership is based on 13,436,214 shares of our common stock outstanding as of July 11, 2018 and [*] shares to be outstanding after the completion of this offering (or [*] shares if the underwriters exercise their option to purchase additional shares in full). The table does not reflect any shares of common stock that may be purchased in this offering, including through the directed share program described under “Underwriting.” Because certain shares may have deemed beneficial ownership, such shares are included in the table with ownership by more than one person.
The address for each person listed in the table below is: c/o Pacific City Bank, 3701 Wilshire Boulevard, Suite 900, Los Angeles, California 90010.
| Name, Address of Beneficial Owner, And Relationship with Company(2) |
Amount and Nature of Beneficial Ownership(3) |
Percent of Class | Post Offering Percent of Class |
|||||||||
| Sang Young Lee |
1,486,930 | (4) | 11.06 | % | ||||||||
| Director |
||||||||||||
| Suk Won Youn |
625,669 | (5) | 4.65 | % | ||||||||
| Director |
||||||||||||
| Kwang Jin Chung |
568,239 | (6) | 4.22 | % | ||||||||
| Director |
||||||||||||
| Don Rhee |
430,245 | (7) | 3.20 | % | ||||||||
| Director |
||||||||||||
| Haeyoung Cho |
238,524 | (8) | 1.76 | % | ||||||||
| Director |
||||||||||||
| Kijun Ahn |
127,146 | (9) | * | * | ||||||||
| Director |
||||||||||||
| Daniel H. Park |
9,680 | (10) | * | * | ||||||||
| Director |
||||||||||||
| Sarah Jun |
276,208 | (11) | 2.05 | % | ||||||||
| Bank Director |
||||||||||||
| Daniel Cho |
14,000 | (12) | * | * | ||||||||
| Bank Director |
||||||||||||
| Henry Kim |
137,962 | (13) | 1.03 | % | ||||||||
| President, Chief Executive Officer, and Director |
||||||||||||
| Timothy Chang |
26,624 | (14) | * | * | ||||||||
| Executive Vice President and Chief Financial Officer |
||||||||||||
| Andrew Chung |
— | * | * | |||||||||
| Executive Vice President and Chief Risk Officer |
||||||||||||
155
Table of Contents
| Name, Address of Beneficial Owner, And Relationship with Company(2) |
Amount and Nature of Beneficial Ownership(3) |
Percent of Class | Post Offering Percent of Class |
|||||||||
| Brian Bang |
10,430 | (15) | * | * | ||||||||
| Senior Vice President and Chief Credit Officer |
||||||||||||
| John Ju |
99,663 | (16) | * | * | ||||||||
| Senior Vice President and Chief Lending Officer |
||||||||||||
| Justin Chon |
9,816 | (17) | * | * | ||||||||
| Senior Vice President and Chief Consumer Lending Officer |
||||||||||||
| Mimi Lee |
17,937 | (18) | * | * | ||||||||
| Senior Vice President and Chief Operations Administrator |
||||||||||||
|
|
|
|
|
|
|
|||||||
| All Directors and Executive Officers combined (As a group of 16) |
4,079,073 | 29.86 | % | |||||||||
| ** | Represents less than 1% of outstanding. |
| (1) | As used in this table, the term “executive officers” means the President and Chief Executive Officer, the Executive Vice President and Chief Financial Officer and Corporate Secretary and the Bank’s Executive Vice President and Chief Risk Officer, Senior Vice President and Chief Credit Officer, Senior Vice President and Chief Lending Officer, Senior Vice President and Chief Consumer Lending Officer, and Senior Vice President and Chief Operations Administrator. The Chairman of the Board and our other officers are not treated as executive officer. |
| (2) | Unless otherwise indicated, the address for all persons listed is c/o Pacific City Bank, 3701 Wilshire Boulevard, Suite 900, Los Angeles, California 90010. |
| (3) | The table includes all shares beneficially owned on July 11, 2018, whether directly or indirectly, individually or together with associates, jointly or as community property with a spouse, as well as any shares, including through the exercise of stock options, as to which beneficial ownership may be acquired within 60 days of July 11, 2018. The options are described in more detail in “Executive Compensation,” above. |
| (4) | Includes 1,052,978 held by Sang Young Lee and Chun Young Lee TR UA dated April 22, 1999 Lee Family Trust, 416,016 shares held by Lee’s Gold and Diamond Import, Inc., 9,570 held by Charles Schwab & Co. Inc., for benefit of Sang Young Lee, and 8,366 stock options exercisable under the 2003 and 2013 Equity Plans. |
| (5) | Includes 334,763 shares held by Suk Won Youn and Sook Hee Youn 2004 Revocable Trust, 276,369 shares held in a Dtd. Jan 01.95 Defined Benefit Pension Plan administered by Unique Spectronix Inc. of which Mr. Youn is the President, and 14,537 stock options exercisable under the 2003 and 2013 Equity Plans. |
| (6) | Includes 517,206 shares held in the Chung Revocable Family Trust dated May 27, 2008, 29,502 shares held by Dad & Co. for benefit of Chung Revocable Family Trust dated May 27, 2008 , 3,547 shares held by his son, 3,547 shares held by his daughter, and 14,437 stock options exercisable under the 2003 and 2013 Equity Plans. |
| (7) | Includes 310,565 shares held by Rhee Family Venture LLC where his spouse is a president, 110,000 shares held by The Rhee Family Trust dated July 9, 2004, and 9,680 stock options exercisable under the 2013 Equity Plan. |
| (8) | Includes 128,478 shares held by The 2016 Haeyoung Cho Trust dated May 11, 2016, 20,983 shares held by Raymond James & Associates Inc Cust FBO Haeyoung Cho IRA, and 89,063 stock options exercisable under the 2003 and 2013 Equity Plans. |
| (9) | Includes 88,731 shares held jointly by him and his spouse, 7,151 shares in a Uniform Transfer to Minors Trust for his daughter, 7,151 shares held by his son, 1,827 shares held by his daughter, and 22,286 stock options exercisable under the 2003 and 2013 Equity Plan. |
| (10) | Includes 9,680 shares held by individually. |
| (11) | Includes 177,465 shares held by Ms. Jun individually, 77,832 held by her spouse, 10,000 shares held by her son, 300 shares held by Kayan Securities Inc., for the benefit of her spouse, 931 shares held by Kayan Securities Inc., for her benefit, and 9,680 stock options exercisable under the 2013 Equity Plans. |
156
Table of Contents
| (12) | Includes 10,000 shares held by Daniel Cho and Keo En Hyun TR UA dated December 17, 2017, and 4,000 stock options exercisable under the 2013 Equity Plan. |
| (13) | Includes 59,992 shares held jointly by him and his spouse, 29,282 shares held individually, 19,785 shares held by Raymond James & Associates Inc Cust FBO Henry H. Kim IRA, 8,518 shares held by Raymond James & Associates Inc Cust FBO June C. Kim IRA, 9,295 shares held by Charles Schwab & Co for benefit of his wife, 442 shares held by Charles Schwab & Co for benefit of Mr. Kim and his wife jointly, and 10,648 stock options exercisable under the 2003 Equity Plans. |
| (14) | Includes 4,000 shares held by individually and 22,624 stock options exercisable under the 2003 Equity Plan. |
| (15) | Includes 6,567 shares held by individually and 3,863 stock options exercisable under the 2003 Equity Plan. |
| (16) | Includes 56,553 shares held by Fidelity Investments for the benefit of Mr. Ju, 29,796 shares held by Fidelity Investments for the benefit of Mr. Ju and his aunt jointly, and 13,314 stock options exercisable under the 2003 Equity Plan. |
| (17) | Includes 9,816 shares held individually. |
| (18) | Includes 15,189 shares held individually and 2,748 shares held by Raymond James & Associates, Inc. Cust FBO Mimi Lee IRA. |
157
Table of Contents
The following is a summary of the material rights of our capital stock and related provisions of our articles of incorporation, or articles, and bylaws. The following description of our capital stock does not purport to be complete and is subject to, and qualified in its entirety by, our articles and bylaws, which we have included as exhibits to the registration statement of which this prospectus is a part. We urge you to read these documents for a more complete understanding of shareholder rights.
Our articles authorize the issuance of up to 60,000,000 shares of common stock, without par value, and up to 10,000,000 shares of preferred stock, without par value. At March 31, 2018, we had issued and outstanding 13,424,777 shares of our common stock, held by approximately 397 record holders, and no shares of preferred stock. We have reserved an additional 633,450 shares for issuance in connection with awards that remain available for issuance under our 2013 Equity Plan at March 31, 2018.
Common Stock
Governing Documents. Holders of shares of our common stock have the rights set forth in our articles, our bylaws and the CGCL.
Dividends and Distributions. The holders of our common stock are entitled to share equally in any dividends that our board of directors may declare from time to time out of funds legally available for dividends, subject to limitations under California law and any preferential rights of holders of our then outstanding preferred stock.
Ranking. Our common stock ranks junior with respect to dividend rights and rights upon liquidation, dissolution or winding up to all our other securities and indebtedness.
Upon any voluntary or involuntary liquidation, dissolution or winding up, the holders of our common stock are entitled to share equally, on a per share basis, in all of our assets available for distribution, after payment to creditors and subject to any prior distribution rights granted to holders of any then outstanding shares of preferred stock.
Conversion Rights. Our common stock is not convertible into any other shares of our capital stock.
Preemptive Rights. Holders of our common stock do not have any preemptive rights.
Voting Rights. The holders of our common stock are entitled to one vote per share on any matter to be voted on by the shareholders. The holders of our common stock are entitled to cumulative voting rights with respect to the election of directors. A plurality of the shares voted shall elect all of the directors then standing for election at a meeting of shareholders at which a quorum is present.
Redemption. We have no obligation or right to redeem our common stock.
Stock Exchange Listing. We have applied to list our common stock on the Nasdaq Global Market under the trading symbol “PCB.”
Preferred Stock
Upon authorization of our board of directors, we may issue shares of one or more series of our preferred stock from time to time. Our board of directors may, without any action by holders of common stock and except as may be otherwise provided in the terms of any series of preferred stock of which there are shares outstanding, adopt resolutions to designate and establish a new series of preferred stock. Upon establishing such a series of preferred stock, the board will determine the number of shares of preferred stock of that series that may be issued
158
Table of Contents
and the rights and preferences of that series of preferred stock. The rights of any series of preferred stock may include, among others:
| • | general or special voting rights; |
| • | preferential liquidation rights; |
| • | preferential cumulative or noncumulative dividend rights; |
| • | redemption or put rights; and |
| • | conversion or exchange rights. |
We may issue shares of, or rights to purchase shares of, one or more series of our preferred stock that have been designated from time to time, the terms of which might:
| • | adversely affect voting or other rights evidenced by, or amounts otherwise payable with respect to, the common stock or other series of preferred stock; |
| • | discourage an unsolicited proposal to acquire us; or |
| • | facilitate a particular business combination involving us. |
Any of these actions could have an anti-takeover effect and discourage a transaction that some or a majority of our shareholders might believe to be in their best interests or in which our shareholders might receive a premium for their stock over our then market price.
The Company previously had issued and outstanding two series of preferred stock, the Series A and Series B Fixed Rate Perpetual Preferred Stock, both of which were fully redeemed and retired in a series of direct repurchases and redemptions in 2013 and 2014.
Anti-Takeover Considerations and Special Provisions of Our Articles, Bylaws and California Law
California law and certain provisions of our articles and bylaws could have the effect of delaying or deferring the removal of incumbent directors or delaying, deferring or discouraging another party from acquiring control of us, even if such removal or acquisition would be viewed by our shareholders to be in their best interests. These provisions, summarized below, are intended to encourage persons seeking to acquire control of us to first negotiate with our board of directors. These provisions also serve to discourage hostile takeover practices and inadequate takeover bids. We believe that these provisions are beneficial because the negotiation they encourage could result in improved terms of any unsolicited proposal.
Authorized But Unissued Capital Stock. We have authorized but unissued shares of common stock and preferred stock, and our board of directors may authorize the issuance of one or more series of preferred stock without shareholder approval. These shares could be used by our board of directors to make it more difficult or to discourage an attempt to obtain control of us through a merger, tender offer, proxy contest or otherwise.
Limitation on Right to Call a Special Meeting of Shareholders. Our bylaws provide that special meetings of shareholders may only be called by our board, Chairman, or President, or by one or more holders of not less than 10% of our outstanding shares of capital stock entitled to vote for the purpose or purposes for which the meeting is being called.
Advance Notice Provisions. Additionally, our bylaws provide that nominations for directors must be made in accordance with the provisions of our bylaws, which generally require, among other things, that such nominations be provided in writing to our President, not less than 14 days and no more than 50 days prior to the date of the meeting. The advance notice provision gives the board adequate time to respond to the shareholder proposal. If the shareholder fails to provide the notice within the time prescribed under the bylaws, the Chairman of the meeting can exclude the proposal at the shareholders meeting
159
Table of Contents
Action by Written Consent of Shareholders. Our bylaws provide that any action required or permitted to be taken by the holders at a duly called annual or special meeting of the holders of our capital stock may be effected by any consent in writing by signed by the holders of outstanding shares having not less than the minimum number of votes that would be necessary to authorize or take that action at a meeting our shareholders. However, in the case of election of directors, such a consent shall be effective only if signed by the holders of all outstanding shares entitled to vote for the election of directors.
Filling of Board Vacancies. Any vacancies in our board of directors and any directorships resulting from any increase in the number of directors may be filled by a majority of the remaining directors, whether or not they constitute quorum, or a sole remaining director. The shareholders may elect a director at any time to fill any vacancy not filled by the directors. Any such election by written consent other than to fill a vacancy created by removal, which requires the unanimous consent of all shares entitled to vote for the election of directors, requires the consent of a majority of the outstanding shares entitled to vote. However, a vacancy created by the removal of a director (other than when the removed director has been convicted of a felony or declared of unsound mind by an order of court) may be filled only by the affirmative vote of a majority of the shares represented and entitled to vote at a duly held meeting at which a quorum is present, or by the unanimous written consent of all shares entitled to vote thereon.
Amendment of the Bylaws. Our bylaws provide that our bylaws may be amended or repealed, and new bylaws may be adopted, by the vote of a majority of the board of directors. Accordingly, our board could take action to amend our bylaws in a manner that could have the effect of delaying, deferring or discouraging another party from acquiring control of us.
Limitation on Liability and Indemnification of Officers and Directors
Under the CGCL §317, a California corporation may indemnify an individual made a party to a proceeding because the individual is or was a director against liability incurred in the proceeding if (i) the individual’s conduct was in good faith, (ii) the individual reasonably believed, in the case of conduct in the individual’s official capacity with the corporation, that the individual’s conduct was in the best interests of the corporation, and in all other cases, that the individual’s conduct was at least not opposed to the corporation’s best interests, and (iii) in the case of any criminal proceeding, the individual either had reasonable cause to believe that the individual’s conduct was lawful, or the individual had no reasonable cause to believe that the individual’s conduct was unlawful.
Unless limited by its articles of incorporation, a corporation must indemnify a director who was wholly successful, on the merits or otherwise, in the defense of any proceeding to which the director was a party because the director is or was a director of the corporation against reasonable expenses incurred by the director in defense of the proceeding. In addition, unless limited by its articles of incorporation, an officer of a corporation, whether or not a director, is entitled to mandatory indemnification to the same extent as a director, and a corporation may also indemnify and advance expenses to an officer, employee or agent to the same extent as to a director.
Our articles and bylaws provide that, to the extent not inconsistent with applicable law, we may indemnify each of our directors, officers, employees and agents against all liability and reasonable expense that may be incurred by him or her in connection with or resulting from any claim in which he or she may become involved by reason of the fact that he or she is or was a director, officer, employee or agent of us or by reason of any action taken or not taken by him or her in any such capacity, if such person is wholly successful with respect to the claim or, if not wholly successful, then if such person is determined to have acted in good faith, in what he or she reasonably believed to be the best interests of us (or at least not opposed to its best interests) and, in addition, with respect to a criminal claim, is determined to have had reasonable cause to believe that his or her conduct was lawful or had no reasonable cause to believe that his or her conduct was unlawful. Our indemnification extends to attorney fees, disbursements, judgments, fines, penalties or settlements in accordance with Section 317 of the CGCL. We may also advance expenses or undertake the defense of a director, officer or employee upon
160
Table of Contents
receipt of an undertaking by such person to repay such expenses if it should ultimately be determined that he or she is not entitled to indemnification.
In order for a director, officer or employee to be entitled to indemnification, the person must be wholly successful with respect to such claim or either our board of directors acting by a quorum consisting of directors who are not parties to, or who have been wholly successful with respect to such claim, action, suit or proceeding, or independent legal counsel must determine that the director, officer or employee has met the standards of conduct required by our articles.
The CGCL permits us to purchase insurance on behalf of our directors, officers, employees and agents against liabilities arising out of their positions with us, whether or not such liabilities would be within the above indemnification provisions. Pursuant to this authority, we maintain such insurance for the directors, officers and employees of the Company and its subsidiaries.
Transfer Agent and Registrar
The transfer agent and registrar for our common stock is Computershare, Inc. The transfer agent and registrar’s address is 462 South 4th Street, Suite 1600, Louisville, KY 40202 and the telephone number is (800) 736-3001.
161
Table of Contents
SHARES ELIGIBLE FOR FUTURE SALE
Prior to this offering, there has been no established public market for our common stock. Future sales of substantial amounts of our common stock in the public market, or the perception that such sales may occur, could adversely affect market prices prevailing from time to time. Furthermore, because only a limited number of shares will be available-for-sale shortly after this offering due to existing contractual and legal restrictions on resale as described below, there may be sales of substantial amounts of our common stock in the public market after the restrictions lapse. This may adversely affect the prevailing market price and our ability to raise equity capital in the future.
Upon completion of this offering, we will have [*] shares of common stock outstanding. Of these shares, [*] shares of our common stock (or [*] shares if the underwriters exercise their option to purchase additional shares in full) sold in this offering will be freely transferable without restriction or further registration under the Securities Act, except for any shares purchased by our “affiliates,” as that term is defined in Rule 144 under the Securities Act. The remaining [*] shares of our common stock outstanding are “restricted shares” as defined in Rule 144. Restricted shares may be sold in the public market only if registered under the Securities Act or if they qualify for an exemption from registration under Rule 144. As a result of the contractual 180-day lock-up period described below, [*] of these shares will be available-for-sale in the public market only after 180 days from the date of this prospectus (generally subject to volume and other offering limitations).
Rule 144
In general, a person who has beneficially owned restricted shares of our common stock for at least six months would be entitled to sell such securities, provided that (i) such person is not deemed to have been one of our affiliates at the time of, or at any time during the 90 days preceding, the sale and (ii) we are subject to the Exchange Act periodic reporting requirements for at least 90 days before the sale. Persons who have beneficially owned restricted shares of our common stock for at least six months but who are our affiliates at the time of, or any time during the 90 days preceding, the sale, would be subject to additional restrictions, by which such person would be entitled to sell within any three-month period only a number of securities that does not exceed the greater of the following:
| • | 1% of the number of shares of our common stock then outstanding, which will equal approximately [*] shares immediately after this offering (or approximately [*] shares if the underwriters exercise their option to purchase additional shares in full); or |
| • | the average weekly trading volume of our common stock on the Nasdaq during the four calendar weeks preceding the filing of a notice on Form 144 with respect to the sale; provided, in each case, that we are subject to the Exchange Act periodic reporting requirements for at least 90 days before the sale. Such sales both by affiliates and by non-affiliates must also comply with the manner of sale and notice provisions of Rule 144 to the extent applicable. |
Registration Statement on Form S-8
In connection with or as soon as practicable following the completion of this offering, we intend to file a registration statement with the SEC on Form S-8 to register an aggregate of approximately 906,160 shares of our common stock presently represented by outstanding equity awards and 633,450 shares reserved for future issuance under our 2013 Equity Based Compensation Plan and our 2003 Equity Plan, as described further under “Executive Compensation—2013 Equity Based Compensation Plan.” That registration statement will become effective upon filing and shares of common stock covered by such registration statement will be eligible for sale in the public market immediately after the effective date of such registration statement (unless held by affiliates) subject to the lock-up agreements described below.
162
Table of Contents
MATERIAL UNITED STATES FEDERAL INCOME TAX CONSIDERATIONS
FOR NON-U.S. HOLDERS
The following is a general discussion of the material U.S. federal income tax consequences of the ownership and disposition of our common stock by certain non-U.S. holders (as defined below) that purchase our common stock pursuant to this offering and hold such common stock as a capital asset (generally, property held for investment). This discussion is based on current provisions of the Internal Revenue Code of 1986, as amended, or the “Code”, Treasury regulations promulgated thereunder, judicial decisions, and rulings and pronouncements of the IRS, all as in effect on the date hereof and all of which are subject to change, possibly with retroactive effect, or subject to different interpretation. We have not sought any ruling from the IRS with respect to the statements made and conclusions reached in the following discussion, and there can be no assurance that the IRS will not take a position contrary to such statements and conclusions discussed below and that any position taken by the IRS would not be sustained.
This discussion does not address all tax consequences that may be relevant to specific holders in light of their particular circumstances or to holders subject to special treatment under U.S. federal income tax laws (such as financial institutions, insurance companies, tax-exempt organizations, controlled foreign corporations, passive foreign investment companies, pension plans, retirement plans, partnerships or other entities classified as partnerships for U.S. federal income tax purposes, dealers or brokers in securities or currency, U.S. expatriates or former long-term residents of the U.S., hybrid entities, persons subject to the alternative minimum tax, persons who have acquired our common stock as compensation in connection with the exercise of an employee stock option or otherwise in connection with the performance of services, persons who have elected to mark securities to market, or persons who have acquired our common stock as part of a straddle, hedge, conversion transaction or other integrated investment). In addition, this discussion addresses only U.S. federal income tax consequences and does not address any other U.S. federal tax consequences (such as the Medicare contribution tax or U.S. federal estate or gift tax) or any aspects of state, local, or foreign tax laws.
If a partnership or other entity or arrangement treated as a partnership for U.S. federal income tax purposes holds our common stock, the U.S. federal income tax treatment of a partner will generally depend upon the status of the partner and the activities of the partnership. A partnership that holds our common stock and any partner who owns an interest in such a partnership should consult their tax advisors regarding the U.S. federal income tax consequences of an investment in our common stock.
THIS DISCUSSION IS PROVIDED FOR GENERAL INFORMATION ONLY AND DOES NOT CONSTITUTE LEGAL ADVICE TO ANY PROSPECTIVE PURCHASER OF OUR COMMON STOCK. YOU ARE URGED TO CONSULT YOUR TAX ADVISOR WITH RESPECT TO THE APPLICATION OF THE U.S. FEDERAL INCOME TAX LAWS TO YOUR PARTICULAR SITUATION, AS WELL AS ANY TAX CONSEQUENCES OF THE PURCHASE, OWNERSHIP AND DISPOSITION OF OUR COMMON STOCK ARISING UNDER THE U.S. FEDERAL ESTATE OR GIFT TAX RULES OR UNDER THE LAWS OF ANY STATE, LOCAL, NON-U.S. OR OTHER TAXING JURISDICTION OR UNDER ANY APPLICABLE TAX TREATY.
As used in this discussion, the term “non-U.S. holder” or “you” refers to a beneficial owner of our common stock that for U.S. federal income tax purposes is neither a partnership (including any entity or arrangement treated as a partnership for such purposes) nor:
| • | an individual who is a citizen or resident of the U.S. (including certain former citizens and former long-term residents of the U.S.); |
| • | a corporation (or other entity taxable for U.S. federal income tax purposes as a corporation) created or organized in or under the laws of the U.S. or any state thereof, including the District of Columbia; |
| • | an estate the income of which is subject to U.S. federal income tax regardless of its source; or |
163
Table of Contents
| • | a trust which (1) is subject to the primary supervision of a court within the U.S. and one or more U.S. persons as defined under Section 7701(a)(30) of the Code have the authority to control all substantial decisions of the trust, or (2) has a valid election in effect under applicable Treasury regulations to be treated as a U.S. person as defined above. |
Dividends and Distributions
In the event that we make a distribution of cash or other property (other than certain distributions of our stock) in respect of our common stock, the distribution generally will be treated as a dividend to the extent of our current or accumulated earnings and profits as determined under U.S. federal income tax principles. To the extent those distributions exceed both our current and our accumulated earnings and profits, they will first constitute a nontaxable return of capital, and will first reduce your basis in our common stock, but not below zero, and then will be treated as gain from the disposition of the common stock, the tax treatment of which is discussed below under “—Sale, Exchange or Other Taxable Disposition.”
Subject to the discussions below and under the headings, “Information Reporting and Backup Withholding” and “Foreign Account Tax Compliance Act,” distributions that constitute dividends paid to a non-U.S. holder of our common stock generally will be subject to U.S. withholding tax either at a rate of 30.0% of the gross amount of the dividend or such lower rate as may be specified by an applicable income tax treaty. In order to receive a reduced treaty withholding rate, you must provide us with an IRS Form W-8BEN or IRS Form W-8BEN-E (or other applicable form) and satisfy applicable certification and other requirements, including providing us with a U.S. taxpayer identification number, certifying qualification for the reduced rate. If the non-U.S. holder holds the stock through a financial institution or other agent acting on the non-U.S. holder’s behalf, the non-U.S. holder will be required to provide appropriate documentation to the agent, which then will be required to provide certification to us or our paying agent, either directly or through other intermediaries. A non-U.S. holder eligible for a reduced rate of U.S. withholding tax pursuant to an income tax treaty may obtain a refund of any excess amounts withheld by timely filing an appropriate claim for refund with the IRS.
Dividends received by you that are effectively connected with your conduct of a U.S. trade or business (and, if an income tax treaty applies, that are attributable to a permanent establishment maintained by you in the U.S.), are generally exempt from such withholding tax. In order to obtain this exemption, you must provide us with an IRS Form W-8ECI (or successor form) or other applicable IRS Form W-8 (or successor form) properly certifying such exemption. Such effectively connected dividends, although not subject to withholding tax, generally are taxed at the same graduated rates applicable to U.S. persons, net of certain deductions and credits. In addition, if you are a corporate non-U.S. holder, dividends you receive that are effectively connected with your conduct of a U.S. trade or business may also be subject to a branch profits tax at a rate of 30.0% or such lower rate as may be specified by an applicable income tax treaty.
Sale, Exchange or Other Taxable Disposition
Subject to the discussion below under the headings “Information Reporting and Backup Withholding” and “Foreign Account Tax Compliance Act,” you generally will not be required to pay U.S. federal income tax on any gain realized upon the sale or other disposition of our common stock unless:
| • | the gain is effectively connected with your conduct of a U.S. trade or business (and, if an income tax treaty applies, the gain is attributable to a permanent establishment maintained by you in the U.S.); |
| • | you are a non-resident alien individual who is present in the U.S. for a period or periods aggregating 183 days or more during the calendar year in which the sale or disposition occurs and certain other conditions are met; or |
| • | our common stock constitutes a U.S. real property interest by reason of our status as a U.S. real property holding corporation (“USRPHC”), for U.S. federal income tax purposes at any time within the shorter of the five-year period preceding your disposition of, or your holding period for, our common stock. |
164
Table of Contents
If you are described in the first bullet above, you will be required to pay tax on the net gain derived from the sale under regular graduated U.S. federal income tax rates. Additionally, if you are a corporate non-U.S. holder described in the first bullet above also may be subject to the branch profits tax at a 30.0% rate, or such lower rate as may be specified by an applicable income tax treaty. If you are described in the second bullet above, you will be required to pay a flat 30.0% tax on the gain derived from the sale, which tax may be offset by U.S.-source capital losses for the year (provided that you have filed U.S. federal income tax returns with respect to such losses).
We believe that we are not currently and will not become a USRPHC. However, because the determination of whether we are a USRPHC depends on the fair market value of our U.S. real property relative to the fair market value of our other business assets, there can be no assurance that we will not become a USRPHC in the future. Generally, a corporation is a USRPHC only if the fair market value of its U.S. real property interests equals or exceeds 50% of the sum of the fair market value of its worldwide real property interests plus certain other assets used or held for use in a trade or business. Even if we become a USRPHC, however, as long as our common stock is regularly traded on an established securities market (within the meaning of Section 897(c)(3) of the Code), such common stock will be treated as U.S. real property interests only if you actually or constructively hold more than 5.0% of such regularly traded common stock at any time during the shorter of the five-year period preceding your disposition of, or your holding period for, our common stock.
Information Reporting and Backup Withholding
Information returns will be filed annually with the IRS in connection with payments of dividends and the proceeds from a sale or other disposition of our common stock, regardless of whether withholding was required. A non-U.S. holder may have to comply with certification procedures to establish that it is not a U.S. person in order to avoid backup withholding tax (currently at a rate of 24%). The certification procedures required to claim a reduced rate of withholding under an applicable income tax treaty generally should satisfy the certification requirements necessary to avoid backup withholding tax as well.
Notwithstanding the foregoing, information reporting and backup withholding may apply if either we or our paying agent has actual knowledge, or reason to know, that the holder is a U.S. person. Even if a non-U.S. holder establishes an exemption from information reporting, we or our paying agent may still be required to report annually to the IRS the amount of dividends paid, the name and address of the recipient, and the amount, if any, of tax withheld. A similar report is sent to the non-U.S. holder. Pursuant to tax treaties or other agreements, the IRS may make its reports available to tax authorities in the recipient’s country of residence.
Under Treasury regulations, the payment of proceeds from the disposition of our common stock by a non-U.S. holder effected at a U.S. office of a broker generally will be subject to information reporting and backup withholding, unless the beneficial owner, under penalties of perjury, certifies, among other things, its status as not a U.S. person or otherwise establishes an exemption. The payment of proceeds from the disposition of our common stock by a non-U.S. holder effected at a non-U.S. office of a broker generally will not be subject to backup withholding and information reporting, except as noted below. Information reporting (but generally not backup withholding) will apply in the case of proceeds from a disposition of our common stock by a non-U.S. holder effected at a non-U.S. office of a broker that is has certain relationships within the U.S.
U.S. backup withholding tax is not an additional tax. Any amounts withheld under the backup withholding rules may be allowed as a refund or a credit against a non-U.S. holder’s U.S. federal income tax liability provided the required information is timely furnished to the IRS.
Foreign Account Tax Compliance Act
The Foreign Account Tax Compliance Act (“FATCA”), imposes a 30% withholding tax on certain types of payments made to “foreign financial institutions” and other non-financial foreign entities (including in some
165
Table of Contents
cases, when such foreign financial entity or non-financial foreign entity is acting as an intermediary) unless certain due diligence, reporting, withholding and certification requirements are satisfied.
The Treasury has issued final regulations under FATCA. As a general matter, FATCA imposes a 30% withholding tax on dividends on, and the gross proceeds from the sale or other disposition of, our common stock if paid to a foreign entity unless:
| • | the foreign entity is a “foreign financial institution” that has entered into an agreement with the U.S. to implement FATCA, and the entity complies with the diligence and reporting requirements of such an agreement, including to withhold on certain payments and to collect and provide to U.S. taxing authorities substantial information on U.S. account holders; |
| • | the foreign entity is a “non-financial foreign entity” and certifies that it has no “substantial U.S. owners” or provides the applicable withholding agent with a certification identifying the direct and indirect substantial U.S. owners; or |
| • | the foreign financial institution or non-financial foreign entity otherwise is exempted under FATCA. |
An intergovernmental agreement between the U.S. and an applicable non-U.S. government may modify these rules. The withholding rules under FATCA generally apply with respect to dividends on our common stock and for dispositions that occur on or after January 1, 2019, with respect to gross proceeds from a sale or other disposition of our common stock.
Under certain circumstances, a non-U.S. holder might be eligible for refunds or credits of such withholding taxes by filing a U.S. federal income tax return (which may entail a significant administrative burden).
Prospective investors should consult their tax advisors regarding the effect of FATCA on their ownership and disposition of our common stock.
THIS SUMMARY IS FOR GENERAL INFORMATION ONLY AND IS NOT INTENDED TO CONSTITUTE A COMPLETE DESCRIPTION OF ALL U.S. FEDERAL INCOME TAX CONSEQUENCES FOR NON-U.S. HOLDERS RELATING TO THE PURCHASE, OWNERSHIP, AND DISPOSITION OF SHARES OF OUR COMMON stock. IF YOU ARE CONSIDERING THE PURCHASE OF SHARES OF OUR COMMON STOCK, YOU SHOULD CONSULT WITH YOUR TAX ADVISOR CONCERNING THE PARTICULAR U.S. FEDERAL INCOME TAX CONSEQUENCES TO YOU OF THE PURCHASE, OWNERSHIP AND DISPOSITION OF SHARES OF OUR COMMON STOCK, AS WELL AS THE CONSEQUENCES TO YOU ARISING UNDER U.S. TAX LAWS OTHER THAN THE FEDERAL INCOME TAX LAW DISCUSSED IN THIS SUMMARY OR UNDER THE LAWS OF ANY OTHER APPLICABLE TAXING JURISDICTION IN LIGHT OF YOUR PARTICULAR CIRCUMSTANCES.
166
Table of Contents
We are offering the shares of our common stock described in this prospectus in an underwritten offering in which we and Keefe, Bruyette & Woods, Inc., Raymond James & Associates, Inc. and Sandler O’Neill & Partners, L.P., as representatives for the underwriters named below, are entering into an underwriting agreement with respect to the shares of our common stock being offered hereby. Subject to certain conditions, we will agree to sell, and each underwriter will severally and not jointly agree to purchase the number of shares of our common stock indicated in the following table:
| Number of Shares |
||||
| Keefe, Bruyette & Woods, Inc. |
||||
| Raymond James & Associates, Inc. |
||||
| Sandler O’Neill & Partners, L.P. |
||||
|
|
|
|||
| Total |
||||
|
|
|
|||
The underwriters are offering the shares of our common stock subject to a number of conditions, including receipt and acceptance of our common stock by the underwriters. The obligations of the underwriters to pay for and accept delivery of the shares offered by this prospectus are subject to these conditions. The underwriting agreement between us and the underwriters provides that if any underwriter defaults, the purchase commitments of the non-defaulting underwriters may be increased or this offering may be terminated.
In connection with this offering, the underwriters or securities dealers may distribute offering documents to investors electronically. See “Underwriting—Electronic Distribution” below.
Underwriting Discount
Shares of our common stock sold by the underwriters to the public will be offered at the initial public offering price set forth on the cover of this prospectus. Any shares of our common stock sold by the underwriters to securities dealers may be sold at a discount of up to $[*]per share from the initial public offering price. Any of these securities dealers may resell any shares of our common stock purchased from the underwriters to other brokers or dealers at a discount of up to $[*] per share from the initial public offering price. If all of the shares of our common stock are not sold at the initial public offering price, the representatives may change the offering price and the other selling terms. Sales of shares of our common stock made outside of the U.S. may be made by affiliates of the underwriters. The underwriters reserve the right to reject an order for the purchase of shares, in whole or in part.
The underwriting fee is equal to the public offering price per share of common stock less the amount paid by the underwriters to us per share of common stock. The underwriting fee is $[*] per share. The following table shows the initial public offering price, underwriting discounts and commissions to be paid to the underwriters before expenses to us, assuming both no exercise and full exercise of the underwriters’ option to purchase additional shares.
| Per Share | Without Option | With Option | ||||||||||
| Public offering price |
||||||||||||
| Underwriting discounts and commissions |
||||||||||||
| Proceeds to us, before expenses |
||||||||||||
We estimate the expenses of this offering, not including the underwriting discount, to be approximately $[*] million, and such expenses are payable by us. We also have agreed to reimburse the underwriters for certain expenses incurred in connection with the offering in an amount up to $500,000, and fees and expenses of counsel for the underwriters with respect to blue sky, Financial Industry Regulatory Authority, Inc., or FINRA, and directed share program matters in an amount up to $15,000, without prior written consent.
167
Table of Contents
Option to Purchase Additional Shares
We have granted the underwriters an option to buy up to [*] additional shares of our common stock, at the initial public offering price less the underwriting discount. The underwriters may exercise this option, in whole or in part, from time to time for a period of 30 days from the date of this prospectus. If the underwriters exercise this option, each underwriter will be obligated, subject to the conditions in the underwriting agreement, to purchase a number of additional shares of our common stock proportionate to the number of shares reflected next to such underwriter’s name in the table above relative to the total number of shares reflected in such table.
Lock-Up Agreements
We, our executive officers, directors and the holders of more than [●]% of our currently outstanding shares of common stock, are entering into lock-up agreements with the underwriters. Under these agreements, we and each of these persons may not, without the prior written approval of the representatives and subject to certain exceptions:
| • | offer, pledge, sell, contract to sell, sell any option or contract to purchase, purchase any option or contract to sell, grant any option, right or warrant for the sale of, hypothecate, establish an open “put equivalent position” within the meaning of Rule 16a-1(h) of the Exchange Act, or otherwise dispose of or transfer any shares of our common stock or any securities convertible into or exchangeable or exercisable for our common stock, whether now owned or hereafter acquired or with respect to which such person has or hereafter acquires the power of disposition, or exercise any right with respect to the registration thereof, or file or cause to be filed any registration statement under the Securities Act, with respect to any of the foregoing; |
| • | enter into any swap, hedge, or any other agreement or any transaction that transfers, in whole or in part, directly or indirectly, the economic ownership of the shares of our common stock, whether any such swap or transaction is to be settled by delivery of shares of our common stock or other securities, in cash or otherwise; or |
| • | publicly disclose the intention to make any such offer, pledge, sale or disposition, or to enter into any such swap, hedge, transaction or other arrangement. |
These restrictions will be in effect for a period of 180 days after the date of the underwriting agreement. At any time and without public notice, the representatives may, in their sole discretion, waive or release all or some of the securities from these lock-up agreements. However, as to any of our executive officers or directors, the representatives have agreed to notify us at least three business days before the effective date of any release or waiver, and we have agreed to announce the impending release or waiver by press release through a major news service at least two business days before the effective date of the release or waiver.
In addition, the restrictions described above will not apply to certain transfers of the locked-up shares, so long as the transferee agrees in writing, among other things, to be bound by the terms of the lock-up agreement. Such transfers permitted under the lock-up agreement include, but are not limited to transfers of shares of our common stock:
| • | as a bona fide gift or gifts or by will or intestate succession; or |
| • | to any trust or family limited partnership for the benefit of the transferor or his or her immediate family, if such transfer does not involve a disposition for value. |
The lock-up restrictions also do not apply to transfers of shares of our common stock:
| • | to us to satisfy any tax withholding obligations upon the exercise or vesting of equity awards; or |
| • | pledged in a bona fide transaction that is in effect as of the date of the lock-up agreement to a lender. |
168
Table of Contents
These restrictions will apply to common stock owned now or acquired later by the person executing the agreement or for which the person executing the agreement later acquires the power of disposition. These restrictions also apply to securities convertible into or exchangeable or exercisable for or repayable with our common stock to the same extent as they apply to our common stock. They also apply to common stock owned now or later acquired by the person executing the agreement or for which the person executing the agreement later acquires the power of disposition.
Listing on the Nasdaq Global Market
Our common stock is presently quoted on the OTC Pink Market under the symbol “PFCF.” We have applied to list our common stock on the Nasdaq Global Market under the symbol “PCB.” Assuming that our common stock is listed for trading on the Nasdaq, the quoting of our shares on the OTC Pink Market will be discontinued upon or prior to the completion of this offering.
The initial public offering price will be determined through negotiations among us and the representative. In addition to prevailing market conditions, the factors to be considered in determining the initial public offering price are:
| • | the valuation multiples of publicly traded companies that the representative believes to be comparable to us, |
| • | our financial information, |
| • | the history of, and the prospects for, our company and the industry in which we compete, |
| • | an assessment of our management, its past and present operations, and the prospects for, and timing of, our future revenues, |
| • | the present state of our development, and |
| • | the above factors in relation to market values and various valuation measures of other companies engaged in activities similar to ours. |
An active trading market does not currently exist for our shares of common stock on the OTC Pink Market and an active trading market for our shares may not develop in the event our shares are approved for listing on the Nasdaq. It is also possible that after this offering the shares of our common stock will not trade in the public market at or above the initial public offering price or the price on which our shares of common stock have historically quoted on the OTC Pink Market.
Indemnification and Contribution
We have agreed to indemnify the underwriters and their affiliates, selling agents, and controlling persons against certain liabilities, including under the Securities Act. If we are unable to provide this indemnification, we will contribute to the payments the underwriters and their affiliates, selling agents, and controlling persons may be required to make in respect of those liabilities.
Stabilization
In connection with this offering, the underwriters may engage in stabilizing transactions, over-allotment transactions, syndicate covering transactions and penalty bids in accordance with Regulation M promulgated under the Exchange Act.
| • | Stabilizing transactions permit bids to purchase shares of common stock so long as the stabilizing bids do not exceed a specified maximum. |
| • | Over-allotment transactions involve sales by the underwriter of shares of common stock in excess of the number of shares the underwriter is obligated to purchase. This creates a syndicate short position that may |
169
Table of Contents
| be either a covered short position or a naked short position. In a covered short position, the number of shares of common stock over-allotted by the underwriter is not greater than the number of shares that it may purchase in the over-allotment option. In a naked short position, the number of shares involved is greater than the number of shares in the over-allotment option. The underwriters may close out any short position by exercising its over-allotment option and/or purchasing shares in the open market. |
| • | Syndicate covering transactions involve purchases of common stock in the open market after the distribution has been completed to cover syndicate short positions. In determining the source of shares to close out the short position, the underwriter will consider, among other things, the price of shares available for purchase in the open market as compared with the price at which it may purchase shares through exercise of the over-allotment option. If the underwriter sells more shares than could be covered by exercise of the over-allotment option and therefore has a naked short position, the position can be closed out only by buying shares in the open market. A naked short position is more likely to be created if the underwriter is concerned that after pricing there could be downward pressure on the price of the shares in the open market that could adversely affect investors who purchase in the offering. |
| • | Penalty bids permit the representative to reclaim a selling concession from a syndicate member when the common stock originally sold by that syndicate member is purchased in stabilizing or syndicate covering transactions to cover syndicate short positions. |
These stabilizing transactions, syndicate covering transactions and penalty bids may have the effect of raising or maintaining the market price of our common stock or preventing or retarding a decline in the market price of our common stock. As a result, the price of our common stock in the open market may be higher than it would otherwise be in the absence of these transactions. Neither we nor the underwriters make any representation or prediction as to the effect that the transactions described above may have on the price of our common stock. These transactions may be effected in the Nasdaq or otherwise and, if commenced, may be discontinued at any time.
Passive Market Making
In addition, in connection with this offering the underwriters and selected dealers, if any, who are qualified market makers on the Nasdaq may engage in passive market making transactions in our common stock on the Nasdaq in accordance with Rule 103 of Regulation M promulgated under the Exchange Act during a period before the commencement of offers or sales of common stock and extending through the completion of the distribution of this offering. In general, a passive market maker must display its bid at a price not in excess of the highest independent bid for the security. If all independent bids are lowered below the bid of the passive market maker, however, the bid must then be lowered when purchase limits are exceeded. Net purchases by a passive market maker on each day are limited to a specified percentage of the passive market maker’s average daily trading volume in the common stock during a specified period and must be discontinued when that limit is reached. Passive market making may cause the price of our common stock to be higher than the price that otherwise would exist in the open market in the absence of those transactions. The underwriters are not required to engage in passive market making and may end passive market making activities at any time.
Electronic Distribution
A prospectus in electronic format may be made available by e-mail or on the websites or through online services maintained by one or more of the underwriters or their affiliates. In those cases, prospective investors may view offering terms online and may be allowed to place orders online. The underwriters may agree with us to allocate a specific number of shares for sale to online brokerage account holders. Any such allocation for online distributions will be made by the underwriters on the same basis as other allocations. Other than the prospectus in electronic format, the information on the underwriters’ websites and any information contained on any other website maintained by any of the underwriters is not part of this prospectus, has not been approved and/or endorsed by the underwriters or us, and should not be relied upon by investors.
170
Table of Contents
Directed Share Program
At our request, the underwriters have reserved for sale, at the initial public offering price, up to [*]% of the shares of our common stock offered by this prospectus for sale to our directors, officers, employees, business associates, and related persons. Our directed share program will be administered by Keefe Bruyette & Woods or its affiliate. Reserved shares purchased by our directors and executive officers will be subject to the lock-up provisions described above. The number of shares of our common stock which may be sold to the general public in this offering will be reduced to the extent these persons purchase the reserved shares. Any reserved shares of our common stock that are not so purchased will be offered by the underwriters to the general public on the same terms as the other shares of common stock offered by this prospectus.
Other Relationships with the Underwriters
In the ordinary course of their business activities, the underwriters and their affiliates may make or hold a broad array of investments and actively trade debt and equity securities (or related derivative securities) and financial instruments (including bank loans) for their own account and for the accounts of their customers. Such investments and securities activities may involve securities and/or instruments of ours or our affiliates. The underwriters and their affiliates may also make investment recommendations and/or publish or express independent research views in respect of such securities or financial instruments and may hold, or recommend to clients that they acquire, long and/or short positions in such securities and instruments.
In addition, in connection with this offering, we have granted Keefe, Bruyette & Woods, Inc. a right of first refusal to act as our exclusive structuring agent, exclusive financial advisor, lead arranger, book-running lead managing underwriter, or exclusive initial purchaser or placement agent, as the case may be, or in any other similar capacity, in connection with certain transactions, including offerings of equity or debt securities. This right of first refusal extends for 12 months from the commencement of sales of our common stock in this offering. The terms of any such future engagement of Keefe, Bruyette & Woods, Inc. will be set forth in one or more separate agreements.
171
Table of Contents
The validity of the shares of common stock being offered by this prospectus will be passed upon for us by Stuart | Moore | Staub, San Luis Obispo, California. Norton Rose Fulbright US LLP, Dallas, Texas, is acting as counsel for the underwriters in connection with this offering.
The consolidated financial statements of Pacific City Financial Corporation and its subsidiary as of December 31, 2017 and 2016 and for each of the years in the two-year period ended December 31, 2017 have been included herein in reliance upon the report of Crowe LLP, independent registered public accounting firm, appearing elsewhere herein, given upon the authority of said firm as experts in accounting and auditing.
WHERE YOU CAN FIND MORE INFORMATION
We have filed with the SEC a registration statement on Form S-1 under the Securities Act with respect to our common stock offered hereby. This prospectus, which constitutes part of the registration statement, does not contain all of the information set forth in the registration statement or the exhibits or schedules filed therewith. Some items are omitted in accordance with the rules and regulations of the SEC. For further information about us and our common stock that we propose to sell in this offering, we refer you to the registration statement and the exhibits and schedules filed as a part of the registration statement. Statements or summaries in this prospectus as to the contents of any contract or other document referred to in this prospectus are not necessarily complete and, where that contract or document is filed as an exhibit to the registration statement, each statement or summary is qualified in all respects by reference to the exhibit to which the reference relates. You may read and copy the registration statement, including the exhibits and schedules to the registration statement, at the SEC’s Public Reference Room at 100 F Street, N.E., Room 1580, Washington, D.C. 20549. Please call the SEC at 1-800-SEC-0330 for further information on the operation of the Public Reference Room. Our filings with the SEC, including the registration statement, are also available to you for free on the SEC’s internet website at www.sec.gov.
Following the offering, we will become subject to the informational and reporting requirements of the Exchange Act and, in accordance with those requirements, will file reports and proxy and information statements and other information with the SEC. You will be able to inspect and copy these reports and proxy and information statements and other information at the addresses set forth above. We intend to furnish to our shareholders our annual reports containing our audited consolidated financial statements certified by an independent public accounting firm.
We also maintain an internet site at www.paccitybank.com. Information on, or accessible through, our website is not part of this prospectus.
172
Table of Contents
INDEX TO CONSOLIDATED FINANCIAL STATEMENTS OF
PACIFIC CITY FINANCIAL CORPORATION
| Page | ||||
| Contents |
||||
| Audited Consolidated Financial Statements |
||||
| F-2 | ||||
| F-3 | ||||
| Statements of Income for the years ended December 31, 2017 and 2016 |
F-4 | |||
| Statements of Comprehensive Income for the years ended December 31, 2017 and 2016 |
F-5 | |||
| Statements of Changes in Shareholders’ Equity for the years ended December 31, 2017 and 2016 |
F-6 | |||
| Statements of Cash Flows the years ended December 31, 2017 and 2016 |
F-7 | |||
| F-8 | ||||
| All financial statement schedules have been omitted as the required information either is not applicable or is included in the financial statements or related notes. |
||||
| Unaudited Consolidated Financial Statements |
||||
| Balance Sheets as of March 31, 2018 (Unaudited) and December 31, 2017 |
F-47 | |||
| Statements of Income (Unaudited) for the three months ended March 31, 2018 and 2017 |
F-48 | |||
| Statements of Comprehensive Income (Unaudited) for the three months ended March 31, 2018 and 2017 |
F-49 | |||
| F-50 | ||||
| Statements of Cash Flows (Unaudited) for the three months ended March 31, 2018 and 2017 |
F-51 | |||
| F-52 | ||||
F-1
Table of Contents

|
||
| Crowe LLP Independent Member Crowe Global |
REPORT OF INDEPENDENT REGISTERED PUBLIC ACCOUNTING FIRM
Shareholders and the Board of Directors of Pacific City Financial Corporation
Los Angeles, California
Opinion on the Financial Statements
We have audited the accompanying consolidated balance sheets of Pacific City Financial Corporation and Subsidiary (the “Company”) as of December 31, 2017 and 2016, the related consolidated statements of income, comprehensive income, changes in shareholders’ equity, and cash flows for each of the two years in the period ended December 31, 2017, and the related notes (collectively referred to as the “financial statements”). In our opinion, the financial statements present fairly, in all material respects, the financial position of the Company as of December 31, 2017 and 2016, and the results of its operations and its cash flows for each of the two years in the period ended December 31, 2017, in conformity with accounting principles generally accepted in the United States of America.
Basis for Opinion
These financial statements are the responsibility of the Company’s management. Our responsibility is to express an opinion on the Company’s financial statements based on our audits. We are a public accounting firm registered with the Public Company Accounting Oversight Board (United States) (“PCAOB”) and are required to be independent with respect to the Company in accordance with the U.S. federal securities laws and the applicable rules and regulations of the Securities and Exchange Commission and the PCAOB.
We conducted our audits in accordance with the standards of the PCAOB. Those standards require that we plan and perform the audit to obtain reasonable assurance about whether the financial statements are free of material misstatement, whether due to error or fraud. The Company is not required to have, nor were we engaged to perform, an audit of its internal control over financial reporting in accordance with the standards of the PCAOB. As part of our audits we are required to obtain an understanding of internal control over financial reporting but not for the purpose of expressing an opinion on the effectiveness of the Company’s internal control over financial reporting. Accordingly, we express no such opinion in accordance with the standards of the PCAOB.
Our audits included performing procedures to assess the risks of material misstatement of the financial statements, whether due to error or fraud, and performing procedures that respond to those risks. Such procedures included examining, on a test basis, evidence regarding the amounts and disclosures in the financial statements. Our audits also included evaluating the accounting principles used and significant estimates made by management, as well as evaluating the overall presentation of the financial statements. We believe that our audits provide a reasonable basis for our opinion.
/s/ Crowe LLP
We have served as the Company’s auditor since 2016.
Los Angeles, California
March 16, 2018
F-2
Table of Contents
PACIFIC CITY FINANCIAL CORPORATION AND SUBSIDIARY
December 31, 2017 and 2016
(in thousands, except share data)
| 2017 | 2016 | |||||||
| Assets | ||||||||
| Cash and due from banks |
$ | 16,662 | $ | 18,488 | ||||
| Interest-bearing deposits in financial institutions |
56,996 | 51,463 | ||||||
|
|
|
|
|
|||||
| Total cash and cash equivalents |
73,658 | 69,951 | ||||||
|
|
|
|
|
|||||
| Investment securities, available-for-sale at fair value |
129,689 | 82,838 | ||||||
| Investment securities, held-to-maturity at cost (fair value of $20,997 and $17,336 at December 31, 2017 and 2016) |
21,070 | 17,584 | ||||||
|
|
|
|
|
|||||
| Total investment securities |
150,759 | 100,422 | ||||||
|
|
|
|
|
|||||
| Loans held-for-sale |
5,297 | 2,150 | ||||||
| Loans, net of deferred loan costs (fees) |
1,189,999 | 1,031,112 | ||||||
| Less: allowance for loan losses |
(12,224 | ) | (11,320 | ) | ||||
|
|
|
|
|
|||||
| Net loans |
1,177,775 | 1,019,792 | ||||||
|
|
|
|
|
|||||
| Premises and equipment, net |
4,723 | 4,563 | ||||||
| Federal Home Loan Bank and other restricted stock, at cost |
6,589 | 5,686 | ||||||
| Other real estate owned, net of valuation allowance |
99 | 506 | ||||||
| Deferred tax assets, net |
3,847 | 5,254 | ||||||
| Servicing assets |
8,973 | 8,302 | ||||||
| Accrued interest receivable and other assets |
10,279 | 10,016 | ||||||
|
|
|
|
|
|||||
| Total assets |
$ | 1,441,999 | $ | 1,226,642 | ||||
|
|
|
|
|
|||||
| Liabilities and Shareholders’ Equity | ||||||||
| Deposits: |
||||||||
| Noninterest-bearing demand |
$ | 319,026 | $ | 274,003 | ||||
| Savings, NOW and money market accounts |
317,878 | 319,929 | ||||||
| Time deposits under $250,000 |
347,774 | 291,557 | ||||||
| Time deposits $250,000 and over |
266,612 | 206,323 | ||||||
|
|
|
|
|
|||||
| Total deposits |
1,251,290 | 1,091,812 | ||||||
| Borrowings from Federal Home Loan Bank |
40,000 | — | ||||||
| Accrued interest payable and other liabilities |
8,525 | 7,823 | ||||||
|
|
|
|
|
|||||
| Total liabilities |
1,299,815 | 1,099,635 | ||||||
|
|
|
|
|
|||||
| Commitments and contingent liabilities |
— | — | ||||||
| Shareholders’ Equity: |
||||||||
| Common stock, 60,000,000 shares authorized, no par value; issued and outstanding 13,417,899 shares as of December 31, 2017 and 13,391,222 as of December 31, 2016, respectively |
125,430 | 125,094 | ||||||
| Additional paid-in capital |
2,941 | 2,444 | ||||||
| Retained earnings |
15,036 | — | ||||||
| Accumulated other comprehensive loss, net |
(1,223 | ) | (531 | ) | ||||
|
|
|
|
|
|||||
| Total shareholders’ equity |
142,184 | 127,007 | ||||||
|
|
|
|
|
|||||
| Total liabilities and shareholders’ equity |
$ | 1,441,999 | $ | 1,226,642 | ||||
|
|
|
|
|
|||||
| Commitments and contingencies |
||||||||
See accompanying notes to consolidated financial statements.
F-3
Table of Contents
PACIFIC CITY FINANCIAL CORPORATION AND SUBSIDIARY
Consolidated Statements of Income
Years ended December 31, 2017 and 2016
(in thousands, except share data)
| 2017 | 2016 | |||||||
| Interest income: |
||||||||
| Interest and fees on loans |
$ | 61,516 | $ | 50,058 | ||||
| Interest on tax-exempt investment securities |
186 | 147 | ||||||
| Interest on investment securities |
2,428 | 1,594 | ||||||
| Interest on federal funds sold and other |
1,137 | 796 | ||||||
|
|
|
|
|
|||||
| Total interest income |
65,267 | 52,595 | ||||||
|
|
|
|
|
|||||
| Interest expense: |
||||||||
| Interest on deposits |
9,749 | 7,009 | ||||||
| Interest on other borrowings |
348 | 5 | ||||||
|
|
|
|
|
|||||
| Total interest expense |
10,097 | 7,014 | ||||||
|
|
|
|
|
|||||
| Net interest income |
55,170 | 45,581 | ||||||
| Provision for loan losses |
1,827 | 2,283 | ||||||
|
|
|
|
|
|||||
| Net interest income after provision for loan losses |
53,343 | 43,298 | ||||||
|
|
|
|
|
|||||
| Noninterest income: |
||||||||
| Service charges and fees on deposits |
1,377 | 1,457 | ||||||
| Servicing income |
2,446 | 2,159 | ||||||
| Gain on sale of loans |
9,000 | 8,912 | ||||||
| Other income |
1,071 | 1,091 | ||||||
|
|
|
|
|
|||||
| Total noninterest income |
13,894 | 13,619 | ||||||
|
|
|
|
|
|||||
| Noninterest expense: |
||||||||
| Salaries and employee benefits |
22,829 | 19,944 | ||||||
| Occupancy and equipment expenses |
4,426 | 4,337 | ||||||
| Other expenses |
8,640 | 8,233 | ||||||
|
|
|
|
|
|||||
| Total noninterest expense |
35,895 | 32,514 | ||||||
|
|
|
|
|
|||||
| Income before income taxes |
31,342 | 24,403 | ||||||
| Income tax expense |
14,939 | 10,401 | ||||||
|
|
|
|
|
|||||
| Net income |
$ | 16,403 | $ | 14,002 | ||||
|
|
|
|
|
|||||
| Earnings per share available to common shareholders, basic |
$ | 1.22 | $ | 1.12 | ||||
| Earnings per share available to common shareholders, diluted |
$ | 1.21 | $ | 1.11 | ||||
| Weighted-average common shares outstanding, basic |
13,408,030 | 12,532,807 | ||||||
| Weighted-average common shares outstanding, diluted |
13,540,293 | 12,607,990 | ||||||
See accompanying notes to consolidated financial statements.
F-4
Table of Contents
PACIFIC CITY FINANCIAL CORPORATION AND SUBSIDIARY
Consolidated Statements of Comprehensive Income
Years ended December 31, 2017 and 2016
(in thousands)
| 2017 | 2016 | |||||||
| Net income |
$ | 16,403 | $ | 14,002 | ||||
| Other comprehensive loss: |
||||||||
| Unrealized loss on available-for-sale securities |
(778 | ) | (245 | ) | ||||
| Add:reclassification adjustment for net gain included in net income |
— | 8 | ||||||
| Income tax benefit related to items of other comprehensive income |
328 | 102 | ||||||
|
|
|
|
|
|||||
| Total other comprehensive loss, net of tax |
(450 | ) | (135 | ) | ||||
|
|
|
|
|
|||||
| Total Comprehensive Income |
$ | 15,953 | $ | 13,867 | ||||
|
|
|
|
|
|||||
See accompanying notes to consolidated financial statements.
F-5
Table of Contents
PACIFIC CITY FINANCIAL CORPORATION AND SUBSIDIARY
Consolidated Statements of Changes in Shareholders’ Equity
Years ended December 31, 2017 and 2016
(in thousands, except share data)
| Common stock | Additional paid-in capital |
Retained earnings |
Accumulated other comprehensive loss |
Total | ||||||||||||||||||||
| Shares outstanding |
Amount | |||||||||||||||||||||||
| Balance at January 1, 2016 |
11,865,145 | $ | 96,074 | $ | 2,362 | $ | — | $ | (396 | ) | $ | 98,040 | ||||||||||||
| Share-based compensation |
— | — | 717 | — | — | 717 | ||||||||||||||||||
| Stock option exercises |
125,921 | 1,206 | (635 | ) | — | — | 571 | |||||||||||||||||
| Retirement of fractional shares |
(144 | ) | (2 | ) | — | — | — | (2 | ) | |||||||||||||||
| Dividends paid on common stock |
— | — | — | (1,380 | ) | — | (1,380 | ) | ||||||||||||||||
| Issuance of common stock through private placement memorandum, net |
1,400,300 | 15,194 | — | — | — | 15,194 | ||||||||||||||||||
| Retroactive adjustment for stock dividend declared on December 13, 2016 |
— | 12,622 | — | (12,622 | ) | — | — | |||||||||||||||||
| Net income |
— | — | — | 14,002 | — | 14,002 | ||||||||||||||||||
| Other comprehensive loss, net of tax |
— | — | — | — | (135 | ) | (135 | ) | ||||||||||||||||
|
|
|
|
|
|
|
|
|
|
|
|
|
|||||||||||||
| Balance at December 31, 2016 |
13,391,222 | $ | 125,094 | $ | 2,444 | $ | — | $ | (531 | ) | $ | 127,007 | ||||||||||||
| Share-based compensation |
— | — | 699 | — | — | 699 | ||||||||||||||||||
| Stock option exercises |
26,811 | 338 | (202 | ) | — | — | 136 | |||||||||||||||||
| Retirement of fractional shares |
(134 | ) | (2 | ) | — | — | — | (2 | ) | |||||||||||||||
| Dividends paid on common stock |
— | — | (1,609 | ) | — | (1,609 | ) | |||||||||||||||||
| Net income |
— | — | — | 16,403 | — | 16,403 | ||||||||||||||||||
| Reclassification of the disproportionate tax effect |
— | — | — | 242 | (242 | ) | — | |||||||||||||||||
| Other comprehensive loss, net of tax |
— | — | — | — | (450 | ) | (450 | ) | ||||||||||||||||
|
|
|
|
|
|
|
|
|
|
|
|
|
|||||||||||||
| Balance at December 31, 2017 |
13,417,899 | $ | 125,430 | $ | 2,941 | $ | 15,036 | $ | (1,223 | ) | $ | 142,184 | ||||||||||||
|
|
|
|
|
|
|
|
|
|
|
|
|
|||||||||||||
See accompanying notes to consolidated financial statements.
F-6
Table of Contents
PACIFIC CITY FINANCIAL CORPORATION AND SUBSIDIARY
Consolidated Statements of Cash Flows
Years ended December 31, 2017 and 2016
(in thousands)
| 2017 | 2016 | |||||||
| Operating activities: |
||||||||
| Net income |
$ | 16,403 | $ | 14,002 | ||||
| Adjustments to reconcile net income to net cash and cash equivalents provided by operating activities: |
||||||||
| Depreciation and amortization of premises and equipment |
1,120 | 1,030 | ||||||
| Amortization of net premiums on securities |
818 | 711 | ||||||
| Amortization of servicing assets |
2,233 | 2,055 | ||||||
| Provision for loan losses |
1,827 | 2,283 | ||||||
| Stock-based compensation |
699 | 717 | ||||||
| Gain on sale of securities |
— | (8 | ) | |||||
| Loans originated for sale |
(143,119 | ) | (145,446 | ) | ||||
| Proceeds from sale of loans held-for-sale |
151,972 | 176,313 | ||||||
| Loss on sale of and impairment write-down of OREO |
20 | — | ||||||
| Gain on sale of loans |
(9,000 | ) | (8,912 | ) | ||||
| Loss on sale of premises and equipment |
— | 1 | ||||||
| Deferred tax expense |
1,733 | 39 | ||||||
| Net change in: |
||||||||
| Accrued interest receivable and other assets |
(263 | ) | (4,734 | ) | ||||
| Accrued interest payable and other liabilities |
800 | 2,785 | ||||||
|
|
|
|
|
|||||
| Net cash provided by operating activities |
25,243 | 40,836 | ||||||
|
|
|
|
|
|||||
| Investing activities: |
||||||||
| Purchases of securities, available-for-sale |
(66,866 | ) | (20,399 | ) | ||||
| Proceeds from sale of securities, available-for-sale |
— | 4,717 | ||||||
| Maturities, calls, and paydowns of securities, available-for-sale |
18,558 | 16,929 | ||||||
| Purchases of securities, held-to-maturity |
(6,106 | ) | (2,611 | ) | ||||
| Maturities and paydowns of securities, held-to-maturity |
2,481 | 2,193 | ||||||
| Net change in loans |
(165,713 | ) | (212,675 | ) | ||||
| Proceeds from sale of OREO |
291 | — | ||||||
| Purchase of Federal Home Loan Bank and other restricted stock |
(903 | ) | (764 | ) | ||||
| Purchases of premises and equipment |
(1,281 | ) | (1,981 | ) | ||||
|
|
|
|
|
|||||
| Net cash used in investing activities |
(219,539 | ) | (214,591 | ) | ||||
|
|
|
|
|
|||||
| Financing activities: |
||||||||
| Net increase in deposits |
159,478 | 152,373 | ||||||
| Proceeds from FHLB borrowings |
40,000 | — | ||||||
| Common stock dividend payments |
(1,609 | ) | (1,380 | ) | ||||
| Issuance of common stock pursuant to stock option plan, net |
134 | 569 | ||||||
| Issuance of common stock through private placement memorandum, net |
— | 15,194 | ||||||
|
|
|
|
|
|||||
| Net cash provided by financing activities |
198,003 | 166,756 | ||||||
|
|
|
|
|
|||||
| Increase (Decrease) in cash and cash equivalents |
3,707 | (6,999 | ) | |||||
| Cash and cash equivalents at beginning of year |
69,951 | 76,950 | ||||||
|
|
|
|
|
|||||
| Cash and cash equivalents at end of year |
$ | 73,658 | $ | 69,951 | ||||
|
|
|
|
|
|||||
| Supplemental disclosures of cash flow information: |
||||||||
| Interest paid |
$ | 9,465 | $ | 6,872 | ||||
| Income taxes paid |
12,056 | 11,582 | ||||||
| Supplemental disclosures of noncash investment activities: |
||||||||
| Loans transferred to other real estate owned |
$ | — | $ | 506 | ||||
| Loans transferred to loans held for sale |
— | 22,051 | ||||||
See accompanying notes to consolidated financial statements.
F-7
Table of Contents
PACIFIC CITY FINANCIAL CORPORATION AND SUBSIDIARY
Notes to Consolidated Financial Statements
December 31, 2017 and 2016
Note 1—Summary of Significant Accounting Policies
Nature of operations
Pacific City Financial Corporation operates Pacific City Bank (“the Bank”). Pacific City Bank has been organized as a single operating segment and operates eleven (11) full-service branches in Los Angeles and Orange counties, California, one (1) full-service branch in each of Fort Lee, New Jersey and Bayside, New York, and ten (10) loan production offices in Irvine, California; Los Angeles, California; Lynnwood, Washington; Annandale, Virginia; Chicago, Illinois; Atlanta, Georgia; Bellevue, Washington; Aurora, Colorado; Carrollton, Texas; and New York, New York. The Bank’s primary source of revenue is providing loans to customers, who are predominantly small and middle market businesses and individuals. The Bank offers a broad range of loan, deposit, and other products and services.
Principles of consolidation
The consolidated financial statements include the accounts of Pacific City Financial Corporation and its wholly owned subsidiary, Pacific City Bank, collectively referred to herein as “the Company.” All significant intercompany transactions have been eliminated. The accounting and reporting policies of the Company conforms to accounting principles generally accepted in the United States of America (“US GAAP”) and to prevailing practices within the banking industry.
Pacific City Financial Corporation has no significant business activities other than its investment in Pacific City Bank. Financial information for Pacific City Financial Corporation is provided in Note 19.
Use of estimates in the preparation of financial statements
The preparation of the consolidated financial statements in conformity with US GAAP requires management to make estimates and assumptions that affect the reported amounts of assets and liabilities, disclosure of contingent assets and liabilities at the date of the consolidated financial statements, and the reported amounts of revenues and expenses during the reporting period. Actual results may differ from those estimates.
Cash Flows
For purposes of reporting cash flows, cash and cash equivalents include cash, due from banks, interest-bearing deposits in financial institutions, and federal funds sold. Generally, federal funds are sold for an one-day period and interest-bearing deposits have original maturities of less than 90 days. Net cash flows are reported for customer loan and deposit transactions.
Cash and cash equivalents
Banking regulations require that banks maintain a percentage of their deposits as reserves in cash or on deposit with the Federal Reserve Bank (“FRB”). The reserve and clearing requirement balance was $0 at December 31, 2017 and December 31, 2016.
The Company maintains amounts due from banks, which may exceed federally insured limits. The Company has not experienced any losses in such accounts.
F-8
Table of Contents
PACIFIC CITY FINANCIAL CORPORATION AND SUBSIDIARY
Notes to Consolidated Financial Statements
December 31, 2017 and 2016
Investment securities
Investment securities are classified as trading, held-to-maturity, or available-for-sale at the time of purchase based upon the intent of management, liquidity and capital requirements, regulatory limitations and other relevant factors. Debt securities that the management has the positive intent and ability to hold to maturity is classified as held-to-maturity securities. Debt securities are classified as available for sale when they might be sold before maturity. Securities classified as held-to-maturity are carried at amortized cost and securities classified as available-for-sale are carried at fair value with unrealized gains and losses reported in other comprehensive income. The Company does not have any securities classified as trading securities as of December 31, 2017 and December 31, 2016.
Gains and losses on sales of securities are determined using the specific identification method. Net realized gains or losses on available-for-sale securities are included in noninterest income and, when applicable, are reported as a reclassification adjustment, net of tax, in other comprehensive income. The amortization of premiums and accretion of discounts are recognized in interest income using methods approximating the interest method over the period to maturity.
Management evaluates securities for other-than-temporary impairment (“OTTI”) at least on a quarterly basis, and more frequently when economic or market conditions warrant such an evaluation. For securities in an unrealized loss position, management considers the extent and duration of the unrealized loss, and the financial condition and near-term prospects of the issuer. Management also assesses whether it intends to sell, or it is more likely than not that it will be required to sell, a security in an unrealized loss position before recovery of its amortized cost basis. If either of the criteria regarding intent or requirement to sell is met, the entire difference between amortized cost and fair value is recognized as impairment through earnings. For debt securities that do not meet the aforementioned criteria, the amount of impairment is split into two components as follows: OTTI related to credit loss, which is recognized as a charge against earnings, and OTTI related to other factors, which is recognized in other comprehensive income, net of tax. The credit loss is defined as the difference between the present value of the cash flows expected to be collected and the amortized cost basis. For equity securities, the entire amount of impairment is recognized through earnings.
Loans held-for-sale
Small Business Administration (“SBA”) and mortgage loans originated and held-for-sale in the secondary market are carried at the lower of cost or estimated fair value in the aggregate. Fair value is based on commitments on hand from investors or prevailing market prices. Direct loan origination costs and fees are deferred at origination of the loan and unrecognized loan costs and fees are recognized as noninterest income upon sale of the loan. Unrealized losses, if any, are recognized through a valuation allowance with charges made to income. Loans transferred to the held-for-sale category are transferred at the lower of cost or fair value, as determined at the individual loan level, with charges made to the allowance for loan losses at transfer. Increases in fair value are not recognized until the loans are sold.
Realized gains and losses on sales of loans are based upon specific identification of the loan sold and included in noninterest income. For certain sales, the loan servicing rights are retained and recorded at fair value at sale as servicing assets.
F-9
Table of Contents
PACIFIC CITY FINANCIAL CORPORATION AND SUBSIDIARY
Notes to Consolidated Financial Statements
December 31, 2017 and 2016
Loans
Loans receivable that management has the intent and ability to hold for the foreseeable future are reported at their outstanding unpaid principal balances, net of any charge-offs or specific valuation accounts, deferred fees or costs on originated loans, or unamortized premiums or discounts on purchased loans. Loan origination fees and certain direct origination costs are capitalized and recognized as an adjustment of the yield of the related loan. Interest income is accrued as earned.
Loan portfolio segments identified by the Company include real estate, commercial and industrial, and consumer loans. Relevant risk characteristics for these portfolio segments generally include debt service coverage, loan-to-value ratios and financial performance for non-consumer related loans, and credit scores, debt-to-income, collateral type, and loan-to-value ratios for consumer-related loans.
Loans on which the accrual of interest has been discontinued are designated as nonaccrual loans. The accrual of interest on all loans is discontinued when principal or interest is 90 days past due based on the contractual terms of the loan or when, in the opinion of management, there is reasonable doubt as to collectability. When loans are placed on nonaccrual status, all interest previously accrued but not collected is reversed against current period interest income. Interest payments that are subsequently received are applied as a reduction to the remaining principal balance as long as concern exists as to the collectability of the principal. Interest accruals are resumed on such loans only when they are brought current with respect to interest and principal and when, in the judgment of management, the loans are estimated to be fully collectable as to all principal and interest.
Allowance for loan losses
The allowance for loan losses is a valuation allowance for probable incurred credit losses. Loan losses are charged against the allowance when management believes the loan is uncollectible. Subsequent recoveries, if any, are credited to the allowance. Management estimates the allowance balance required using past loan loss experience, the nature and volume of the portfolio, information about specific borrower situations and estimated collateral values, economic conditions, and other factors. Allocations of the allowance may be made for specific loans, but the entire allowance is available for any loan that, in management’s judgment, should be charged-off.
Amounts are charged-off when available information confirms that specific loans or portions thereof, are uncollectible. Generally, loans are charged off immediately when it is determined that advances to the borrower are in excess of the calculated current fair value of the collateral and if a borrower is deemed incapable of repayment of unsecured debt, there is little or no prospect for near term improvement and no realized strengthening action of significance pending. Consumer loans are charged off based on delinquency or earlier when it is determined that the loan is uncollectible due to a triggering event, such as bankruptcy, fraud, or death. This methodology for determining charge-offs is consistently applied to each segment.
The allowance consists of general and specific reserves. General reserves cover non-impaired loans and are based on historical loss rates over the most recent four years for each portfolio segment, adjusted for the effects of qualitative or environmental factors that are likely to cause estimated credit losses as of the evaluation date to differ from the portfolio segment’s historical loss experience.
The Company utilizes a migration analysis to measure actual historical loss experience, with the resulting historical loss rate adjusted for any applicable loss emergence period factors serving as the base loss rate to estimate the amount of appropriate loss reserve.
F-10
Table of Contents
PACIFIC CITY FINANCIAL CORPORATION AND SUBSIDIARY
Notes to Consolidated Financial Statements
December 31, 2017 and 2016
Qualitative factors include consideration of the following: changes in lending policies and procedures; changes in economic conditions; changes in the nature and volume of the portfolio; changes in the experience, ability, and depth of lending management and other relevant staff; changes in the volume and severity of past due, nonaccrual, and other adversely graded loans; changes in the loan review system; changes in the value of the underlying collateral for collateral-dependent loans; concentrations of credit and the effect of other external factors such as competition and legal and regulatory requirements.
Specific reserves relate to loans that are individually classified as impaired. A loan is impaired when, based on current information and events, it is probable that the Company will be unable to collect all amounts due according to the contractual terms of the loan agreement. Factors considered in determining impairment include payment status, collateral value, and the probability of collecting all amounts when due. Measurement of impairment is based on the expected future cash flows of an impaired loan, which are to be discounted at the loan’s effective interest rate, or measured by reference to an observable market value, if one exists, or the fair value of the collateral for a collateral-dependent loan. The Company selects the measurement method on a loan-by-loan basis, with the exception of collateral-dependent loans for which the most viable source of repayment is the continued operation of the collateral or liquidation of the collateral. The impairment for these loans are measured at the fair value of the collateral, less estimated selling cost.
If a loan is impaired, the loan is reported, net of the allocated allowance, at the present value of estimated future cash flows using the loan’s effective interest rate or at the fair value of collateral if repayment is expected solely from the collateral.
Interest payments received on impaired loans are first applied to principal, then recognized as income based on existing methods to recognize income on nonaccrual loans. Loans for which the terms have been modified resulting in a concession, and for which the borrower is experiencing financial difficulties, are considered troubled debt restructurings (“TDR”) and classified as impaired with measurement of impairment as described above.
Premises and equipment
Premises and equipment are carried at cost less accumulated depreciation and amortization. Depreciation is computed using the straight-line method over the estimated useful lives, which ranges from three to seven years for furniture and equipment. Leasehold improvements are amortized using the straight-line method over the estimated useful lives of the improvements or the remaining lease term, whichever is shorter. Expenditures for betterments or major repairs are capitalized and those for ordinary repairs and maintenance are charged to operations as part of occupancy and equipment expense as incurred.
Other real estate owned
Other real estate owned (“OREO”) represents properties acquired through foreclosure or other proceedings. OREO is held-for-sale and is recorded at the lower of the recorded amount of the loan or fair value of the properties, less estimated costs of disposal. Any write-down to fair value at the time of transfer to OREO is charged to the allowance for loan losses. Property is evaluated regularly to ensure the recorded amount is supported by its current fair value and valuation allowances to reduce the carrying amounts to fair value less estimated costs to dispose are recorded as necessary. Additions to or reductions from valuation allowances are recorded in noninterest expense.
F-11
Table of Contents
PACIFIC CITY FINANCIAL CORPORATION AND SUBSIDIARY
Notes to Consolidated Financial Statements
December 31, 2017 and 2016
Federal home loan bank stock and other restricted stock
The Bank is a member of the Federal Home Loan Bank (“FHLB”) and Pacific Coast Bankers’ Bancshares “PCBB” system. Members are required to own a certain amount of stock based on the level of borrowings and other factors, and may invest in additional amounts. FHLB stock and PCBB stock is carried at cost, classified as a restricted security, and periodically evaluated for impairment based on the ultimate recovery of par value. Both cash and stock dividends are reported as income.
Qualified affordable housing projects
The Company invested in qualified affordable housing projects (low income housing) in January 2016. The Company uses the proportional amortization method and the amortization expense is presented as a component of the income tax provision. The Company determined that there were no events or changes in circumstances indicating that it is more likely than not that the carrying amount of the investment will not be realized. Therefore, no impairment was recognized as of December 31, 2017 and 2016. The investment in low income housing was $2.7 million and $3.1 million, respectively, as of December 31, 2017 and 2016 and unfunded commitments related to these low income housing investments was $2.0 million and $2.7 million, respectively, as of December 31, 2017 and 2016. Those were included in other assets and other liabilities, respectively, in the Company’s balance sheet. As a component of income tax expense, the Company recognized amortizations of $219 thousand and $54 thousand, respectively, during the years ended December 31, 2017 and 2016 and tax credits and other benefits received from the tax expenses was $229 thousand and $59 thousand, respectively, for the year ended December 31, 2017 and 2016.
Servicing assets
Servicing assets are recognized as separate assets when servicing rights are retained following the sale of loans, and are initially recorded at fair value. Fair value is based on a valuation model that calculates the present value of estimated future cash flows from the servicing assets. The valuation model uses assumptions based on current market sources, such as the cost to service, discount rates, and prepayment speeds. The Company validates the valuation model inputs and results with published industry data. All classes of servicing assets are subsequently measured using the amortization method, which requires servicing assets to be amortized into noninterest income in proportion to, and over the period of, the estimated future net servicing income of the underlying loans.
Servicing assets are evaluated for impairment based upon the fair value of the rights as compared to the carrying amount. Impairment is determined by stratifying rights into groupings based on predominant risk characteristics, such as interest rate, loan type, and investor type. For purposes of measuring impairment, the Company has identified each servicing asset with the underlying loan being serviced. A valuation allowance is recorded when the fair value is below the carrying amount of the asset. If the Company later determines that all or a portion of the impairment no longer exists for a particular grouping, a reduction of the allowance may be recorded as an increase to income. The fair values of servicing assets are subject to significant fluctuations as a result of changes in estimated and actual prepayment speeds and changes in discount rates.
Servicing income as reported on the income statement consists of fees earned for servicing loans, net of the amortization of servicing assets and changes in the valuation allowance. The servicing fees are based on a contractual percentage of the outstanding principal and recorded as income when earned.
F-12
Table of Contents
PACIFIC CITY FINANCIAL CORPORATION AND SUBSIDIARY
Notes to Consolidated Financial Statements
December 31, 2017 and 2016
Earnings per common share
Basic earnings per common share (“EPS”) excludes dilution and is computed by dividing income available to common stockholders by the weighted average number of common shares outstanding for the period. Diluted EPS reflects the potential dilution that could occur if options or other contracts to issue common stock were exercised or converted into common stock, or resulted in the issuance of common stock that then shared in the earnings of the entity.
Transfer of financial assets
Transfers of financial assets are accounted for as sales, when control over the assets has been relinquished. Control over transferred assets is deemed to be surrendered when the assets have been isolated from the Company, the transferee obtains the right (free of conditions that constrain it from taking advantage of that right) to pledge or exchange the transferred assets, and the Company does not maintain effective control over the transferred assets through an agreement to repurchase them before their maturity.
Stock-based compensation
The Company recognizes the cost of employee services received in exchange for awards of stock options, or other equity instruments, based on the grant date fair value of those awards. This cost is recognized in income over the period which an employee is required to provide services in exchange for the award, generally the vesting period. See Note 11 for additional information on the Company’s stock option plan.
Income taxes
Income taxes are accounted for under the asset and liability method. Deferred tax assets and liabilities are recognized for the future tax consequences attributable to differences between the consolidated financial statement carrying amounts of existing assets and liabilities and their respective tax bases. Deferred tax assets and liabilities are measured using enacted tax rates expected to apply to taxable income in the years in which those temporary differences are expected to be recovered or settled. The effect on deferred tax assets and liabilities of a change in tax rates is recognized in income in the period that includes the enactment date. A valuation allowance is established to reduce the deferred tax asset to the level at which it is more likely than not that the tax asset or benefits will be realized. Realization of tax benefits of deductible temporary differences and operating loss carry-forward depends on having sufficient taxable income of an appropriate character within the carry-forward periods.
The Company has adopted guidance issued by the Financial Accounting Standards Board (“FASB”) Accounting Standards Codification (“ASC”) 740-10, Income Taxes—Overall that clarifies the accounting for uncertainty in tax positions taken or expected to be taken on a tax return and provides that the tax effects from an uncertain tax position can be recognized in the consolidated financial statements only if, based on its merits, the position is more likely than not to be sustained on audit by taxing authorities. Interest and penalties related to uncertain tax positions are recorded as part of income tax expense.
The Company recognizes interest and/or penalties related to income tax matters in income tax expense.
The Company has elected to early adopt FASB ASU 2018-02, Income Statement—Reporting Comprehensive Income as of and for the year ended December 31, 2017, which allows entities to reclassify the stranded tax
F-13
Table of Contents
PACIFIC CITY FINANCIAL CORPORATION AND SUBSIDIARY
Notes to Consolidated Financial Statements
December 31, 2017 and 2016
effects as a result of applying the US Tax Cuts and Jobs Act from accumulated other comprehensive income (AOCI) to retained earnings.
Commitments and contingencies
In the ordinary course of business, the Company enters into off-balance-sheet financial instruments consisting of commitments to extend credit, commercial letters of credit, and standby letters of credit as described in Note 16. Such financial instruments are recorded in the consolidated financial statements when they are funded or related fees are incurred or received.
Fair value measurement
Fair value is the exchange price that would be received for an asset or paid to transfer a liability (i.e., an exit price) in the principal or most advantageous market for the asset or liability in an orderly transaction between market participants on the measurement date. Current accounting guidance establishes a fair value hierarchy, which requires an entity to maximize the use of observable inputs when measuring fair value. The guidance describes three levels of inputs that may be used to measure fair value:
Level 1: Quoted prices (unadjusted) in active markets for identical assets or liabilities that the entity has the ability to access as of the measurement date
Level 2: Significant other observable inputs other than Level 1 prices such as quoted prices for similar assets or liabilities; quoted prices in markets that are not active; or other inputs that are observable or can be corroborated by observable market data
Level 3: Significant unobservable inputs that reflect the Company’s own assumptions about the assumptions that market participants would use in pricing an asset or liability
See Note 17 for more information and disclosures relating to the Company’s fair value measurements.
Reclassifications
Some items in the prior year financial statements were reclassified to conform to the current presentation. Reclassification had no effect on prior year net income or members’ equity.
Recently issued accounting standards
FASB ASU No. 2014-09, Revenue from Contracts with Customers (Topic 606): ASU 2014-09 supersedes Topic 605—Revenue Recognition and most industry specific guidance. The core principal of the guidance is that an entity should recognize revenue to depict the transfer of promised goods or services to customers in an amount that reflects the consideration to which the entity expects to be entitled in exchange for those goods or services. To achieve that core principle, an entity should apply the following steps: (i) identify the contract(s) with a customer; (ii) identify the performance obligations in the contract; (iii) determine the transaction price; (iv) allocate the transaction price to the performance obligations in the contract; (v) recognize revenue when (or as) the entity satisfies a performance obligation. The guidance also specifies the accounting for some costs to obtain or fulfill a contract with a customer. The amended disclosure guidance requires sufficient information to enable users of financial statements to understand the nature, amount, timing, and uncertainty of revenue and cash flows arising from contracts with customers. FASB ASU No. 2015-14, Revenue from Contracts with
F-14
Table of Contents
PACIFIC CITY FINANCIAL CORPORATION AND SUBSIDIARY
Notes to Consolidated Financial Statements
December 31, 2017 and 2016
Customers (Topic 606): Deferral of the Effective Date defers by one year the effective dates of the revenue recognition standard ASU 2014-09. As a result, the standard would be effective for public entities for annual reporting periods, and interim periods within those annual periods, beginning after December 15, 2017. The effective date for all other entities would be annual periods, and interim periods therein, beginning after December 15, 2018. The Company adopted this guidance on January 1, 2018. The Company completed its analysis for determining the extent ASU 2014-09 will affect its noninterest income, primarily in the area of fees and service charges on deposit accounts and trade finance activities. Based on the analysis performed, the Company did not have a material change in the timing or measurement of revenues related to noninterest income. The Company will continue to evaluate the effect that this guidance will have on other revenue streams within its scope, as well as changes in disclosures required by the new guidance. However, the Company does not expect this to have a material impact on its consolidated financial statements.
FASB ASU No. 2016-01, Financial Instruments-Overall (Subtopic 825-10): Recognition and Measurements of Financial Assets and Financial Liabilities. The amendments require equity investments (except those accounted for under the equity method of accounting, or those that result in consolidation of the investee) to be measured at fair value with changes in fair value recognized in net income. The new guidance becomes effective for fiscal years beginning after December 15, 2017. The Company adopted this guidance on January 1, 2018 and the adoption of ASU 2016-01 did not have a material impact on the Company’s consolidated financial statements.
FASB ASU 2016-02, Leases: This amendments in ASU 2016-02 requires lessees to recognize lease assets and lease liabilities for both leases classified as operating leases and finance leases, except leases with a term of 12 months or less where lessees is permitted to make an accounting policy election by class of underlying asset not to recognize lease assets and lease liabilities. For leases with a term of greater than 12 months, lessees are required to recognize a liability to make lease payments and a right-of-use (ROU) assets representing its right to use the underlying asset for the lease term measured at the present value of the lease payments. This change is effective for fiscal years beginning after December 15, 2018, including interim periods within those fiscal years for a public business entity and all other entities, the amendments in the update are effective for fiscal years beginning after December 15, 2019, and interim periods within fiscal years beginning after December 15, 2020. At December 31, 2017, the future lease rental payable under non-cancelable operating lease commitments for the Company’s offices and loan production offices were $12.7 million, but the Company does not expect the updates to have a material impact on the income statement.
FASB ASU 2016-13, Financial Instruments-Credit Losses (Topic 326): This amendment in ASU 2016-13 requires the entities change the impairment model for most financial assets that are measured at amortized cost and certain other instruments from an incurred loss model to an expected loss model. Under this model, entities will estimate credit losses over the entire contractual term of the instrument from the date of initial recognition of that instrument. It includes financial assets such as loan receivables, held-to-maturity debt securities, net investment in leases that are not accounted for at fair value through net income, and certain off-balance sheet credit exposures. The amendments are effective for public business entities that are SEC filers for fiscal years beginning after December 15, 2019, including interim periods within those fiscal years. The Company has formed a committee that is assessing data and system needs in order to evaluate the impact of adopting the new guidance. We expect to recognize a one-time cumulative effect adjustment to the allowance for loan losses as of the beginning of the first reporting period in which the new standard is effective. At this time, the impact is being evaluated.
FASB ASU 2017-01, Business Combinations (Topic 805): This amendment in ASU 2017-01 provides a definition of business where if substantially all of the fair value is concentrated in a single asset or a group of
F-15
Table of Contents
PACIFIC CITY FINANCIAL CORPORATION AND SUBSIDIARY
Notes to Consolidated Financial Statements
December 31, 2017 and 2016
similar assets, the acquired set is not a business. To be considered a business, an acquisition would have to include an input and a substantive process that together significantly contribute to the ability to create outputs. The new ASU introduces this initial required screen, if met, eliminates the need for further assessment. For public business entities with a calendar year end, the standard is effective in 2018. Early adoption is permitted, including adoption in an interim period. All other entities should apply the amendments to annual periods beginning after December 15, 2018, and interim periods within annual periods. The Company is currently evaluating the impact on its consolidated financial statements.
FASB ASU 2017-04, Intangibles-Goodwill and Other (Topic 350): This amendment in ASU 2017-04 requires only a one-step quantitative impairment test, whereby a goodwill impairment loss will be measured as the excess of a reporting unit’s carrying amount over its fair value (not to exceed the total goodwill allocated to that reporting unit). It eliminates Step 2 of the current two-step goodwill impairment test, under which a goodwill impairment loss is measured by comparing the implied fair value of a reporting unit’s goodwill with the carrying amount of that goodwill. An entity should apply the amendments in this ASU on a prospective basis. An entity is required to disclose the nature of and reason for the change in accounting principle upon transition. That disclosure should be provided in the first annual period and in the interim period within the first annual period when the entity initially adopts the amendments in this standard. Public business entities should adopt the amendments in this ASU for annual or any interim goodwill impairment tests in fiscal years beginning after December 15, 2019. A public business entity that is not an SEC filer should adopt the amendments in the Update for its annual or any interim goodwill impairment tests in fiscal years beginning after December 15, 2020. All other entities, including not-for-profit entities that are adopting the amendments in the Update should do so for their annual or any interim goodwill impairment tests in fiscal years beginning after December 15, 2021. The Company doesn’t have any goodwill at the reporting dates, and the adoption of ASU-2017-04 will not have a significant impact on its consolidated financial statements.
FASB ASU No. 2018-02, Income Statement—Reporting Comprehensive Income (Topic 220): Reclassification of Certain Tax Effects from Accumulated Other Comprehensive Income. This amendment allows entities to elect to reclassify the stranded tax effects as a result of applying the US Tax Cuts and Jobs Act (the “Tax Reform Act”) from accumulated other comprehensive income to retained earnings, limited only to amounts in AOCI that are affected by the tax reform act. Certain disclosures are also required in the period of adoption. The new guidance becomes effective for fiscal years beginning after December 15, 2018, and interim periods within those fiscal years. Early adoption is permitted. The Company has elected to early adopt this ASU as of December 31, 2017 and has applied the effects of the adoption from the beginning of the annual period of adoption. For the year ended December 31, 2017, the reclassification of the disproportionate tax effects from AOCI to retained earnings related to investments available-for-sale are reflected in the consolidated statements of changes in shareholders’ equity as a component of AOCI and retained earnings. Historical period information has not been adjusted, which is consistent with the Company’s adoption of this standard on a prospective basis. During the year ended December 31, 2017, the adoption of this standard resulted in the reclassification of tax effects from AOCI to retained earnings in the amount of $242 thousand.
F-16
Table of Contents
PACIFIC CITY FINANCIAL CORPORATION AND SUBSIDIARY
Notes to Consolidated Financial Statements
December 31, 2017 and 2016
Note 2—Investment Securities
Debt and equity securities have been classified in the consolidated balance sheets according to management’s intent. The carrying amount of investment securities and their approximate fair values at December 31 were as follows:
| (in thousands) | Available-for-sale | |||||||||||||||
| December 31, 2017 |
Amortized cost |
Gross unrealized gains |
Gross unrealized losses |
Fair value |
||||||||||||
| U.S. government and agency securities |
$ | 25,231 | $ | 17 | $ | (323 | ) | $ | 24,925 | |||||||
| Municipal bonds |
2,376 | 1 | (2 | ) | 2,375 | |||||||||||
| Mortgage-backed securities |
52,565 | 8 | (669 | ) | 51,904 | |||||||||||
| Collateralized mortgage obligations |
51,459 | 34 | (1,008 | ) | 50,485 | |||||||||||
|
|
|
|
|
|
|
|
|
|||||||||
| Total securities available-for-sale |
$ | 131,631 | $ | 60 | $ | (2,002 | ) | $ | 129,689 | |||||||
|
|
|
|
|
|
|
|
|
|||||||||
| Held-to-maturity | ||||||||||||||||
| Amortized cost |
Gross unrecognized gains |
Gross unrecognized losses |
Fair value |
|||||||||||||
| Municipal bonds |
$ | 5,263 | $ | 181 | $ | (5 | ) | $ | 5,439 | |||||||
| Mortgage-backed securities |
15,807 | 8 | (257 | ) | 15,558 | |||||||||||
|
|
|
|
|
|
|
|
|
|||||||||
| Total securities held-to-maturity |
$ | 21,070 | $ | 189 | $ | (262 | ) | $ | 20,997 | |||||||
|
|
|
|
|
|
|
|
|
|||||||||
| (in thousands) | Available-for-sale | |||||||||||||||
| December 31, 2016 |
Amortized cost |
Gross unrealized gains |
Gross unrealized losses |
Fair value |
||||||||||||
| U.S. government and agency securities |
$ | 20,891 | $ | — | $ | (312 | ) | $ | 20,579 | |||||||
| Municipal bonds |
2,654 | 13 | (4 | ) | 2,663 | |||||||||||
| Mortgage-backed securities |
37,091 | 30 | (389 | ) | 36,732 | |||||||||||
| Collateralized mortgage obligations |
23,366 | — | (502 | ) | 22,864 | |||||||||||
|
|
|
|
|
|
|
|
|
|||||||||
| Total securities available-for-sale |
$ | 84,002 | $ | 43 | $ | (1,207 | ) | $ | 82,838 | |||||||
|
|
|
|
|
|
|
|
|
|||||||||
| Held-to-maturity | ||||||||||||||||
| Amortized cost |
Gross unrecognized gains |
Gross unrecognized losses |
Fair value |
|||||||||||||
| Municipal bonds |
$ | 6,137 | $ | 9 | $ | (71 | ) | $ | 6,075 | |||||||
| Mortgage-backed securities |
11,447 | 18 | (204 | ) | 11,261 | |||||||||||
|
|
|
|
|
|
|
|
|
|||||||||
| Total securities held-to-maturity |
$ | 17,584 | $ | 27 | $ | (275 | ) | $ | 17,336 | |||||||
|
|
|
|
|
|
|
|
|
|||||||||
There were no sold or called securities during 2017. Proceeds from sales of or called securities available-for-sale was $7.8 million during 2016. The gross realized gains, gross realized losses, and the net realized gains included as part of other income in noninterest income are $54 thousand, $46 thousand, and $8 thousand for 2016, respectively. During 2017 and 2016, taxable interest income was $2.4 million and $1.6 million, respectively, and nontaxable interest income was $186 thousand and $147 thousand, respectively.
F-17
Table of Contents
PACIFIC CITY FINANCIAL CORPORATION AND SUBSIDIARY
Notes to Consolidated Financial Statements
December 31, 2017 and 2016
As of December 31, 2017 and December 31, 2016, pledged securities were $109.9 million and $99.8 million, respectively. These securities are pledged to the State Deposit from the California State Treasurer.
The amortized cost and fair value of the investment securities portfolio are shown by expected maturity below. Expected maturities may differ from contractual maturities if borrowers have the right to call or prepay obligations with or without call or prepayment penalties. Securities not due at a single maturity date are shown separately as of December 31, 2017:
| (in thousands) | December 31, 2017 | |||||||
| Amortized cost |
Fair value |
|||||||
|
Available-for-sale |
||||||||
| Within one year |
$ | 512 | $ | 510 | ||||
| One to five years |
1,060 | 1,060 | ||||||
| Five to ten years |
2,468 | 2,455 | ||||||
| Beyond ten years |
23,567 | 23,275 | ||||||
| Mortgage-backed securities: residential |
52,565 | 51,904 | ||||||
| Collateralized mortgage obligations |
51,459 | 50,485 | ||||||
|
|
|
|
|
|||||
| Total |
$ | 131,631 | $ | 129,689 | ||||
|
|
|
|
|
|||||
|
Held-to-maturity |
||||||||
| Within one year |
$ | 128 | $ | 128 | ||||
| One to five years |
590 | 590 | ||||||
| Five to ten years |
1,950 | 1,973 | ||||||
| Beyond ten years |
2,595 | 2,748 | ||||||
| Mortgage-backed securities |
15,807 | 15,558 | ||||||
|
|
|
|
|
|||||
| Total |
$ | 21,070 | $ | 20,997 | ||||
|
|
|
|
|
|||||
F-18
Table of Contents
PACIFIC CITY FINANCIAL CORPORATION AND SUBSIDIARY
Notes to Consolidated Financial Statements
December 31, 2017 and 2016
Gross unrealized losses on investment securities available-for-sale and securities held-to-maturity are shown as of December 31, 2017 and December 31, 2016 below:
| (in thousands, except number of securities) |
Holding Period | |||||||||||||||||||||||||||||||||||
| Less Than 12 Months | 12 Months or More | Total | ||||||||||||||||||||||||||||||||||
| Gross Unrealized Loss |
Estimated Fair Value |
Number of Securities |
Gross Unrealized Loss |
Estimated Fair Value |
Number of Securities |
Gross Unrealized Loss |
Estimated Fair Value |
Number of Securities |
||||||||||||||||||||||||||||
|
Available-for-sale: |
||||||||||||||||||||||||||||||||||||
| December 31, 2017 |
||||||||||||||||||||||||||||||||||||
| U.S. government and agency securities |
$ | (103 | ) | $ | 11,736 | 9 | $ | (220 | ) | $ | 8,798 | 7 | $ | (323 | ) | $ | 20,534 | 16 | ||||||||||||||||||
| Municipal bonds |
(2 | ) | 1,115 | 2 | — | — | — | (2 | ) | 1,115 | 2 | |||||||||||||||||||||||||
| Mortgage-backed securities |
(352 | ) | 31,876 | 29 | (317 | ) | 18,762 | 21 | (669 | ) | 50,638 | 50 | ||||||||||||||||||||||||
| Collateralized mortgage obligations |
(454 | ) | 31,191 | 19 | (554 | ) | 16,284 | 19 | (1,008 | ) | 47,475 | 38 | ||||||||||||||||||||||||
|
|
|
|
|
|
|
|
|
|
|
|
|
|
|
|
|
|
|
|||||||||||||||||||
| Total |
$ | (911 | ) | $ | 75,918 | 59 | $ | (1,091 | ) | $ | 43,844 | 47 | $ | (2,002 | ) | $ | 119,762 | 106 | ||||||||||||||||||
|
|
|
|
|
|
|
|
|
|
|
|
|
|
|
|
|
|
|
|||||||||||||||||||
| December 31, 2016 |
||||||||||||||||||||||||||||||||||||
| U.S. government and agency securities |
$ | (284 | ) | $ | 14,835 | 11 | $ | (28 | ) | $ | 3,762 | 3 | $ | (312 | ) | $ | 18,597 | 14 | ||||||||||||||||||
| Municipal bonds |
(4 | ) | 527 | 1 | — | — | — | (4 | ) | 527 | 1 | |||||||||||||||||||||||||
| Mortgage-backed securities |
(383 | ) | 28,906 | 26 | (6 | ) | 731 | 1 | (389 | ) | 29,637 | 27 | ||||||||||||||||||||||||
| Collateralized mortgage obligations |
(300 | ) | 15,976 | 13 | (203 | ) | 6,289 | 8 | (502 | ) | 22,265 | 21 | ||||||||||||||||||||||||
|
|
|
|
|
|
|
|
|
|
|
|
|
|
|
|
|
|
|
|||||||||||||||||||
| Total |
$ | (971 | ) | $ | 60,244 | 51 | $ | (237 | ) | $ | 10,782 | 12 | $ | (1,207 | ) | $ | 71,026 | 63 | ||||||||||||||||||
|
|
|
|
|
|
|
|
|
|
|
|
|
|
|
|
|
|
|
|||||||||||||||||||
|
Held-to-maturity: |
||||||||||||||||||||||||||||||||||||
| December 31, 2017 |
||||||||||||||||||||||||||||||||||||
| Municipal bonds |
$ | (5 | ) | $ | 1,183 | 5 | $ | — | $ | — | — | $ | (5 | ) | $ | 1,183 | 5 | |||||||||||||||||||
| Mortgage-backed securities |
(93 | ) | 7,997 | 6 | (163 | ) | 5,739 | 7 | (257 | ) | 13,736 | 13 | ||||||||||||||||||||||||
|
|
|
|
|
|
|
|
|
|
|
|
|
|
|
|
|
|
|
|||||||||||||||||||
| Total |
$ | (98 | ) | $ | 9,180 | 11 | $ | (163 | ) | $ | 5,739 | 7 | $ | (262 | ) | $ | 14,919 | 18 | ||||||||||||||||||
|
|
|
|
|
|
|
|
|
|
|
|
|
|
|
|
|
|
|
|||||||||||||||||||
| December 31, 2016 |
||||||||||||||||||||||||||||||||||||
| Municipal bonds |
$ | (71 | ) | $ | 4,870 | 14 | $ | — | $ | — | — | $ | (71 | ) | $ | 4,870 | 14 | |||||||||||||||||||
| Mortgage-backed securities |
(151 | ) | 8,170 | 9 | (53 | ) | 900 | 1 | (204 | ) | 9,070 | 10 | ||||||||||||||||||||||||
|
|
|
|
|
|
|
|
|
|
|
|
|
|
|
|
|
|
|
|||||||||||||||||||
| Total |
$ | (222 | ) | $ | 13,040 | 23 | $ | (53 | ) | $ | 900 | 1 | $ | (275 | ) | $ | 13,940 | 24 | ||||||||||||||||||
|
|
|
|
|
|
|
|
|
|
|
|
|
|
|
|
|
|
|
|||||||||||||||||||
In accordance with FASB ASC 320, Investments—Debt and Equity Securities, the Company performs an other-than-temporary impairment assessment periodically. OTTI is recognized when fair value is below the amortized cost where: i) an entity has the intent to sell the security; ii) it is more likely than not that an entity will be required to sell the security before recovery of its amortized cost basis; or (iii) an entity does not expect to recover the entire amortized cost basis of the security.
All individual securities that have been in a continuous unrealized loss position for 12 months or more as of December 31, 2017 and December 31, 2016 had investment grade rating upon purchase. The issuers of these securities have not established any cause for default on these securities and various rating agencies have reaffirmed these securities’ long term investment grade status as of December 31, 2017 and 2016. These securities have fluctuated in value since their purchase dates as market interest rate is fluctuated. The Company
F-19
Table of Contents
PACIFIC CITY FINANCIAL CORPORATION AND SUBSIDIARY
Notes to Consolidated Financial Statements
December 31, 2017 and 2016
does not intend to sell these securities and it is more likely than not that the Company will not be required to sell before the recovery of its amortized cost basis. In addition, the unrealized losses on municipal bonds are not considered other-than-temporary impaired, as the bonds are rated investment grade and there are no credit quality concerns with the issuers. Interest payments have been made as scheduled, and management believes this will continue in the future until the bonds get paid in full. The Company determined that the investment securities with unrealized losses for twelve months or more are not other-than-temporary impaired, and, therefore, no impairment was recognized during 2017 and 2016.
Note 3—Loans
The Company’s loan portfolio primarily consists of loans to borrowers in Southern California, more specifically within the Los Angeles and Orange counties. Although the Company seeks to avoid concentrations of loans to a single industry or based upon a single class of collateral, real estate and real estate associated businesses are among the principal industries in the Company’s market area and, as a result, the Company’s loan and collateral portfolios are concentrated in those industries to some degree. At December 31, 2017, the real estate and rental and lease industry represented 43.3 percent of total outstanding loans and California represented 89.5 percent of total outstanding real estate loans.
The Company also originates SBA loans for sale to institutional investors. Some portions of the Company’s revenues are from the origination of loans guaranteed by the SBA under its various programs and the sale of the guaranteed portions of those loans. Funding for these SBA programs depends on annual appropriations by the U.S. Congress.
To promote growth and management of credit risk, the Company purchases and sells participations in loans. During 2017, the Company purchased $1.9 million of participation in loans. As of December 31, 2017, the aggregate outstanding balance of all participation loans purchased was $16.8 million. During 2016, the Company purchased $10.7 million of participation in loans. As of December 31, 2016, the aggregate outstanding balance of all participation loans purchased was $27.8 million.
F-20
Table of Contents
PACIFIC CITY FINANCIAL CORPORATION AND SUBSIDIARY
Notes to Consolidated Financial Statements
December 31, 2017 and 2016
Loans receivable
A summary of loans by type as of is as follows:
| (in thousands) | December 31, 2017 |
December 31, 2016 |
||||||
| Real estate loans: |
||||||||
| Commercial property |
$ | 662,840 | $ | 597,095 | ||||
| Residential property |
168,898 | 140,766 | ||||||
| Small Business Administration (SBA) property |
130,438 | 104,110 | ||||||
| Construction |
23,215 | 15,129 | ||||||
|
|
|
|
|
|||||
| Total real estate loans |
985,391 | 857,100 | ||||||
| Commercial and industrial loans: |
||||||||
| Commercial term |
77,438 | 64,926 | ||||||
| Commercial lines of credit |
60,850 | 45,171 | ||||||
| SBA commercial term |
30,199 | 26,467 | ||||||
| International loans |
1,920 | 3,545 | ||||||
|
|
|
|
|
|||||
| Total commercial and industrial loans |
170,407 | 140,109 | ||||||
| Consumer loans |
33,870 | 33,722 | ||||||
|
|
|
|
|
|||||
| Total gross loans |
1,189,668 | 1,030,931 | ||||||
| Less: Allowance for loan losses |
(12,224 | ) | (11,320 | ) | ||||
| Deferred loan costs, net of unamortized fees |
331 | 181 | ||||||
|
|
|
|
|
|||||
| Loans receivable, net |
$ | 1,177,775 | $ | 1,019,792 | ||||
|
|
|
|
|
|||||
In the ordinary course of business, the Company may grant loans to certain officers and directors and the companies with which they are associated. As of December 31, 2017 and December 31, 2016, there were no outstanding loans to certain officers and directors.
F-21
Table of Contents
PACIFIC CITY FINANCIAL CORPORATION AND SUBSIDIARY
Notes to Consolidated Financial Statements
December 31, 2017 and 2016
Allowance for loan losses
The following table presents the activity in the allowance for loan losses and ending balances of loans evaluated for impairment for the years ending December 31, 2017 and December 31, 2016. Activity is provided by portfolio segment which is consistent with the Company’s methodology for determining allowance for loan losses:
| (in thousands) | Real estate | Commercial and industrial |
Consumer | Total | ||||||||||||
| For the year ended December 31, 2017: |
||||||||||||||||
| Allowance for loan losses: |
||||||||||||||||
| Beginning balance |
$ | 7,497 | $ | 3,657 | $ | 166 | $ | 11,320 | ||||||||
| Charge-offs |
(168 | ) | (1,320 | ) | (88 | ) | (1,576 | ) | ||||||||
| Recoveries |
1 | 580 | 72 | 653 | ||||||||||||
| Provision for loan losses |
1,177 | 631 | 19 | 1,827 | ||||||||||||
|
|
|
|
|
|
|
|
|
|||||||||
| Ending balance |
$ | 8,507 | $ | 3,548 | $ | 169 | $ | 12,224 | ||||||||
|
|
|
|
|
|
|
|
|
|||||||||
| Ending balance of allowance: |
||||||||||||||||
| Specific |
$ | — | $ | 208 | $ | — | $ | 208 | ||||||||
| General |
8,507 | 3,340 | 169 | 12,016 | ||||||||||||
|
|
|
|
|
|
|
|
|
|||||||||
| Total allowance for loan losses |
$ | 8,507 | $ | 3,548 | $ | 169 | $ | 12,224 | ||||||||
|
|
|
|
|
|
|
|
|
|||||||||
| Loans evaluated for impairment: |
||||||||||||||||
| Individually |
$ | 3,191 | $ | 610 | $ | — | $ | 3,801 | ||||||||
| Collectively |
982,200 | 169,797 | 33,870 | 1,185,867 | ||||||||||||
|
|
|
|
|
|
|
|
|
|||||||||
| Total |
$ | 985,391 | $ | 170,407 | $ | 33,870 | $ | 1,189,668 | ||||||||
|
|
|
|
|
|
|
|
|
|||||||||
| For the year ended December 31, 2016: |
||||||||||||||||
| Allowance for loan losses: |
||||||||||||||||
| Beginning balance |
$ | 4,974 | $ | 4,152 | $ | 219 | $ | 9,345 | ||||||||
| Charge-offs |
— | (729 | ) | (38 | ) | (767 | ) | |||||||||
| Recoveries |
1 | 406 | 52 | 459 | ||||||||||||
| Provision for (reversal of) loan losses |
2,522 | (172 | ) | (67 | ) | 2,283 | ||||||||||
|
|
|
|
|
|
|
|
|
|||||||||
| Ending balance |
$ | 7,497 | $ | 3,657 | $ | 166 | $ | 11,320 | ||||||||
|
|
|
|
|
|
|
|
|
|||||||||
| Ending balance of allowance: |
||||||||||||||||
| Specific |
$ | — | $ | 421 | $ | — | $ | 421 | ||||||||
| General |
7,497 | 3,236 | 166 | 10,899 | ||||||||||||
|
|
|
|
|
|
|
|
|
|||||||||
| Total allowance for loan losses |
$ | 7,497 | $ | 3,657 | $ | 166 | $ | 11,320 | ||||||||
|
|
|
|
|
|
|
|
|
|||||||||
| Loans evaluated for impairment: |
||||||||||||||||
| Individually |
$ | 2,474 | $ | 3,395 | $ | — | $ | 5,869 | ||||||||
| Collectively |
854,626 | 136,714 | 33,722 | 1,025,062 | ||||||||||||
|
|
|
|
|
|
|
|
|
|||||||||
| Total |
$ | 857,100 | $ | 140,109 | $ | 33,722 | $ | 1,030,931 | ||||||||
|
|
|
|
|
|
|
|
|
|||||||||
F-22
Table of Contents
PACIFIC CITY FINANCIAL CORPORATION AND SUBSIDIARY
Notes to Consolidated Financial Statements
December 31, 2017 and 2016
Classified loans
The Company classifies loans into risk categories based on relevant information about the ability of borrowers to service their debt, such as current financial information, historical payment experience, collateral adequacy, credit documentation, and current economic trends, among other factors. The Company analyzes loans individually by classifying the loans in regards to credit risk. This analysis typically includes larger, non-homogeneous loans, such as commercial real estate and commercial and industrial loans, and is performed on an ongoing basis as new information is obtained. The Company uses the following definitions for risk ratings:
Pass—Loans listed as pass include larger non-homogeneous loans not meeting the risk ratings defined below and smaller, homogeneous loans not assessed on an individual basis.
Special Mention—Loans classified as special mention have a potential weakness that deserves management’s close attention. If left uncorrected, these potential weaknesses may result in the deterioration of repayment prospects for the loan or of the institution’s credit position at some future date.
Substandard—Loans classified as substandard are inadequately protected by the current net worth and paying capacity of the obligor or of the collateral pledged, if any. Loans classified as substandard have a well-defined weakness or weaknesses that jeopardize the liquidation of the debt. They are characterized by the distinct possibility that the institution will sustain some loss if the deficiencies are not corrected.
Doubtful—Loans classified as doubtful have all the weaknesses inherent in those classified as substandard, with the added characteristic that the weaknesses make collection or repayment in full, on the basis of currently existing facts, conditions, and values, highly questionable and improbable.
The risk category of loans by loan type as of December 31, 2017 and December 31, 2016 are as follows:
| (in thousands)
December 31, 2017 |
Pass | Special mention |
Substandard | Doubtful | Total | |||||||||||||||
| Real estate: |
||||||||||||||||||||
| Commercial property |
$ | 657,511 | $ | 4,819 | $ | 510 | $ | — | $ | 662,840 | ||||||||||
| Residential property |
168,168 | — | 730 | — | 168,898 | |||||||||||||||
| SBA property |
124,837 | 2,435 | 3,166 | — | 130,438 | |||||||||||||||
| Construction |
23,215 | — | — | — | 23,215 | |||||||||||||||
| Commercial and industrial: |
||||||||||||||||||||
| Commercial term |
77,261 | — | 177 | — | 77,438 | |||||||||||||||
| Commercial lines of credit |
60,840 | — | 10 | — | 60,850 | |||||||||||||||
| SBA commercial term |
29,831 | 4 | 364 | — | 30,199 | |||||||||||||||
| International loans |
1,920 | — | — | — | 1,920 | |||||||||||||||
| Consumer |
33,845 | — | 25 | — | 33,870 | |||||||||||||||
|
|
|
|
|
|
|
|
|
|
|
|||||||||||
| Total |
$ | 1,177,428 | $ | 7,258 | $ | 4,982 | $ | — | $ | 1,189,668 | ||||||||||
|
|
|
|
|
|
|
|
|
|
|
|||||||||||
F-23
Table of Contents
PACIFIC CITY FINANCIAL CORPORATION AND SUBSIDIARY
Notes to Consolidated Financial Statements
December 31, 2017 and 2016
| (in thousands)
December 31, 2016 |
Pass | Special mention |
Substandard | Doubtful | Total | |||||||||||||||
| Real estate: |
||||||||||||||||||||
| Commercial property |
$ | 589,717 | $ | 5,768 | $ | 1,610 | $ | — | $ | 597,095 | ||||||||||
| Residential property |
140,766 | — | — | — | 140,766 | |||||||||||||||
| SBA property |
100,599 | 63 | 3,448 | — | 104,110 | |||||||||||||||
| Construction |
15,129 | — | — | — | 15,129 | |||||||||||||||
| Commercial and industrial: |
||||||||||||||||||||
| Commercial term |
63,417 | — | 1,509 | — | 64,926 | |||||||||||||||
| Commercial lines of credit |
43,556 | — | 1,615 | — | 45,171 | |||||||||||||||
| SBA commercial term |
25,611 | 11 | 845 | — | 26,467 | |||||||||||||||
| International loans |
3,545 | — | — | — | 3,545 | |||||||||||||||
| Consumer |
33,683 | — | 39 | — | 33,722 | |||||||||||||||
|
|
|
|
|
|
|
|
|
|
|
|||||||||||
| Total |
$ | 1,016,023 | $ | 5,842 | $ | 9,066 | $ | — | $ | 1,030,931 | ||||||||||
|
|
|
|
|
|
|
|
|
|
|
|||||||||||
Past due and nonaccrual loans
Loans are considered past due following the date when either interest or principal is contractually due and unpaid. Loans on which the accrual of interest has been discontinued are designated as nonaccrual loans. The accrual of interest on loans is discontinued when principal or interest is 90 days past due based on the contractual terms of the loan or when, in the opinion of management, there is reasonable doubt as to collectability.
Past due and nonaccrual loans by loan type as of December 31 are as follows:
| (in thousands) | Still accruing | Nonaccrual | Total Past due and Nonaccrual |
|||||||||||||||||
| December 31, 2017 |
30–59 days past due |
60-89 days past due |
Over 90 days past due |
|||||||||||||||||
| Real estate: |
||||||||||||||||||||
| Commercial property |
$ | — | $ | — | $ | — | $ | 318 | $ | 318 | ||||||||||
| Residential property |
949 | 96 | — | 730 | 1,775 | |||||||||||||||
| SBA property |
— | — | — | 1,810 | 1,810 | |||||||||||||||
| Commercial and industrial: |
||||||||||||||||||||
| Commercial term |
— | — | — | 4 | 4 | |||||||||||||||
| Commercial lines of credit |
— | — | — | 10 | 10 | |||||||||||||||
| SBA commercial term |
2 | — | — | 338 | 340 | |||||||||||||||
| Consumer |
262 | 32 | — | 24 | 318 | |||||||||||||||
|
|
|
|
|
|
|
|
|
|
|
|||||||||||
| Total |
$ | 1,213 | $ | 128 | $ | — | $ | 3,234 | $ | 4,575 | ||||||||||
|
|
|
|
|
|
|
|
|
|
|
|||||||||||
| December 31, 2016 |
||||||||||||||||||||
| Real estate: |
||||||||||||||||||||
| Commercial property |
$ | — | $ | — | $ | — | $ | 57 | $ | 57 | ||||||||||
| SBA property |
— | — | — | 602 | 602 | |||||||||||||||
| Commercial and industrial: |
||||||||||||||||||||
| Commercial term |
442 | — | — | 169 | 611 | |||||||||||||||
| Commercial lines of credit |
— | 1,500 | 115 | 1,615 | ||||||||||||||||
| SBA commercial term |
3 | 34 | — | 866 | 903 | |||||||||||||||
| Consumer |
82 | 33 | — | 39 | 154 | |||||||||||||||
|
|
|
|
|
|
|
|
|
|
|
|||||||||||
| Total |
$ | 527 | $ | 1,567 | $ | — | $ | 1,848 | $ | 3,942 | ||||||||||
|
|
|
|
|
|
|
|
|
|
|
|||||||||||
F-24
Table of Contents
PACIFIC CITY FINANCIAL CORPORATION AND SUBSIDIARY
Notes to Consolidated Financial Statements
December 31, 2017 and 2016
Guaranteed and unguaranteed nonaccrual loans at December 31, 2017 amounted to approximately $0.8 million and $2.4 million. Guaranteed and unguaranteed nonaccrual loans at December 31, 2016 amounted to approximately $0.1 million and $1.8 million.
Impaired loans
Loans are considered impaired in the following cases: (i) the loan is on nonaccrual, (ii) when principal or interest payments on the loan have been contractually past due for 90 days or more, unless the loan is both well-collateralized and in the process of collection, (iii) the loan is classified as a TDR where terms not typically granted by the Company were offered to the borrower, (iv) when current information or events make it unlikely to collect the loan balance in full according to the contractual terms of the loan agreement, (v) there is a deterioration in the borrower’s financial condition that raises uncertainty as to timely collection of either principal or interest, or (vi) full payment of both principal and interest of the loan according to the original contractual terms is in doubt.
The following presents individually impaired loans by loan type as of December 31:
| (in thousands) | With no allowance recorded | With an allowance recorded | ||||||||||||||||||
| December 31, 2017 |
Unpaid principal balance |
Recorded investment |
Unpaid principal balance |
Recorded investment |
Related allowance |
|||||||||||||||
| Real estate: |
||||||||||||||||||||
| Commercial property |
$ | 494 | $ | 318 | $ | — | $ | — | $ | — | ||||||||||
| Residential property |
730 | 730 | — | — | — | |||||||||||||||
| SBA property |
3,639 | 2,143 | — | — | — | |||||||||||||||
| Commercial and industrial: |
||||||||||||||||||||
| Commercial term |
216 | 199 | — | — | — | |||||||||||||||
| Commercial lines of credit |
20 | 10 | — | — | — | |||||||||||||||
| SBA commercial term |
288 | 122 | 354 | 279 | 208 | |||||||||||||||
|
|
|
|
|
|
|
|
|
|
|
|||||||||||
| Total |
$ | 5,387 | $ | 3,522 | $ | 354 | $ | 279 | $ | 208 | ||||||||||
|
|
|
|
|
|
|
|
|
|
|
|||||||||||
| (in thousands) | With no allowance recorded | With an allowance recorded | ||||||||||||||||||
| December 31, 2016 |
Unpaid principal balance |
Recorded investment |
Unpaid principal balance |
Recorded investment |
Related allowance |
|||||||||||||||
| Real estate: |
||||||||||||||||||||
| Commercial property |
$ | 585 | $ | 436 | $ | — | $ | — | $ | — | ||||||||||
| SBA property |
2,232 | 2,038 | — | — | — | |||||||||||||||
| Commercial and industrial: |
||||||||||||||||||||
| Commercial term |
904 | 796 | 127 | 118 | 102 | |||||||||||||||
| Commercial lines of credit |
1,620 | 1,615 | — | — | — | |||||||||||||||
| SBA commercial term |
139 | 110 | 879 | 756 | 319 | |||||||||||||||
|
|
|
|
|
|
|
|
|
|
|
|||||||||||
| Total |
$ | 5,480 | $ | 4,995 | $ | 1,006 | $ | 874 | $ | 421 | ||||||||||
|
|
|
|
|
|
|
|
|
|
|
|||||||||||
F-25
Table of Contents
PACIFIC CITY FINANCIAL CORPORATION AND SUBSIDIARY
Notes to Consolidated Financial Statements
December 31, 2017 and 2016
Information relating to the average recorded investment and interest income recognized by loan type for individually impaired loans follows for the years ended December 31:
| (in thousands) | For the year ended December 31, | |||||||||||||||
| 2017 | 2016 | |||||||||||||||
| Average recorded investment |
Interest income |
Average recorded investment |
Interest income |
|||||||||||||
| Real estate: |
||||||||||||||||
| Commercial property |
$ | 396 | $ | 5 | $ | 460 | $ | 24 | ||||||||
| SBA property |
1,982 | 35 | 2,391 | 88 | ||||||||||||
| Commercial and industrial: |
||||||||||||||||
| Commercial term |
512 | 30 | 944 | 39 | ||||||||||||
| Commercial lines of credit |
431 | 39 | 477 | — | ||||||||||||
| SBA commercial term |
595 | 25 | 567 | 10 | ||||||||||||
|
|
|
|
|
|
|
|
|
|||||||||
| Total |
$ | 3,916 | $ | 134 | $ | 4,839 | $ | 161 | ||||||||
|
|
|
|
|
|
|
|
|
|||||||||
The portion of total interest income on individually impaired loans recognized on the cash basis was negligible in 2017 and 2016. The following is a summary of interest foregone on impaired loans for the years ended December 31:
| (in thousands) | For the years ended December 31, | |||||||
| 2017 | 2016 | |||||||
| Interest income that would have been recognized had impaired loans performed in accordance with their original terms |
$ | 294 | $ | 243 | ||||
| Less: interest income recognized on impaired loans on a cash basis |
(128 | ) | (120 | ) | ||||
|
|
|
|
|
|||||
| Interest income foregone on impaired loans |
$ | 166 | $ | 123 | ||||
|
|
|
|
|
|||||
Troubled debt restructuring
A TDR is a restructuring in which the Company, for economic or legal reasons related to a borrower’s financial difficulties, grants a concession to the borrower that it would not otherwise consider. The restructuring of a loan includes, but is not limited to: (i) the transfer from the borrower to the Company of real estate, receivables from third parties, other assets, or an equity interest in full or partial satisfaction of the loan, (ii) a modification of the loan terms, such as a reduction of the stated interest rate, principal, or accrued interest or an extension of the maturity date at a stated interest rate lower than the current market rate for new debt with similar risk, or (iii) a combination of the above. A loan extended or renewed at a stated interest rate equal to the current interest rate for new debt with similar risk is not to be reported as a restructured loan.
The Company’s only concession type for TDR historically and in the current year is deferral of principal. As of December 31, 2017, total TDRs were $2.3 million, which consisted of $1.7 million for real estate loans and $0.6 million for commercial and industrial loans. As of December 31, 2017, the TDRs on accrual totaled $0.6 million, which consisted of $0.3 million for real estate loans and $0.3 million for commercial and industrial loans. As of December 31, 2017, the TDRs on nonaccrual totaled $1.7 million, which consisted of $1.4 million for real estate loans and $0.3 million for commercial and industrial loans.
F-26
Table of Contents
PACIFIC CITY FINANCIAL CORPORATION AND SUBSIDIARY
Notes to Consolidated Financial Statements
December 31, 2017 and 2016
As of December 31, 2016, total TDRs were $2.9 million, which consisted of $2.0 million for real estate loans and $0.9 million for commercial and industrial loans. As of December 31, 2016, the TDRs on accrual totaled $2.2 million, which consisted of $1.8 million for real estate loans and $0.4 million for commercial and industrial loans. As of December 31, 2016, the TDRs on nonaccrual totaled $0.7 million, which consisted of $0.2 million for real estate loans and $0.5 million for commercial and industrial loans.
The following table presents loans by loan type modified as TDRs that occurred during the years ended December 31, 2017 and December 31, 2016:
| (in thousands, except number of loans) | For the year ended December 31, 2017 |
For the year ended December 31, 2016 |
||||||||||||||||||||||
| Number of loans |
Pre- modification recorded investment |
Post- modification recorded investment |
Number of loans |
Pre- modification recorded investment |
Post- modification recorded investment |
|||||||||||||||||||
| Real estate: |
||||||||||||||||||||||||
| Commercial property |
1 | 312 | 301 | — | — | — | ||||||||||||||||||
| Commercial and industrial: |
||||||||||||||||||||||||
| Commercial lines of credit |
— | — | — | 1 | 120 | 115 | ||||||||||||||||||
| SBA commercial term |
3 | 274 | 241 | 2 | 28 | 25 | ||||||||||||||||||
|
|
|
|
|
|
|
|
|
|
|
|
|
|||||||||||||
| Total troubled debt restructured loans |
4 | $ | 586 | $ | 542 | 3 | $ | 148 | $ | 140 | ||||||||||||||
|
|
|
|
|
|
|
|
|
|
|
|
|
|||||||||||||
The Company has committed to lend no additional amounts to customers with outstanding loans that are classified as TDRs as of December 31, 2017 and December 31, 2016.
The determination of the allowance for loan losses related to TDRs depends on the collectability of principal and interest, according to the modified repayment terms. The Company has allocated $208 thousand and $235 thousand of specific reserves to customers whose loan terms have been modified in TDRs as of December 31, 2017 and December 31, 2016, respectively.
The following table presents loans by loan type modified as TDRs for which there was a payment default within twelve months following the modification during the years ended December 31, 2017 and December 31, 2016:
| (in thousands, except number of loans) | For the year ended December 31, 2017 |
For the year ended December 31, 2016 |
||||||||||||||
| Number of loans |
Recorded investment at date of default |
Number of loans |
Recorded investment at date of default |
|||||||||||||
| Commercial and industrial |
||||||||||||||||
| SBA commercial term |
— | $ | — | 1 | $ | 23 | ||||||||||
|
|
|
|
|
|
|
|
|
|||||||||
| Total |
— | $ | — | 1 | $ | 23 | ||||||||||
|
|
|
|
|
|
|
|
|
|||||||||
A loan is considered to be in payment default once it is 30 days contractually past due under the modified terms. The TDRs that subsequently defaulted as described above were individually evaluated for reserve adequacy as of December 31, 2017 and December 31, 2016 using the methods applied to impaired loans. There were no TDRs that subsequently defaulted as of December 31, 2017. There were no specific reserves on these loans as of December 31, 2016 as the loans were charged-off or paid-off during 2016.
F-27
Table of Contents
PACIFIC CITY FINANCIAL CORPORATION AND SUBSIDIARY
Notes to Consolidated Financial Statements
December 31, 2017 and 2016
Note 4—Servicing Assets
The Company serviced $543.3 million and $516.2 million in loans previously sold as of December 31, 2017 and December 31, 2016, respectively. The Company sold loans in the amount of $140.5 million and $164.6 million during 2017 and 2016, respectively. The Company recognized net gains on the sale of loans of $9.0 million and servicing income of $2.4 million for the year ended December 31, 2017. Net gains on the sale of loans and servicing income were $8.9 million and $2.2 million for the year ended December 31, 2016.
All classes of servicing assets are measured using the amortization method and evaluated for impairment by comparing the fair value of the servicing right to the carrying amount. Fair value is estimated by stratifying the loans sold between mortgage and non-mortgage loans and discounting estimated future cash flows from the servicing assets using discount rates that approximate current market rates over the expected lives of the loans being serviced. For the purposes of measuring impairment, the Company has identified each servicing asset with the underlying loan being serviced, and a valuation allowance is recorded when the fair value is below the carrying amount of the asset.
Activity for servicing rights measured at amortized cost and fair value with key assumptions used to estimate the fair value are as follows. There was no valuation allowance recorded during 2017 or 2016.
| (in thousands) | December 31, 2017 | December 31, 2016 | ||||||||||||||
| Mortgage | Non- Mortgage |
Mortgage | Non- Mortgage |
|||||||||||||
| Carrying amount at beginning of year |
$ | 7,100 | $ | 1,202 | $ | 6,321 | $ | 1,084 | ||||||||
| Additions from loan sales |
2,353 | 551 | 2,398 | 564 | ||||||||||||
| Amortization |
(1,776 | ) | (457 | ) | (1,619 | ) | (446 | ) | ||||||||
|
|
|
|
|
|
|
|
|
|||||||||
| Carrying amount at end of year |
$ | 7,677 | $ | 1,296 | $ | 7,100 | $ | 1,202 | ||||||||
|
|
|
|
|
|
|
|
|
|||||||||
| Fair value, beginning of year |
$ | 8,531 | $ | 1,389 | $ | 7,807 | $ | 1,267 | ||||||||
| Fair value, end of year |
$ | 8,337 | $ | 1,400 | $ | 8,531 | $ | 1,389 | ||||||||
| Discount rates |
12.0% to 13.25% | 10.0% to 12.50% | ||||||||||||||
| Prepayment speeds |
5.25% to 7.25% | 5.7% to 18.89% | ||||||||||||||
| Weighted average life |
22.26 | 8.23 | 23.75 | 8.37 | ||||||||||||
Note 5—Other Real Estate Owned
The following table provides a summary of OREO activity for the years ended December 31, 2017 and December 31, 2016:
| For the years ended December 31, | ||||||||
| (in thousands) | 2017 | 2016 | ||||||
| Beginning balance |
$ | 506 | $ | — | ||||
| Additions |
— | 506 | ||||||
| Sales |
(296 | ) | — | |||||
| Net loss on sale of OREO |
(20 | ) | — | |||||
| Valuation Allowance |
(91 | ) | — | |||||
|
|
|
|
|
|||||
| Ending balance |
$ | 99 | $ | 506 | ||||
|
|
|
|
|
|||||
F-28
Table of Contents
PACIFIC CITY FINANCIAL CORPORATION AND SUBSIDIARY
Notes to Consolidated Financial Statements
December 31, 2017 and 2016
At December 31, 2017 and December 31, 2016, the Company did not have any consumer mortgage loans secured by residential real estate properties for which formal foreclosure proceedings are in process. OREO expenses and valuation write-downs are recorded in noninterest expense and net gains or losses on the sale of OREO are recognized in noninterest income. The Company recognized a valuation allowance of $111 thousand as of December 31, 2017. There were no valuation allowances, write-downs, or gains or losses related to OREO recognized in 2016.
Note 6—Premises and Equipment
A summary of premises and equipment as of December 31 follows:
| (in thousands) | December 31, 2017 |
December 31, 2016 |
||||||
| Leasehold improvements |
$ | 6,612 | $ | 5,971 | ||||
| Furniture, fixtures, and equipment |
3,093 | 2,874 | ||||||
| Computer equipment |
1,968 | 1,692 | ||||||
| Computer software |
748 | 696 | ||||||
|
|
|
|
|
|||||
| Total premises and equipment |
12,421 | 11,233 | ||||||
| Less: accumulated depreciation and amortization |
(7,698 | ) | (6,670 | ) | ||||
|
|
|
|
|
|||||
| Premises and equipment, net |
$ | 4,723 | $ | 4,563 | ||||
|
|
|
|
|
|||||
Depreciation expense was $1.1 million and $1.0 million for the years ended December 31, 2017 and December 31, 2016, respectively.
Note 7—Federal Home Loan Bank and other restricted stock
The Company’s investment in stock issued by the FHLB totaled $6.4 million and $5.5 million at December 31, 2017 and December 31, 2016, respectively. Ownership of government agency securities is restricted to member banks, and the securities do not have readily determinable market values. The Company records investments in FHLB stock at cost on the consolidated balance sheets and evaluates these investments for impairment. The Company expects to recover the full amount invested in FHLB stock. The Company received $442 thousand and $635 thousand of cash dividends from FHLB during 2017 and 2016, respectively, and it was reported as an interest income in the consolidated financial statements.
The Company also owns stock in Pacific Coast Banker’s Bank (“PCBB”) in the amount of $170 thousand at December 31, 2017 and December 31, 2016. The investment in PCBB is carried at cost. PCBB operates under a special purpose charter to provide wholesale correspondent banking services to depository institutions. By statute, 100% of PCBB’s outstanding stock is held by depository institutions that utilize its correspondent banking services. The Company received $5 thousand and $17 thousand of cash dividends from PCBB during 2017 and 2016, respectively, and it was reported as an interest income in the consolidated financial statements.
Note 8—Deposits
At December 31, 2017, total deposits were $1.3 billion, of which $319.0 million was noninterest-bearing and $932.3 million was interest-bearing. At December 31, 2016, total deposits were $1.1 billion, of which $274.0 million was noninterest-bearing and $817.8 million were interest-bearing. Included in time deposits of
F-29
Table of Contents
PACIFIC CITY FINANCIAL CORPORATION AND SUBSIDIARY
Notes to Consolidated Financial Statements
December 31, 2017 and 2016
$250 thousand or over were $100.0 million and $78.7 million in California State Treasurer’s deposits at December 31, 2017 and 2016.
Total time deposits were $614.4 million as of December 31, 2017 and $497.9 million as of December 31, 2016. Scheduled maturities of time deposits as of December 31, 2017 are as follows:
| (in thousands) | Time deposits $250,000 or over |
Other time deposits |
Total | |||||||||
| Year ending: |
||||||||||||
| 2018 |
$ | 249,345 | $ | 315,299 | $ | 564,644 | ||||||
| 2019 |
13,689 | 25,975 | 39,664 | |||||||||
| 2020 |
3,578 | 3,669 | 7,247 | |||||||||
| 2021 |
— | 1,948 | 1,948 | |||||||||
| 2022 |
— | 883 | 883 | |||||||||
| Thereafter |
— | — | — | |||||||||
|
|
|
|
|
|
|
|||||||
| Total |
$ | 266,612 | $ | 347,774 | $ | 614,386 | ||||||
|
|
|
|
|
|
|
|||||||
Deposits from certain directors and their related interests with which they are associated held by the Company at December 31, 2017 and December 31, 2016, amounted to approximately $8.9 million and $5.4 million, respectively.
Note 9—Borrowed Funds
The Company had $40.0 million in borrowing from Federal Home Loan Bank of San Francisco (FHLBSF) at December 31, 2017 and none at December 31, 2016. The FHLBSF borrowings consist of fixed interest rates with original maturity terms ranging from one to five years. The weighted average interest rate for the FHLBSF borrowing is 1.71%.
At December 31, 2017, the contractual maturities for FHLBSF borrowings were as follows:
| December 31, 2017 | ||||
| (Dollars in thousands) | ||||
| Scheduled maturites in: |
||||
| 2018 |
$ | 10,000 | ||
| 2019 |
10,000 | |||
| 2020 |
10,000 | |||
| 2022 and thereafter |
10,000 | |||
|
|
|
|||
| $ | 40,000 | |||
|
|
|
|||
Other borrowing arrangements
The Company may borrow up to approximately $60.0 million overnight on an unsecured basis from three correspondent banks. The Company may also borrow up to approximately $48.1 million from the FRB’s discount window, to which the Company pledged approximately $56.2 million of loans as collateral. At December 31, 2017 and December 31, 2016, the Company had no outstanding borrowings from the FRB.
F-30
Table of Contents
PACIFIC CITY FINANCIAL CORPORATION AND SUBSIDIARY
Notes to Consolidated Financial Statements
December 31, 2017 and 2016
At December 31, 2017 and December 31, 2016, loans pledged to secure advances from the FHLBSF were $711.8 million and $624.6 million, respectively. At December 31, 2017 and December 31, 2016, loans pledged to secure advances from the FRB’s federal discount window were $56.2 million and $51.8 million, respectively.
As of December 31, 2017 and December 31, 2016, the Company had financing available from the FHLBSF, secured by the assets of the Company. Under this financing, the Company may borrow up to approximately $311.0 million, net of outstanding borrowing of $40.0 million, and $294.3 million as of December 31, 2017 and December 31, 2016, respectively.
Note 10—Shareholders’ Equity
Components of accumulated other comprehensive income for the Company consist solely of the change in unrealized gains or losses on available-for-sale securities, net of taxes.
Activity in accumulated other comprehensive income for the year ended December 31, 2017 and December 31, 2016 was as follows:
| (in thousands) | Beginning balance |
Other comprehensive (loss) income before reclassification |
Reclassification from accumulated other comprehensive income |
Reclassification of the disproportionate tax effect to retained earnings |
Total change for the year |
Ending balance |
||||||||||||||||||
| For the year ended December 31, 2017: |
||||||||||||||||||||||||
| Unrealized losses available-for-sale securities |
$ | (1,164 | ) | $ | (778 | ) | $ | — | $ | (242 | ) | (1,020 | ) | $ | (2,184 | ) | ||||||||
| Tax benefit (expense) |
633 | 328 | — | — | 328 | 961 | ||||||||||||||||||
|
|
|
|
|
|
|
|
|
|
|
|
|
|||||||||||||
| Total |
$ | (531 | ) | $ | (450 | ) | $ | — | $ | (242 | ) | (692 | ) | $ | (1,223 | ) | ||||||||
|
|
|
|
|
|
|
|
|
|
|
|
|
|||||||||||||
| For the year ended December 31, 2016: |
||||||||||||||||||||||||
| Unrealized (losses) gains available-for-sale securities |
$ | (933 | ) | $ | (245 | ) | $ | 14 | $ | — | (231 | ) | $ | (1,164 | ) | |||||||||
| Tax benefit (expense) |
537 | 102 | (6 | ) | — | 96 | 633 | |||||||||||||||||
|
|
|
|
|
|
|
|
|
|
|
|
|
|||||||||||||
| Total |
$ | (396 | ) | $ | (143 | ) | $ | 8 | $ | — | (135 | ) | $ | (531 | ) | |||||||||
|
|
|
|
|
|
|
|
|
|
|
|
|
|||||||||||||
The Company did not sell any securities during 2017. For the year ended December 31, 2016, there was a $8 thousand reclassification from accumulated other comprehensive income to gains in earnings from the sale of available-for sale securities. The $8 thousand reclassification adjustment out of accumulated other comprehensive income was included in other income under noninterest income. The securities were previously recorded as an unrealized loss of $14 thousand in accumulated other comprehensive income.
Private placement memorandum
During August 2016, the Company issued 1,400,300 shares at a share price of $10.91 per share to accredited investors through a private placement memorandum for total cash proceeds of $15.2 million, net of related expenses.
F-31
Table of Contents
PACIFIC CITY FINANCIAL CORPORATION AND SUBSIDIARY
Notes to Consolidated Financial Statements
December 31, 2017 and 2016
Stock Dividend
On December 21, 2015, the Company announced a 10% stock dividend that is payable on February 22, 2016 to shareholders of record as of the close of trading on January 29, 2016, with cash paid for any fractional shares. As a result of the stock dividend, the Company’s issued and outstanding common shares increased from 9,805,905 common shares to 10,786,496 common shares. In addition, the Company paid $2 thousand for fractional common shares on February 18, 2016.
On December 13, 2016, the Company announced a 10% stock dividend that is payable on January 15, 2017 to shareholders of record as of the close of trading on December 30, 2016, with cash paid for any fractional shares. As a result of the stock dividend, the Company’s issued and outstanding common shares increased from 10,786,496 common shares to 11,865,145 common shares. In addition, the Company paid $2 thousand for fractional common shares on January 12, 2017.
All per share data for all periods presented, including outstanding shares and outstanding stock options, have been retroactively adjusted to reflect the effect of these two stock dividends. These transactions were recorded as of December 31, 2016 and resulted in an increase in common stock and a corresponding decrease of retained earnings in the amount of $12.6 million.
Cash Dividend
The Company paid quarterly dividends of $0.03 per common share for the year of 2017 and 2016. The Company paid aggregate dividends of $1.6 million and $1.4 million to common shareholders during 2017 and 2016, respectively.
The Company declared quarterly cash dividend of $0.03 per common share for the first quarter of 2018 on January 26, 2018. The dividend will be paid on March 15, 2018, to shareholders of record as of the close of business on February 28, 2018.
Note 11—Stock Option Plan
On July 25, 2013, the Company adopted 2013 Equity Based Stock Compensation Plan (“2013 EBSC Plan”) approved by its shareholders to replace the 2003 Stock Option Plan. The 2013 EBSC Plan provided for options to purchase 2,511,900 shares of common stock at a price not less than 100% of the fair market value of the stock. In general, all options granted vest at a rate of 20% per year, except for specific grants that vest at a rate of 33% per year. All options not exercised generally expire ten years after the date of grant. The Company issues new shares upon exercise of stock options.
The 10% stock dividend declared on December 13, 2016 and aforementioned in Note 10 also has the effect of proportionate adjustment to the per share exercise price, the number of shares of common stock issuable upon the exercise of outstanding stock options, and the number of shares of commons stock eligible for issuance under the 2013 EBSC Plan. As a result, the authorized number of common stock under the 2013 EBSC Plan was revised to 1,114,942 shares from 1,013,584 shares and the issuable common stock upon the exercise of outstanding stock options was increased to 485,938 from 441,762 shares in 2016. As of December 31, 2016, there were 560,862 shares available for future grants.
The Company granted 28,000 stock options to key employees and directors in 2017. Of the 28,000 stock options granted in 2017, 8,000 stock options were granted with a vesting rate of 60% in 2020, and 20% in 2021
F-32
Table of Contents
PACIFIC CITY FINANCIAL CORPORATION AND SUBSIDIARY
Notes to Consolidated Financial Statements
December 31, 2017 and 2016
and 20% in 2022 and 20,000 were granted with vesting rate of 20% per year. The Company did not grant any new stock options to key employees and directors in 2016. As of December 31, 2017 and December 31, 2016, the Company has 859,635 and 858,446 outstanding stock options, respectively. All granted and outstanding shares presented herein have been retroactively adjusted to reflect the effect of stock dividends on December 21, 2016.
The Company recognized share-based compensation cost of both $699 thousand and $729 thousand for the years ended December 31, 2017 and December 31, 2016, respectively. The Company realized $76 thousand and $116 thousand of income tax benefits related to share-based compensation in the year ended December 31, 2017 and December 31, 2016, respectively.
The fair value of each option issued in 2017, was estimated on the date of grant using the Black-Scholes option pricing model with the weighted average assumptions presented below:
| 2017 | 2016 | |||||||
| Expected volatility |
42.72 | % | — | |||||
| Expected term |
6.5 years | — | ||||||
| Expected dividends |
0.89 | % | — | |||||
| Risk free rate |
2.08 | % | — | |||||
The expected volatility is based on the historical volatility of the Company. The expected term represents the estimated average period of time that the options remain outstanding. Since the Company does not have sufficient historical data on the exercise of stock options, the expected term is based on the average of the vesting period and the contractual term. The risk free rate of return reflects the grant date interest rate offered for zero coupon U.S. Treasury bonds over the expected term of the options.
A summary of the status of the Company’s stock option plan as of December 31, 2017 and December 31, 2016, and changes during the respective years ended is presented below (per share data retroactively adjusted for the stock dividend):
| Shares | Weighted average exercise price |
Weighted average remaining contractual term |
Weighted average grant date fair value |
Aggregate Intrinsic Value |
||||||||||||||||
| December 31, 2017 |
||||||||||||||||||||
| Outstanding at beginning of year |
858,448 | $ | 8.60 | $ | 3.67 | $ | 6,352,515 | |||||||||||||
| Granted |
28,000 | 13.93 | 5.74 | |||||||||||||||||
| Exercised |
(26,811 | ) | 5.08 | 2.11 | ||||||||||||||||
| Forfeited or expired |
(2 | ) | — | — | ||||||||||||||||
|
|
|
|
|
|
|
|
|
|||||||||||||
| Outstanding at end of year |
859,635 | $ | 8.84 | 7.10 years | $ | 3.78 | $ | 6,154,987 | ||||||||||||
|
|
|
|
|
|
|
|
|
|||||||||||||
| Options exercisable |
281,481 | $ | 6.58 | 5.93 years | $ | 2.76 | $ | 2,651,551 | ||||||||||||
| December 31, 2016 |
||||||||||||||||||||
| Outstanding at beginning of year |
993,702 | $ | 8.09 | $ | 3.36 | $ | 4,879,077 | |||||||||||||
| Granted |
— | — | — | |||||||||||||||||
| Fractional share on stock dividend |
60 | — | — | |||||||||||||||||
| Exercised |
(125,921 | ) | 4.55 | 1.96 | ||||||||||||||||
| Forfeited or expired |
(9,393 | ) | 8.96 | 3.87 | ||||||||||||||||
|
|
|
|
|
|
|
|
|
|||||||||||||
| Outstanding at end of year |
858,448 | $ | 8.60 | 7.90 years | $ | 3.67 | $ | 3,777,171 | ||||||||||||
|
|
|
|
|
|
|
|
|
|||||||||||||
| Options exercisable |
175,827 | $ | 6.41 | 6.51 years | $ | 2.63 | $ | 1,158,700 | ||||||||||||
F-33
Table of Contents
PACIFIC CITY FINANCIAL CORPORATION AND SUBSIDIARY
Notes to Consolidated Financial Statements
December 31, 2017 and 2016
A summary of changes in unvested options and related information for the year ended December 31, 2017 is presented below:
| Unvested options |
Number of shares |
Weighted-Average Grant Date Fair Value (per share) |
||||||
| Unvested at January 1, 2017 |
682,619 | $ | 3.93 | |||||
| Granted |
28,000 | 5.74 | ||||||
| Vested |
(132,465 | ) | 2.87 | |||||
| Forfeited |
— | — | ||||||
|
|
|
|
|
|||||
| Unvested at December 31, 2017 |
578,154 | $ | 4.28 | |||||
|
|
|
|
|
|||||
The following information is presented for the exercised option.
| 2017 | 2016 | |||||||
| Intrinsic value of options exercised |
$ | 235,264 | $ | 597,166 | ||||
| Cash received from options exercised |
136,235 | 114,002 | ||||||
| Tax benefit from options exercised |
6,386 | 22,120 | ||||||
| Weighted average estimate fair value per share of options granted |
$ | 5.08 | $ | 5.01 | ||||
As of December 31, 2017 and December 31, 2016, there was approximately $1.6 million and $2.1 million, respectively, of total unrecognized compensation cost related to the outstanding stock options that will be recognized over a weighted average period of 2.92 years and 3.55 years, respectively.
Note 12—Employee Benefit 401(k) Plan
The Company has adopted a defined-contribution 401(k) plan for the benefit of its employees. The Company matches 75% of an employee’s contribution up to 8% of the employee’s salary each year. The Board of Directors may make a discretionary contribution to the plan annually. The Company’s contribution to the plan for was $629 thousand and $543 thousand for the years ended December 31, 2017 and December 31, 2016, respectively.
Note 13—Income Taxes
The components of income tax expense for the years ended December 31, 2017 and December 31, 2016 consisted of the following:
| (in thousands) | For the years ended December 31, | |||||||
| 2017 | 2016 | |||||||
| Current: |
||||||||
| Federal |
$ | 9,923 | $ | 7,869 | ||||
| State |
3,282 | 2,506 | ||||||
|
|
|
|
|
|||||
| Total current tax expense |
13,205 | 10,375 | ||||||
| Deferred |
||||||||
| Federal |
67 | (74 | ) | |||||
| Adjustment of deferred tax asset for enacted changes in tax rate |
1,622 | — | ||||||
| State |
45 | 100 | ||||||
|
|
|
|
|
|||||
| Total deferred tax expense |
1,734 | 26 | ||||||
|
|
|
|
|
|||||
| Total income tax expense |
$ | 14,939 | $ | 10,401 | ||||
|
|
|
|
|
|||||
F-34
Table of Contents
PACIFIC CITY FINANCIAL CORPORATION AND SUBSIDIARY
Notes to Consolidated Financial Statements
December 31, 2017 and 2016
A comparison of the federal statutory income tax rates to the Company’s effective income tax rates at December 31 is as follows:
| (in thousands) | December 31, 2017 | December 31, 2016 | ||||||||||||||
| Amount | Rate | Amount | Rate | |||||||||||||
| Statutory federal tax |
$ | 10,970 | 35.00 | % | $ | 8,541 | 35.00 | % | ||||||||
| State franchise tax, net of federal benefit |
2,164 | 6.90 | % | 1,694 | 6.94 | % | ||||||||||
| Stock-based compensation |
153 | 0.49 | % | 160 | 0.66 | % | ||||||||||
| Corporate tax rate change-federal |
1,622 | 5.17 | % | — | — | % | ||||||||||
| Other items, net |
30 | 0.10 | % | 6 | 0.02 | % | ||||||||||
|
|
|
|
|
|
|
|
|
|||||||||
| Tax expense |
$ | 14,939 | 47.66 | % | $ | 10,401 | 42.62 | % | ||||||||
|
|
|
|
|
|
|
|
|
|||||||||
On December 22, 2017, the Tax Cuts and Jobs Act (the “Tax Reform Act”) was enacted which included a number of changes to existing US tax laws, most notably a reduction of the US corporate tax rate from 35% to 21%, for tax years beginning in 2018. As a result of the Tax Reform Act, the Company revalued its deferred tax assets and liabilities and recorded a reduction of its deferred tax assets and liabilities in the amount of $1.6 million in deferred income tax expense in 2017. The Tax Reform Act also places limits on certain tax deductions beginning in 2018.
Deferred taxes are a result of differences between income tax accounting and U.S. GAAP with respect to income and expense recognition. The following is a summary of the components of the net deferred tax asset accounts recognized in the accompanying consolidated balance sheets at December 31, 2017 and December 31, 2016:
| (in thousands) | December 31, 2017 |
December 31, 2016 |
||||||
| Deferred tax assets: |
||||||||
| Allowance for loan losses |
$ | 3,587 | $ | 4,744 | ||||
| Stock-based compensation |
209 | 198 | ||||||
| Unrealized loss on investment securities |
574 | 489 | ||||||
| State tax benefit |
694 | 849 | ||||||
| Other assets |
614 | 778 | ||||||
|
|
|
|
|
|||||
| Total deferred tax assets |
5,678 | 7,058 | ||||||
| Deferred tax liabilities: |
||||||||
| Depreciation |
(423 | ) | (423 | ) | ||||
| Loans held-for-sale market adjustment |
(787 | ) | (463 | ) | ||||
| Deferred loan origination costs |
(527 | ) | (719 | ) | ||||
| Other liabilities |
(94 | ) | (199 | ) | ||||
|
|
|
|
|
|||||
| Total deferred tax liabilities |
(1,831 | ) | (1,804 | ) | ||||
|
|
|
|
|
|||||
| Net deferred tax assets |
$ | 3,847 | $ | 5,254 | ||||
|
|
|
|
|
|||||
The Company did not record valuation allowances for deferred tax assets as of December 31, 2017 and December 31, 2016 due to sufficient taxable income based on multiple years of consecutive profits and projected sustainable future profits. Management concluded that the related deferred tax assets were more likely than not to be realized and a valuation allowance was not necessary as of December 31, 2017 and December 31, 2016.
F-35
Table of Contents
PACIFIC CITY FINANCIAL CORPORATION AND SUBSIDIARY
Notes to Consolidated Financial Statements
December 31, 2017 and 2016
As of December 31, 2017, the Company had no net operating loss carryforwards and no tax credit carry forwards for both federal income tax and California franchise tax purposes.
Income tax returns for the years before 2014 are no longer subject to examination by the federal tax authority and income tax returns for the years before 2013 are no longer subject to examination by the California tax authority. The Company has evaluated the remaining open years subject to examination and concluded that there are no material uncertain tax positions as of December 31, 2017.
Note 14 —Other Expenses
Other expenses for the years ended December 31 comprise of the following:
| (in thousands) | For the years ended December 31, | |||||||
| 2017 | 2016 | |||||||
| Data processing |
$ | 1,074 | $ | 943 | ||||
| Marketing and business promotion |
1,647 | 1,449 | ||||||
| Loan expense |
437 | 341 | ||||||
| Professional fees |
1,842 | 1,997 | ||||||
| Regulatory assessments |
423 | 460 | ||||||
| Director fees and expenses |
757 | 708 | ||||||
| Office expenses |
1,303 | 1,206 | ||||||
| Provision for off-balance-sheet items |
9 | 10 | ||||||
| Other expenses |
1,148 | 1,119 | ||||||
|
|
|
|
|
|||||
| Total |
$ | 8,640 | $ | 8,233 | ||||
|
|
|
|
|
|||||
The provision for off-balance-sheet items is maintained at a level believed to be sufficient to absorb estimated probable incurred losses related to these unfunded credit facilities. The determination of the allowance adequacy is based on evaluations of the unfunded credit facilities including an assessment of the probability of commitment usage, credit risk factors for loans outstanding to these same customers, and the terms and expiration dates of the unfunded credit facilities. As of December 31, 2017 and December 31, 2016, the provision for off-balance sheet items amounted to $9 thousand and $10 thousand, respectively. Net adjustments to the allowance for off-balance sheet items are included in other expenses.
Note 15—Earnings Per Share
Basic EPS is computed by dividing income available to common stockholders by the weighted average number of common shares outstanding for the period. Diluted EPS reflects the potential dilution that could occur if options or other contracts to issue common stock were exercised or converted into common stock, or resulted in the issuance of common stock that then share in the earnings of the entity.
F-36
Table of Contents
PACIFIC CITY FINANCIAL CORPORATION AND SUBSIDIARY
Notes to Consolidated Financial Statements
December 31, 2017 and 2016
The following is a reconciliation of net income and shares outstanding to the income and number of share used to compute EPS:
| (in thousands, except per share data) | ||||||||
| 2017 | 2016 | |||||||
| Basic EPS: |
||||||||
| Net income as reported |
$ | 16,403 | $ | 14,002 | ||||
|
|
|
|
|
|||||
| Net income available to common shareholders |
$ | 16,403 | $ | 14,002 | ||||
|
|
|
|
|
|||||
| Unadjusted weighted-average common shares outstanding |
13,417,899 | 13,391,222 | ||||||
| Impact of weighted shares issued, retired, or purchased during the year |
(9,869 | ) | (858,415 | ) | ||||
|
|
|
|
|
|||||
| Weighted-average common shares outstanding |
13,408,030 | 12,532,807 | ||||||
|
|
|
|
|
|||||
| Earnings per share available to common stockholders—basic |
$ | 1.22 | $ | 1.12 | ||||
|
|
|
|
|
|||||
| Diluted EPS: |
||||||||
| Net income available to common shareholders |
$ | 16,403 | $ | 14,002 | ||||
|
|
|
|
|
|||||
| Weighted-average common shares outstanding |
13,408,030 | 12,532,807 | ||||||
| Weighted average dilutive effect of stock options |
132,263 | 75,183 | ||||||
|
|
|
|
|
|||||
| Weighted-average diluted common shares outstanding |
13,540,293 | $ | 12,607,990 | |||||
|
|
|
|
|
|||||
| Earnings per share available to common stockholders—diluted |
$ | 1.21 | $ | 1.11 | ||||
|
|
|
|
|
|||||
Note 16—Commitments and Contingencies
In the ordinary course of business, the Company enters into financial commitments to meet the financing needs of its customers. These financial commitments include commitments to extend credit and standby letters of credit. Those instruments involve to varying degrees, elements of credit, and interest rate risk not recognized in the Company’s consolidated financial statements.
The Company’s exposure to loan loss in the event of nonperformance on commitments to extend credit and standby letters of credit is represented by the contractual amount of those instruments. The Company uses the same credit policies in making commitments as it does for the loans reflected in the consolidated financial statements.
As of December 31, the Company had the following outstanding financial commitments whose contractual amount represents credit risk:
| (in thousands) | December 31, 2017 |
December 31, 2016 |
||||||
| Commitments to extend credit |
$ | 109,835 | $ | 103,970 | ||||
| Stand by letters of credit |
3,309 | 2,822 | ||||||
| Commercial letters of credit |
233 | 233 | ||||||
|
|
|
|
|
|||||
| Total |
$ | 113,377 | $ | 107,025 | ||||
|
|
|
|
|
|||||
Commitments to extend credit are agreements to lend to a customer as long as there is no violation of any condition established in the contract. Since many of the commitments are expected to expire without being drawn
F-37
Table of Contents
PACIFIC CITY FINANCIAL CORPORATION AND SUBSIDIARY
Notes to Consolidated Financial Statements
December 31, 2017 and 2016
upon, the total amounts do not necessarily represent future cash requirements. The Company evaluates each client’s credit worthiness on a case-by-case basis. The amount of collateral obtained if deemed necessary by the Company is based on management’s credit evaluation of the customer. The majority of the Company’s commitments to extend credit are secured by real estate.
The Company leases its offices and loan production offices under operating leases that expire at various dates through April 30, 2027. The Company is also responsible for its pro rata share of common area expenses including maintenance, taxes, and insurance to the extent that the expenses exceed the Company’s pro rata share of the base year expenses.
At December 31, 2017, the future lease rental payable under non-cancelable operating lease commitments for the Company’s offices and loan production offices were as follows:
| (in thousands) | ||||
| Year ending: |
||||
| 2018 |
$ | 2,289 | ||
| 2019 |
2,215 | |||
| 2020 |
2,180 | |||
| 2021 |
1,812 | |||
| 2022 |
1,686 | |||
| Thereafter |
2,533 | |||
|
|
|
|||
| Total |
$ | 12,715 | ||
|
|
|
|||
The minimum rental payments shown above are given for the existing lease obligations and are not a forecast of future rental expense. Total rental expense was approximately $2.6 million and $2.6 million for the years ended December 31, 2017 and December 31, 2016, respectively.
The Company is involved in various matters of litigation, which have arisen in the ordinary course of business. In the opinion of management, the disposition of pending matters of litigation will not have a material effect on the Company’s consolidated financial statements.
Note 17—Fair Value Measurements
Fair value is the exchange price that would be received for an asset or paid to transfer a liability (i.e., an exit price), in the principal or most advantageous market for the asset or liability, in an orderly transaction between market participants on the measurement date. Current accounting guidance establishes a fair value hierarchy, which requires an entity to maximize the use of observable inputs when measuring fair value.
The following is a description of valuation methodologies used for assets and liabilities recorded at fair value:
Investment securities: The fair values of securities available-for-sale are determined by obtaining quoted prices on nationally recognized securities exchanges (Level 1) or matrix pricing, which is a mathematical technique used widely in the industry to value debt securities without relying exclusively on quoted prices for specific securities but rather by relying on the securities’ relationship to other benchmark quoted securities (Level 2). Management reviews the valuation techniques and assumptions used by the provider and determines that the provider uses widely accepted valuation techniques based on observable market inputs appropriate for the type of security being measured. Securities held-to-maturity are not measured at fair value on a recurring basis.
F-38
Table of Contents
PACIFIC CITY FINANCIAL CORPORATION AND SUBSIDIARY
Notes to Consolidated Financial Statements
December 31, 2017 and 2016
Loans: The Bank does not record loans at fair value on a recurring basis. However, from time to time, fair value adjustments are recorded on these loans to reflect (i) partial write-downs, through charge-offs or specific reserve allowances, that are based on the current appraised or market-quoted value of the underlying collateral or (ii) the full charge-off of the loan carrying value. In some cases, the properties for which market quotes or appraised values have been obtained are located in areas where comparable sales data is limited, outdated, or unavailable. Fair value estimates for collateral-dependent impaired loans are obtained from real estate brokers or other third-party consultants (Level 3).
Other real estate owned: Nonrecurring adjustments to certain commercial and residential real estate properties classified as OREO are measured at the lower of carrying amount or fair value, less costs to sell. Fair values are generally based on third-party appraisals of the property, resulting in a Level 3 classification. In certain cases, OREO may be measured at fair value based on a sales price in an executed sales contract for which escrow has not closed as of the measurement date.
The following table provides the hierarchy and fair value for each major category of assets measured at fair value at December 31, 2017 and December 31, 2016:
| (in thousands) | Fair value measurements using | |||||||||||||||
| December 31, 2017 |
Level 1 | Level 2 | Level 3 | Total | ||||||||||||
| Assets measured at fair value on a: |
||||||||||||||||
| Recurring basis: |
||||||||||||||||
| Investment securities available-for-sale |
||||||||||||||||
| U.S. government-sponsored entities and agencies |
$ | — | $ | 24,925 | $ | — | $ | 24,925 | ||||||||
| States and political subdivisions |
— | 2,375 | — | 2,375 | ||||||||||||
| Mortgage-back securities-residential |
— | 51,904 | — | 51,904 | ||||||||||||
| Collateralized mortgage obligations |
— | 50,485 | — | 50,485 | ||||||||||||
|
|
|
|
|
|
|
|
|
|||||||||
| Total investment securities available-for-sale |
$ | — | $ | 129,689 | $ | — | $ | 129,689 | ||||||||
|
|
|
|
|
|
|
|
|
|||||||||
| Non-recurring basis: |
||||||||||||||||
| Impaired loans, net of specific reserves Commercial term loans |
$ | — | $ | — | $ | — | $ | — | ||||||||
| (in thousands) | Fair value measurements using | |||||||||||||||
| December 31, 2016 |
Level 1 | Level 2 | Level 3 | Total | ||||||||||||
| Assets measured at fair value on a : |
||||||||||||||||
| Recurring basis: |
||||||||||||||||
| Investment securities available-for-sale |
||||||||||||||||
| U.S. government-sponsored entities and agencies |
$ | — | $ | 20,579 | $ | — | $ | 20,579 | ||||||||
| States and political subdivisions |
— | 2,662 | — | 2,662 | ||||||||||||
| Mortgage-back securities-residential |
— | 36,733 | — | 36,733 | ||||||||||||
| Collateralized mortgage obligations |
— | 22,864 | — | 22,864 | ||||||||||||
|
|
|
|
|
|
|
|
|
|||||||||
| Total investment securities available-for-sale |
$ | — | $ | 82,838 | $ | — | $ | 82,838 | ||||||||
|
|
|
|
|
|
|
|
|
|||||||||
| Non-recurring basis: |
||||||||||||||||
| Impaired loans, net of specific reserves Commercial term loans |
$ | — | $ | — | $ | 352 | $ | 352 | ||||||||
F-39
Table of Contents
PACIFIC CITY FINANCIAL CORPORATION AND SUBSIDIARY
Notes to Consolidated Financial Statements
December 31, 2017 and 2016
As of December 31, 2017 and December 31, 2016, there were no Level 3 assets or liabilities measured at fair value on a recurring basis. Additionally, there were no transfers between Level 1, 2, and 3 during the years ended December 31, 2017 and December 31, 2016.
The table below provides information about valuation method, inputs, and assumptions for nonrecurring Level 3 financial measurements. There were no Level 3 assets or liabilities measured at fair value on a nonrecurring basis at December 31, 2017.
| (in thousands) | Fair value |
Valuation method |
Unobservable inputs | |||
| Impaired loans, net of specific reserves |
$352 | Appraised value | Fair values are based on appraisals and escrow documents |
For assets measured at fair value, the following table presents the total net gains, which include charge-offs, recoveries, specific reserves, gain on sale of OREO, and OREO valuation write-downs recognized in 2017 and 2016:
| (in thousands) | 2017 | 2016 | ||||||
| Collateral-dependent impaired loans: |
||||||||
| Real estate |
$ | (489 | ) | $ | (176 | ) | ||
| Other real estate owned |
(20 | ) | — | |||||
|
|
|
|
|
|||||
| Total net losses recognized |
$ | (509 | ) | $ | (176 | ) | ||
|
|
|
|
|
|||||
Fair Value of Financial Instruments
The fair value of a financial instrument is the amount at which the asset or obligation could be exchanged in a current transaction between willing parties, other than in a forced or liquidation sale. Fair value estimates are made at a specific point in time based on relevant market information and information about the financial instrument. These estimates do not reflect any premium or discount that could result from offering for sale at one time the entire holdings of a particular financial instrument. Because no market value exists for a significant portion of the financial instruments, fair value estimates are based on judgments regarding future expected loss experience, current economic conditions, risk characteristics of various financial instruments, and other factors. These estimates are subjective in nature, involve uncertainties and matters of judgment and, therefore, cannot be determined with precision. Changes in assumptions could significantly affect the estimates.
Fair value estimates are based on financial instruments both on and off the consolidated balance sheet without attempting to estimate the value of anticipated future business and the value of assets and liabilities that are not considered financial instruments. Additionally, tax consequences related to the realization of the unrealized gains and losses can have a potential effect on fair value estimates and have not been considered in many of the estimates.
The following methods and assumptions were used to estimate the fair value of significant financial instruments. Refer to Note 1—Summary of Significant Accounting Policies for additional discussion on the Company’s methodologies.
F-40
Table of Contents
PACIFIC CITY FINANCIAL CORPORATION AND SUBSIDIARY
Notes to Consolidated Financial Statements
December 31, 2017 and 2016
Financial assets
The carrying amounts of cash, short-term investments, and accrued interest receivable are considered to approximate fair value. Short-term investments include interest-bearing deposits with banks. The fair values of investment securities are generally based on matrix pricing. The fair value of loans is estimated using a combination of techniques, including discounting estimated future cash flows and quoted market prices of similar instruments where available. OREO is fair valued at the time the loan is foreclosed upon and the asset is transferred to OREO. The value is based primarily on third party appraisals less costs to sell and result in a Level 3 classification of the inputs for determining fair value. OREO is reviewed and evaluated on at least semi-annual basis for additional impairment and adjusted to lower of cost or market. It is not practical to determine the fair value of FHLB stock due to restrictions placed on its transferability. The fair value of servicing assets is based on a cash flow valuation model that uses market-based assumptions.
Financial liabilities
The carrying amounts of deposit liabilities payable on demand, commercial paper, and accrued interest payable are considered to approximate fair value. For fixed maturity deposits, fair value is estimated by discounting estimated future cash flows using currently offered rates for deposits of similar remaining maturities. Borrowings consist of FHLB advances. Discounted cash flows based on current market rates for borrowings with similar remaining maturities are used to estimate the fair value of borrowings and result in a Level 2 classification of the inputs for determining fair value.
Off-balance-sheet financial instruments
The fair value of commitments to extend credit and standby letters of credit is estimated using the fees currently charged to enter into similar agreements. The fair value of these financial instruments is not material and is excluded from the table below.
The estimated fair value of financial instruments at December 31, 2017 and December 31, 2016 is summarized as follows:
| (in thousands) | December 31, 2017 | |||||||||||||||||||
| Carrying value |
Fair Value Mesurements Using | |||||||||||||||||||
| Fair value | Level 1 | Level 2 | Level 3 | |||||||||||||||||
| Financial assets: |
||||||||||||||||||||
| Interest-bearing deposits |
$ | 56,996 | $ | 56,996 | $ | 56,996 | $ | — | $ | — | ||||||||||
| Investment securities |
150,759 | 150,686 | — | 150,686 | — | |||||||||||||||
| Loans, net |
1,177,775 | 1,177,539 | — | — | 1,177,539 | |||||||||||||||
| Loans held-for-sale |
5,297 | 5,813 | — | 5,813 | — | |||||||||||||||
| Federal home loan bank and other restricted stock |
6,589 | NA | NA | NA | NA | |||||||||||||||
| Other real estate owned |
99 | 110 | — | — | 110 | |||||||||||||||
| Financial liabilities: |
||||||||||||||||||||
| Deposits |
$ | 1,251,289 | $ | 1,250,259 | $ | — | $ | 1,250,259 | $ | — | ||||||||||
| Borrowings from FHLB |
40,000 | 39,778 | — | 39,778 | — | |||||||||||||||
F-41
Table of Contents
PACIFIC CITY FINANCIAL CORPORATION AND SUBSIDIARY
Notes to Consolidated Financial Statements
December 31, 2017 and 2016
| December 31, 2016 | ||||||||||||||||||||
| Carrying value |
Fair Value Mesurements Using | |||||||||||||||||||
| Fair value | Level 1 | Level 2 | Level 3 | |||||||||||||||||
| Financial assets: |
||||||||||||||||||||
| Interest-bearing deposits |
$ | 51,463 | $ | 51,463 | $ | 51,463 | $ | — | $ | — | ||||||||||
| Investment securities |
100,422 | 100,174 | — | 100,174 | — | |||||||||||||||
| Loans, net |
1,019,792 | 1,018,458 | — | — | 1,018,458 | |||||||||||||||
| Loans held-for-sale |
2,150 | 2,302 | — | 2,302 | — | |||||||||||||||
| Federal home loan bank and other restricted stock |
5,686 | NA | NA | NA | NA | |||||||||||||||
| Other real estate owned |
506 | 547 | — | — | 547 | |||||||||||||||
| Financial liabilities: |
||||||||||||||||||||
| Deposits |
$ | 1,091,812 | $ | 1,090,129 | $ | — | $ | 1,090,129 | $ | — | ||||||||||
Note 18—Regulatory Matters
Banks and bank holding companies are subject to regulatory capital requirements administered by federal banking agencies. Capital adequacy guidelines and, additionally for banks, prompt corrective action regulations, involve quantitative measures of assets, liabilities, and certain off-balance-sheet items calculated under regulatory accounting practices. Capital amounts and classifications are also subject to qualitative judgments by regulators. Failure to meet capital requirements can initiate regulatory action. The final rules implementing Basel Committee on Banking Supervision’s capital guidelines for U.S. banks (Basel III rules) became effective for the Company on January 1, 2015 with full compliance with all of the requirements being phased in over a multi-year schedule, and fully phased in by January 1, 2019. Under the Basel III rules, the Company must hold a capital conservation buffer above the adequately capitalized risk-based capital ratios. The capital conservation buffer is being phased in from 0.0% for 2015 to 2.50% by 2019. The capital conservation buffer for 2016 and 2017 are 0.625% and 1.25%, respectively. The net unrealized gain or loss on available for sale securities is not included in computing regulatory capital. Management believes as of December 31, 2017 and 2016, the Company and Bank meet all capital adequacy requirements to which they are subject.
Prompt corrective action regulations provide five classifications: well capitalized, adequately capitalized, undercapitalized, significantly undercapitalized, and critically undercapitalized, although these terms are not used to represent overall financial condition. If adequately capitalized, regulatory approval is required to accept brokered deposits. If undercapitalized, capital distributions are limited, as is asset growth and expansion, and capital restoration plans are required. At year-end 2017 and 2016, the most recent regulatory notifications categorized the Bank as well capitalized under the regulatory framework for prompt corrective action. There are no conditions or events since that notification that management believes have changed the institution’s category.
The Bank’s capital conservation buffer was 5.1% and 5.5% and the Company’s capital conservation buffer was 5.2% and 5.6% as of December 31, 2017 and 2016, respectively.
F-42
Table of Contents
PACIFIC CITY FINANCIAL CORPORATION AND SUBSIDIARY
Notes to Consolidated Financial Statements
December 31, 2017 and 2016
The following table presents the Bank’s actual and required capital amounts and ratios, exclusive of the capital conservation buffer, as of December 31, 2017 and as of December 31, 2016 under Basel III rules, and actual and required capital amount:
| (in thousands) | Amount of capital required | |||||||||||||||||||||||
| Actual | For capital adequacy purposes |
To be well capitalized under prompt corrective provisions |
||||||||||||||||||||||
| Amount | Ratio | Amount | Ratio | Amount | Ratio | |||||||||||||||||||
| As of December 31, 2017: |
||||||||||||||||||||||||
| Common tier 1 capital (to risk-weighted assets) |
$ | 141,361 | 12.1 | % | $ | 52,747 | 4.5 | % | $ | 76,189 | 6.5 | % | ||||||||||||
| Total capital (to risk-weighted assets) |
153,705 | 13.1 | % | 93,723 | 8.0 | % | 1,117,153 | 10.0 | % | |||||||||||||||
| Tier 1 capital (to risk-weighted assets) |
141,361 | 12.1 | % | 70,329 | 6.0 | % | 93,772 | 8.0 | % | |||||||||||||||
| Tier 1 capital (to average assets) |
141,361 | 9.9 | % | 56,886 | 4.0 | % | 71,107 | 5.0 | % | |||||||||||||||
| As of December 31, 2016: |
||||||||||||||||||||||||
| Common tier 1 capital (to risk-weighted assets) |
$ | 125,634 | 12.4 | % | $ | 45,593 | 4.5 | % | $ | 65,857 | 6.5 | % | ||||||||||||
| Total capital (to risk-weighted assets) |
137,066 | 13.5 | % | 81,224 | 8.0 | % | 101,530 | 10.0 | % | |||||||||||||||
| Tier 1 capital (to risk-weighted assets) |
125,634 | 12.4 | % | 60,791 | 6.0 | % | 81,054 | 8.0 | % | |||||||||||||||
| Tier 1 capital (to average assets) |
125,634 | 10.4 | % | 48,321 | 4.0 | % | 60,401 | 5.0 | % | |||||||||||||||
As of December 31, 2017 and December 31, 2016, the Company is subject to similar requirements administered by its primary regulator, the FRB. The following table presents the Company’s actual and required capital amounts and ratios as of December 31, 2017 and as of December 31, 2016 under Basel III rules, and actual and required capital amounts:
| (in thousands) | Amount of capital required | |||||||||||||||||||||||
| Actual | For capital adequacy purposes |
To be well capitalized under prompt corrective provisions |
||||||||||||||||||||||
| Amount | Ratio | Amount | Ratio | Amount | Ratio | |||||||||||||||||||
| As of December 31, 2017: |
||||||||||||||||||||||||
| Common tier 1 capital (to risk-weighted assets) |
$ | 142,370 | 12.2 | % | $ | 52,730 | 4.5 | % | NA | NA | ||||||||||||||
| Total capital (to risk-weighted assets) |
154,715 | 13.2 | % | 93,767 | 8.0 | % | NA | NA | ||||||||||||||||
| Tier 1 capital (to risk-weighted assets) |
142,370 | 12.2 | % | 70,306 | 6.0 | % | NA | NA | ||||||||||||||||
| Tier 1 capital (to average assets) |
142,370 | 10.0 | % | 56,891 | 4.0 | % | NA | NA | ||||||||||||||||
| As of December 31, 2016: |
||||||||||||||||||||||||
| Common tier 1 capital (to risk-weighted assets) |
$ | 126,817 | 12.5 | % | $ | 45,654 | 4.5 | % | NA | NA | ||||||||||||||
| Total capital (to risk-weighted assets) |
138,248 | 13.6 | % | 81,322 | 8.0 | % | NA | NA | ||||||||||||||||
| Tier 1 capital (to risk-weighted assets) |
126,817 | 12.5 | % | 60,872 | 6.0 | % | NA | NA | ||||||||||||||||
| Tier 1 capital (to average assets) |
126,817 | 10.5 | % | 48,311 | 4.0 | % | NA | NA | ||||||||||||||||
The California Financial Code provides that a bank may not make a cash distribution to its shareholder in excess of the lesser of the bank’s undivided profits or the bank’s net income for its last three fiscal years less the amount of any distribution made to the bank’s shareholder during the same period.
F-43
Table of Contents
PACIFIC CITY FINANCIAL CORPORATION AND SUBSIDIARY
Notes to Consolidated Financial Statements
December 31, 2017 and 2016
The California general corporation law prohibits the Company from paying dividends on its common stock unless: (i) its retained earnings, immediately prior to the dividend payment, equals or exceeds the amount of the dividend or (ii) immediately after giving effect to the dividend, the sum of the Company’s assets (exclusive of goodwill and deferred charges) would be at least equal to 125% of its liabilities (not including deferred taxes, deferred income, and other deferred liabilities) and the current assets of the Company would be at least equal to its current liabilities, or, if the average of its earnings before taxes on income and before its interest expense for the two preceding fiscal years, at least equal to 125% of its current liabilities.
Note 19—Condensed Parent Company Financial Statements
Condensed parent company financial statements, which include transactions with the subsidiary, follow:
| Condensed Balance Sheets |
||||||||
| (in thousands) |
2017 | 2016 | ||||||
| Assets |
||||||||
| Cash |
$ | 990 | $ | 1,187 | ||||
| Investment in Pacific City Bank |
141,174 | 125,825 | ||||||
| Other assets |
20 | 23 | ||||||
|
|
|
|
|
|||||
| Total assets |
$ | 142,184 | $ | 127,035 | ||||
|
|
|
|
|
|||||
| Liabilities and Shareholders’ Equity |
||||||||
| Other liabilities |
$ | — | $ | 28 | ||||
|
|
|
|
|
|||||
| Total liabilities |
— | 28 | ||||||
|
|
|
|
|
|||||
| Total shareholders’ equity |
142,184 | 127,007 | ||||||
|
|
|
|
|
|||||
| Total liabilities and shareholders’ equity |
$ | 142,184 | $ | 127,035 | ||||
|
|
|
|
|
|||||
F-44
Table of Contents
PACIFIC CITY FINANCIAL CORPORATION AND SUBSIDIARY
Notes to Consolidated Financial Statements
December 31, 2017 and 2016
| Condensed Statements of Income and Comprehensive Income Years ended December 31, 2017 and 2016 |
||||||||
| (in thousands) |
2017 | 2016 | ||||||
| Statements of Income |
||||||||
| Income: |
||||||||
| Dividends from Pacific City Bank |
$ | 1,566 | $ | — | ||||
| Other income |
— | 23 | ||||||
|
|
|
|
|
|||||
| Total income |
1,566 | 23 | ||||||
|
|
|
|
|
|||||
| Expense: |
||||||||
| Other expenses |
454 | 415 | ||||||
|
|
|
|
|
|||||
| Total expenses |
454 | 415 | ||||||
|
|
|
|
|
|||||
| Income (Loss) before taxes and equity in undistributed income from Bank |
1,112 | (392 | ) | |||||
| Income tax benefit |
(190 | ) | (167 | ) | ||||
|
|
|
|
|
|||||
| Income (Loss) before equity in undistributed income from Bank |
1,302 | (225 | ) | |||||
| Equity in undistributed income from Pacific City Bank |
15,101 | 14,227 | ||||||
|
|
|
|
|
|||||
| Net income |
$ | 16,403 | $ | 14,002 | ||||
|
|
|
|
|
|||||
| 2017 | 2016 | |||||||
| Statements of Comprehensive Income |
||||||||
| Net income |
$ | 16,403 | $ | 14,002 | ||||
| Other comprehensive loss: |
||||||||
| Unrealized loss on available-for-sale securities |
(778 | ) | (245 | ) | ||||
| Add: reclassification adjustment for net gain included in net income |
— | 8 | ||||||
| Income tax benefit related to items of other comprehensive income |
328 | 102 | ||||||
|
|
|
|
|
|||||
| Total other comprehensive loss, net of tax |
(450 | ) | (135 | ) | ||||
|
|
|
|
|
|||||
| Total Comprehensive Income |
$ | 15,953 | $ | 13,867 | ||||
|
|
|
|
|
|||||
F-45
Table of Contents
PACIFIC CITY FINANCIAL CORPORATION AND SUBSIDIARY
Notes to Consolidated Financial Statements
December 31, 2017 and 2016
| Condensed Statements of Cash Flows | ||||||||
| (in thousands) | 2017 | 2016 | ||||||
| Operating activities: |
||||||||
| Net income |
$ | 16,403 | $ | 14,002 | ||||
| Adjustments to reconcile net income to net cash and cash equivalents used in operating activities: |
||||||||
| Equity in undistributed income from Pacific City Bank |
(15,101 | ) | (14,227 | ) | ||||
| Net change in: |
||||||||
| Other assets |
3 | (12 | ) | |||||
| Other liabilities |
(28 | ) | 28 | |||||
|
|
|
|
|
|||||
| Net cash and cash equivalents provided (used in) operating activities |
1,277 | (209 | ) | |||||
|
|
|
|
|
|||||
| Investing activities: |
||||||||
| Investment in Pacific City Bank |
— | (14,500 | ) | |||||
|
|
|
|
|
|||||
| Net cash used in investing activities |
— | (14,500 | ) | |||||
|
|
|
|
|
|||||
| Financing activities: |
||||||||
| Dividend payments |
(1,609 | ) | (1,380 | ) | ||||
| Issuance of common stock |
134 | 15,762 | ||||||
|
|
|
|
|
|||||
| Net cash (used) provided in financing activities |
(1,475 | ) | 14,382 | |||||
|
|
|
|
|
|||||
| Decrease in cash and cash equivalents |
(198 | ) | (327 | ) | ||||
| Cash and cash equivalents at beginning of year |
1,187 | 1,514 | ||||||
|
|
|
|
|
|||||
| Cash and cash equivalents at end of year |
$ | 989 | $ | 1,187 | ||||
|
|
|
|
|
|||||
Note 20—Subsequent Events
The Company has evaluated the effects of events that have occurred subsequent to December 31, 2017 through the issuance date of its 2017 consolidated financial statements on March 16, 2018. There have been no material events that would require disclosure in the consolidated financial statements or in the notes to the consolidated financial statements.
F-46
Table of Contents
PACIFIC CITY FINANCIAL CORPORATION AND SUBSIDIARY
Consolidated Balance Sheets
(in thousands, except share data)
| March 31, 2018 (Unaudited) |
December 31, 2017 |
|||||||
| Assets | ||||||||
| Cash and due from banks |
$ | 16,765 | $ | 16,662 | ||||
| Interest-bearing deposits in other financial institutions |
164,788 | 56,996 | ||||||
|
|
|
|
|
|||||
| Total cash and cash equivalents |
181,553 | 73,658 | ||||||
|
|
|
|
|
|||||
| Securities available-for-sale, at fair value |
125,940 | 129,689 | ||||||
| Securities held-to-maturity, at amortized cost (fair value of $20,252 at March 31, 2018 and $20,997 at December 31, 2017) |
20,826 | 21,070 | ||||||
|
|
|
|
|
|||||
| Total investment securities |
146,766 | 150,759 | ||||||
|
|
|
|
|
|||||
| Loans held-for-sale |
6,182 | 5,297 | ||||||
| Loans, net of deferred loan costs (fees) |
1,223,272 | 1,189,999 | ||||||
| Less: allowance for loan losses |
(12,371 | ) | (12,224 | ) | ||||
|
|
|
|
|
|||||
| Net loans |
1,210,901 | 1,177,775 | ||||||
|
|
|
|
|
|||||
| Premises and equipment, net |
5,069 | 4,723 | ||||||
| Federal Home Loan Bank and other restricted stock, at cost |
6,589 | 6,589 | ||||||
| Other real estate owned, net of valuation allowance |
— | 99 | ||||||
| Deferred tax assets, net |
4,239 | 3,847 | ||||||
| Servicing assets |
8,890 | 8,973 | ||||||
| Accrued interest receivable and other assets |
8,781 | 10,279 | ||||||
|
|
|
|
|
|||||
| Total assets |
$ | 1,578,970 | $ | 1,441,999 | ||||
|
|
|
|
|
|||||
| Liabilities and Shareholders’ Equity | ||||||||
| Deposits: |
||||||||
| Noninterest-bearing demand |
$ | 321,109 | $ | 319,026 | ||||
| Savings, NOW and money market accounts |
290,105 | 317,878 | ||||||
| Time deposits under $250,000 |
435,326 | 347,774 | ||||||
| Time deposits $250,000 and over |
335,385 | 266,612 | ||||||
|
|
|
|
|
|||||
| Total deposits |
1,381,925 | 1,251,290 | ||||||
| Borrowings from Federal Home Loan Bank |
40,000 | 40,000 | ||||||
| Accrued interest payable and other liabilities |
9,812 | 8,525 | ||||||
|
|
|
|
|
|||||
| Total liabilities |
1,431,737 | 1,299,815 | ||||||
| Commitments and contingent liabilities |
||||||||
| Common stock, 60,000,000 shares authorized, no par value; issued and outstanding 13,424,777 shares at March 31, 2018 and 13,417,899 at December 31, 2017 |
125,511 | 125,430 | ||||||
| Additional paid-in capital |
3,072 | 2,941 | ||||||
| Retained earnings |
20,898 | 15,036 | ||||||
| Accumulated other comprehensive loss, net |
(2,248 | ) | (1,223 | ) | ||||
|
|
|
|
|
|||||
| Total shareholders’ equity |
147,233 | 142,184 | ||||||
|
|
|
|
|
|||||
| Total liabilities and shareholders’ equity |
$ | 1,578,970 | $ | 1,441,999 | ||||
|
|
|
|
|
|||||
F-47
Table of Contents
PACIFIC CITY FINANCIAL CORPORATION AND SUBSIDIARY
Consolidated Statements of Income (Unaudited)
(in thousands, except share and per share data)
| Three Months Ended March 31, | ||||||||
| 2018 | 2017 | |||||||
| Interest income: |
||||||||
| Interest and fees on loans |
$ | 17,440 | $ | 13,877 | ||||
| Interest on tax-exempt investment securities |
40 | 48 | ||||||
| Interest on investment securities |
808 | 460 | ||||||
| Interest and dividend on other interest-earning assets |
340 | 232 | ||||||
|
|
|
|
|
|||||
| Total interest income |
18,628 | 14,617 | ||||||
| Interest expense: |
||||||||
| Interest on deposits |
3,166 | 2,147 | ||||||
| Interest on other borrowings |
168 | — | ||||||
|
|
|
|
|
|||||
| Total interest expense |
3,334 | 2,147 | ||||||
|
|
|
|
|
|||||
| Net interest income |
15,294 | 12,470 | ||||||
| Provision (reversal) for loan losses |
95 | (198 | ) | |||||
|
|
|
|
|
|||||
| Net interest income after provision (reversal) for loan losses |
15,199 | 12,668 | ||||||
| Noninterest income: |
||||||||
| Service charges and fees on deposits |
349 | 350 | ||||||
| Servicing income |
626 | 566 | ||||||
| Gain on sale of loans |
2,116 | 2,344 | ||||||
| Other income |
271 | 229 | ||||||
|
|
|
|
|
|||||
| Total noninterest income |
3,362 | 3,489 | ||||||
| Noninterest expense: |
||||||||
| Salaries and employee benefits |
6,246 | 5,521 | ||||||
| Occupancy and equipment |
1,144 | 1,096 | ||||||
| Professional fees |
523 | 420 | ||||||
| Marketing and business promotion |
388 | 301 | ||||||
| Data processing |
302 | 249 | ||||||
| Director fees and expenses |
230 | 163 | ||||||
| Loan related expense |
59 | 111 | ||||||
| Regulatory assessments |
132 | 98 | ||||||
| Provision (reversal) for off-balance-sheet items |
(3 | ) | 13 | |||||
| Other expenses |
610 | 549 | ||||||
|
|
|
|
|
|||||
| Total noninterest expense |
9,631 | 8,521 | ||||||
|
|
|
|
|
|||||
| Income before income taxes |
8,930 | 7,636 | ||||||
| Income tax expense |
2,666 | 3,238 | ||||||
|
|
|
|
|
|||||
| Net income |
$ | 6,264 | $ | 4,398 | ||||
|
|
|
|
|
|||||
| Earnings per share available to common shareholders, basic |
$ | 0.47 | $ | 0.33 | ||||
| Earnings per share available to common shareholders, diluted |
$ | 0.46 | $ | 0.33 | ||||
| Weighted-average common shares outstanding, basic |
13,418,259 | 13,395,363 | ||||||
| Weighted-average common shares outstanding, diluted |
13,586,759 | 13,503,502 | ||||||
F-48
Table of Contents
PACIFIC CITY FINANCIAL CORPORATION AND SUBSIDIARY
Consolidated Statements of Comprehensive Income (Unaudited)
(in thousands)
| Three Months Ended March 31, |
||||||||
| 2018 | 2017 | |||||||
| Net income |
$ | 6,264 | $ | 4,398 | ||||
| Other comprehensive income (loss): |
||||||||
| Unrealized gain (loss) on securities available-for-sale: |
||||||||
| Unrealized gain (loss) arising during the period |
(1,445 | ) | 119 | |||||
| Income tax benefit (expense) related to items of other comprehensive income |
420 | (49 | ) | |||||
|
|
|
|
|
|||||
| Total other comprehensive income (loss), net of tax |
(1,025 | ) | 70 | |||||
|
|
|
|
|
|||||
| Total comprehensive income |
$ | 5,239 | $ | 4,468 | ||||
|
|
|
|
|
|||||
F-49
Table of Contents
PACIFIC CITY FINANCIAL CORPORATION AND SUBSIDIARY
Consolidated Statements of Changes in Shareholders’ Equity (Unaudited)
(in thousands, except per share data)
| Shareholders’ Equity | ||||||||||||||||||||||||
| Common Stock Outstanding Shares |
Common stock |
Additional Paid-in Capital |
Retained Earnings |
Accumulated Other Comprehensive Loss |
Total | |||||||||||||||||||
| Balance at January 1, 2017 |
13,391,222 | $ | 125,094 | $ | 2,444 | $ | — | $ | (531 | ) | $ | 127,007 | ||||||||||||
| Comprehensive income |
||||||||||||||||||||||||
| Net income |
— | — | — | 4,398 | — | 4,398 | ||||||||||||||||||
| Other comprehensive income, net of tax |
— | — | — | — | 70 | 70 | ||||||||||||||||||
| Share-based compensation expense |
— | — | 175 | — | — | 175 | ||||||||||||||||||
| Stock options exercised |
15,464 | 178 | (117 | ) | — | — | 61 | |||||||||||||||||
| Retirement of fractional shares |
(134 | ) | (2 | ) | — | — | — | (2 | ) | |||||||||||||||
| Cash dividends declared on common stock ($0.03 per common share) |
— | — | — | (402 | ) | — | (402 | ) | ||||||||||||||||
|
|
|
|
|
|
|
|
|
|
|
|
|
|||||||||||||
| Balance at March 31, 2017 |
13,406,552 | $ | 125,270 | $ | 2,502 | $ | 3,996 | $ | (461 | ) | $ | 131,307 | ||||||||||||
|
|
|
|
|
|
|
|
|
|
|
|
|
|||||||||||||
| Balance at January 1, 2018 |
13,417,899 | $ | 125,430 | $ | 2,941 | $ | 15,036 | $ | (1,223 | ) | $ | 142,184 | ||||||||||||
| Comprehensive income |
||||||||||||||||||||||||
| Net income |
— | — | — | 6,264 | — | 6,264 | ||||||||||||||||||
| Other comprehensive loss, net of tax |
— | — | — | — | (1,025 | ) | (1,025 | ) | ||||||||||||||||
| Share-based compensation expense |
— | — | 182 | — | — | 182 | ||||||||||||||||||
| Stock options exercised |
6,878 | 81 | (51 | ) | — | — | 30 | |||||||||||||||||
| Cash dividends declared on common stock ($0.03 per common share) |
— | — | — | (402 | ) | — | (402 | ) | ||||||||||||||||
|
|
|
|
|
|
|
|
|
|
|
|
|
|||||||||||||
| Balance at March 31, 2018 |
13,424,777 | $ | 125,511 | $ | 3,072 | $ | 20,898 | $ | (2,248 | ) | $ | 147,233 | ||||||||||||
|
|
|
|
|
|
|
|
|
|
|
|
|
|||||||||||||
F-50
Table of Contents
PACIFIC CITY FINANCIAL CORPORATION AND SUBSIDIARY
Consolidated Statements of Cash Flows (Unaudited)
(in thousands)
| Three Months Ended March 31, |
||||||||
| 2018 | 2017 | |||||||
| Cash flows from operating activities |
||||||||
| Net income |
$ | 6,264 | $ | 4,398 | ||||
| Adjustments to reconcile net income to net cash provided by (used in) operating activities: |
||||||||
| Depreciation and amortization of premises and equipment |
291 | 273 | ||||||
| Amortization of net premiums on securities |
206 | 180 | ||||||
| Amortization of servicing assets |
593 | 538 | ||||||
| Provision (reversal) for loan losses |
95 | (198 | ) | |||||
| Deferred tax expense (benefit) |
28 | (331 | ) | |||||
| Stock-based compensation |
182 | 175 | ||||||
| Gain on sale of loans |
(2,116 | ) | (2,344 | ) | ||||
| Net loss (gain) on sale of other real estate owned |
(3 | ) | 1 | |||||
| Loss on sale and disposal of premises and equipment |
4 | — | ||||||
| Originations of loans held-for-sale |
(32,031 | ) | (50,345 | ) | ||||
| Proceeds from sales of and principal collected on loans held-for-sale |
33,795 | 42,682 | ||||||
| Change in accrued interest receivable and other assets |
1,498 | 1,158 | ||||||
| Change in accrued interest payable and other liabilities |
1,287 | 1,040 | ||||||
|
|
|
|
|
|||||
| Net cash provided by (used in) operating activities |
10,093 | (2,773 | ) | |||||
|
|
|
|
|
|||||
| Investing activities: |
||||||||
| Purchase of securities available-for-sale |
(4,084 | ) | (11,097 | ) | ||||
| Proceeds from maturities, calls, and paydowns of securities available-for-sale |
6,204 | 3,551 | ||||||
| Purchase of securities held-to-maturity |
— | (1,983 | ) | |||||
| Proceeds from maturities and paydowns of securities held-to-maturity |
222 | 497 | ||||||
| Proceeds from sale of loans |
1,128 | — | ||||||
| Net change in loans receivable |
(35,392 | ) | (23,579 | ) | ||||
| Proceeds from sale of other real estate owned |
102 | — | ||||||
| Purchases of premises and equipment |
(641 | ) | (80 | ) | ||||
|
|
|
|
|
|||||
| Net cash used in investing activities |
(32,461 | ) | (32,691 | ) | ||||
|
|
|
|
|
|||||
| Financing activities: |
||||||||
| Net increase in deposits |
130,635 | 54,450 | ||||||
| Stock options exercised |
30 | 59 | ||||||
| Cash dividends paid on common stock |
(402 | ) | (402 | ) | ||||
|
|
|
|
|
|||||
| Net cash provided by financing activities |
130,263 | 54,107 | ||||||
|
|
|
|
|
|||||
| Net increase in cash and cash equivalents |
107,895 | 18,643 | ||||||
| Cash and cash equivalents at beginning of year |
73,658 | 69,951 | ||||||
|
|
|
|
|
|||||
| Cash and cash equivalents at end of year |
$ | 181,553 | $ | 88,594 | ||||
|
|
|
|
|
|||||
| Supplemental disclosures of cash flow information: |
||||||||
| Interest paid |
$ | 2,976 | $ | 1,935 | ||||
| Income taxes paid |
4 | 540 | ||||||
| Supplemental disclosures of noncash investment activities: |
||||||||
| Loans transferred to loans held-for-sale |
$ | 1,084 | $ | — | ||||
F-51
Table of Contents
PACIFIC CITY FINANCIAL CORPORATION AND SUBSIDIARY
Notes to Consolidated Financial Statements (Unaudited)
March 31, 2018
Note 1—Basis of Presentation and Significant Accounting Policies
Nature of Operations
Pacific City Financial Corporation (collectively, with its consolidated subsidiary, “the Company,” “we,” “us” or “our”) is a bank holding company whose subsidiary is Pacific City Bank (“the Bank”). The Bank is a single operating segment that operates eleven full-service branches in Los Angeles and Orange counties, California, one full-service branch in each of Fort Lee, New Jersey and Bayside, New York, and ten loan production offices in Irvine and Los Angeles, California; Lynnwood, Washington; Annandale, Virginia; Chicago, Illinois; Atlanta, Georgia; Bellevue, Washington; Aurora, Colorado; Carrollton, Texas; and New York, New York. The Bank offers a broad range of loans, deposits, and other products and services predominantly to small and middle market businesses and individuals.
Basis of Presentation
The accompanying unaudited interim consolidated financial statements have been prepared pursuant to Article 10 of SEC Regulation S-X and other SEC rules and regulations for reporting on Form 10-Q. Accordingly, certain disclosures required by U.S. generally accepted accounting principles (“GAAP”) are not included herein. These interim statements should be read in conjunction with the consolidated financial statements and notes included in the Company’s Annual Report for the year ended December 31, 2017. The December 31, 2017 statement of financial condition presented herein has been derived from the audited financial statements included in the Annual Report for the year ended December 31, 2017, but does not include all of the disclosures required by GAAP for complete financial statements.
In the opinion of management of the Company, the accompanying unaudited interim consolidated financial statements reflect all of the adjustments (consisting of normal recurring adjustments) necessary for a fair presentation of the consolidated financial condition and consolidated results of operations as of the dates and for the periods presented. Certain reclassifications have been made in the prior period financial statements to conform to the current period presentation. The results of operations for the three months ended March 31, 2018 are not necessarily indicative of the results that may be expected for the year ending December 31, 2018.
Principles of Consolidation
The consolidated financial statements include the accounts of the Company as of March 31, 2018 and December 31, 2017 and for the three months ended March 31, 2018 and 2017. Significant intercompany accounts and transactions have been eliminated in consolidation. Unless the context requires otherwise, all references to the Company includes its wholly owned subsidiaries.
Significant Accounting Policies
The Company’s accounting policies are based upon GAAP and conform to predominant practices within the banking industry. The Company has not made any significant changes in its critical accounting policies from those disclosed in its Annual Report for the year ended December 31, 2017. Refer to Adopted Accounting Pronouncements below for discussion of accounting pronouncements adopted during the three months ended March 31, 2018.
F-52
Table of Contents
PACIFIC CITY FINANCIAL CORPORATION AND SUBSIDIARY
Notes to Consolidated Financial Statements (Unaudited)
March 31, 2018
Use of Estimates in the Preparation of Financial Statements
The preparation of the consolidated financial statements in conformity with GAAP requires management to make estimates and assumptions that affect the reported amounts of assets and liabilities, disclosure of contingent assets and liabilities at the date of the consolidated financial statements, and the reported amounts of revenues and expenses during the reporting period. These estimates are subject to change and such change could have a material effect on the consolidated financial statements. Actual results may differ from those estimates.
Adopted Accounting Pronouncements
During the three months ended March 31, 2018, the following accounting pronouncements applicable to the Company were adopted:
In May 2014, the Financial Accounting Standards Board (“FASB”) issued Accounting Standard Update (“ASU”) 2014-09, “Revenue from Contracts with Customers (Topic 606).” This ASU clarifies principles for recognizing revenue from contracts with customers and supersedes current guidelines, Topic 605—“Revenue Recognition,” and most industry specific guidance. The principal of this ASU is that an entity should recognize revenue to depict the transfer of promised goods or services to customers in an amount that reflects the consideration to which the entity expects to be entitled in exchange for those goods or services. To achieve this principle, an entity should apply the following “Five-steps Model” prescribed in Accounting Standard Codification (“ASC”) 606: (i) identify the contract(s) with a customer; (ii) identify the performance obligations in the contract; (iii) determine the transaction price; (iv) allocate the transaction price to the performance obligations in the contract; and (v) recognize revenue when (or as) the entity satisfies a performance obligation. This ASU also specifies the accounting for some costs to obtain or fulfill a contract with a customer. The amended disclosure guidance requires sufficient information to enable users of financial statements to understand the nature, amount, timing, and uncertainty of revenue and cash flows arising from contracts with customers. The Update, as amended by ASU 2015-14, ASU 2016-08, ASU 2016-10, ASU 2016-12, ASU 2016-20, ASU 2017-13, and ASU 2017-14, is effective for interim and annual periods beginning after December 15, 2017, and entities have the option of using either a modified retrospective or full retrospective approach for the adoption.
The Company adopted this guidance on January 1, 2018. The Company’s source of revenue is net interest income and noninterest income. The scope of this ASU explicitly excludes net interest income and other revenues from transactions involving financial instruments, such as loans and securities. The Company identified and reviewed fees and service charges on deposit accounts and income and expense from other real estate owned (“OREO”), which are within the scope of this ASU. Based on this analysis performed, the Company concluded this ASU did not have significant changes to the method in which the Company recognizes these revenue streams. Adoption of this ASU did not have a material impact on the Company’s consolidated financial statements. See note 13 for additional information.
In January 2016, the FASB issued ASU 2016-01, “Financial Instruments-Overall (Subtopic 825-10): Recognition and Measurements of Financial Assets and Financial Liabilities.” The amendments in this ASU require equity investments (except those accounted for under the equity method of accounting, or those that result in consolidation of the investee) to be measured at fair value with changes in fair value recognized in net income; simplifies the impairment assessment of equity investments by requiring a qualitative assessment; eliminates the requirement for public business entities to disclose methods and assumptions for financial instruments measured at amortized cost on the statement of financial condition; requires the exit price notion to be used when measuring the fair value of financial instruments for disclosure purposes; requires an entity to
F-53
Table of Contents
PACIFIC CITY FINANCIAL CORPORATION AND SUBSIDIARY
Notes to Consolidated Financial Statements (Unaudited)
March 31, 2018
present separately in other comprehensive income the portion of the total change in the fair value of a liability; requires separate presentation of financial assets and liabilities by measurement category; and certain other requirements. This ASU became effective for fiscal years beginning after December 15, 2017. The Company adopted this guidance on January 1, 2018 and the adoption of this ASU did not have a material impact on the Company’s consolidated financial statements. See note 2 for additional information.
Recent Accounting Pronouncements Not Yet Adopted
The following are recently issued accounting pronouncements applicable to the Company that have not yet been adopted:
In February 2016, the FASB issued ASU 2016-02, “Leases (Topic 842).” The amendments in this ASU require lessees to recognize lease assets and lease liabilities for both leases classified as operating leases and finance leases, except leases with a term of 12 months or less where lessees is permitted to make an accounting policy election by class of underlying asset not to recognize lease assets and lease liabilities. For leases with a term of greater than 12 months, lessees are required to recognize a liability to make lease payments and a right-of-use assets representing its right to use the underlying asset for the lease term measured at the present value of the lease payments. This ASU is effective for fiscal years beginning after December 15, 2018, including interim periods within those fiscal years for a public business entity and all other entities, the amendments in the update are effective for fiscal years beginning after December 15, 2019, and interim periods within fiscal years beginning after December 15, 2020. At March 31, 2018, the future lease rental payable under non-cancelable operating lease commitments for the Company’s offices and loan production offices were $12.5 million. The Company is in the process of evaluating the impact that adoption of this ASU may have on its consolidated financial statements.
In June 2016, the FASB issued ASU 2016-13, “Financial Instruments-Credit Losses (Topic 326).” The amendments in this ASU require the entities change the impairment model for most financial assets that are measured at amortized cost and certain other instruments from an incurred loss model to an expected loss model. Under this model, entities will estimate credit losses over the entire contractual term of the instrument from the date of initial recognition of that instrument. It includes financial assets such as loan receivables, held-to-maturity debt securities, net investment in leases that are not accounted for at fair value through net income, and certain off-balance sheet credit exposures. This ASU is effective for public business entities that are SEC filers for fiscal years beginning after December 15, 2019, including interim periods within those fiscal years. The Company has formed a committee that is assessing data and system needs in order to evaluate the impact of adopting this ASU. We expect to recognize a one-time cumulative effect adjustment to the allowance for loan losses as of the beginning of the first reporting period in which this ASU is effective. The Company is in the process of evaluating the impact that adoption of this ASU may have on its consolidated financial statements.
In March 2017, the FASB issued ASU 2017-08, “Receivables—Nonrefundable Fees and Other Costs (Subtopic 310-20): Premium Amortization on Purchased Callable Debt Securities.” The amendments in this ASU shorten the amortization period for certain callable debt securities acquired at a premium. Specifically, the amendments require the premium to be amortized to the earliest call date. The amendments do not require an accounting change for securities held at a discount, which continue to be amortized to maturity. Public business entities must prospectively apply the amendments in this ASU to annual periods beginning after December 15, 2018, including interim periods. The Company believes the adoption of this guidance will not have a material impact on its consolidated financial statements.
F-54
Table of Contents
PACIFIC CITY FINANCIAL CORPORATION AND SUBSIDIARY
Notes to Consolidated Financial Statements (Unaudited)
March 31, 2018
Note 2—Fair Value Measurements
ASC 820, Fair Value Measurements and Disclosures, defines fair value, establishes a framework for measuring fair value including a three-level valuation hierarchy, and expands disclosures about fair value measurements. Fair value is the exchange price that would be received for an asset or paid to transfer a liability (i.e.; an exit price) in the principal or most advantageous market for the asset or liability in an orderly transaction between market participants on the measurement date. The three-level fair value hierarchy requires an entity to maximize the use of observable inputs and minimize the use of unobservable inputs when measuring fair value. The three levels of inputs that may be used to measure fair value are defined as follows:
| • | Level 1: Quoted prices (unadjusted) for identical assets or liabilities in active markets that the entity has the ability to access as of the measurement date. |
| • | Level 2: Significant observable inputs other than Level 1 prices such as quoted prices for similar assets or liabilities; quoted prices in markets that are not active; or other inputs that are observable or can be corroborated by observable market data. |
| • | Level 3: Significant unobservable inputs that reflect a reporting entity’s own assumptions about the assumptions that market participants would use in pricing an asset or liability. |
Fair value is measured on a recurring basis for certain assets and liabilities in which fair value is the primary basis of accounting. Additionally, fair value is used on a non-recurring basis to evaluate certain assets or liabilities for impairment or for disclosure purposes. Categorization within the valuation hierarchy is based upon the lowest level of input that is significant to the fair value measurement.
The Company records securities available-for-sale at fair value on a recurring basis. Certain other assets, such as loans held-for-sale, impaired loans, and OREO are recorded at fair value on a non-recurring basis. Non-recurring fair value measurements typically involve assets that are periodically evaluated for impairment and for which any impairment is recorded in the period in which the re-measurement is performed.
The following is a description of valuation methodologies used for assets and liabilities recorded at fair value:
Investment securities: The fair values of securities available-for-sale are determined by obtaining quoted prices on nationally recognized securities exchanges (Level 1) or matrix pricing, which is a mathematical technique used widely in the industry to value debt securities without relying exclusively on quoted prices for specific securities but rather by relying on the securities’ relationship to other benchmark quoted securities (Level 2). Management reviews the valuation techniques and assumptions used by the provider and determines that the provider uses widely accepted valuation techniques based on observable market inputs appropriate for the type of security being measured. Securities held-to-maturity are not measured at fair value on a recurring basis.
Loans held-for-sale: The Company records SBA loans held-for-sale, residential property loans held-for-sale and certain non-residential real estate loans held-of-sale at the lower of cost or fair value, on an aggregate basis. The Company obtains fair values from a third party independent valuation service provider. Loans held-for-sale accounted for at the lower of cost or fair value are considered to be recognized at fair value when they are recorded at below cost, on an aggregate basis, and are classified as Level 2.
Impaired loans: The Company records fair value adjustments on certain loans that reflect (i) partial write-downs, through charge-offs or specific reserve allowances, that are based on the current appraised or
F-55
Table of Contents
PACIFIC CITY FINANCIAL CORPORATION AND SUBSIDIARY
Notes to Consolidated Financial Statements (Unaudited)
March 31, 2018
market-quoted value of the underlying collateral or (ii) the full charge-off of the loan carrying value. In some cases, the properties for which market quotes or appraised values have been obtained are located in areas where comparable sales data is limited, outdated, or unavailable. Fair value estimates for collateral-dependent impaired loans are obtained from real estate brokers or other third-party consultants, and are classified as Level 3.
Other real estate owned: The Company initially records OREO at fair value at the time of foreclosure. Thereafter, OREO is recorded at the lower of cost or fair value based on their subsequent changes in fair value. The fair value of OREO is generally based on recent real estate appraisals adjusted for estimated selling costs. These appraisals may utilize a single valuation approach or a combination of approaches including comparable sales and the income approach. Adjustments are routinely made in the appraisal process by the appraisers to adjust for differences between the comparable sales and income data available. Such adjustments may be significant and result in a Level 3 classification due to the unobservable inputs used for determining fair value. Only OREO with a valuation allowance are considered to be carried at fair value.
Assets and Liabilities Measured at Fair Value on a Recurring Basis
The following table presents the Company’s financial assets and liabilities measured at fair value on a recurring basis as of dates indicated:
| Fair Value Measurement Level | ||||||||||||||||
| ($ in thousands) |
Quoted Prices in Active Markets for Identical Assets (Level 1) |
Significant Other Observable Inputs (Level 2) |
Significant Unobservable Inputs (Level 3) |
Total | ||||||||||||
| March 31, 2018 |
||||||||||||||||
| Securities available-for-sale |
||||||||||||||||
| U.S. government and agency securities |
$ | — | $ | 23,701 | $ | — | $ | 23,701 | ||||||||
| Municipal bonds |
— | 1,306 | — | 1,306 | ||||||||||||
| Mortgage-backed securities |
— | 50,558 | — | 50,558 | ||||||||||||
| Collateralized mortgage obligations |
— | 50,375 | — | 50,375 | ||||||||||||
|
|
|
|
|
|
|
|
|
|||||||||
| Total securities available-for-sale |
— | 125,940 | — | 125,940 | ||||||||||||
|
|
|
|
|
|
|
|
|
|||||||||
| Total assets measured at fair value on a recurring basis |
$ | — | $ | 125,940 | $ | — | $ | 125,940 | ||||||||
|
|
|
|
|
|
|
|
|
|||||||||
| Total liabilities measured at fair value on a recurring basis |
$ | — | $ | — | $ | — | $ | — | ||||||||
|
|
|
|
|
|
|
|
|
|||||||||
| December 31, 2017 |
||||||||||||||||
| Securities available-for-sale |
||||||||||||||||
| U.S. government and agency securities |
$ | — | $ | 24,925 | $ | — | $ | 24,925 | ||||||||
| Municipal bonds |
— | 2,375 | — | 2,375 | ||||||||||||
| Mortgage-backed securities |
— | 51,904 | — | 51,904 | ||||||||||||
| Collateralized mortgage obligations |
— | 50,485 | — | 50,485 | ||||||||||||
|
|
|
|
|
|
|
|
|
|||||||||
| Total securities available-for-sale |
— | 129,689 | — | 129,689 | ||||||||||||
|
|
|
|
|
|
|
|
|
|||||||||
| Total assets measured at fair value on a recurring basis |
$ | — | $ | 129,689 | $ | — | $ | 129,689 | ||||||||
|
|
|
|
|
|
|
|
|
|||||||||
| Total liabilities measured at fair value on a recurring basis |
$ | — | $ | — | $ | — | $ | — | ||||||||
|
|
|
|
|
|
|
|
|
|||||||||
F-56
Table of Contents
PACIFIC CITY FINANCIAL CORPORATION AND SUBSIDIARY
Notes to Consolidated Financial Statements (Unaudited)
March 31, 2018
Assets and Liabilities Measured at Fair Value on a Non-Recurring Basis
The following table presents the Company’s financial assets and liabilities measured at fair value on a non-recurring basis as of dates indicated:
| Fair Value Measurement Level | ||||||||||||||||
| ($ in thousands) |
Quoted Prices in Active Markets for Identical Assets (Level 1) |
Significant Other Observable Inputs (Level 2) |
Significant Unobservable Inputs (Level 3) |
Total | ||||||||||||
| March 31, 2018 |
||||||||||||||||
| Impaired loans: |
||||||||||||||||
| SBA property |
$ | — | $ | — | $ | 365 | $ | 365 | ||||||||
|
|
|
|
|
|
|
|
|
|||||||||
| Total impaired loans |
— | — | 365 | 365 | ||||||||||||
|
|
|
|
|
|
|
|
|
|||||||||
| Total assets measured at fair value on a non-recurring basis |
$ | — | $ | — | $ | 365 | $ | 365 | ||||||||
|
|
|
|
|
|
|
|
|
|||||||||
| Total liabilities measured at fair value on a non-recurring basis |
$ | — | $ | — | $ | — | $ | — | ||||||||
|
|
|
|
|
|
|
|
|
|||||||||
| December 31, 2017 |
||||||||||||||||
| Total assets measured at fair value on a non-recurring basis |
$ | — | $ | — | $ | — | $ | — | ||||||||
|
|
|
|
|
|
|
|
|
|||||||||
| Total liabilities measured at fair value on a non-recurring basis |
$ | — | $ | — | $ | — | $ | — | ||||||||
|
|
|
|
|
|
|
|
|
|||||||||
For assets measured at fair value, the following table presents the total net losses, which include charge-offs, recoveries, specific reserves, gain on sale of OREO, and OREO valuation write-downs recorded during the three months ended March 31, 2018 and 2017:
| Three Months Ended March 31, |
||||||||
| ($ in thousands) |
2018 | 2017 | ||||||
| Collateral-dependent impaired loans: |
||||||||
| SBA property |
$ | (126 | ) | $ | — | |||
| Other real estate owned |
3 | (1 | ) | |||||
|
|
|
|
|
|||||
| Total net losses recognized |
$ | (123 | ) | $ | (1 | ) | ||
|
|
|
|
|
|||||
Fair Value of Financial Instruments
The fair value of a financial instrument is the amount at which the asset or obligation could be exchanged in a current transaction between willing parties, other than in a forced or liquidation sale. Fair value estimates are made at a specific point in time based on relevant market information and information about the financial instrument. These estimates do not reflect any premium or discount that could result from offering for sale at one time the entire holdings of a particular financial instrument. Because no market value exists for a significant portion of the financial instruments, fair value estimates are based on judgments regarding future expected loss experience, current economic conditions, risk characteristics of various financial instruments, and other factors.
F-57
Table of Contents
PACIFIC CITY FINANCIAL CORPORATION AND SUBSIDIARY
Notes to Consolidated Financial Statements (Unaudited)
March 31, 2018
These estimates are subjective in nature, involve uncertainties and matters of judgment and, therefore, cannot be determined with precision. Changes in assumptions could significantly affect the estimates.
Fair value estimates are based on financial instruments both on and off the consolidated balance sheet without attempting to estimate the value of anticipated future business and the value of assets and liabilities that are not considered financial instruments. Additionally, tax consequences related to the realization of the unrealized gains and losses can have a potential effect on fair value estimates and have not been considered in many of the estimates. The following methods and assumptions were used to estimate the fair value of significant financial instruments.
Financial assets: The carrying amounts of interest-bearing deposits with other financial institutions and accrued interest receivable are considered to approximate fair value. The fair values of investment securities are generally based on matrix pricing (Level 2). The fair value of loans is estimated based on a discounted cash flow approach under an exit price notion. The fair value reflects the estimated yield that would be negotiated with a willing market participant. Because sale transactions of such loans are not readily observable, as many of the loans have unique risk characteristics, the valuation is based on significant unobservable inputs (Level 3). It is not practical to determine the fair value of Federal Home Loan Bank (“FHLB”) and other restricted stock due to restrictions placed on its transferability.
Financial liabilities: The carrying amounts of accrued interest payable are considered to approximate fair value. The fair value of deposits is estimated based on discounted cash flows. The discount rate is derived from the interest rates currently being offered for similar remaining maturities. Non-maturity deposits are estimated based on their historical decaying experiences (Level 3). The fair value of borrowings from FHLB is estimated based on discounted cash flows. The discount rate is derived from the current market rates for borrowings with similar remaining maturities (Level 2).
Off-balance-sheet financial instruments: The fair value of commitments to extend credit and standby letters of credit is estimated using the fees currently charged to enter into similar agreements. The fair value of these financial instruments is not material and is excluded from the table below.
F-58
Table of Contents
PACIFIC CITY FINANCIAL CORPORATION AND SUBSIDIARY
Notes to Consolidated Financial Statements (Unaudited)
March 31, 2018
The following table presents the carrying value and estimated fair values of financial assets and liabilities as of the dates indicated:
| Carrying Value |
Fair Value |
Fair Value Measurements Using | ||||||||||||||||||
| ($ in thousands) |
Level 1 | Level 2 | Level 3 | |||||||||||||||||
| March 31, 2018 |
||||||||||||||||||||
| Financial assets: |
||||||||||||||||||||
| Interest-bearing deposits in other financial institutions |
$ | 164,788 | $ | 164,788 | $ | 164,788 | $ | — | $ | — | ||||||||||
| Securities available-for-sale |
125,940 | 125,940 | — | 125,940 | — | |||||||||||||||
| Securities held-to-maturity |
20,826 | 20,252 | — | 20,252 | — | |||||||||||||||
| Loans held-for-sale |
6,182 | 6,392 | — | 6,392 | — | |||||||||||||||
| Loans receivable, net |
1,210,901 | 1,222,243 | — | — | 1,222,243 | |||||||||||||||
| Federal Home Loan Bank and other restricted stock |
6,589 | N/A | N/A | N/A | N/A | |||||||||||||||
| Accrued interest receivable |
4,303 | 4,303 | 24 | 457 | 3,822 | |||||||||||||||
| Financial liabilities: |
||||||||||||||||||||
| Deposits |
1,381,925 | 1,365,681 | — | — | 1,365,681 | |||||||||||||||
| Borrowings from Federal Home Loan Bank |
40,000 | 39,451 | — | 39,451 | — | |||||||||||||||
| Accrued interest payable |
2,609 | 2,609 | — | 60 | 2,549 | |||||||||||||||
| December 31, 2017 |
||||||||||||||||||||
| Financial assets: |
||||||||||||||||||||
| Interest-bearing deposits in other financial institutions |
$ | 56,996 | $ | 56,996 | $ | 56,996 | $ | — | $ | — | ||||||||||
| Securities available-for-sale |
129,689 | 129,689 | — | 129,689 | — | |||||||||||||||
| Securities held-to-maturity |
21,070 | 20,997 | — | 20,997 | — | |||||||||||||||
| Loans held-for-sale |
5,297 | 5,813 | — | 5,813 | — | |||||||||||||||
| Loans receivable, net |
1,177,775 | 1,177,539 | — | — | 1,177,539 | |||||||||||||||
| Federal Home Loan Bank and other restricted stock |
6,589 | N/A | N/A | N/A | N/A | |||||||||||||||
| Accrued interest receivable |
4,251 | 4,251 | 25 | 533 | 3,693 | |||||||||||||||
| Financial liabilities: |
||||||||||||||||||||
| Deposits |
1,251,290 | 1,250,259 | — | — | 1,250,259 | |||||||||||||||
| Borrowings from Federal Home Loan Bank |
40,000 | 39,778 | — | 39,778 | — | |||||||||||||||
| Accrued interest payable |
2,251 | 2,251 | — | 60 | 2,191 | |||||||||||||||
F-59
Table of Contents
PACIFIC CITY FINANCIAL CORPORATION AND SUBSIDIARY
Notes to Consolidated Financial Statements (Unaudited)
March 31, 2018
Note 3—Investment Securities
Debt and equity securities have been classified as available-for-sale or held-to-maturity in the consolidated balance sheets according to management’s intent. The following table presents the amortized cost and fair value of the investment securities as of the dates indicated:
| ($ in thousands) |
Amortized Cost |
Gross Unrealized Gains |
Gross Unrealized Losses |
Fair Value |
||||||||||||
| March 31, 2018 |
||||||||||||||||
| Securities available-for-sale: |
||||||||||||||||
| U.S. government and agency securities |
$ | 24,200 | $ | — | $ | (499 | ) | $ | 23,701 | |||||||
| Municipal bonds |
1,306 | 1 | (1 | ) | 1,306 | |||||||||||
| Mortgage-backed securities |
51,936 | 4 | (1,382 | ) | 50,558 | |||||||||||
| Collateralized mortgage obligations |
51,885 | 6 | (1,516 | ) | 50,375 | |||||||||||
|
|
|
|
|
|
|
|
|
|||||||||
| Total securities available-for-sale |
$ | 129,327 | $ | 11 | $ | (3,398 | ) | $ | 125,940 | |||||||
|
|
|
|
|
|
|
|
|
|||||||||
| Securities held-to-maturity: |
||||||||||||||||
| Municipal bonds |
$ | 5,254 | $ | 46 | $ | (27 | ) | $ | 5,273 | |||||||
| Mortgage-backed securities |
15,572 | — | (593 | ) | 14,979 | |||||||||||
|
|
|
|
|
|
|
|
|
|||||||||
| Total securities held-to-maturity |
$ | 20,826 | $ | 46 | $ | (620 | ) | $ | 20,252 | |||||||
|
|
|
|
|
|
|
|
|
|||||||||
| December 31, 2017 |
||||||||||||||||
| Securities available-for-sale: |
||||||||||||||||
| U.S. government and agency securities |
$ | 25,231 | $ | 17 | $ | (323 | ) | $ | 24,925 | |||||||
| Municipal bonds |
2,376 | 1 | (2 | ) | 2,375 | |||||||||||
| Mortgage-backed securities |
52,565 | 8 | (669 | ) | 51,904 | |||||||||||
| Collateralized mortgage obligations |
51,459 | 34 | (1,008 | ) | 50,485 | |||||||||||
|
|
|
|
|
|
|
|
|
|||||||||
| Total securities available-for-sale |
$ | 131,631 | $ | 60 | $ | (2,002 | ) | $ | 129,689 | |||||||
|
|
|
|
|
|
|
|
|
|||||||||
| Securities held-to-maturity: |
||||||||||||||||
| Municipal bonds |
$ | 5,263 | $ | 181 | $ | (5 | ) | $ | 5,439 | |||||||
| Mortgage-backed securities |
15,807 | 8 | (257 | ) | 15,558 | |||||||||||
|
|
|
|
|
|
|
|
|
|||||||||
| Total securities held-to-maturity |
$ | 21,070 | $ | 189 | $ | (262 | ) | $ | 20,997 | |||||||
|
|
|
|
|
|
|
|
|
|||||||||
As of March 31, 2018 and December 31, 2017, pledged securities were $112.4 million and $109.9 million, respectively. These securities were pledged to the State Deposit from the California State Treasurer.
F-60
Table of Contents
PACIFIC CITY FINANCIAL CORPORATION AND SUBSIDIARY
Notes to Consolidated Financial Statements (Unaudited)
March 31, 2018
The following table presents the amortized cost and fair value of the investment securities by contractual maturity as of March 31, 2018. Expected maturities may differ from contractual maturities, if borrowers have the right to call or prepay obligations with or without call or prepayment penalties. Securities not due at a single maturity date are shown separately.
| Securities Available-for-Sale |
Securities Held-to-Maturity |
|||||||||||||||
| ($ in thousands) |
Amortized Cost |
Fair Value |
Amortized Cost |
Fair Value |
||||||||||||
| Within one year |
$ | 507 | $ | 506 | $ | 127 | $ | 127 | ||||||||
| One to five years |
— | — | 586 | 580 | ||||||||||||
| Five to ten years |
2,312 | 2,286 | 1,944 | 1,934 | ||||||||||||
| Greater than ten years |
22,687 | 22,215 | 2,597 | 2,632 | ||||||||||||
| Mortgage-backed securities and collateralized mortgage obligations |
103,821 | 100,933 | 15,572 | 14,979 | ||||||||||||
|
|
|
|
|
|
|
|
|
|||||||||
| Total |
$ | 129,327 | $ | 125,940 | $ | 20,826 | $ | 20,252 | ||||||||
|
|
|
|
|
|
|
|
|
|||||||||
The following table presents proceeds from sales and calls of securities available-for-sale and the associated gross gains and losses realized through earnings upon the sales and calls of securities available-for-sale for the periods indicated:
| Three Months Ended March 31, |
||||||||
| ($ in thousands) |
2018 | 2017 | ||||||
| Gross realized gains on sales and calls of securities available-for-sale |
$ | — | $ | — | ||||
| Gross realized losses on sales and calls of securities available-for-sale |
— | — | ||||||
|
|
|
|
|
|||||
| Net realized gains on sales and calls of securities available-for-sale |
$ | — | $ | — | ||||
|
|
|
|
|
|||||
| Proceeds from sales and calls of securities available-for-sale |
$ | 1,060 | $ | — | ||||
| Tax expense on sales and calls of securities available-for-sale |
$ | — | $ | — | ||||
F-61
Table of Contents
PACIFIC CITY FINANCIAL CORPORATION AND SUBSIDIARY
Notes to Consolidated Financial Statements (Unaudited)
March 31, 2018
The following table summarizes the investment securities with unrealized losses by security type and length of time in a continuous unrealized loss position as of the dates indicated:
| Length of Time that individual securities have been in a continuous unrealized loss position | ||||||||||||||||||||||||||||||||||||
| Less Than 12 Months | 12 Months or Longer | Total | ||||||||||||||||||||||||||||||||||
| ($ in thousands, except number |
Fair Value |
Gross Unrealized Losses |
Number of Securities |
Fair Value |
Gross Unrealized Losses |
Number of Securities |
Fair Value |
Gross Unrealized Losses |
Number of Securities |
|||||||||||||||||||||||||||
| March 31, 2018 |
||||||||||||||||||||||||||||||||||||
| Securities available-for-sale: |
||||||||||||||||||||||||||||||||||||
| U.S. government and agency securities |
$ | 15,142 | $ | (204 | ) | 12 | $ | 8,559 | $ | (295 | ) | 7 | $ | 23,701 | $ | (499 | ) | 19 | ||||||||||||||||||
| Municipal bonds |
1,107 | (1 | ) | 2 | — | — | — | 1,107 | (1 | ) | 2 | |||||||||||||||||||||||||
| Mortgage-backed securities |
32,529 | (793 | ) | 30 | 17,458 | (589 | ) | 21 | 49,987 | (1,382 | ) | 51 | ||||||||||||||||||||||||
| Collateralized mortgage obligations |
28,336 | (762 | ) | 18 | 15,346 | (754 | ) | 19 | 43,682 | (1,516 | ) | 37 | ||||||||||||||||||||||||
|
|
|
|
|
|
|
|
|
|
|
|
|
|
|
|
|
|
|
|||||||||||||||||||
| Total securities available-for-sale |
$ | 77,114 | $ | (1,760 | ) | 62 | $ | 41,363 | $ | (1,638 | ) | 47 | $ | 118,477 | $ | (3,398 | ) | 109 | ||||||||||||||||||
|
|
|
|
|
|
|
|
|
|
|
|
|
|
|
|
|
|
|
|||||||||||||||||||
| Securities held-to-maturity: |
||||||||||||||||||||||||||||||||||||
| Municipal bonds |
$ | 2,477 | $ | (27 | ) | 10 | $ | — | $ | — | — | $ | 2,477 | $ | (27 | ) | 10 | |||||||||||||||||||
| Mortgage-backed securities |
9,454 | (302 | ) | 8 | 5,525 | (291 | ) | 7 | 14,979 | (593 | ) | 15 | ||||||||||||||||||||||||
|
|
|
|
|
|
|
|
|
|
|
|
|
|
|
|
|
|
|
|||||||||||||||||||
| Total securities held-to-maturity |
$ | 11,931 | $ | (329 | ) | 18 | $ | 5,525 | $ | (291 | ) | 7 | $ | 17,456 | $ | (620 | ) | 25 | ||||||||||||||||||
|
|
|
|
|
|
|
|
|
|
|
|
|
|
|
|
|
|
|
|||||||||||||||||||
| December 31, 2017 |
||||||||||||||||||||||||||||||||||||
| Securities available-for-sale: |
||||||||||||||||||||||||||||||||||||
| U.S. government and agency securities |
$ | 11,736 | $ | (103 | ) | 9 | $ | 8,798 | $ | (220 | ) | 7 | $ | 20,534 | $ | (323 | ) | 16 | ||||||||||||||||||
| Municipal bonds |
1,115 | (2 | ) | 2 | — | — | — | 1,115 | (2 | ) | 2 | |||||||||||||||||||||||||
| Mortgage-backed securities |
31,876 | (352 | ) | 29 | 18,762 | (317 | ) | 21 | 50,638 | (669 | ) | 50 | ||||||||||||||||||||||||
| Collateralized mortgage obligations |
31,191 | (454 | ) | 19 | 16,284 | (554 | ) | 19 | 47,475 | (1,008 | ) | 38 | ||||||||||||||||||||||||
|
|
|
|
|
|
|
|
|
|
|
|
|
|
|
|
|
|
|
|||||||||||||||||||
| Total securities available-for-sale |
$ | 75,918 | $ | (911 | ) | 59 | $ | 43,844 | $ | (1,091 | ) | 47 | $ | 119,762 | $ | (2,002 | ) | 106 | ||||||||||||||||||
|
|
|
|
|
|
|
|
|
|
|
|
|
|
|
|
|
|
|
|||||||||||||||||||
| Securities held-to-maturity |
||||||||||||||||||||||||||||||||||||
| Municipal bonds |
$ | 1,183 | $ | (5 | ) | 5 | $ | — | $ | — | — | $ | 1,183 | $ | (5 | ) | 5 | |||||||||||||||||||
| Mortgage-backed securities |
7,997 | (93 | ) | 6 | 5,739 | (164 | ) | 7 | 13,736 | (257 | ) | 13 | ||||||||||||||||||||||||
|
|
|
|
|
|
|
|
|
|
|
|
|
|
|
|
|
|
|
|||||||||||||||||||
| Total securities held-to-maturity |
$ | 9,180 | $ | (98 | ) | 11 | $ | 5,739 | $ | (164 | ) | 7 | $ | 14,919 | $ | (262 | ) | 18 | ||||||||||||||||||
|
|
|
|
|
|
|
|
|
|
|
|
|
|
|
|
|
|
|
|||||||||||||||||||
In accordance with FASB ASC 320, Investments—Debt and Equity Securities, the Company performs an other-than-temporary impairment (“OTTI”) assessment periodically. OTTI is recognized when fair value is below the amortized cost where: (i) an entity has the intent to sell the security; (ii) it is more likely than not that an entity will be required to sell the security before recovery of its amortized cost basis; or (iii) an entity does not expect to recover the entire amortized cost basis of the security.
F-62
Table of Contents
PACIFIC CITY FINANCIAL CORPORATION AND SUBSIDIARY
Notes to Consolidated Financial Statements (Unaudited)
March 31, 2018
All individual securities in a continuous unrealized loss position for 12 months or more as of March 31, 2018 and December 31, 2017 had an investment grade rating upon purchase. The issuers of these securities have not established any cause for default on these securities and various rating agencies have reaffirmed their long-term investment grade status as of March 31, 2018 and December 31, 2017. These securities have fluctuated in value since their purchase dates as market interest rates fluctuated. The Company does not intend to sell these securities and it is more likely than not that the Company will not be required to sell before the recovery of its amortized cost basis. In addition, the unrealized losses on municipal bonds are not considered other-than-temporary impaired, as the bonds are rated investment grade and there are no credit quality concerns with the issuers. Interest payments have been made as scheduled, and management believes this will continue in the future until the bonds get paid in full. The Company determined that the investment securities with unrealized losses for twelve months or more are not other-than-temporary impaired, and, therefore, no impairment was recognized during the three months ended March 31, 2018 and 2017.
Note 4—Loans and Allowance for Loan Losses
Loans Receivable
The following table presents the composition of the Company’s loans receivable as of the dates indicated:
| ($ in thousands) |
March 31, 2018 |
December 31, 2017 |
||||||
| Real estate loans: |
||||||||
| Commercial property |
$ | 675,729 | $ | 662,840 | ||||
| Residential property |
184,752 | 168,898 | ||||||
| SBA property |
134,240 | 130,438 | ||||||
| Construction |
26,089 | 23,215 | ||||||
|
|
|
|
|
|||||
| Total real estate loans |
1,020,810 | 985,391 | ||||||
| Commercial and industrial loans: |
||||||||
| Commercial term |
79,763 | 77,438 | ||||||
| Commercial lines of credit |
58,195 | 60,850 | ||||||
| SBA commercial term |
29,337 | 30,199 | ||||||
| International loans |
2,115 | 1,920 | ||||||
|
|
|
|
|
|||||
| Total commercial and industrial loans |
169,410 | 170,407 | ||||||
| Consumer loans |
32,704 | 33,870 | ||||||
|
|
|
|
|
|||||
| Gross loans |
1,222,924 | 1,189,668 | ||||||
| Deferred loan costs (fees) |
348 | 331 | ||||||
| Allowance for loan losses |
(12,371 | ) | (12,224 | ) | ||||
|
|
|
|
|
|||||
| Loans receivable, net of allowance for loan losses |
$ | 1,210,901 | $ | 1,177,775 | ||||
|
|
|
|
|
|||||
In the ordinary course of business, the Company may grant loans to certain officers and directors, and the companies which they are associated. As of March 31, 2018 and December 31, 2017, the Company had no such loans outstanding.
F-63
Table of Contents
PACIFIC CITY FINANCIAL CORPORATION AND SUBSIDIARY
Notes to Consolidated Financial Statements (Unaudited)
March 31, 2018
Allowance for Loan Losses
The following table presents the activities in allowance for loan losses based on the evaluation methodology by portfolio segment, which is consistent with the Company’s methodology for determining allowance for loan losses, for the three months ended March 31, 2018 and 2017.
| ($ in thousands) |
Real Estate |
Commercial and Industrial |
Consumer | Total | ||||||||||||
| For the Three Months Ended March 31, 2018 |
||||||||||||||||
| Allowance for loan losses: |
||||||||||||||||
| Balance at January 1, 2018 |
$ | 8,507 | $ | 3,548 | $ | 169 | $ | 12,224 | ||||||||
| Charge-offs |
(125 | ) | — | (14 | ) | (139 | ) | |||||||||
| Recoveries on loans previously charged off |
2 | 180 | 9 | 191 | ||||||||||||
| Provision (reversal) for loan losses |
692 | (628 | ) | 31 | 95 | |||||||||||
|
|
|
|
|
|
|
|
|
|||||||||
| Balance at March 31, 2018 |
$ | 9,076 | $ | 3,100 | $ | 195 | $ | 12,371 | ||||||||
|
|
|
|
|
|
|
|
|
|||||||||
| For the Three Months Ended March 31, 2017 |
||||||||||||||||
| Allowance for loan losses: |
||||||||||||||||
| Balance at January 1, 2017 |
$ | 7,497 | $ | 3,657 | $ | 166 | $ | 11,320 | ||||||||
| Charge-offs |
— | (6 | ) | (12 | ) | (18 | ) | |||||||||
| Recoveries on loans previously charged off |
1 | 195 | 15 | 211 | ||||||||||||
| Provision (reversal) for loan losses |
239 | (436 | ) | (1 | ) | (198 | ) | |||||||||
|
|
|
|
|
|
|
|
|
|||||||||
| Balance at March 31, 2017 |
$ | 7,737 | $ | 3,410 | $ | 168 | $ | 11,315 | ||||||||
|
|
|
|
|
|
|
|
|
|||||||||
F-64
Table of Contents
PACIFIC CITY FINANCIAL CORPORATION AND SUBSIDIARY
Notes to Consolidated Financial Statements (Unaudited)
March 31, 2018
The following tables present the information on allowance for loan losses and recorded investments by portfolio segment and impairment methodology as of March 31, 2018 and December 31, 2017:
| ($ in thousands) |
Real Estate | Commercial and Industrial |
Consumer | Total | ||||||||||||
| March 31, 2018 |
||||||||||||||||
| Allowance for loan losses: |
||||||||||||||||
| Individually evaluated for impairment |
$ | 1 | $ | 171 | $ | — | $ | 172 | ||||||||
| Collectively evaluated for impairment |
9,075 | 2,929 | 195 | 12,199 | ||||||||||||
|
|
|
|
|
|
|
|
|
|||||||||
| Total |
$ | 9,076 | $ | 3,100 | $ | 195 | $ | 12,371 | ||||||||
|
|
|
|
|
|
|
|
|
|||||||||
| Loans receivable: |
||||||||||||||||
| Individually evaluated for impairment |
$ | 2,392 | $ | 759 | $ | — | $ | 3,151 | ||||||||
| Collectively evaluated for impairment |
1,018,418 | 168,651 | 32,704 | 1,219,773 | ||||||||||||
|
|
|
|
|
|
|
|
|
|||||||||
| Total |
$ | 1,020,810 | $ | 169,410 | $ | 32,704 | $ | 1,222,924 | ||||||||
|
|
|
|
|
|
|
|
|
|||||||||
| December 31, 2017 |
||||||||||||||||
| Allowance for loan losses: |
||||||||||||||||
| Individually evaluated for impairment |
$ | — | $ | 208 | $ | — | $ | 208 | ||||||||
| Collectively evaluated for impairment |
8,507 | 3,340 | 169 | 12,016 | ||||||||||||
|
|
|
|
|
|
|
|
|
|||||||||
| Total |
$ | 8,507 | $ | 3,548 | $ | 169 | $ | 12,224 | ||||||||
|
|
|
|
|
|
|
|
|
|||||||||
| Loans receivable: |
||||||||||||||||
| Individually evaluated for impairment |
$ | 3,191 | $ | 610 | $ | — | $ | 3,801 | ||||||||
| Collectively evaluated for impairment |
982,200 | 169,797 | 33,870 | 1,185,867 | ||||||||||||
|
|
|
|
|
|
|
|
|
|||||||||
| Total |
$ | 985,391 | $ | 170,407 | $ | 33,870 | $ | 1,189,668 | ||||||||
|
|
|
|
|
|
|
|
|
|||||||||
Credit Quality Indicators
The Company classifies loans into risk categories based on relevant information about the ability of borrowers to service their debt, such as current financial information, historical payment experience, collateral adequacy, credit documentation, and current economic trends, among other factors. The Company analyzes loans individually by classifying the loans in regards to credit risk. This analysis typically includes larger, non-homogeneous loans, such as commercial property and commercial and industrial loans, and is performed on an ongoing basis as new information is obtained. The Company uses the following definitions for risk ratings:
Pass—Loans classified as pass include larger non-homogeneous loans not meeting the risk ratings defined below and smaller, homogeneous loans not assessed on an individual basis.
Special Mention—Loans classified as special mention have a potential weakness that deserves management’s close attention. If left uncorrected, these potential weaknesses may result in the deterioration of repayment prospects for the loan or of the institution’s credit position at some future date.
Substandard—Loans classified as substandard are inadequately protected by the current net worth and paying capacity of the obligor or of the collateral pledged, if any. Loans classified as substandard have a well-defined weakness or weaknesses that jeopardize the liquidation of the debt. They are characterized by the distinct possibility that the institution will sustain some loss if the deficiencies are not corrected.
F-65
Table of Contents
PACIFIC CITY FINANCIAL CORPORATION AND SUBSIDIARY
Notes to Consolidated Financial Statements (Unaudited)
March 31, 2018
Doubtful—Loans classified as doubtful have all the weaknesses inherent in those classified as substandard, with the added characteristic that the weaknesses make collection or repayment in full, on the basis of currently existing facts, conditions, and values, highly questionable and improbable.
The following table presents the risk categories for loans by portfolio segment as of dates indicated:
| ($ in thousands) |
Pass | Special Mention |
Substandard | Doubtful | Total | |||||||||||||||
| March 31, 2018 |
||||||||||||||||||||
| Real estate loans: |
||||||||||||||||||||
| Commercial property |
$ | 670,441 | $ | 4,787 | $ | 501 | $ | — | $ | 675,729 | ||||||||||
| Residential property |
184,022 | — | 730 | — | 184,752 | |||||||||||||||
| SBA property |
129,062 | 2,812 | 2,366 | — | 134,240 | |||||||||||||||
| Construction |
26,089 | — | — | — | 26,089 | |||||||||||||||
| Commercial and industrial loans: |
||||||||||||||||||||
| Commercial term |
79,625 | — | 138 | — | 79,763 | |||||||||||||||
| Commercial lines of credit |
58,195 | — | — | — | 58,195 | |||||||||||||||
| SBA commercial term |
28,707 | 1 | 629 | — | 29,337 | |||||||||||||||
| International loans |
2,115 | — | — | — | 2,115 | |||||||||||||||
| Consumer loans |
32,688 | — | 16 | — | 32,704 | |||||||||||||||
|
|
|
|
|
|
|
|
|
|
|
|||||||||||
| Total |
$ | 1,210,944 | $ | 7,600 | $ | 4,380 | $ | — | $ | 1,222,924 | ||||||||||
|
|
|
|
|
|
|
|
|
|
|
|||||||||||
| December 31, 2017 |
||||||||||||||||||||
| Real estate loans: |
||||||||||||||||||||
| Commercial property |
$ | 657,511 | $ | 4,819 | $ | 510 | $ | — | $ | 662,840 | ||||||||||
| Residential property |
168,168 | — | 730 | — | 168,898 | |||||||||||||||
| SBA property |
124,837 | 2,435 | 3,166 | — | 130,438 | |||||||||||||||
| Construction |
23,215 | — | — | — | 23,215 | |||||||||||||||
| Commercial and industrial loans: |
||||||||||||||||||||
| Commercial term |
77,261 | — | 177 | — | 77,438 | |||||||||||||||
| Commercial lines of credit |
60,840 | — | 10 | — | 60,850 | |||||||||||||||
| SBA commercial term |
29,831 | 4 | 364 | — | 30,199 | |||||||||||||||
| International loans |
1,920 | — | — | — | 1,920 | |||||||||||||||
| Consumer loans |
33,845 | — | 25 | — | 33,870 | |||||||||||||||
|
|
|
|
|
|
|
|
|
|
|
|||||||||||
| Total |
$ | 1,177,428 | $ | 7,258 | $ | 4,982 | $ | — | $ | 1,189,668 | ||||||||||
|
|
|
|
|
|
|
|
|
|
|
|||||||||||
F-66
Table of Contents
PACIFIC CITY FINANCIAL CORPORATION AND SUBSIDIARY
Notes to Consolidated Financial Statements (Unaudited)
March 31, 2018
Past Due and Nonaccrual Loans
The following table presents the aging of past due accruing loans and nonaccrual loans by portfolio segment as of dates indicated:
| Accruing | ||||||||||||||||||||
| ($ in thousands) |
30 to 59 Days Past Due |
60 to 89 Days Past Due |
90 or More Days Past Due |
Nonaccrual | Total Past Due and Nonaccrual |
|||||||||||||||
| March 31, 2018 |
||||||||||||||||||||
| Real estate loans: |
||||||||||||||||||||
| Commercial property |
$ | — | $ | — | $ | — | $ | 311 | $ | 311 | ||||||||||
| Residential property |
96 | — | — | 730 | 826 | |||||||||||||||
| SBA property |
197 | — | — | 1,022 | 1,219 | |||||||||||||||
| Commercial and industrial loans: |
||||||||||||||||||||
| Commercial term |
81 | — | — | — | 81 | |||||||||||||||
| SBA commercial term |
319 | — | — | 318 | 637 | |||||||||||||||
| Consumer loans |
171 | 128 | — | 16 | 315 | |||||||||||||||
|
|
|
|
|
|
|
|
|
|
|
|||||||||||
| Total |
$ | 864 | $ | 128 | $ | — | $ | 2,397 | $ | 3,389 | ||||||||||
|
|
|
|
|
|
|
|
|
|
|
|||||||||||
| December 31, 2017 |
||||||||||||||||||||
| Real estate loans: |
||||||||||||||||||||
| Commercial property |
$ | — | $ | — | $ | — | $ | 318 | $ | 318 | ||||||||||
| Residential property |
949 | 96 | — | 730 | 1,775 | |||||||||||||||
| SBA property |
— | — | — | 1,810 | 1,810 | |||||||||||||||
| Commercial and industrial loans: |
||||||||||||||||||||
| Commercial term |
— | — | — | 4 | 4 | |||||||||||||||
| Commercial lines of credit |
— | — | — | 10 | 10 | |||||||||||||||
| SBA commercial term |
2 | — | — | 338 | 340 | |||||||||||||||
| Consumer loans |
262 | 32 | — | 24 | 318 | |||||||||||||||
|
|
|
|
|
|
|
|
|
|
|
|||||||||||
| Total |
$ | 1,213 | $ | 128 | $ | — | $ | 3,234 | $ | 4,575 | ||||||||||
|
|
|
|
|
|
|
|
|
|
|
|||||||||||
Nonaccrual loans included loans guaranteed by the U.S. government agency of none and $831 thousand, respectively, at March 31, 2018 and December 31, 2017.
Impaired Loans
Loans are considered impaired in the following cases: (i) the loan is on nonaccrual, (ii) when principal or interest payments on the loan have been contractually past due for 90 days or more, unless the loan is both well-collateralized and in the process of collection, (iii) the loan is classified as a troubled debt restructuring (“TDR”) where terms not typically granted by the Company were offered to the borrower, (iv) when current information or events make it unlikely to collect the loan balance in full according to the contractual terms of the loan agreement, (v) there is a deterioration in the borrower’s financial condition that raises uncertainty as to timely collection of either principal or interest, or (vi) full payment of both principal and interest of the loan according to the original contractual terms is in doubt.
F-67
Table of Contents
PACIFIC CITY FINANCIAL CORPORATION AND SUBSIDIARY
Notes to Consolidated Financial Statements (Unaudited)
March 31, 2018
The following table presents loans individually evaluated for impairment by portfolio segment as of the dates indicated. The recorded investment presents customer balances net of any partial charge-offs recognized on the loans and net of any deferred fees and costs.
| With No Allowance Recorded |
With an Allowance Recorded |
|||||||||||||||||||
| ($ in thousands) |
Recorded Investment |
Unpaid Principal Balance |
Recorded Investment |
Unpaid Principal Balance |
Related Allowance |
|||||||||||||||
| March 31, 2018 |
||||||||||||||||||||
| Real estate loans: |
||||||||||||||||||||
| Commercial property |
$ | 311 | $ | 493 | $ | — | $ | — | $ | — | ||||||||||
| Residential property |
730 | 730 | — | — | — | |||||||||||||||
| SBA property |
986 | 1,332 | 365 | 736 | 1 | |||||||||||||||
| Commercial and industrial loans: |
||||||||||||||||||||
| Commercial term |
183 | 198 | — | — | — | |||||||||||||||
| Commercial lines of credit |
— | 10 | — | — | — | |||||||||||||||
| SBA commercial term |
339 | 536 | 237 | 318 | 171 | |||||||||||||||
|
|
|
|
|
|
|
|
|
|
|
|||||||||||
| Total |
$ | 2,549 | $ | 3,299 | $ | 602 | $ | 1,054 | $ | 172 | ||||||||||
|
|
|
|
|
|
|
|
|
|
|
|||||||||||
| December 31, 2017 |
||||||||||||||||||||
| Real estate loans: |
||||||||||||||||||||
| Commercial property |
$ | 318 | $ | 494 | $ | — | $ | — | $ | — | ||||||||||
| Residential property |
730 | 730 | — | — | — | |||||||||||||||
| SBA property |
2,143 | 3,639 | — | — | — | |||||||||||||||
| Commercial and industrial loans: |
||||||||||||||||||||
| Commercial term |
199 | 216 | — | — | — | |||||||||||||||
| Commercial lines of credit |
10 | 20 | — | — | — | |||||||||||||||
| SBA commercial term |
122 | 288 | 279 | 354 | 208 | |||||||||||||||
|
|
|
|
|
|
|
|
|
|
|
|||||||||||
| Total |
$ | 3,522 | $ | 5,387 | $ | 279 | $ | 354 | $ | 208 | ||||||||||
|
|
|
|
|
|
|
|
|
|
|
|||||||||||
The following table presents information on impaired loans by portfolio segment for the periods indicated:
| Three Months Ended March 31, | ||||||||||||||||
| 2018 | 2017 | |||||||||||||||
| ($ in thousands) |
Average Recorded Investment |
Interest Income |
Average Recorded Investment |
Interest Income |
||||||||||||
| Real estate loans: |
||||||||||||||||
| Commercial property |
$ | 314 | $ | — | $ | 303 | $ | 5 | ||||||||
| Residential property |
730 | — | — | — | ||||||||||||
| SBA property |
1,187 | 5 | 2,019 | 8 | ||||||||||||
| Commercial and industrial loans: |
||||||||||||||||
| Commercial term |
188 | 3 | 883 | 5 | ||||||||||||
| Commercial lines of credit |
6 | — | 1,607 | — | ||||||||||||
| SBA commercial term |
450 | 6 | 828 | 2 | ||||||||||||
|
|
|
|
|
|
|
|
|
|||||||||
| Total |
$ | 2,875 | $ | 14 | $ | 5,640 | $ | 20 | ||||||||
|
|
|
|
|
|
|
|
|
|||||||||
F-68
Table of Contents
PACIFIC CITY FINANCIAL CORPORATION AND SUBSIDIARY
Notes to Consolidated Financial Statements (Unaudited)
March 31, 2018
The following presents a summary of interest foregone on impaired loans for the periods indicated:
| Three Months Ended March 31, |
||||||||
| ($ in thousands) |
2018 | 2017 | ||||||
| Interest income that would have been recognized had impaired loans performed in accordance with their original terms |
$ | 82 | $ | 78 | ||||
| Less: interest income recognized on impaired loans on a cash basis |
(47 | ) | (46 | ) | ||||
|
|
|
|
|
|||||
| Interest income foregone on impaired loans |
$ | 35 | $ | 32 | ||||
|
|
|
|
|
|||||
Troubled Debt Restructurings
A TDR is a restructuring in which the Company, for economic or legal reasons related to a borrower’s financial difficulties, grants a concession to the borrower that it would not otherwise consider. The restructuring of a loan includes, but is not limited to: (i) the transfer from the borrower to the Company of real estate, receivables from third parties, other assets, or an equity interest in full or partial satisfaction of the loan, (ii) a modification of the loan terms, such as a reduction of the stated interest rate, principal, or accrued interest or an extension of the maturity date at a stated interest rate lower than the current market rate for new debt with similar risk, or (iii) a combination of the above. A loan extended or renewed at a stated interest rate equal to the current interest rate for new debt with similar risk is not to be reported as a restructured loan.
The following table presents the composition of loans that were modified as TDRs by portfolio segment as of the dates indicated:
| March 31, 2018 | December 31, 2017 | |||||||||||||||||||||||
| ($ in thousands) |
Accruing | Nonaccrual | Total | Accruing | Nonaccrual | Total | ||||||||||||||||||
| Real estate loans: |
||||||||||||||||||||||||
| Commercial property |
$ | — | $ | 311 | $ | 311 | $ | — | $ | 318 | $ | 318 | ||||||||||||
| SBA property |
328 | — | 328 | 334 | 1,039 | 1,373 | ||||||||||||||||||
| Commercial and industrial loans: |
||||||||||||||||||||||||
| Commercial term |
183 | — | 183 | 195 | 4 | 199 | ||||||||||||||||||
| Commercial lines of credit |
— | — | — | — | 10 | 10 | ||||||||||||||||||
| SBA commercial term |
43 | 284 | 327 | 63 | 304 | 367 | ||||||||||||||||||
|
|
|
|
|
|
|
|
|
|
|
|
|
|||||||||||||
| Total |
$ | 554 | $ | 595 | $ | 1,149 | $ | 592 | $ | 1,675 | $ | 2,267 | ||||||||||||
|
|
|
|
|
|
|
|
|
|
|
|
|
|||||||||||||
The following table presents loans that were modified as TDRs by portfolio segment during the periods indicated:
| Three Months Ended March 31, | ||||||||||||||||||||||||
| 2018 | 2017 | |||||||||||||||||||||||
| ($ in thousands) |
Number of Loans |
Pre- Modification Recorded Investment |
Post- Modification Recorded Investment |
Number of Loans |
Pre- Modification Recorded Investment |
Post- Modification Recorded Investment |
||||||||||||||||||
| Commercial and industrial loans: |
||||||||||||||||||||||||
| Commercial term |
— | — | — | 1 | 7 | 7 | ||||||||||||||||||
|
|
|
|
|
|
|
|
|
|
|
|
|
|||||||||||||
| Total |
— | $ | — | $ | — | 1 | $ | 7 | $ | 7 | ||||||||||||||
|
|
|
|
|
|
|
|
|
|
|
|
|
|||||||||||||
F-69
Table of Contents
PACIFIC CITY FINANCIAL CORPORATION AND SUBSIDIARY
Notes to Consolidated Financial Statements (Unaudited)
March 31, 2018
The Company had $290 thousand and no commitments to lend to customers with outstanding loans that were classified as TDRs as of March 31, 2018 or December 31, 2017, respectively.
The determination of the allowance for loan losses related to TDRs depends on the collectability of principal and interest, according to the modified repayment terms. Loans that were modified as TDRs were individually evaluated for impairment and the Company allocated $171 thousand and $208 thousand of allowance for loan losses as of March 31, 2018 and December 31, 2017, respectively.
There were no loans that were modified as TDRs for which there was a payment default within twelve months following the modification during the three months ended March 31, 2018 and 2017.
Loans held-for-sale
The following table presents a composition of loans held-for-sale as of the dates indicated:
| ($ in thousands) |
March 31, 2018 |
December 31, 2017 |
||||||
| Real estate loans: |
||||||||
| Commercial property |
$ | 1,816 | $ | — | ||||
| Residential property |
730 | 270 | ||||||
| SBA property |
2,442 | 3,491 | ||||||
| Commercial and industrial loans: |
||||||||
| SBA commercial term |
1,194 | 1,536 | ||||||
|
|
|
|
|
|||||
| Total |
$ | 6,182 | $ | 5,297 | ||||
|
|
|
|
|
|||||
Loans held-for-sale are carried at the lower of cost or fair value. When a determination is made at the time of commitment to originate as held-for-investment, it is the Company’s intent to hold these loans to maturity or for the “foreseeable future,” subject to periodic reviews under the Company’s management evaluation processes, including asset/liability management and credit risk management. When the Company subsequently changes its intent to hold certain loans, the loans are transferred to held-for-sale at the lower of cost or fair value. Certain loans are transferred to held-for-sale with write-downs to allowance for loan losses.
The Company transferred $1.1 million of commercial property loans to loans held-for-sale during the three months ended March 31, 2018. The Company did not transfer any loans to loans held-for-sale during the three months ended March 31, 2017. The Company had no sales or purchases of loans, excluding loans held-for-sale, during the three months ended March 31, 2018 and 2017.
Note 5—Servicing Assets
At March 31, 2018 and December 31, 2017, total servicing assets were $8.9 million and $9.0 million, respectively. Underlying loans being serviced at March 31, 2018 and December 31, 2017 totaled $549.0 million and $543.3 million, respectively. The Company sold $29.9 million and $36.4 million, respectively, with the servicing rights retained during the three months ended March 31, 2018 and 2017. The Company recognized net gain on sale of these loans of $2.0 million and $2.3 million, respectively, and loan servicing income of $626 thousand and $566 thousand, respectively, for the three months ended March 31, 2018 and 2017.
All classes of servicing assets are measured using the amortization method and evaluated for impairment quarterly by comparing the fair value of the servicing right to the carrying amount. Fair value is estimated by
F-70
Table of Contents
PACIFIC CITY FINANCIAL CORPORATION AND SUBSIDIARY
Notes to Consolidated Financial Statements (Unaudited)
March 31, 2018
stratifying the loans sold between mortgage and non-mortgage loans and discounting estimated future cash flows from the servicing assets using discount rates that approximate current market rates over the expected lives of the loans being serviced. For the purposes of measuring impairment, the Company has identified each servicing asset with the underlying loan being serviced, and a valuation allowance is recorded when the fair value is below the carrying amount. There was no valuation allowance recorded during the three months ended March 31, 2018 and 2017.
The following table presents the composition of servicing assets with key assumptions used to estimate the fair value:
| March 31, 2018 | December 31, 2017 | |||||||||||||||
| ($ in thousands) |
Mortgage | Non-Mortgage | Mortgage | Non-Mortgage | ||||||||||||
| Carrying amount |
$ | 7,665 | $ | 1,225 | $ | 7,677 | $ | 1,296 | ||||||||
| Fair value |
$ | 8,001 | $ | 1,316 | $ | 8,337 | $ | 1,400 | ||||||||
| Discount rates |
18.50% to 19.75% | 12.00% to 13.25% | ||||||||||||||
| Prepayment speeds |
9.90% to 12.50% | 5.25% to 7.25% | ||||||||||||||
| Weighted average remaining life |
22.21 years | 8.07 years | 22.26 years | 8.23 years | ||||||||||||
The following table presents activity in servicing assets for the periods indicated:
| Three Months Ended March 31, | ||||||||||||||||
| 2018 | 2017 | |||||||||||||||
| ($ in thousands) |
Mortgage | Non-Mortgage | Mortgage | Non-Mortgage | ||||||||||||
| Balance at beginning of period |
$ | 7,677 | $ | 1,296 | $ | 7,101 | $ | 1,201 | ||||||||
| Additions |
436 | 74 | 732 | 141 | ||||||||||||
| Amortization |
(448 | ) | (145 | ) | (409 | ) | (129 | ) | ||||||||
|
|
|
|
|
|
|
|
|
|||||||||
| Balance at end of period |
$ | 7,665 | $ | 1,225 | $ | 7,424 | $ | 1,213 | ||||||||
|
|
|
|
|
|
|
|
|
|||||||||
Note 6—Borrowings from Federal Home Loan Bank and Other Borrowings
Borrowings from Federal Home Loan Bank
The Company had $40.0 million in borrowings from Federal Home Loan Bank (“FHLB”) at March 31, 2018 and December 31, 2017. The borrowings from FHLB consisted of fixed interest rates with original maturity terms ranging from one to five years. The weighted average interest rate for the FHLB borrowings was 1.71% at March 31, 2018 and December 31, 2017. Each borrowing is payable at its maturity date. Borrowings paid early are subject to a prepayment penalty.
At March 31, 2018 and December 31, 2017, loans pledged to secure borrowings from the FHLB were $728.0 million and $711.8 million, respectively. The Company’s investment in capital stock of the FHLB of San Francisco totaled $6.4 million at March 31, 2018 and December 31, 2017. The Company had additional borrowing capacity of $320.5 million and $311.0 million, respectively, from the FHLB of San Francisco as of March 31, 2018 and December 31, 2017.
Other Borrowing Arrangements
At March 31, 2018, the Company had $50.6 million of unused borrowing capacity from the Federal Reserve Discount Window, to which the Company pledged loans with a carrying value of $57.4 million with no
F-71
Table of Contents
PACIFIC CITY FINANCIAL CORPORATION AND SUBSIDIARY
Notes to Consolidated Financial Statements (Unaudited)
March 31, 2018
outstanding borrowings at March 31, 2018. In addition, the Company may borrow up to approximately $60.0 million overnight federal funds lines on an unsecured basis with correspondent banks.
Note 7—Shareholders’ Equity
Change in Accumulated Other Comprehensive Income (Loss)
Components of accumulated other comprehensive income (loss) consisted solely of the change in unrealized gains or losses on securities available-for-sale, net of taxes. Reclassifications from accumulated other comprehensive income (loss) are recorded in the Consolidated Statements of Income either as a gain or loss. The following table presents changes to accumulated other comprehensive income (loss) for the periods indicated:
| Three Months Ended March 31, |
||||||||
| ($ in thousands) |
2018 | 2017 | ||||||
| Unrealized loss on securities available-for-sale |
||||||||
| Beginning balance |
$ | (1,223 | ) | $ | (531 | ) | ||
| Unrealized gain (loss) arising during the period |
(1,445 | ) | 119 | |||||
| Tax effect of current period changes |
420 | (49 | ) | |||||
|
|
|
|
|
|||||
| Total other comprehensive income (loss) |
(1,025 | ) | 70 | |||||
|
|
|
|
|
|||||
| Balance at end of period |
$ | (2,248 | ) | $ | (461 | ) | ||
|
|
|
|
|
|||||
Note 8—Share-Based Compensation
On July 25, 2013, the Company adopted 2013 Equity Based Stock Compensation Plan (“2013 EBSC Plan”) approved by its shareholders to replace the 2003 Stock Option Plan. The 2013 EBSC Plan provided for options to purchase 1,114,446 shares of common stock at a price not less than 100% of the fair market value of the stock. As of March 31, 2018, there were 633,450 shares available for future grants.
Share-Based Compensation Expense
The Company recognized share-based compensation expense of $182 thousand and $175 thousand, respectively, for the three months ended March 31, 2018 and 2017. The Company realized income tax benefits of $17 thousand and $27 thousand, respectively, related to share-based compensation in the three months ended March 31, 2018 and 2017. As of March 31, 2018, the Company had unrecognized share-based compensation expense of $1.7 million related to the outstanding stock options that will be recognized over a weighted average period of 3.16 years.
Stock Options
The Company has issued stock options to certain employees, officers and directors. Stock options are issued at the closing market price on the grant date, and generally have a three- to five- year vesting period and contractual terms of ten years.
F-72
Table of Contents
PACIFIC CITY FINANCIAL CORPORATION AND SUBSIDIARY
Notes to Consolidated Financial Statements (Unaudited)
March 31, 2018
The following table represents stock option activity as of and for the three months ended March 31, 2018:
| Three Months Ended March 31, 2018 | ||||||||||||||||
| ($ in thousands except per share data) |
Number of Shares |
Weighted- Average Exercise Price Per Share |
Weighted- Average Contractual Term |
Aggregated Intrinsic Value |
||||||||||||
| Outstanding at beginning of period |
859,635 | $ | 8.84 | 7.10 years | $ | 5,689 | ||||||||||
| Granted |
55,000 | $ | 14.82 | 10.00 years | ||||||||||||
| Exercised |
(6,878 | ) | $ | 4.33 | 4.83 years | |||||||||||
| Forfeited |
(1,597 | ) | $ | 9.39 | 6.39 years | |||||||||||
|
|
|
|||||||||||||||
| Balance at end of year |
906,160 | $ | 9.28 | 7.04 years | $ | 5,278 | ||||||||||
|
|
|
|||||||||||||||
| Exercisable at end of period |
327,874 | $ | 6.36 | 5.59 years | $ | 2,865 | ||||||||||
|
|
|
|||||||||||||||
The following table represents information regarding unvested stock options as of and for the three months ended March 31, 2018.
| Three Months Ended March 31, 2018 |
||||||||
| Number of Shares |
Weighted- Average Exercise Price Per Share |
|||||||
| Outstanding at beginning of period |
578,154 | $ | 4.28 | |||||
| Granted |
55,000 | $ | 14.82 | |||||
| Vested |
(53,271 | ) | $ | 4.51 | ||||
| Forfeited |
(1,597 | ) | $ | 9.39 | ||||
|
|
|
|||||||
| Balance at end of year |
578,286 | $ | 10.93 | |||||
|
|
|
|||||||
Note 9—Income Taxes
For the three months ended March 31, 2018 and 2017, income tax expense was $2.7 million and $3.2 million, respectively, and the effective tax rate was 29.9 percent and 42.4 percent, respectively. The decrease in effective tax rate was mainly due to a decrease in the federal statutory tax rate from 35% to 21% as a result of H.R. 1, originally known (and referred to below) as the “Tax Cuts and Jobs Act”, which became effective on January 1, 2018.
At March 31, 2018 and December 31, 2017, the Company had no unrecognized tax benefits, or accrued interest or penalties. In the event the Company is assessed interest and/or penalties by federal or state tax authorities, such amounts will be classified in the consolidated financial statements as income tax expense.
The Company and its subsidiaries are subject to U.S. federal income tax as well as income tax in multiple state jurisdictions. The Company is no longer subject to the assessment of U.S. federal income tax for years before 2014. The statute of limitations for the assessment of California Franchise taxes has expired for tax years before 2013 (other state income and franchise tax statutes of limitations vary by state).
On December 22, 2017, the Tax Cuts and Jobs Act was enacted into law and brought with it significant changes to the U.S Internal Revenue Code of 1986, as amended, that impact corporate taxation requirements. At
F-73
Table of Contents
PACIFIC CITY FINANCIAL CORPORATION AND SUBSIDIARY
Notes to Consolidated Financial Statements (Unaudited)
March 31, 2018
March 31, 2018, the Company did not have any material adjustments to the items previously recorded at December 31, 2017 related to the tax reform legislation. At December 31, 2017, the Company early adopted ASU 2018-02, “Income Statement—Reporting Comprehensive Income (Topic 220): Reclassification of Certain Tax Effects from Accumulated Other Comprehensive Income,” which allowed a reclassification from accumulated other comprehensive income to retained earnings for disproportionate tax effects resulting from the Tax Cuts and Jobs Act. As a result of the adoption, the Company recorded a decrease in accumulated other comprehensive income of $242 thousand and an increase in retained earnings for the same amount to eliminate the stranded tax effects at that date from the reduction in the federal statutory tax rate that was enacted in December 22, 2017 and became effective January 1, 2018.
Note 10—Earnings Per Share
The following is a reconciliation of net income and shares outstanding to the income and number of share used to compute earnings per share:
| Three Months Ended March 31, |
||||||||
| ($ in thousands except per share data) |
2018 | 2017 | ||||||
| Basic earnings per share: |
||||||||
| Net income |
$ | 6,264 | $ | 4,398 | ||||
|
|
|
|
|
|||||
| Weighted-average commons shares outstanding |
13,418,259 | 13,395,363 | ||||||
|
|
|
|
|
|||||
| Basic earnings per share |
$ | 0.47 | $ | 0.33 | ||||
|
|
|
|
|
|||||
| Diluted earnings per share: |
||||||||
| Net income |
$ | 6,264 | $ | 4,398 | ||||
|
|
|
|
|
|||||
| Weighted-average commons shares outstanding |
13,418,259 | 13,395,363 | ||||||
| Diluted effect of stock options |
168,500 | 108,139 | ||||||
|
|
|
|
|
|||||
| Diluted weighted-average common shares outstanding |
13,586,759 | 13,503,502 | ||||||
|
|
|
|
|
|||||
| Diluted earnings per share |
$ | 0.46 | $ | 0.33 | ||||
|
|
|
|
|
|||||
Note 11—Commitments and Contingencies
In the ordinary course of business, the Company enters into financial commitments to meet the financing needs of its customers. These financial commitments include commitments to extend credit and letters of credit. Those instruments involve to varying degrees, elements of credit, and interest rate risk not recognized in the Company’s consolidated financial statements. As of March 31, 2018 and December 31, 2017, the Company had the following outstanding financial commitments whose contractual amount represents credit risk:
| ($ in thousands) |
March 31, 2018 |
December 31, 2017 |
||||||
| Commitments to extend credit |
$ | 121,432 | $ | 109,835 | ||||
| Stand by letters of credit |
3,308 | 3,309 | ||||||
| Commercial letters of credit |
76 | 233 | ||||||
|
|
|
|
|
|||||
| Total |
$ | 124,816 | $ | 113,377 | ||||
|
|
|
|
|
|||||
F-74
Table of Contents
PACIFIC CITY FINANCIAL CORPORATION AND SUBSIDIARY
Notes to Consolidated Financial Statements (Unaudited)
March 31, 2018
The Company’s exposure to loan loss in the event of nonperformance on commitments to extend credit and standby letters of credit is represented by the contractual amount of those instruments. The Company uses the same credit policies in making commitments as it does for the loans reflected in the consolidated financial statements. The Company maintained reserve for off-balance sheet items of $118 thousand and $121 thousand, respectively, at March 31, 2018 and December 31, 2017.
Commitments to extend credit are agreements to lend to a customer as long as there is no violation of any condition established in the contract. Since many of the commitments are expected to expire without being drawn upon, the total amounts do not necessarily represent future cash requirements. The Company evaluates each client’s credit worthiness on a case-by-case basis. The amount of collateral obtained if deemed necessary by the Company is based on management’s credit evaluation of the customer.
As of March 31, 2018 and December 31, 2017, the Company had operating lease commitments of $12.5 million and $12.7 million, respectively.
Litigation
The Company is involved in various matters of litigation, which have arisen in the ordinary course of business. In the opinion of management, the disposition of pending matters of litigation will not have a material effect on the Company’s consolidated financial statements.
Note 12—Regulatory Matters
Banks and bank holding companies are subject to regulatory capital requirements administered by federal banking agencies. Capital adequacy guidelines and, additionally for banks, prompt corrective action regulations, involve quantitative measures of assets, liabilities, and certain off-balance-sheet items calculated under regulatory accounting practices. Capital amounts and classifications are also subject to qualitative judgments by regulators. Failure to meet capital requirements can initiate regulatory action. The final rules implementing Basel Committee on Banking Supervision’s capital guidelines for U.S. banks (“Basel III rules”) became effective for the Company on January 1, 2015 with full compliance with all of the requirements being phased in over a multi-year schedule, and fully phased in by January 1, 2019.
Under the Basel III rules, the Company must hold a capital conservation buffer above the adequately capitalized risk-based capital ratios. The capital conservation buffer is being phased in from 0.0% for 2015 to 2.50% by 2019. Management believes as of March 31, 2018 and December 31, 2017, the Company and the Bank met all capital adequacy requirements to which they are subject. The Company and the Bank’s capital conservation buffer was 5.36% and 5.29%, respectively, as of March 31, 2018, and 5.20% and 5.12%, respectively, as of December 31, 2017.
F-75
Table of Contents
PACIFIC CITY FINANCIAL CORPORATION AND SUBSIDIARY
Notes to Consolidated Financial Statements (Unaudited)
March 31, 2018
The following table presents the regulatory capital amounts and ratios for the Company and the Bank as of dates indicated:
| Actual | Minimum Capital Requirement | To Be Well Capitalized Under Prompt Corrective Provisions |
||||||||||||||||||||||
| (Dollars in thousands) |
Amount | Ratio | Amount | Ratio | Amount | Ratio | ||||||||||||||||||
| March 31, 2018 |
||||||||||||||||||||||||
| Pacific City Financial Corporation |
||||||||||||||||||||||||
| Common tier 1 capital (to risk-weighted assets) |
148,255 | 12.3 | % | 54,132 | 4.5 | % | N/A | N/A | ||||||||||||||||
| Total capital (to risk-weighted assets) |
160,743 | 13.4 | % | 96,235 | 8.0 | % | N/A | N/A | ||||||||||||||||
| Tier 1 capital (to risk-weighted assets) |
148,255 | 12.3 | % | 72,176 | 6.0 | % | N/A | N/A | ||||||||||||||||
| Tier 1 capital (to average assets) |
148,255 | 10.1 | % | 58,832 | 4.0 | % | N/A | N/A | ||||||||||||||||
| Pacific City Bank |
||||||||||||||||||||||||
| Common tier 1 capital (to risk-weighted assets) |
147,376 | 12.3 | % | 54,130 | 4.5 | % | 78,187 | 6.5 | % | |||||||||||||||
| Total capital (to risk-weighted assets) |
159,864 | 13.3 | % | 96,230 | 8.0 | % | 120,288 | 10.0 | % | |||||||||||||||
| Tier 1 capital (to risk-weighted assets) |
147,376 | 12.3 | % | 72,173 | 6.0 | % | 96,230 | 8.0 | % | |||||||||||||||
| Tier 1 capital (to average assets) |
147,376 | 10.0 | % | 58,783 | 4.0 | % | 73,479 | 5.0 | % | |||||||||||||||
| December 31, 2017 |
||||||||||||||||||||||||
| Pacific City Financial Corporation |
||||||||||||||||||||||||
| Common tier 1 capital (to risk-weighted assets) |
142,370 | 12.2 | % | 52,730 | 4.5 | % | N/A | N/A | ||||||||||||||||
| Total capital (to risk-weighted assets) |
154,715 | 13.2 | % | 93,766 | 8.0 | % | N/A | N/A | ||||||||||||||||
| Tier 1 capital (to risk-weighted assets) |
142,370 | 12.2 | % | 70,306 | 6.0 | % | N/A | N/A | ||||||||||||||||
| Tier 1 capital (to average assets) |
142,370 | 10.0 | % | 56,891 | 4.0 | % | N/A | N/A | ||||||||||||||||
| Pacific City Bank |
||||||||||||||||||||||||
| Common tier 1 capital (to risk-weighted assets) |
141,361 | 12.1 | % | 52,747 | 4.5 | % | 76,189 | 6.5 | % | |||||||||||||||
| Total capital (to risk-weighted assets) |
153,705 | 13.1 | % | 93,723 | 8.0 | % | 117,153 | 10.0 | % | |||||||||||||||
| Tier 1 capital (to risk-weighted assets) |
141,361 | 12.1 | % | 70,329 | 6.0 | % | 93,772 | 8.0 | % | |||||||||||||||
| Tier 1 capital (to average assets) |
141,361 | 9.9 | % | 56,886 | 4.0 | % | 71,107 | 5.0 | % | |||||||||||||||
The California Financial Code provides that a bank may not make a cash distribution to its shareholders in excess of the lesser of the bank’s undivided profits or the bank’s net income for its last three fiscal years less the amount of any distribution made to the bank’s shareholder during the same period.
The California general corporation law prohibits the Company from paying dividends on its common stock unless: (i) its retained earnings, immediately prior to the dividend payment, equals or exceeds the amount of the dividend or (ii) immediately after giving effect to the dividend, the sum of the Company’s assets (exclusive of goodwill and deferred charges) would be at least equal to 125% of its liabilities (not including deferred taxes, deferred income, and other deferred liabilities) and the current assets of the Company would be at least equal to its current liabilities, or, if the average of its earnings before taxes on income and before its interest expense for the two preceding fiscal years, at least equal to 125% of its current liabilities.
F-76
Table of Contents
PACIFIC CITY FINANCIAL CORPORATION AND SUBSIDIARY
Notes to Consolidated Financial Statements (Unaudited)
March 31, 2018
Note 13—Revenue Recognition
On January 1, 2018, the Company adopted ASU 2014-09, “Revenue from Contracts with Customers (Topic 606),” and all subsequent ASUs that are related to Topic 606. As stated in Note 1, the implementation of the new standard did not have a material impact on the measurement, timing, or recognition of revenue. Accordingly, no cumulative effect adjustment to opening retained earnings was deemed necessary. Results for reporting periods beginning after January 1, 2018 are presented under Topic 606, while prior period amounts were not adjusted and continue to be reported in accordance with our historic accounting under Topic 605.
Topic 606 does not apply to revenue associated with financial instruments, including revenue from loans and securities. In addition, certain noninterest income streams such as gain or loss associated with mortgage servicing assets and financial guarantees are also not within the scope of the new guidance. Topic 606 is applicable to noninterest income such as deposit related fees, interchange fees, and merchant related income. However, the recognition of these revenue streams did not change significantly upon adoption of Topic 606. Noninterest income considered to be within the scope of Topic 606 is discussed below.
Service charges and fees on deposits: Deposit account service charges consist of monthly service fees, account analysis fees, non-sufficient funds (“NSF”) charges and other deposit related fees. The Company’s performance obligation for account analysis fees and monthly service fees is generally satisfied, and the related revenue recognized, over the period in which the service is provided. NSF charges, and other deposit account service charges are largely transactional based, and therefore, the Company’s performance obligation is satisfied, and related revenue recognized, at a point in time as incurred.
Debit card fees: When customers use their debit cards to pay merchants for goods or services, the Company retains a fee from the funds collected from the related deposit account and transfers the remaining funds to the payment network for remittance to the merchant. The performance obligation to the merchant is satisfied and the fee is recognized at the point in time when the funds are collected and transferred to the payment network.
Gain (loss) on sale of other real estate owned: The Company’s performance obligation for sale of OREO is the transfer of title and ownership rights of the OREO to the buyer, which occurs at the settlement date when the sale proceeds are received and income is recognized.
Wire transfer fees and other service charges: Wire transfer fees and other service charges are transaction based, and therefore, the Company’s performance obligation is satisfied, and related revenue recognized, at a point in time as incurred.
F-77
Table of Contents
PACIFIC CITY FINANCIAL CORPORATION AND SUBSIDIARY
Notes to Consolidated Financial Statements (Unaudited)
March 31, 2018
The following table presents revenue from contracts with customers within the scope of ASC 606 for the three months ended March 31, 2018 and 2017:
| Three Months Ended March 31, |
||||||||
| ($ in thousands) |
2018 | 2017 | ||||||
| Noninterest Income |
||||||||
| In scope of Topic 606 |
||||||||
| Service charges and fees on deposits: |
||||||||
| Monthly service fees |
$ | 25 | $ | 25 | ||||
| Account analysis fees |
235 | 216 | ||||||
| Non-sufficient funds charges |
67 | 86 | ||||||
| Other deposit related fees |
22 | 23 | ||||||
|
|
|
|
|
|||||
| Total service charges and fees on deposits |
349 | 350 | ||||||
| Debit card fees |
45 | 48 | ||||||
| Gain (loss) on sale of other real estate owned |
3 | (1 | ) | |||||
| Wire transfer fees |
104 | 99 | ||||||
| Other service charges |
64 | 45 | ||||||
|
|
|
|
|
|||||
| Total noninterest income in-scope of Topic 606 |
$ | 565 | $ | 541 | ||||
|
|
|
|
|
|||||
Note 14—Subsequent Events
Dividend Declared on Common Stock
On May 4, 2018, the Company declared a quarterly cash dividend of $0.03 per common share for the second quarter of 2018. The dividend was paid on June 15, 2018, to shareholders of record as of the close of business on May 31, 2018.
The Company has evaluated the effects of events that have occurred subsequent to March 31, 2018 through the issuance date of these consolidated financial statements (unaudited). Other than the event described above, there have been no material events that would require disclosure in the consolidated financial statements or in the notes to the consolidated financial statements.
F-78
Table of Contents
[*] Shares
Common Stock
PROSPECTUS
[*], 2018
| Keefe, Bruyette & Woods A Stifel Company |
||||
| RAYMOND JAMES | ||||
| Sandler O’Neill + Partners, L.P. |
Through and including [*], 2018 (25 days after the date of this prospectus), all dealers that effect transactions in our common stock, whether or not participating in this offering, may be required to deliver a prospectus. This delivery requirement is in addition to the obligation of dealers to deliver a prospectus when acting as underwriters and with respect to their unsold allotments or subscriptions.
Table of Contents
PART II—INFORMATION NOT REQUIRED IN PROSPECTUS
| ITEM 13—Other | Expenses of Issuance and Distribution. |
The following table sets forth all costs and expenses, other than underwriting discounts and commissions, in connection with the sale of shares of our common stock being registered, all of which will be paid by us. All amounts shown are estimates, except for the SEC registration fee, the FINRA filing fee and the Nasdaq listing fee.
| Amount | ||||
| SEC registration fee |
* | |||
| FINRA filing fee |
* | |||
| Nasdaq listing fee |
* | |||
| Legal fees and expenses |
* | |||
| Accounting fees and expenses |
* | |||
| Printing fees and expenses |
* | |||
| Transfer agent and registrar fees and expenses |
* | |||
| Miscellaneous |
* | |||
|
|
|
|||
| Total |
* | |||
|
|
|
|||
| * | To be filed by amendment |
| ITEM 14—Indemnification | of Directors and Officers. |
Under Section 317 of the California Corporations Code, or the CGCL, a California corporation has the power to indemnify any person who was or is a party, or is threatened to be made a party to any proceeding (other than an action by or in the right of the corporation to procure a judgment in its favor), whether civil, criminal, administrative or investigative by reason of the fact that he or she is or was an agent of the corporation, against expenses (including attorneys’ fees), judgments, fines, settlements and other amounts actually and reasonably incurred in connection with the proceeding if that person acted in good faith and in a manner he or she reasonably believed to be in the best interests of the corporation and, in the case of a criminal proceeding, had no reasonable cause to believe his or her conduct was unlawful.
In addition, a California corporation shall have power to indemnify any person who was or is a party or is threatened to be made a party to any threatened, pending or completed action by or in the right of the corporation to procure a judgment in its favor by reason of the fact that the person is or was an agent of the corporation, against expenses actually and reasonably incurred by that person in connection with the defense or settlement of the action if the person acted in good faith, in a manner the person believed to be in the best interests of the corporation and its shareholders, provided that no indemnification shall be made for any of the following (1) with respect to any claim, issue, or matter as to which such person has been adjudged to have been liable to the corporation in the performance of that person’s duty to the corporation and its shareholders, unless and only to the extent that the court in which the proceeding is or was pending shall determine upon application that, in view of all the circumstances of the case, the person is fairly and reasonably entitled to indemnity for expenses and then only to the extent that the court shall determine; (2) of amounts paid in settling or otherwise disposing of a pending action without court approval; or (3) of expenses incurred in defending a pending action which is settled or otherwise disposed of without court approval.
Section 317 of the CGCL also provides that, to the extent that an agent of a corporation has been successful on the merits in the defense of any proceeding referred to in either of the foregoing paragraphs or in defense of any claim, issue or matter therein, the agent shall be indemnified against expenses actually and reasonably incurred by the agent in connection therewith.
II-1
Table of Contents
Section 317 of the CGCL also provides that to the extent that an agent of a corporation has been successful on the merits in defense of any proceeding referred to above or in defense of any claim, issue, or matter therein, the agent shall be indemnified against expenses actually and reasonably incurred by the agent in connection therewith.
Except as provided in the paragraph above, any indemnification under this section shall be made by the corporation only if authorized in the specific case, upon a determination that indemnification of the agent is proper in the circumstances because the agent has met the applicable standard of conduct set forth above, by any of the following: (1) a majority vote of a quorum consisting of directors who are not parties to such proceeding, (2) if such a quorum of directors is not obtainable, by independent legal counsel in a written opinion, (3) approval of the shareholders (Section 153), with the shares owned by the person to be indemnified not being entitled to vote thereon, or (4) the court in which the proceeding is or was pending upon application made by the corporation or the agent or the attorney or other person rendering services in connection with the defense, whether or not the application by the agent, attorney or other person is opposed by the corporation.
Our articles of incorporation provide that the liability of the directors of the Corporation for monetary damages may be eliminated to the fullest extent permissible under California law. Our articles of incorporation and bylaws also provide that we are authorized to provide indemnification of agents (as defined in Section 317 of the CGCL) for breach of duty to the corporation and its shareholders through bylaw provisions or through agreements with agents, or both, in excess of the indemnification otherwise permitted by Section 317 of the CGCL, subject to the limits of such excess indemnification set forth in Section 204 of the CGCL.
Our bylaws provide that, to the maximum extent permitted by the CGCL, we may indemnify our agents (to include directors and officers) against expenses, judgments, fines, settlements and other amounts actually and reasonably incurred in connection with any proceeding arising by reason of the fact any such person is or was an agent of the corporation, and shall have power to advance to each such agent expenses incurred in defending any such proceeding to the maximum extent permitted by law.
We have also obtained officers’ and directors’ liability insurance which insures against liabilities that officers and directors may, in such capacities, incur. Section 317 of the CGCL provides that a California corporation shall have power to purchase and maintain insurance on behalf of any agent of the corporation against any liability asserted against or incurred by the agent in any that capacity or arising out of the agent’s status as such whether or not the corporation would have the power to indemnify the agent against that liability under CGCL Section 317.
Reference is also made to the form of underwriting agreement to be filed as Exhibit 1.1 hereto for provisions providing that the underwriters are obligated under certain circumstances to indemnify our directors, officers and controlling persons against certain liabilities under the Securities Act.
ITEM 15—Recent Sales of Unregistered Securities.
On August 5, 2016, the Company completed a private placement to accredited investors as defined in SEC Rule 501 of Regulation D whereby the Company raised $15,300,000 in connection with the sale of 1,273,000 shares of common stock at the price of $12.00 per share. The Company relied on Section 4(a)(2) of the Securities Act of 1933 and Regulation D for its exemption from the registration provisions. No underwriter or placement agent was involved in the transaction. Proceeds from the sale were used for general corporate purposes, including investment in the subsidiary.
Since January 1, 2015, we have also issued a total of 180,701 shares of our common stock upon exercise of stock options pursuant to the 2013 Equity Based Compensation Plan and the 2003 Stock Option Plan. The per share exercise price of the stock options exercised during this period ranged from $3.38 to $10.33. The aggregate proceeds were $898,668. The issuances of common stock were exempt from the registration requirements of the Securities Act pursuant to Rule 701.
II-2
Table of Contents
None of the transactions described in this Item 15 involved any underwriters, underwriting discounts or commissions.
ITEM 16—Exhibits and Financial Statement Schedules.
(a) Exhibits
| 1 | To be filed by amendment. |
| 2 | Indicates a management contract or compensatory plan. |
| 3 | Previously filed. |
(b) Financial Statement Schedules
All schedules have been omitted as not applicable or not required under the rules of Regulation S-X.
II-3
Table of Contents
| ITEM 17—Undertakings. |
The undersigned registrant hereby undertakes to provide to the underwriters at the closing specified in the underwriting agreement certificates in such denominations and registered in such names as required by the underwriters to permit prompt delivery to each purchaser.
Insofar as indemnification for liabilities arising under the Securities Act may be permitted to directors, officers and controlling persons of the registrant pursuant to the foregoing provisions, or otherwise, the registrant has been advised that in the opinion of the SEC such indemnification is against public policy as expressed in the Securities Act and is, therefore, unenforceable. In the event that a claim for indemnification against such liabilities (other than the payment by the registrant of expenses incurred or paid by a director, officer or controlling person of the registrant in the successful defense of any action, suit or proceeding) is asserted by such director, officer or controlling person in connection with the securities being registered, the registrant will, unless in the opinion of its counsel the matter has been settled by controlling precedent, submit to a court of appropriate jurisdiction the question whether such indemnification by it is against public policy as expressed in the Securities Act and will be governed by the final adjudication of such issue.
The undersigned registrant hereby undertakes that:
(1) For purposes of determining any liability under the Securities Act, the information omitted from the form of prospectus filed as part of this registration statement in reliance upon Rule 430A and contained in a form of prospectus filed by the registrant pursuant to Rule 424(b)(1) or (4) or 497(h) under the Securities Act shall be deemed to be part of this registration statement as of the time it was declared effective.
(2) For the purpose of determining any liability under the Securities Act, each post-effective amendment that contains a form of prospectus shall be deemed to be a new registration statement relating to the securities offered therein and the offering of such securities at that time shall be deemed to be the initial bona fide offering thereof.
II-4
Table of Contents
SIGNATURES
Pursuant to the requirements of the Securities Act of 1933, as amended, the registrant has duly caused this registration statement to be signed on its behalf by the undersigned, thereunto duly authorized, in the City of Los Angeles, State of California, on July 24, 2018.
| PACIFIC CITY FINANCIAL CORPORATION | ||
| By: |
/s/ Henry Kim | |
|
| ||
| Henry Kim, | ||
| President and Chief Executive Officer | ||
KNOW ALL MEN BY THESE PRESENTS, that each individual whose signature appears below constitutes and appoints Henry Kim and Timothy Chang and each of them, his or her true and lawful attorneys-in-fact and agents with full power of substitution and re-substitution, for him or her and in his or her name, place and stead, in any and all capacities, to sign any and all amendments (including post-effective amendments) to this registration statement and to file the same with all exhibits thereto, and all documents in connection therewith, with the Securities and Exchange Commission, granting unto said attorneys-in-fact and agents, and each of them, full power and authority to do and perform each and every act and thing requisite and necessary to be done, as fully to all intents and purposes as he might or could do in person, hereby ratifying and confirming all that said attorneys-in-fact and agents or any of them, or their or his substitute or substitutes, may lawfully do or cause to be done by virtue hereof. This power of attorney may be executed in counterparts.
Pursuant to the requirements of the Securities Act, this registration statement has been signed by the following persons in the capacities and on the dates indicated.
| Signature |
Title |
Date | ||||
| /s/ Henry Kim Henry Kim |
Director; President and Chief Executive Officer (Principal Executive Officer) |
July 25, 2018 | ||||
| /s/ Timothy Chang Timothy Chang |
Executive Vice President and Chief Financial Officer (Principal Financial and Accounting Officer) |
July 25, 2018 | ||||
| * Sang Young Lee |
Director (Chairman) | July 25, 2018 | ||||
| * Suk Won Youn |
Director | July 25, 2018 | ||||
| * Kwang Jin Chung |
Director | July 25, 2018 | ||||
| * Don Rhee |
Director | July 25, 2018 | ||||
| * Haeyoung Cho |
Director | July 25, 2018 | ||||
| * Kijun Ahn |
Director | July 25, 2018 | ||||
| * Daniel H. Park |
Director | July 25, 2018 | ||||
| *By |
/s/ Henry Kim Attorney-in-fact |
|||||
| July 25, 2018 | ||||||
II-5