Attached files
| file | filename |
|---|---|
| 8-K - 8-K - GENERAL DYNAMICS CORP | gd-201807018k.htm |
Exhibit 99.1

2941 Fairview Park Drive, Suite 100 | ||
Falls Church, VA 22042-4513 | News | |
www.generaldynamics.com | ||
Contact: Lucy Ryan
Tel: 703 876 3631
lryan@generaldynamics.com
July 25, 2018
General Dynamics Reports Second-Quarter 2018 Results
• | Revenue up 19.7% to $9.2 billion |
• | Net earnings up 4.9% to $786 million |
• | Diluted EPS up 6.9% to $2.62, including $0.20 charge for CSRA transaction costs |
• | Robust demand drives Gulfstream to a book-to-bill greater than one-to-one |
FALLS CHURCH, Va. – General Dynamics (NYSE: GD) today reported second-quarter 2018 net earnings of $786 million, a 4.9 percent increase over second-quarter 2017. Revenue increased by 19.7 percent to $9.2 billion due to strong defense volumes and the acquisition of CSRA. On an organic basis, the defense businesses generated a 7.1 percent revenue increase.
Diluted earnings per share (EPS) was $2.62 compared to $2.45 in the year-ago quarter, a 6.9 percent increase. In the quarter, the company incurred one-time charges totaling $0.20 per share related to the acquisition of CSRA. Absent the charge, EPS would have been 15.1 percent higher than second-quarter 2017.
“General Dynamics delivered solid operating results and accomplished a number of key strategic objectives across the portfolio,” said Phebe N. Novakovic, chairman and chief executive officer. “We closed on the CSRA acquisition, building on our core GDIT business to create a leading government IT services provider, and integration of the business is well underway. Our Combat and Marine segments continue to have reliable growth with strong operating performance. And the FAA certified the G500 and we look forward to delivering this newest Gulfstream aircraft to our customers in fourth-quarter 2018.”
Margin
Company-wide operating margin for the second quarter of 2018 was 11.8 percent, including one-time transaction costs and incremental intangible asset amortization associated with the CSRA acquisition. This is compared to 13.9 percent in second-quarter 2017.
Cash
Net cash provided by operating activities in the quarter totaled $787 million, compared to $477 million from the year-ago quarter. Free cash flow from operations, defined as net cash provided by operating activities less capital expenditures, was $612 million.
– more –
Capital Deployment
The company repurchased 0.9 million of its outstanding shares for $179 million in the second quarter. Year-to-date, the company has repurchased 2.1 million outstanding shares for $436 million.
Backlog
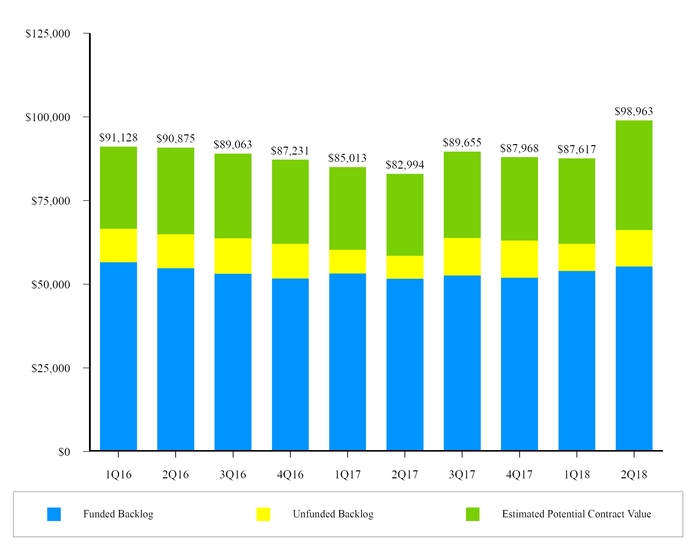
General Dynamics’ total backlog at the end of second-quarter 2018 was $66.3 billion. The estimated potential contract value, representing management’s estimate of value in unfunded indefinite delivery, indefinite quantity (IDIQ) contracts and unexercised options, was $32.7 billion. Total potential contract value, the sum of all backlog components, was $99 billion at the end of the quarter.
Gulfstream unit orders were 21 percent higher than the year-ago quarter, with large-cabin orders accounting for approximately 75 percent of the demand.
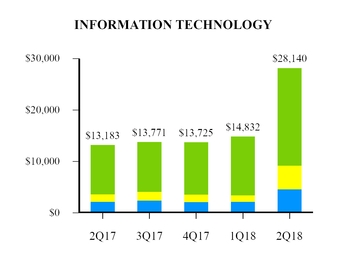
Total backlog for the defense businesses was up 7.7 percent from the end of first-quarter 2018, due to the CSRA acquisition and strong order activity across the segments. On an organic basis, Information Technology achieved a book-to-bill ratio greater than one-to-one, and the book-to-bill ratio in Mission Systems was one-to-one. Significant awards in the quarter include $615 million from the Centers for Medicare & Medicaid Services for contact-center services, $440 million from the U.S. Army to upgrade Abrams main battle tanks, $260 million from the Army to upgrade Stryker vehicles, $225 million from the U.S. Navy for Block V Virginia-class submarines, $150 million from the Army for the production of Hydra-70 rockets and $125 million from the Navy for Common Missile Compartment work.
About General Dynamics
Headquartered in Falls Church, Virginia, General Dynamics is a global aerospace and defense company that offers a broad portfolio of products and services in business aviation; combat vehicles, weapons systems and munitions; IT services; C4ISR solutions; and shipbuilding and ship repair. The company’s 2017 revenue was $31 billion. More information is available at www.generaldynamics.com.
– more –
Certain statements made in this press release, including any statements as to future results of operations and financial projections, may constitute “forward-looking statements” within the meaning of the Private Securities Litigation Reform Act of 1995, as amended. Forward-looking statements are based on management’s expectations, estimates, projections and assumptions. These statements are not guarantees of future performance and involve risks and uncertainties that are difficult to predict. Therefore, actual future results and trends may differ materially from what is forecast in forward-looking statements due to a variety of factors. Additional information regarding these factors is contained in the company’s filings with the Securities and Exchange Commission, including, without limitation, its Annual Report on Form 10-K and its Quarterly Reports on Form 10-Q. All forward-looking statements speak only as of the date they were made. The company does not undertake any obligation to update or publicly release any revisions to forward-looking statements to reflect events, circumstances or changes in expectations after the date of this press release.
WEBCAST INFORMATION: General Dynamics will webcast its second-quarter 2018 financial results conference call at 9 a.m. EDT on Wednesday, July 25, 2018. The webcast will be a listen-only audio event, available at www.generaldynamics.com. An on-demand replay of the webcast will be available by 12 p.m. on July 25 and will continue for 12 months. To hear a recording of the conference call by telephone, please call 877-344-7529 (international: 412-317-0088); passcode 10121441. The phone replay will be available from July 25 through August 1, 2018.
– more –
EXHIBIT A
CONSOLIDATED STATEMENT OF EARNINGS - (UNAUDITED)
DOLLARS IN MILLIONS, EXCEPT PER SHARE AMOUNTS
Three Months Ended | Variance | |||||||||||||
July 1, 2018 (a) | July 2, 2017 (b) | $ | % | |||||||||||
Revenue | $ | 9,186 | $ | 7,675 | $ | 1,511 | 19.7 | % | ||||||
Operating costs and expenses | (8,098 | ) | (6,608 | ) | (1,490 | ) | ||||||||
Operating earnings | 1,088 | 1,067 | 21 | 2.0 | % | |||||||||
Interest, net | (103 | ) | (24 | ) | (79 | ) | ||||||||
Other, net | (15 | ) | (11 | ) | (4 | ) | ||||||||
Earnings before income tax | 970 | 1,032 | (62 | ) | (6.0 | )% | ||||||||
Provision for income tax, net | (184 | ) | (283 | ) | 99 | |||||||||
Net earnings | $ | 786 | $ | 749 | $ | 37 | 4.9 | % | ||||||
Earnings per share—basic | $ | 2.65 | $ | 2.50 | $ | 0.15 | 6.0 | % | ||||||
Basic weighted average shares outstanding | 296.2 | 299.8 | ||||||||||||
Earnings per share—diluted | $ | 2.62 | $ | 2.45 | $ | 0.17 | 6.9 | % | ||||||
Diluted weighted average shares outstanding | 300.1 | 305.3 | ||||||||||||
(a) | 2018 results include the unfavorable impact of one-time charges of approximately $70 associated with costs to complete the acquisition of CSRA Inc. In the table above, approximately $45 of compensation-related costs was reported in operating costs and expenses, and approximately $25 of transaction costs was reported in other, net. |
(b) | Prior-period information has been restated for the adoption of Accounting Standards Update (ASU) 2017-07, Compensation - Retirement Benefits (Topic 715): Improving the Presentation of Net Periodic Pension Cost and Net Periodic Postretirement Benefit Cost, which we adopted on January 1, 2018. |
– more –
EXHIBIT B
CONSOLIDATED STATEMENT OF EARNINGS - (UNAUDITED)
DOLLARS IN MILLIONS, EXCEPT PER SHARE AMOUNTS
Six Months Ended | Variance | |||||||||||||
July 1, 2018 (a) | July 2, 2017 (b) | $ | % | |||||||||||
Revenue | $ | 16,721 | $ | 15,116 | $ | 1,605 | 10.6 | % | ||||||
Operating costs and expenses | (14,625 | ) | (13,003 | ) | (1,622 | ) | ||||||||
Operating earnings | 2,096 | 2,113 | (17 | ) | (0.8 | )% | ||||||||
Interest, net | (130 | ) | (49 | ) | (81 | ) | ||||||||
Other, net | (36 | ) | (22 | ) | (14 | ) | ||||||||
Earnings before income tax | 1,930 | 2,042 | (112 | ) | (5.5 | )% | ||||||||
Provision for income tax, net | (345 | ) | (530 | ) | 185 | |||||||||
Net earnings | $ | 1,585 | $ | 1,512 | $ | 73 | 4.8 | % | ||||||
Earnings per share—basic | $ | 5.35 | $ | 5.03 | $ | 0.32 | 6.4 | % | ||||||
Basic weighted average shares outstanding | 296.3 | 300.8 | ||||||||||||
Earnings per share—diluted | $ | 5.27 | $ | 4.94 | $ | 0.33 | 6.7 | % | ||||||
Diluted weighted average shares outstanding | 300.6 | 306.3 | ||||||||||||
(a) | 2018 results include the unfavorable impact of one-time charges of approximately $75 associated with costs to complete the acquisition of CSRA Inc. In the table above, approximately $45 of compensation-related costs was reported in operating costs and expenses, and approximately $30 of transaction costs was reported in other, net. |
(b) | Prior-period information has been restated for the adoption of ASU 2017-07, which we adopted on January 1, 2018. |
– more –
EXHIBIT C
REVENUE AND OPERATING EARNINGS BY SEGMENT - (UNAUDITED)
DOLLARS IN MILLIONS
Three Months Ended | Variance | |||||||||||||
July 1, 2018 (a) | July 2, 2017 (b) | $ | % | |||||||||||
Revenue: | ||||||||||||||
Aerospace | $ | 1,895 | $ | 2,078 | $ | (183 | ) | (8.8 | )% | |||||
Combat Systems | 1,534 | 1,414 | 120 | 8.5 | % | |||||||||
Information Technology | 2,442 | 1,052 | 1,390 | 132.1 | % | |||||||||
Mission Systems | 1,147 | 1,052 | 95 | 9.0 | % | |||||||||
Marine Systems | 2,168 | 2,079 | 89 | 4.3 | % | |||||||||
Total | $ | 9,186 | $ | 7,675 | $ | 1,511 | 19.7 | % | ||||||
Operating earnings: | ||||||||||||||
Aerospace | $ | 386 | $ | 421 | $ | (35 | ) | (8.3 | )% | |||||
Combat Systems | 236 | 225 | 11 | 4.9 | % | |||||||||
Information Technology | 156 | 87 | 69 | 79.3 | % | |||||||||
Mission Systems | 153 | 153 | — | — | % | |||||||||
Marine Systems | 195 | 178 | 17 | 9.6 | % | |||||||||
Corporate | (38 | ) | 3 | (41 | ) | (1,366.7 | )% | |||||||
Total | $ | 1,088 | $ | 1,067 | $ | 21 | 2.0 | % | ||||||
Operating margin: | ||||||||||||||
Aerospace | 20.4 | % | 20.3 | % | ||||||||||
Combat Systems | 15.4 | % | 15.9 | % | ||||||||||
Information Technology | 6.4 | % | 8.3 | % | ||||||||||
Mission Systems | 13.3 | % | 14.5 | % | ||||||||||
Marine Systems | 9.0 | % | 8.6 | % | ||||||||||
Total | 11.8 | % | 13.9 | % | ||||||||||
(a) | 2018 results include the unfavorable impact of approximately $45 of compensation-related one-time charges associated with costs to complete the acquisition of CSRA Inc. This amount was reported as a reduction of Corporate operating earnings in the table above. |
(b) | Prior-period information has been restated for the adoption of ASU 2017-07, which we adopted on January 1, 2018. |
– more –
EXHIBIT D
REVENUE AND OPERATING EARNINGS BY SEGMENT - (UNAUDITED)
DOLLARS IN MILLIONS
Six Months Ended | Variance | |||||||||||||
July 1, 2018 (a) | July 2, 2017 (b) | $ | % | |||||||||||
Revenue: | ||||||||||||||
Aerospace | $ | 3,720 | $ | 4,152 | $ | (432 | ) | (10.4 | )% | |||||
Combat Systems | 2,974 | 2,701 | 273 | 10.1 | % | |||||||||
Information Technology | 3,580 | 2,110 | 1,470 | 69.7 | % | |||||||||
Mission Systems | 2,245 | 2,140 | 105 | 4.9 | % | |||||||||
Marine Systems | 4,202 | 4,013 | 189 | 4.7 | % | |||||||||
Total | $ | 16,721 | $ | 15,116 | $ | 1,605 | 10.6 | % | ||||||
Operating earnings: | ||||||||||||||
Aerospace | $ | 732 | $ | 860 | $ | (128 | ) | (14.9 | )% | |||||
Combat Systems | 460 | 430 | 30 | 7.0 | % | |||||||||
Information Technology | 257 | 177 | 80 | 45.2 | % | |||||||||
Mission Systems | 299 | 299 | — | — | % | |||||||||
Marine Systems | 379 | 339 | 40 | 11.8 | % | |||||||||
Corporate | (31 | ) | 8 | (39 | ) | (487.5 | )% | |||||||
Total | $ | 2,096 | $ | 2,113 | $ | (17 | ) | (0.8 | )% | |||||
Operating margin: | ||||||||||||||
Aerospace | 19.7 | % | 20.7 | % | ||||||||||
Combat Systems | 15.5 | % | 15.9 | % | ||||||||||
Information Technology | 7.2 | % | 8.4 | % | ||||||||||
Mission Systems | 13.3 | % | 14.0 | % | ||||||||||
Marine Systems | 9.0 | % | 8.4 | % | ||||||||||
Total | 12.5 | % | 14.0 | % | ||||||||||
(a) | 2018 results include the unfavorable impact of approximately $45 of compensation-related one-time charges associated with costs to complete the acquisition of CSRA Inc. This amount was reported as a reduction of Corporate operating earnings in the table above. |
(b) | Prior-period information has been restated for the adoption of ASU 2017-07, which we adopted on January 1, 2018. |
– more –
EXHIBIT E
CONSOLIDATED BALANCE SHEET
DOLLARS IN MILLIONS
(Unaudited) | |||||||
July 1, 2018 | December 31, 2017 | ||||||
ASSETS | |||||||
Current assets: | |||||||
Cash and equivalents | $ | 1,862 | $ | 2,983 | |||
Accounts receivable | 3,874 | 3,617 | |||||
Unbilled receivables | 7,125 | 5,240 | |||||
Inventories | 5,890 | 5,303 | |||||
Other current assets | 1,076 | 1,185 | |||||
Total current assets | 19,827 | 18,328 | |||||
Noncurrent assets: | |||||||
Property, plant and equipment, net | 4,179 | 3,517 | |||||
Intangible assets, net | 2,738 | 702 | |||||
Goodwill | 19,738 | 11,914 | |||||
Other assets | 670 | 585 | |||||
Total noncurrent assets | 27,325 | 16,718 | |||||
Total assets | $ | 47,152 | $ | 35,046 | |||
LIABILITIES AND SHAREHOLDERS’ EQUITY | |||||||
Current liabilities: | |||||||
Short-term debt and current portion of long-term debt | $ | 2,881 | $ | 2 | |||
Accounts payable | 3,032 | 3,207 | |||||
Customer advances and deposits | 7,219 | 6,992 | |||||
Other current liabilities | 3,441 | 2,898 | |||||
Total current liabilities | 16,573 | 13,099 | |||||
Noncurrent liabilities: | |||||||
Long-term debt | 11,397 | 3,980 | |||||
Other liabilities | 7,188 | 6,532 | |||||
Total noncurrent liabilities | 18,585 | 10,512 | |||||
Shareholders’ equity: | |||||||
Common stock | 482 | 482 | |||||
Surplus | 2,865 | 2,872 | |||||
Retained earnings | 28,115 | 26,444 | |||||
Treasury stock | (15,910 | ) | (15,543 | ) | |||
Accumulated other comprehensive loss | (3,558 | ) | (2,820 | ) | |||
Total shareholders’ equity | 11,994 | 11,435 | |||||
Total liabilities and shareholders’ equity | $ | 47,152 | $ | 35,046 | |||
– more –
EXHIBIT F
CONSOLIDATED STATEMENT OF CASH FLOWS - (UNAUDITED)
DOLLARS IN MILLIONS
Six Months Ended | |||||||
July 1, 2018 | July 2, 2017 | ||||||
Cash flows from operating activities—continuing operations: | |||||||
Net earnings | $ | 1,585 | $ | 1,512 | |||
Adjustments to reconcile net earnings to net cash provided by operating activities: | |||||||
Depreciation of property, plant and equipment | 223 | 182 | |||||
Amortization of intangible assets | 104 | 38 | |||||
Equity-based compensation expense | 71 | 52 | |||||
Deferred income tax provision | (6 | ) | 93 | ||||
(Increase) decrease in assets, net of effects of business acquisitions: | |||||||
Accounts receivable | 344 | (291 | ) | ||||
Unbilled receivables | (1,030 | ) | (815 | ) | |||
Inventories | (542 | ) | (14 | ) | |||
Increase (decrease) in liabilities, net of effects of business acquisitions: | |||||||
Accounts payable | (324 | ) | 82 | ||||
Customer advances and deposits | (159 | ) | (29 | ) | |||
Other, net | 25 | 200 | |||||
Net cash provided by operating activities | 291 | 1,010 | |||||
Cash flows from investing activities: | |||||||
Business acquisitions, net of cash acquired | (10,039 | ) | (89 | ) | |||
Capital expenditures | (279 | ) | (153 | ) | |||
Other, net | 74 | 47 | |||||
Net cash used by investing activities | (10,244 | ) | (195 | ) | |||
Cash flows from financing activities: | |||||||
Proceeds from fixed-rate notes | 6,461 | — | |||||
Proceeds from commercial paper, net | 2,786 | (1 | ) | ||||
Proceeds from floating-rate notes | 1,000 | — | |||||
Dividends paid | (526 | ) | (483 | ) | |||
Repayment of CSRA accounts receivable purchase agreement | (450 | ) | — | ||||
Purchases of common stock | (436 | ) | (901 | ) | |||
Other, net | 3 | 109 | |||||
Net cash provided (used) by financing activities | 8,838 | (1,276 | ) | ||||
Net cash used by discontinued operations | (6 | ) | (17 | ) | |||
Net decrease in cash and equivalents | (1,121 | ) | (478 | ) | |||
Cash and equivalents at beginning of period | 2,983 | 2,334 | |||||
Cash and equivalents at end of period | $ | 1,862 | $ | 1,856 | |||
– more –
EXHIBIT G
PRELIMINARY FINANCIAL INFORMATION - (UNAUDITED)
DOLLARS IN MILLIONS, EXCEPT PER SHARE AMOUNTS
2018 | 2017 | |||||||||||||||
Second Quarter | Second Quarter | |||||||||||||||
Other Financial Information: | ||||||||||||||||
Debt-to-equity (a) | 119.0 | % | 36.3 | % | ||||||||||||
Debt-to-capital (b) | 54.3 | % | 26.6 | % | ||||||||||||
Book value per share (c) | $ | 40.48 | $ | 36.57 | ||||||||||||
Income tax payments, net | $ | 159 | $ | 332 | ||||||||||||
Company-sponsored research and development (d) | $ | 90 | $ | 134 | ||||||||||||
Shares outstanding | 296,281,432 | 299,461,802 | ||||||||||||||
Non-GAAP Financial Measure: | ||||||||||||||||
2018 | 2017 | |||||||||||||||
Second Quarter | Six Months | Second Quarter | Six Months | |||||||||||||
Free cash flow from operations: | ||||||||||||||||
Net cash provided by operating activities | $ | 787 | $ | 291 | $ | 477 | $ | 1,010 | ||||||||
Capital expenditures | (175 | ) | (279 | ) | (91 | ) | (153 | ) | ||||||||
Free cash flow from operations (e) | $ | 612 | $ | 12 | $ | 386 | $ | 857 | ||||||||
(a) | Debt-to-equity ratio is calculated as total debt divided by total equity as of the end of the period. |
(b) | Debt-to-capital ratio is calculated as total debt divided by the sum of total debt plus total equity as of the end of the period. |
(c) | Book value per share is calculated as total equity divided by total outstanding shares as of the end of the period. |
(d) | Includes independent research and development and Aerospace product-development costs. |
(e) | We believe free cash flow from operations is a useful measure for investors because it portrays our ability to generate cash from our businesses for purposes such as repaying maturing debt, funding business acquisitions, repurchasing our common stock and paying dividends. We use free cash flow from operations to assess the quality of our earnings and as a key performance measure in evaluating management. The most directly comparable GAAP measure to free cash flow from operations is net cash provided by operating activities. |
– more –
EXHIBIT H
BACKLOG - (UNAUDITED)
DOLLARS IN MILLIONS
Funded | Unfunded | Total Backlog | Estimated Potential Contract Value* | Total Potential Contract Value | ||||||||||||||||
Second Quarter 2018: | ||||||||||||||||||||
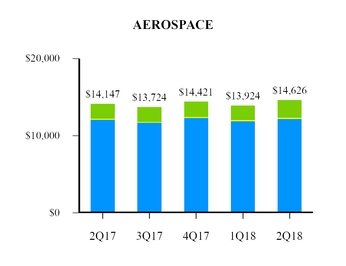
Aerospace | $ | 12,187 | $ | 157 | $ | 12,344 | $ | 2,282 | $ | 14,626 | ||||||||||
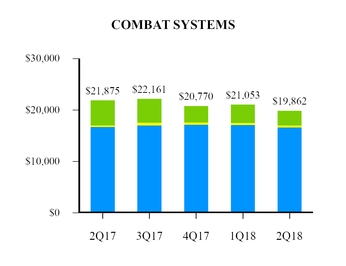
Combat Systems | 16,646 | 376 | 17,022 | 2,840 | 19,862 | |||||||||||||||
Information Technology | 4,633 | 4,576 | 9,209 | 18,931 | 28,140 | |||||||||||||||
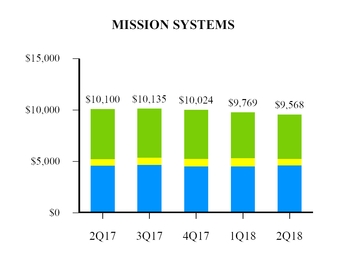
Mission Systems | 4,636 | 645 | 5,281 | 4,287 | 9,568 | |||||||||||||||
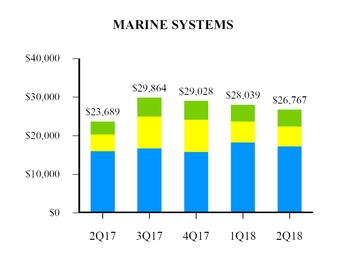
Marine Systems | 17,310 | 5,124 | 22,434 | 4,333 | 26,767 | |||||||||||||||
Total | $ | 55,412 | $ | 10,878 | $ | 66,290 | $ | 32,673 | $ | 98,963 | ||||||||||
First Quarter 2018: | ||||||||||||||||||||
Aerospace | $ | 11,898 | $ | 158 | $ | 12,056 | $ | 1,868 | $ | 13,924 | ||||||||||
Combat Systems | 17,126 | 378 | 17,504 | 3,549 | 21,053 | |||||||||||||||
Information Technology | 2,190 | 1,275 | 3,465 | 11,367 | 14,832 | |||||||||||||||
Mission Systems | 4,549 | 800 | 5,349 | 4,420 | 9,769 | |||||||||||||||
Marine Systems | 18,310 | 5,458 | 23,768 | 4,271 | 28,039 | |||||||||||||||
Total | $ | 54,073 | $ | 8,069 | $ | 62,142 | $ | 25,475 | $ | 87,617 | ||||||||||
Second Quarter 2017: | ||||||||||||||||||||
Aerospace | $ | 12,116 | $ | 120 | $ | 12,236 | $ | 1,911 | $ | 14,147 | ||||||||||
Combat Systems | 16,749 | 281 | 17,030 | 4,845 | 21,875 | |||||||||||||||
Information Technology | 2,200 | 1,442 | 3,642 | 9,541 | 13,183 | |||||||||||||||
Mission Systems | 4,609 | 643 | 5,252 | 4,848 | 10,100 | |||||||||||||||
Marine Systems | 16,033 | 4,374 | 20,407 | 3,282 | 23,689 | |||||||||||||||
Total | $ | 51,707 | $ | 6,860 | $ | 58,567 | $ | 24,427 | $ | 82,994 | ||||||||||
* The estimated potential contract value includes work awarded on unfunded indefinite delivery, indefinite quantity (IDIQ) contracts and unexercised options associated with existing firm contracts, including options to purchase new aircraft and long-term aircraft services agreements. We recognize options in backlog when the customer exercises the option and establishes a firm order. For IDIQ contracts, we evaluate the amount of funding we expect to receive and include this amount in our estimated potential contract value. The actual amount of funding received in the future may be higher or lower than our estimate of potential contract value.
– more –
EXHIBIT H-1
BACKLOG AND ESTIMATED CONTRACT VALUE - (UNAUDITED)
DOLLARS IN MILLIONS
– more –
EXHIBIT H-2
BACKLOG AND ESTIMATED CONTRACT VALUE BY SEGMENT - (UNAUDITED)
DOLLARS IN MILLIONS
Funded Backlog | Unfunded Backlog | Estimated Potential Contract Value | ||||||||||
– more –
EXHIBIT I
SECOND QUARTER 2018 SIGNIFICANT ORDERS - (UNAUDITED)
DOLLARS IN MILLIONS
We received the following significant contract awards during the second quarter of 2018:
Combat Systems:
• | $440 from the U.S. Army to upgrade Abrams tanks to the M1A2 System Enhancement Package Version 3 configuration. |
• | $260 from the Army to upgrade Stryker flat-bottom vehicles to the Stryker A1 configuration. |
• | $150 from the Army for the production of Hydra-70 rockets. |
• | $35 for the production of Army Ground Mobility Vehicles (AGMVs) and associated kits. |
• | $25 from the Army for munitions demilitarization. |
Information Technology:
• | $615 from the Centers for Medicare & Medicaid Services for contact-center services. |
• | $375 from the New York State Department of Health to provide engineering and technical improvements to the state’s health benefits exchange. |
• | $125 from the U.S. Department of State to provide supply chain management services. |
• | $85 to provide IT hardware, software, and network and communications support services to the U.S. European Command (USEUCOM) and U.S. Africa Command (USAFRICOM). |
• | $45 to provide support for live and virtual operations under the Warfighter Field Operations Customer Support (FOCUS) program. |
Mission Systems:
• | $85 from the U.S. Army for computing and communications equipment under the Common Hardware Systems-4 program. |
• | $60 to provide program management and engineering, technical, and logistics support for the Army’s mobile communications network. |
• | $45 to support the engineering and manufacturing of the Navy’s Air and Missile Defense Radar (AMDR) program. |
• | $40 from the U.S. Coast Guard to provide system sustainment support for the Rescue 21 program. |
• | $30 from the U.S. Air Force for the Battlefield Information Collection and Exploitation System (BICES) program to provide information sharing support to coalition operations. |
Marine Systems:
• | $225 from the U.S. Navy for long-lead materials for Block V Virginia-class submarines. |
• | $125 from the Navy to support the Common Missile Compartment work under joint development for the U.S. Navy and the U.K. Royal Navy. |
• | $100 from the Navy for Advanced Nuclear Plant Studies in support of the Columbia-class submarine program. |
• | $55 from the Navy to provide ongoing lead yard services for the DDG-51 destroyer program. The contract has a potential value of approximately $305. |
• | $40 from the Navy for planning yard services for the DDG-51 destroyer and FFG-7 frigate programs. |
• | $40 from the Navy to provide maintenance for submarines at Naval Submarine Base New London in Connecticut. |
– more –
EXHIBIT J
AEROSPACE SUPPLEMENTAL DATA - (UNAUDITED)
Second Quarter | Six Months | |||||||||||
2018 | 2017 | 2018 | 2017 | |||||||||
Gulfstream Aircraft Deliveries (units): | ||||||||||||
Large-cabin aircraft | 18 | 23 | 37 | 46 | ||||||||
Mid-cabin aircraft | 8 | 7 | 15 | 14 | ||||||||
Total | 26 | 30 | 52 | 60 | ||||||||
Pre-owned Aircraft Deliveries (units): | 1 | 2 | 2 | 3 | ||||||||
– more –
EXHIBIT K
INFORMATION TECHNOLOGY AND MISSION SYSTEMS HISTORICAL DATA - (UNAUDITED)
DOLLARS IN MILLIONS
2016 | 2017 | 2018 | |||||||||||||||||||||||||
Full Year | 1Q | 2Q | 3Q | 4Q | Full Year | 1Q | |||||||||||||||||||||
Revenue: | |||||||||||||||||||||||||||
Information Technology | $ | 4,428 | $ | 1,058 | $ | 1,052 | $ | 1,068 | $ | 1,232 | $ | 4,410 | $ | 1,138 | |||||||||||||
Mission Systems | 4,716 | 1,088 | 1,052 | 1,086 | 1,255 | 4,481 | 1,098 | ||||||||||||||||||||
Operating earnings: | |||||||||||||||||||||||||||
Information Technology | $ | 340 | $ | 90 | $ | 87 | $ | 101 | $ | 95 | $ | 373 | $ | 101 | |||||||||||||
Mission Systems | 601 | 146 | 153 | 152 | 187 | 638 | 146 | ||||||||||||||||||||
Operating margin: | |||||||||||||||||||||||||||
Information Technology | 7.7 | % | 8.5 | % | 8.3 | % | 9.5 | % | 7.7 | % | 8.5 | % | 8.9 | % | |||||||||||||
Mission Systems | 12.7 | % | 13.4 | % | 14.5 | % | 14.0 | % | 14.9 | % | 14.2 | % | 13.3 | % | |||||||||||||
# # #