Attached files
| file | filename |
|---|---|
| EX-99.1 - EX-99.1 - VALMONT INDUSTRIES INC | a18-17585_1ex99d1.htm |
| 8-K - 8-K - VALMONT INDUSTRIES INC | a18-17585_18k.htm |
Forward-looking Statement Disclosure These slides contain (and the accompanying oral discussion will contain) “forward-looking statements” within the meaning of the Private Securities Litigation Reform Act of 1995. Such statements involve known and unknown risks, uncertainties and other factors that could cause the actual results of the Company to differ materially from the results expressed or implied by such statements, including general economic and business conditions, conditions affecting the industries served by the Company and its subsidiaries, conditions affecting the Company’s customers and suppliers, competitor responses to the Company’s products and services, the overall market acceptance of such products and services, the integration of acquisitions and other factors disclosed in the Company’s periodic reports filed with the Securities and Exchange Commission. Consequently such forward-looking statements should be regarded as the Company’s current plans, estimates and beliefs. The Company does not undertake and specifically declines any obligation to publicly release the results of any revisions to these forward-looking statements that may be made to reflect any future events or circumstances after the date of such statements or to reflect the occurrence of anticipated or unanticipated events. 2 July 24, 2018 Valmont Industries, Inc. Q2 2018 Earnings Presentation
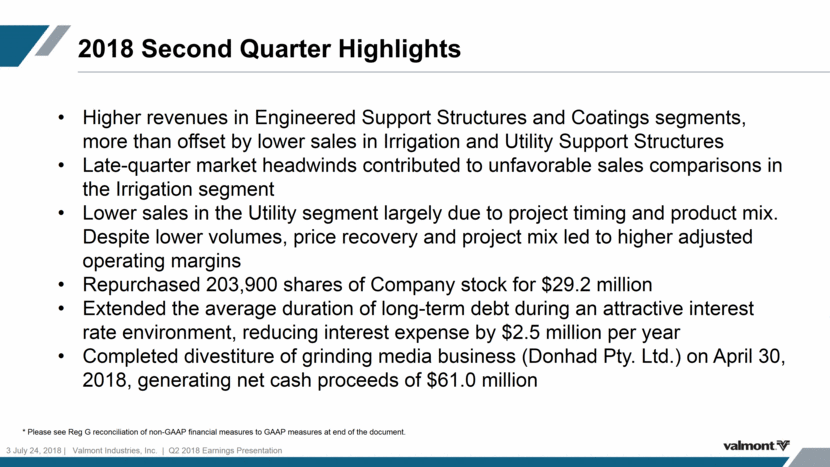
2018 Second Quarter Highlights Higher revenues in Engineered Support Structures and Coatings segments, more than offset by lower sales in Irrigation and Utility Support Structures Late-quarter market headwinds contributed to unfavorable sales comparisons in the Irrigation segment Lower sales in the Utility segment largely due to project timing and product mix. Despite lower volumes, price recovery and project mix led to higher adjusted operating margins Repurchased 203,900 shares of Company stock for $29.2 million Extended the average duration of long-term debt during an attractive interest rate environment, reducing interest expense by $2.5 million per year Completed divestiture of grinding media business (Donhad Pty. Ltd.) on April 30, 2018, generating net cash proceeds of $61.0 million 3 July 24, 2018 Valmont Industries, Inc. Q2 2018 Earnings Presentation * Please see Reg G reconciliation of non-GAAP financial measures to GAAP measures at end of the document.
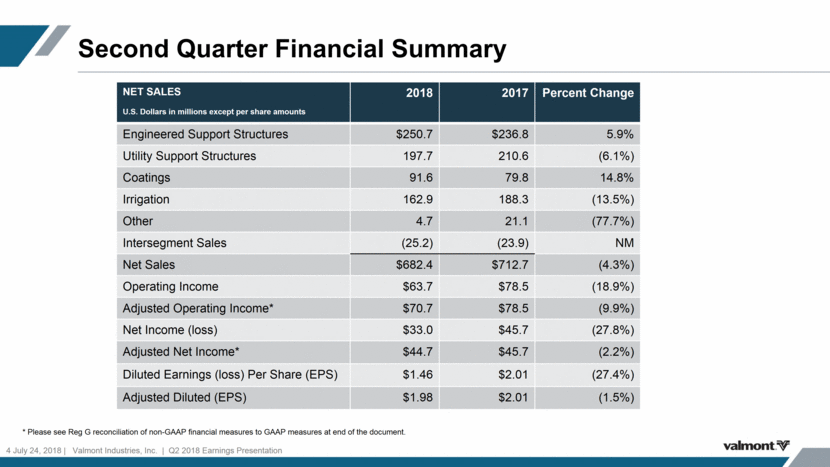
Second Quarter Financial Summary 4 July 24, 2018 Valmont Industries, Inc. Q2 2018 Earnings Presentation NET SALES U.S. Dollars in millions except per share amounts 2018 2017 Percent Change Engineered Support Structures $250.7 $236.8 5.9% Utility Support Structures 197.7 210.6 (6.1%) Coatings 91.6 79.8 14.8% Irrigation 162.9 188.3 (13.5%) Other 4.7 21.1 (77.7%) Intersegment Sales (25.2) (23.9) NM Net Sales $682.4 $712.7 (4.3%) Operating Income $63.7 $78.5 (18.9%) Adjusted Operating Income* $70.7 $78.5 (9.9%) Net Income (loss) $33.0 $45.7 (27.8%) Adjusted Net Income* $44.7 $45.7 (2.2%) Diluted Earnings (loss) Per Share (EPS) $1.46 $2.01 (27.4%) Adjusted Diluted (EPS) $1.98 $2.01 (1.5%) * Please see Reg G reconciliation of non-GAAP financial measures to GAAP measures at end of the document.
YTD Financial Summary 5 July 24, 2018 Valmont Industries, Inc. Q2 2018 Earnings Presentation NET SALES U.S. Dollars in millions except per share amounts 2018 2017 Percent Change Engineered Support Structures $475.7 $441.8 7.7% Utility Support Structures 407.6 410.9 (0.8%) Coatings 176.5 153.2 15.2% Irrigation 350.9 355.5 (1.3%) Other 23.1 40.7 (43.2%) Intersegment Sales (52.7) (51.9) NM Net Sales $1,381.1 $1,350.2 2.3% Operating Income $127.6 $143.1 (10.8%) Adjusted Operating Income* $139.0 $143.1 (2.9%) Net Income (loss) $72.2 $84.6 (14.7%) Adjusted Net Income* $87.3 $84.6 3.2% Diluted Earnings (loss) Per Share (EPS) $3.18 $3.73 (14.7%) Adjusted Diluted (EPS) $3.84 $3.73 2.9% * Please see Reg G reconciliation of non-GAAP financial measures to GAAP measures at end of the document.
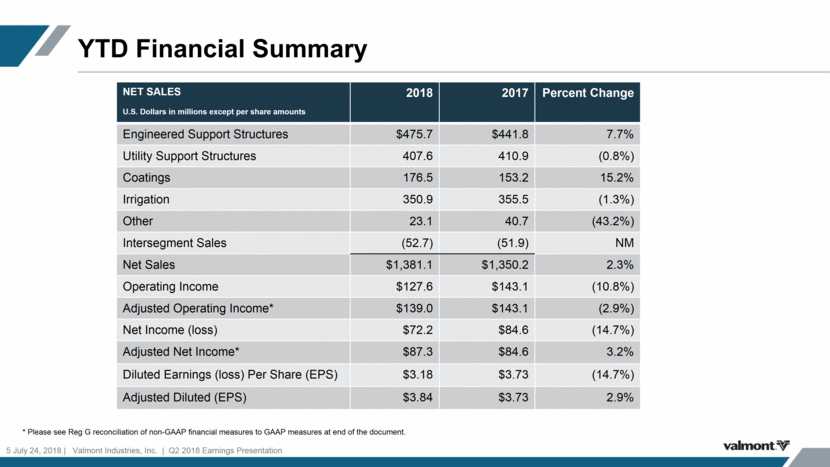
Second Quarter Highlights – Operating Income GAAP 6 July 24, 2018 Valmont Industries, Inc. Q2 2018 Earnings Presentation U.S. Dollars in millions Operating Income 2Q 2018 Operating Income 2Q 2017 Increase (Decrease) Operating Income % 2Q 2018 Operating Income % 2Q 2017 Engineered Support Structures $13.0 $20.3 (36.0%) 5.2% 8.6% Utility Support Structures 20.8 22.4 (7.1%) 10.5% 10.6% Coatings 14.9 12.1 23.1% 16.2% 15.2% Irrigation 27.7 34.7 (20.2%) 17.0% 18.4% Other (0.3) 1.8 (116.7%) (6.4%) 8.5% LIFO adjustment (1.7) (0.4) NM Corporate (10.7) (12.4) 13.7% Consolidated Operating Income $63.7 $78.5 (18.9%) 9.3% 11.0% * Please see Reg G reconciliation of non-GAAP financial measures to GAAP measures at end of the document.
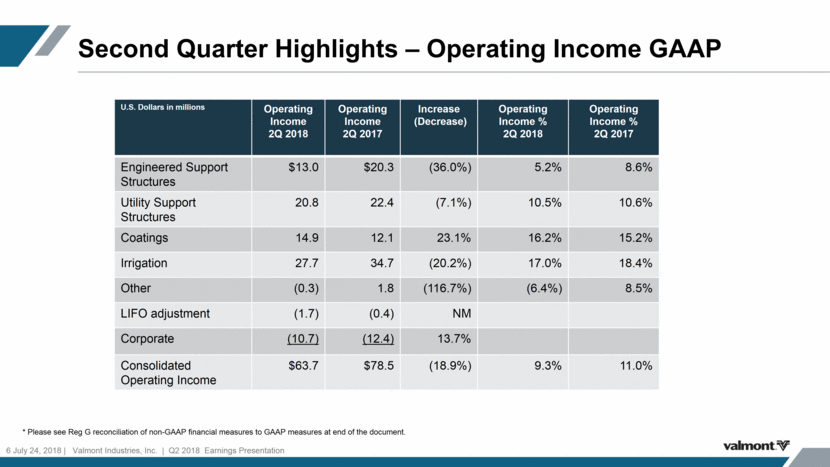
Second Quarter Highlights – Operating Income Adjusted 7 July 24, 2018 Valmont Industries, Inc. Q2 2018 Earnings Presentation U.S. Dollars in millions Adjusted Operating Income 2Q 2018* Operating Income 2Q 2017 (no-adjustments) Increase (Decrease) Operating Income % 2Q 2018 Operating Income % 2Q 2017 Engineered Support Structures $18.4 $20.3 (9.4%) 7.3% 8.6% Utility Support Structures 22.3 22.4 (0.4%) 11.3% 10.6% Coatings 14.9 12.1 23.1% 16.2% 15.2% Irrigation 27.7 34.7 (20.2%) 17.0% 18.4% Other (0.3) 1.8 (116.7%) (6.4%) 8.5% LIFO adjustment (1.7) (0.4) NM Corporate (10.6) (12.4) 14.5% Consolidated Operating Income $70.7 $78.5 (9.9%) 9.8% 11.0% * Please see Reg G reconciliation of non-GAAP financial measures to GAAP measures at end of the document.
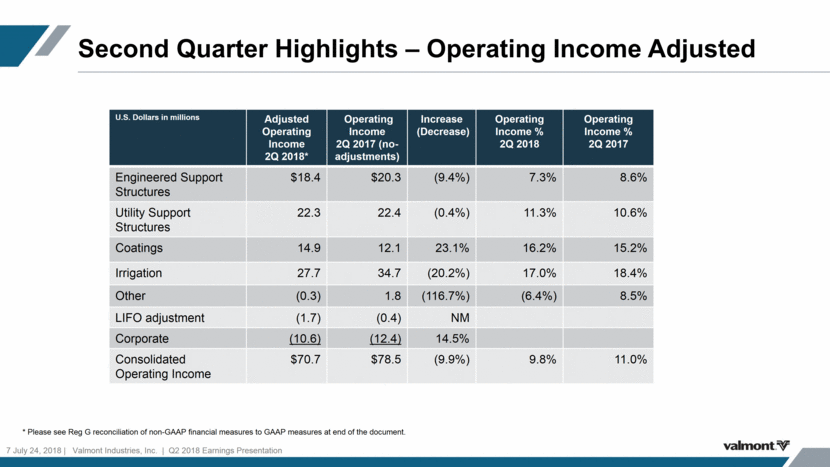
Engineered Support Structures Segment 8 July 24, 2018 Valmont Industries, Inc. Q2 2018 Earnings Presentation 2017 Revenue1 $231.3 Volume 0.2 Pricing/Mix 3.9 Acquisitions 4.9 Currency Translation 5.8 2018 Revenue1 $246.1 $ in millions Sales increased over 2017 levels, driven by favorable currency translation, price and organic growth Double-digit sales growth in N.A. lighting and traffic due to increased transportation market demand Increased funding for government infrastructure spending aided both lighting and traffic product sales in Europe, and highway safety product sales in Australia and India North American wireless sales growth offset by significantly decreased demand in China As expected, profitability was impacted by lower volumes due to price recovery actions in certain markets * Please see Reg G reconciliation of non-GAAP financial measures to GAAP measures at end of the document 1 Net sales after intersegment eliminations $13.0 $18.4 $20.3 $- $5 $10 $15 $20 $25 Operating Income 2018 2018 Adj 2017 $246.1 $231.3 $- $50 $100 $150 $200 $250 $300 Revenue 2018 2017
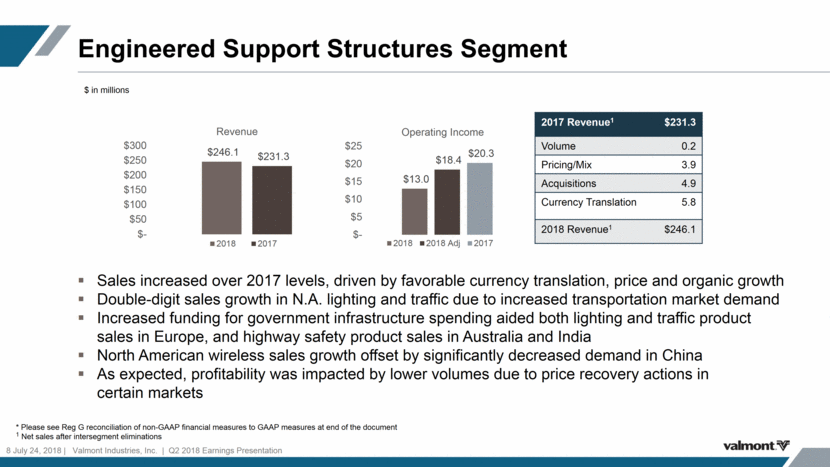
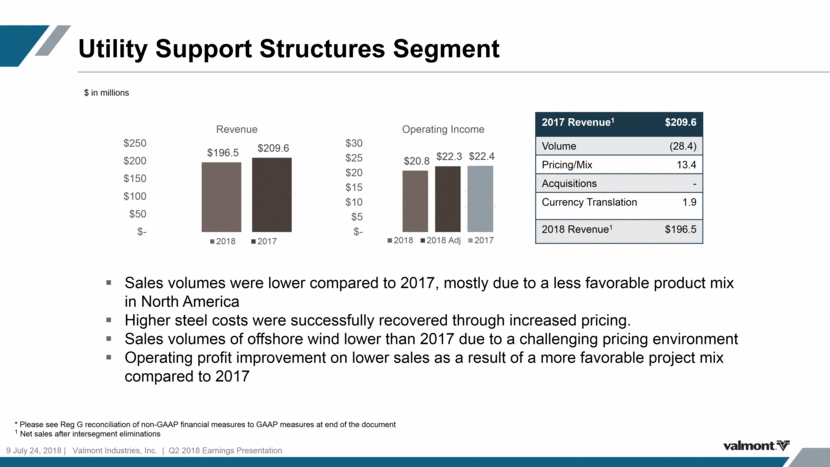
Utility Support Structures Segment 9 July 24, 2018 Valmont Industries, Inc. Q2 2018 Earnings Presentation 2017 Revenue1 $209.6 Volume (28.4) Pricing/Mix 13.4 Acquisitions - Currency Translation 1.9 2018 Revenue1 $196.5 $ in millions Sales volumes were lower compared to 2017, mostly due to a less favorable product mix in North America Higher steel costs were successfully recovered through increased pricing. Sales volumes of offshore wind lower than 2017 due to a challenging pricing environment Operating profit improvement on lower sales as a result of a more favorable project mix compared to 2017 * Please see Reg G reconciliation of non-GAAP financial measures to GAAP measures at end of the document 1 Net sales after intersegment eliminations $20.8 $22.3 $22.4 $- $5 $10 $15 $20 $25 $30 Operating Income 2018 2018 Adj 2017 $196.5 $209.6 $- $50 $100 $150 $200 $250 Revenue 2018 2017
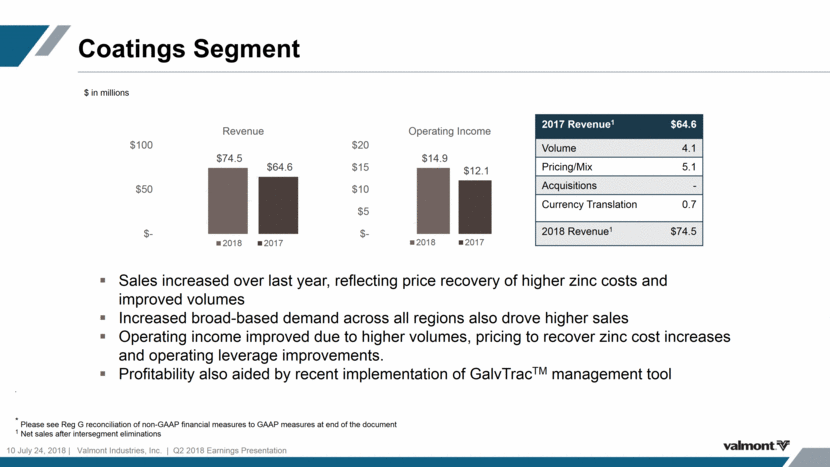
Coatings Segment 10 July 24, 2018 Valmont Industries, Inc. Q2 2018 Earnings Presentation 2017 Revenue1 $64.6 Volume 4.1 Pricing/Mix 5.1 Acquisitions - Currency Translation 0.7 2018 Revenue1 $74.5 $ in millions Sales increased over last year, reflecting price recovery of higher zinc costs and improved volumes Increased broad-based demand across all regions also drove higher sales Operating income improved due to higher volumes, pricing to recover zinc cost increases and operating leverage improvements. Profitability also aided by recent implementation of GalvTracTM management tool . * Please see Reg G reconciliation of non-GAAP financial measures to GAAP measures at end of the document 1 Net sales after intersegment eliminations $14.9 $12.1 $- $5 $10 $15 $20 Operating Income 2018 2017 $74.5 $64.6 $- $50 $100 Revenue 2018 2017
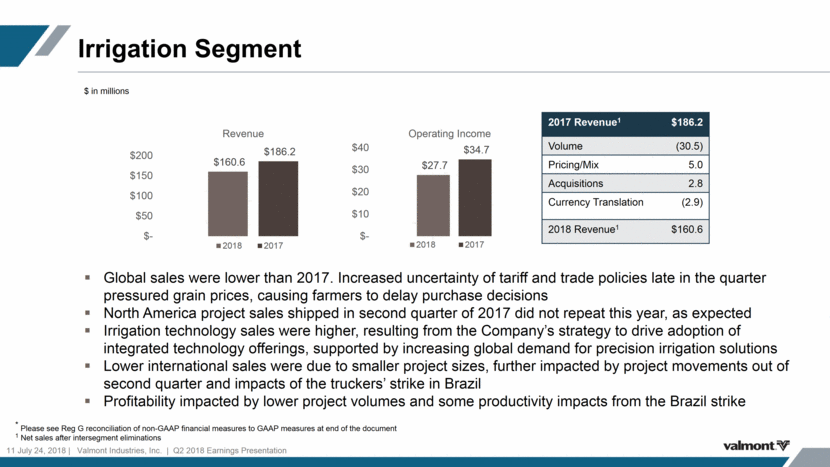
Irrigation Segment 11 July 24, 2018 Valmont Industries, Inc. Q2 2018 Earnings Presentation 2017 Revenue1 $186.2 Volume (30.5) Pricing/Mix 5.0 Acquisitions 2.8 Currency Translation (2.9) 2018 Revenue1 $160.6 $ in millions Global sales were lower than 2017. Increased uncertainty of tariff and trade policies late in the quarter pressured grain prices, causing farmers to delay purchase decisions North America project sales shipped in second quarter of 2017 did not repeat this year, as expected Irrigation technology sales were higher, resulting from the Company’s strategy to drive adoption of integrated technology offerings, supported by increasing global demand for precision irrigation solutions Lower international sales were due to smaller project sizes, further impacted by project movements out of second quarter and impacts of the truckers’ strike in Brazil Profitability impacted by lower project volumes and some productivity impacts from the Brazil strike * Please see Reg G reconciliation of non-GAAP financial measures to GAAP measures at end of the document 1 Net sales after intersegment eliminations $27.7 $34.7 $- $10 $20 $30 $40 Operating Income 2018 2017 $160.6 $186.2 $- $50 $100 $150 $200 Revenue 2018 2017
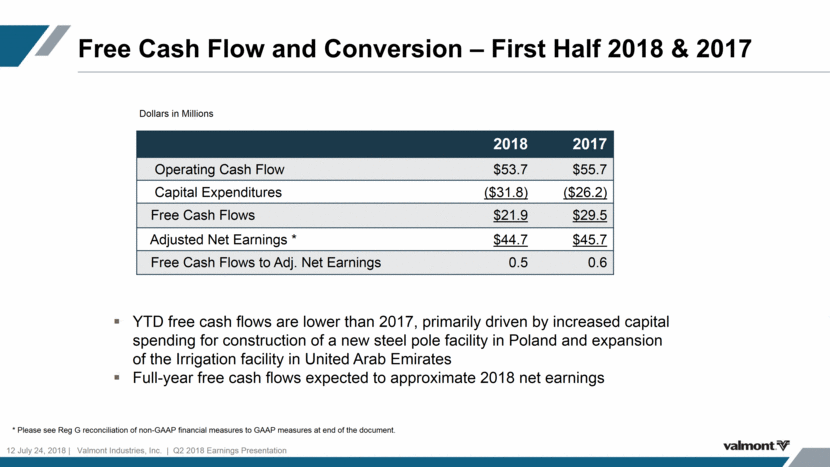
Free Cash Flow and Conversion – First Half 2018 & 2017 12 July 24, 2018 Valmont Industries, Inc. Q2 2018 Earnings Presentation 2018 2017 Operating Cash Flow $53.7 $55.7 Capital Expenditures ($31.8) ($26.2) Free Cash Flows $21.9 $29.5 Adjusted Net Earnings * $44.7 $45.7 Free Cash Flows to Adj. Net Earnings 0.5 0.6 * Please see Reg G reconciliation of non-GAAP financial measures to GAAP measures at end of the document. Dollars in Millions YTD free cash flows are lower than 2017, primarily driven by increased capital spending for construction of a new steel pole facility in Poland and expansion of the Irrigation facility in United Arab Emirates Full-year free cash flows expected to approximate 2018 net earnings
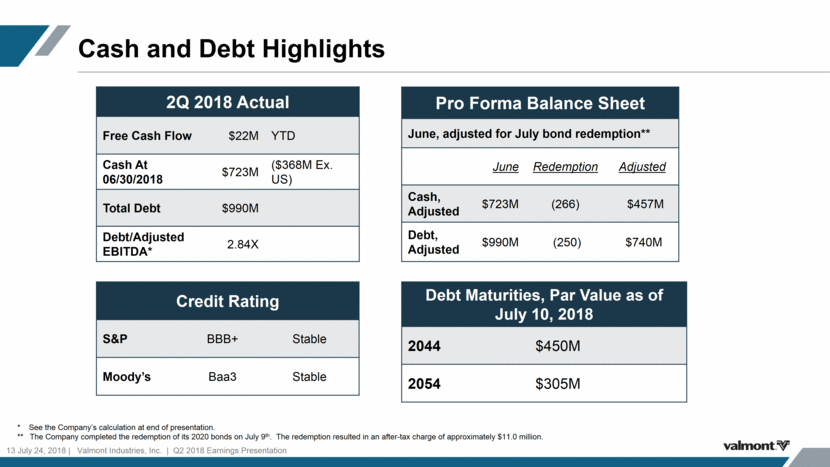
Cash and Debt Highlights 13 July 24, 2018 Valmont Industries, Inc. Q2 2018 Earnings Presentation 2Q 2018 Actual Free Cash Flow $22M YTD Cash At 06/30/2018 $723M ($368M Ex. US) Total Debt $990M Debt/Adjusted EBITDA* 2.84X Credit Rating S&P BBB+ Stable Moody’s Baa3 Stable * See the Company’s calculation at end of presentation. ** The Company completed the redemption of its 2020 bonds on July 9th. The redemption resulted in an after-tax charge of approximately $11.0 million. Debt Maturities, Par Value as of July 10, 2018 2044 $450M 2054 $305M Pro Forma Balance Sheet June, adjusted for July bond redemption** June Redemption Adjusted Cash, Adjusted $723M (266) $457M Debt, Adjusted $990M (250) $740M
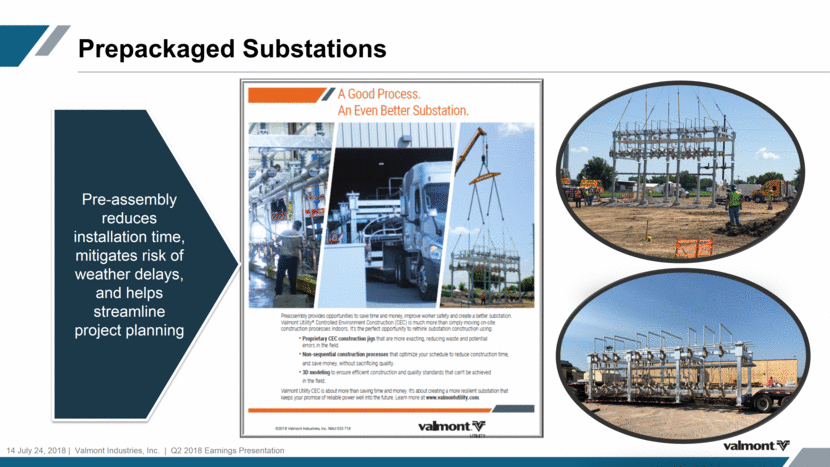
Prepackaged Substations 14 July 24, 2018 Valmont Industries, Inc. Q2 2018 Earnings Presentation Pre-assembly reduces installation time, mitigates risk of weather delays, and helps streamline project planning
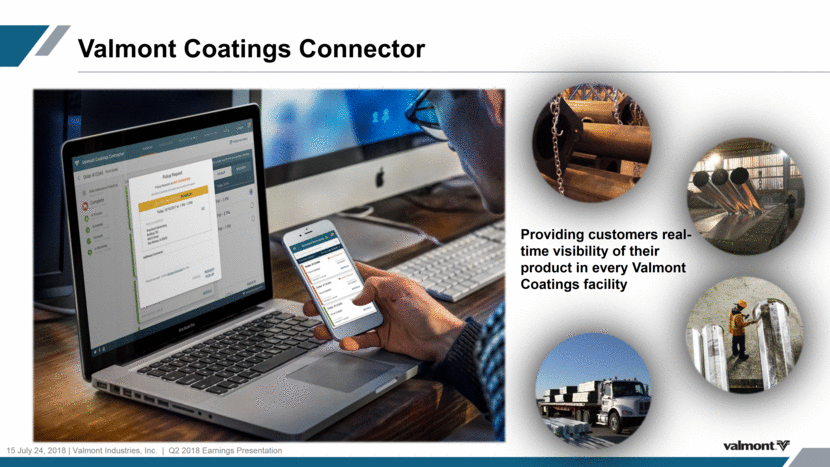
Valmont Coatings Connector 15 July 24, 2018 Valmont Industries, Inc. Q2 2018 Earnings Presentation Providing customers real-time visibility of their product in every Valmont Coatings facility
ApPENDIX 16 July 24, 2018 Valmont Industries, Inc. Q2 2018 Earnings Presentation
U.S. 2018 YTD Commodity Prices (USD) Significant Price Declines in May and June, with slight rebound in July 17 July 24, 2018 Valmont Industries, Inc. Q2 2018 Earnings Presentation Source: Macrotrends.net and USDA Corn Cotton Soybeans Wheat
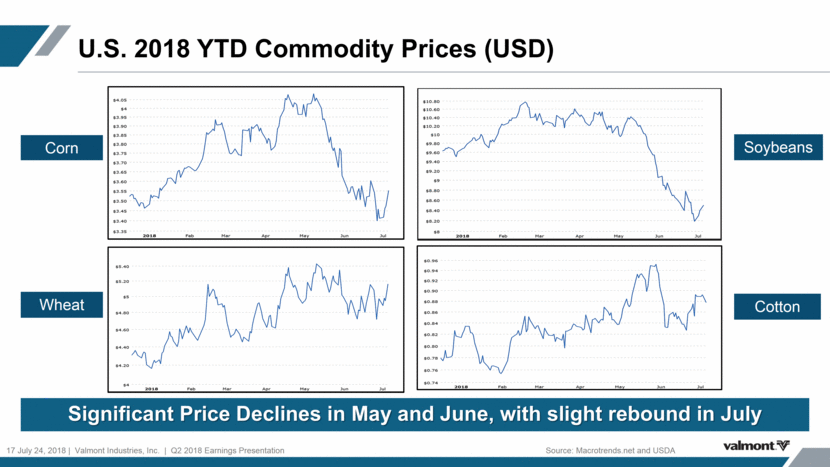
Calculation of Adjusted EBITDA & Leverage Ratio 18 July 24, 2018 Valmont Industries, Inc. Q2 2018 Earnings Presentation Last 4 fiscal quarters (July 2, 2017 to June 30, 2018) The Company completed the redemption of its 2020 bonds on July 9th. Certain of our debt agreements contain covenants that require us to maintain certain coverage ratios. Our Debt/Adjusted EBITDA may not exceed 3.5X Adjusted EBITDA (or 3.75X Adjusted EBITDA after certain material acquisitions) of the prior four quarters. See “Leverage Ratio “ below. TTM 1 6/30/2018 Net earnings attributable to Valmont Industries, Inc. $103,838 Interest expense 45,388 Income tax expense 96,635 Depreciation and amortization expense 84,860 EBITDA 330,721 Cash restructuring expenses 8,628 Impairment of property, plant, and equipment 2,791 Loss on sale of grinding media business 6,084 Adjusted EBITDA $348,224 Adjusted 2 Debt $ 989,654 $ 989,654 July bond redemption $ 250,200 Debt, adjusted $ 739,454 Leverage Ratio 2.84 Leverage Ratio - Adjusted 2.12
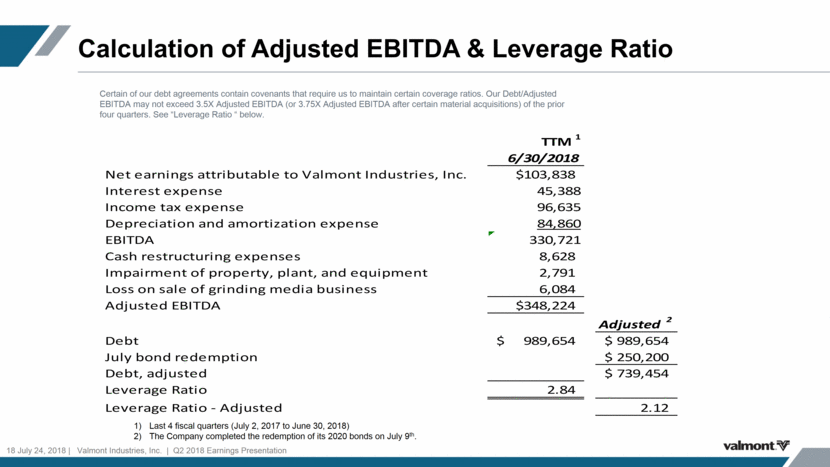
Summary of Effect of Significant Non-recurring Items on Reported Results 19 July 24, 2018 Valmont Industries, Inc. Q2 2018 Earnings Presentation 13 Weeks Ended June 30, 2018 Diluted earnings per share 26 Weeks Ended June 30, 2018 Diluted earnings per share Net earnings attributable to Valmont Industries, Inc. - as reported 32,960 $ 1.46 $ 72,241 $ 3.18 $ Restructuring expenses - pre-tax 7,019 0.31 11,419 0.50 Loss from divestiture of grinding media business, pre-tax 6,084 0.27 6,084 0.27 Total Adjustments 13,103 0.58 17,503 0.77 Tax effect of adjustments * (1,354) (0.06) (2,429) (0.11) Net earnings attributable to Valmont Industries, Inc. - Adjusted 44,709 $ 1.98 $ 87,315 $ 3.84 $ Average shares outstanding (000's) - Diluted 22,573 22,684 * The tax effect of adjustments is calculated based on the income tax rate in each applicable jurisdiction, VALMONT INDUSTRIES, INC. AND SUBSIDIARIES SUMMARY OF EFFECT OF SIGNIFICANT NON-RECURRING ITEMS ON REPORTED RESULTS REGULATION G RECONCILIATION (Dollars in thousands, except per share amounts) (unaudited) The non-GAAP tables below disclose the impact on (a) diluted earnings per share of (1) restructuring costs related to the plan announced in February 2018 and (2) the loss from divestiture of its grinding media business, (b) operating income of restructuring costs and the divestiture of grinding media business, and (c) segment operating income of restructuring costs. Amounts may be impacted by rounding. We believe it is useful when considering company performance for the non-GAAP adjusted net earnings and operating income to be taken into consideration by management and investors with the related reported GAAP measures.
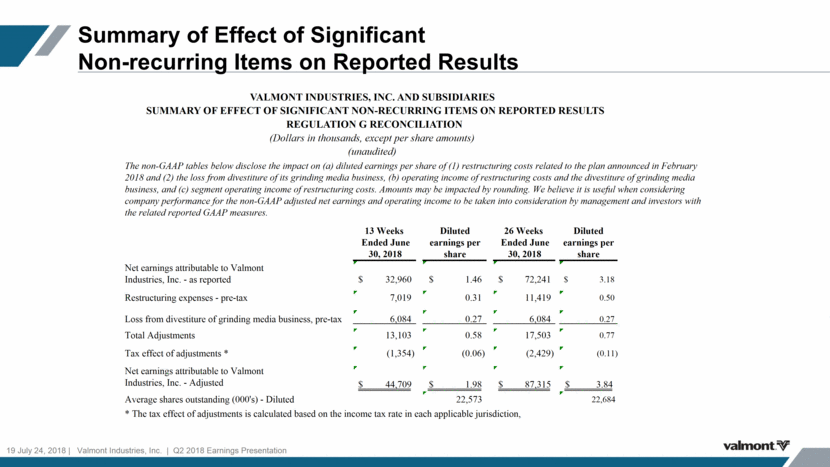
Summary of Effect of Significant Non-recurring Items on Reported Results 20 July 24, 2018 Valmont Industries, Inc. Q2 2018 Earnings Presentation Segment Operating Income Reconciliation Engineered Infrastructure Products Utility Support Structures Coatings Irrigation Other/ Corporate Operating income - as reported 12,965 $ 20,841 $ 14,868 $ 27,728 $ (12,732) $ Restructuring expenses 5,419 1,474 - - 126 Adjusted Operating Income 18,384 $ 22,315 $ 14,868 $ 27,728 $ (12,606) $ Net sales 250,711 197,719 91,572 162,936 Operating Income as a % of Sales 5.2% 10.5% 16.2% 17.0% NM Adjusted Operating Income as a % of Sales 7.3% 11.3% 16.2% 17.0% NM Operating income - as reported 20,288 $ 22,394 $ 12,108 $ 34,670 $ (11,010) $ Net sales 236,803 210,604 79,781 188,287 Operating Income as a % of Sales 8.6% 10.6% 15.2% 18.4% NM For the Second Quarter Ended June 30, 2018 For the Second Quarter Ended July 1, 2017
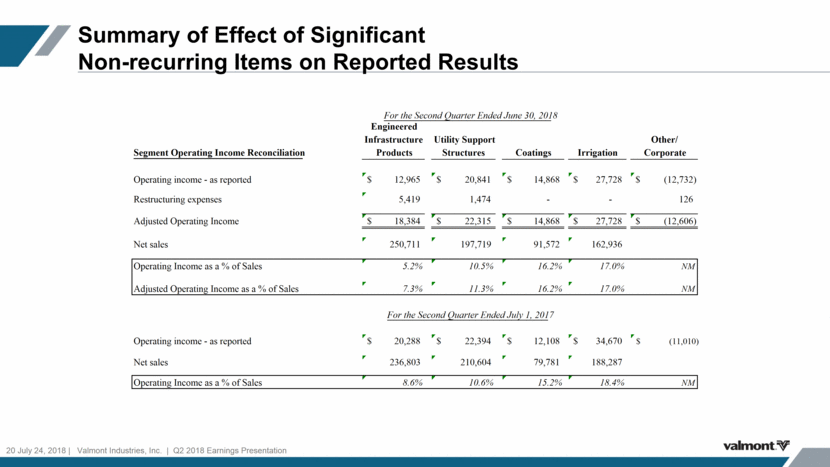
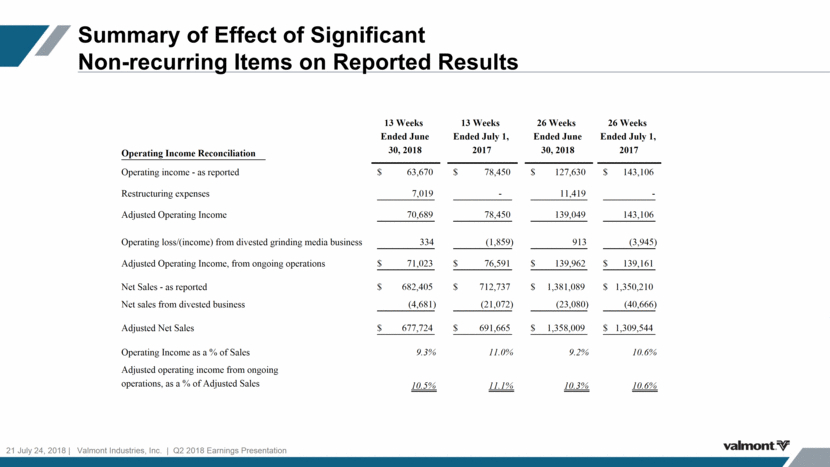
Summary of Effect of Significant Non-recurring Items on Reported Results 21 July 24, 2018 Valmont Industries, Inc. Q2 2018 Earnings Presentation Operating Income Reconciliation 13 Weeks Ended June 30, 2018 13 Weeks Ended July 1, 2017 26 Weeks Ended June 30, 2018 26 Weeks Ended July 1, 2017 Operating income - as reported 63,670 $ 78,450 $ 127,630 $ 143,106 $ Restructuring expenses 7,019 - 11,419 - Adjusted Operating Income 70,689 78,450 139,049 143,106 Operating loss/(income) from divested grinding media business 334 (1,859) 913 (3,945) Adjusted Operating Income, from ongoing operations 71,023 $ 76,591 $ 139,962 $ 139,161 $ Net Sales - as reported 682,405 $ 712,737 $ 1,381,089 $ 1,350,210 $ Net sales from divested business (4,681) (21,072) (23,080) (40,666) Adjusted Net Sales 677,724 $ 691,665 $ 1,358,009 $ 1,309,544 $ Operating Income as a % of Sales 9.3% 11.0% 9.2% 10.6% Adjusted operating income from ongoing operations, as a % of Adjusted Sales 10.5% 11.1% 10.3% 10.6%
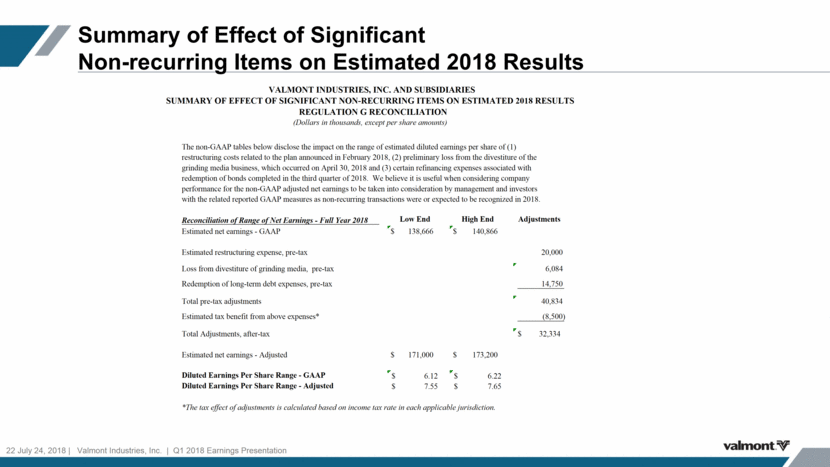
Summary of Effect of Significant Non-recurring Items on Estimated 2018 Results 22 July 24, 2018 Valmont Industries, Inc. Q1 2018 Earnings Presentation Reconciliation of Range of Net Earnings - Full Year 2018 Low End High End Adjustments Estimated net earnings - GAAP $ 138,666 $ 140,866 Estimated restructuring expense, pre-tax 20,000 Loss from divestiture of grinding media, pre-tax 6,084 Redemption of long-term debt expenses, pre-tax 14,750 Total pre-tax adjustments 40,834 Estimated tax benefit from above expenses* (8,500) Total Adjustments, after-tax $ 32,334 Estimated net earnings - Adjusted $ 171,000 $ 173,200 Diluted Earnings Per Share Range - GAAP 6.12 $ 6.22 $ Diluted Earnings Per Share Range - Adjusted 7.55 $ 7.65 $ VALMONT INDUSTRIES, INC. AND SUBSIDIARIES SUMMARY OF EFFECT OF SIGNIFICANT NON-RECURRING ITEMS ON ESTIMATED 2018 RESULTS REGULATION G RECONCILIATION (Dollars in thousands, except per share amounts) The non-GAAP tables below disclose the impact on the range of estimated diluted earnings per share of (1) restructuring costs related to the plan announced in February 2018, (2) preliminary loss from the divestiture of the grinding media business, which occurred on April 30, 2018 and (3) certain refinancing expenses associated with redemption of bonds completed in the third quarter of 2018. We believe it is useful when considering company performance for the non-GAAP adjusted net earnings to be taken into consideration by management and investors with the related reported GAAP measures as non-recurring transactions were or expected to be recognized in 2018. *The tax effect of adjustments is calculated based on income tax rate in each applicable jurisdiction.
