Attached files
| file | filename |
|---|---|
| EX-99.1 - EXHIBIT 99.1 - UNITED COMMUNITY BANKS INC | tv499019_ex99-1.htm |
| 8-K - FORM 8-K - UNITED COMMUNITY BANKS INC | tv499019_8k.htm |
Exhibit 99.2
2018 INVESTOR PRESENTATION SECOND QUARTER 2018 July 24, 2018

ucbi.com | 2 Disclosures CAUTIONARY STATEMENT This investor presentation may contain forward - looking statements, as defined by federal securities laws, including statements about United and its financial outlook and business environment . These statements are based on current expectations and are provided to assist in the understanding of our operations and future financial performance . Our operations and such performance involves risks and uncertainties that may cause actual results to differ materially from those expressed or implied in any such statements . For a discussion of some of the risks and other factors that may cause such forward - looking statements to differ materially from actual results, please refer to United Community Banks, Inc . ’s filings with the Securities and Exchange Commission, including its 2017 Annual Report on Form 10 - K under the section entitled “Forward - Looking Statements . ” Forward - looking statements speak only as of the date they are made, and we undertake no obligation to update or revise forward - looking statements . NON - GAAP MEASURES This presentation includes financial information determined by methods other than in accordance with generally accepted accounting principles (“GAAP”) . This financial information includes certain operating performance measures, which exclude merger - related and other charges that are not considered part of recurring operations . Such measures include : “Net income – operating,” “Net income available to common shareholders – operating,” “Earnings per share – operating,” “Diluted earnings per share – operating,” “Tangible book value per share,” “Return on common equity – operating,” “Return on tangible common equity – operating,” “Return on assets – operating,” “Efficiency ratio – operating,” “Expenses – operating,” “Tangible common equity to risk - weighted assets,” and “Average tangible equity to average assets . ” This presentation also includes “pre - tax, pre - credit earnings,” which excludes the provision for credit losses, income taxes and merger - related and other charges . Management has included these non - GAAP measures because we believe they may provide useful supplemental information for evaluating our underlying performance trends . Further, management uses these measures in managing and evaluating our business and intends to refer to them in discussions about our operations and performance . Operating performance measures should be viewed in addition to, and not as an alternative to or substitute for, measures determined in accordance with GAAP, and are not necessarily comparable to non - GAAP measures that may be presented by other companies . To the extent applicable, reconciliations of these non - GAAP measures to the most directly comparable GAAP measures can be found in the ‘Non - GAAP Reconciliation Tables’ included in the exhibits to this presentation . ucbi.com | 2

• Established in 1950 and headquartered in Blairsville, GA with executive offices in Greenville, SC x 2,323 employees • One of the largest regional banks in the U.S. by assets with 143 branch locations, 7 loan production offices and 4 mortgage loan offices in four states: GA, NC, SC and TN x Top 10 market share in GA and SC • Metro - focused branch network with locations in fast growing areas Premier Southeast Regional Bank United Community Bank 143 Branch locations 7 Loan Production Offices 4 Mortgage Loan Offices Who We Are Snapshot of United Community Banks, Inc. Market data as of July 20, 2018 (1) See non - GAAP reconciliation table slides at the end of the exhibits for a reconciliation of operating performance measures to GA AP performance measures ucbi.com | 3 2Q18 Overview Ticker UCBI (NASDAQ) Market Cap $2.4Bn P/EPS (2019E) 12.6x P/TBV 233% Assets $12.4Bn Loans $8.2Bn Deposits $10.0Bn CET1* 11.6% NPAs / Assets 0.20% ROA – GAAP 1.30% ROA – Operating (1) 1.39% ROCE – GAAP 11.20% ROTCE – Operating (1) 15.79% *2Q18 Capital Ratios are preliminary

2Q18 Highlights ucbi.com | 4 $15.83 $17.02 $17.29 $13.74 $12.96 $13.25 2Q17 1Q18 2Q18 Book Value Per Share (2) Book Value (GAAP) Tangible Book Value (non-GAAP) (1) $0.39 $0.47 $0.49 $0.41 $0.50 $0.53 2Q17 1Q18 2Q18 Earnings Per Share GAAP Operating (1) 1.06% 1.26% 1.30% 1.10% 1.33% 1.39% 2Q17 1Q18 2Q18 Return on Assets GAAP Operating (1) (1) See non - GAAP reconciliation table slides at the end of the exhibits for a reconciliation of operating performance measures to G AAP performance measures ucbi.com | 4 (1) See non - GAAP reconciliation table slides at the end of the exhibits for a reconciliation of operating performance measures to GA AP performance measures (2) Excludes effect of acquisition - related intangibles and associated amortization » Operating diluted earnings per share of $0.53 compared with GAAP diluted earnings per share of $0.49 » GAAP EPS up 26% vs. last year » Operating EPS rose 29% over the same time frame » GAAP ROA of 1.30% in 2Q » Operating ROA moved to 1.39%, on path towards 1.40% 2018 target » Dividend $0.15 up 67% vs. last year $0.09 $0.12 $0.15 2Q17 1Q18 2Q18 Dividends Per Share

$85.1 $103.3 $108.5 2Q17 1Q18 2Q18 3.47% 3.80% 3.90% ucbi.com | 5 (1)Net interest margin is calculated on a fully taxable equivalent basis(2)Excludes brokered deposits Net Interest Revenue / Margin (1) ucbi.com | 5 (1)Net interest margin is calculated on a fully-taxable equivalent basis $ in millions Net Interest Revenue Net Interest Margin .Net interest revenue of $108.5 mm increased $5.2 mm (5.0%) vs. 1Q18 and $23.3 mm (27.4%) vs. 2Q17 .Benefit of Navitasacquisition, in addition to rising short-term interest rates .Net interest margin up 10 bps vs. 1Q18 impacted by .Higher loan yield of 18 bps due to higher short- term interest rates and the full quarter impact of Navitas .Accretableyield contributed $674 thousand or 2 bps to 2Q18 NIM vs. 6 bps in 1Q18 .Net interest margin up 43 bps vs. 2Q17 due to higher short-term rates, stable core deposit base and the impact of acquisitions

0 10 20 30 40 50 26 bps 82% 95% Low - Cost Deposit Base Sufficient Liquidity to Support Future Growth Loans / Deposits (1) (2) Cost of Total Deposits (bps) (1) (2) 42 bps 33 bps Deposits KRX Peer ucbi.com | 6 KRX Peer Note – Peer comparison banks comprise the KBW Regional Bank Index (ticker:KRX) (1) Source: S&P Global Market Intelligence (2) United results as of 2Q18; KRX results as of 1Q18 (Source: S&P Global Market Intelligence)

ucbi.com | 7$2.8$3.0$2.9$1.3$1.7$1.8$0.6$0.7$0.7$1.7$1.9$1.9$0.6$0.5$0.4$0.4$0.5$7.0$8.2$8.22Q171Q182Q18C&I (1)CREComml ConstructionResidentialOther ConsumerEquipment Finance24.7%8.3%19.1%39.9%22.2%34.9%8.9%23.4%4.9%20.5%37.2%8.4%23.1%5.6%5.7%5.2%Loansucbi.com | 7$ in billions8.0%.Annualized end-of-period loan growth was 2%, or 4% excluding indirect auto runoff of $39 mm.Diversified portfolio, weighted towards C&I .Reclassified $139 mm of senior care loans in 2Q to income producing CRE from owner-occupied CRE.Well within regulatory guidance on construction and CRE levels .The 100%/300% ratios stand at 74% and 202%, respectively.Other consumer has declined to a 5% contribution due to the planned runoff of the indirect auto portfolio(1)C&I includes commercial and industrial loans as well as owner-occupied CRE loans

ucbi.com | 8 Loan Growth Drivers ucbi.com | 8 » Continued expansion in our metro markets, including our new Myrtle Beach and Raleigh markets » Ongoing evaluation and addition of new Commercial Banking products and verticals » Successful execution of the Navitas growth strategy » Continued development of our unique partnership model where the community banks partner with CBS to drive growth » Growth in the mortgage business via expansion into newly acquired markets and with the addition of on - balance sheet adjustable rate products

$10.7$8.8$8.8$4.4$5.5$5.6$1.2$0.9$1.2$4.8$5.4$5.3$2.6$1.8$2.42Q171Q182Q18Service ChargesOtherBrokerageMortgageSBAucbi.com | 9Fee Revenueucbi.com | 9in millions.Linked quarter, fees up $0.9 mm due to: .Record number of locks and applications, yet slightly lower mortgage fees in 2Q vs. 1Q due to a $0.1 mm write down of MSR vs. $0.4 mm write up in 1Q .2Q record SBA originations of $59.6 mm, up 125% over 1Q .SBA loan sales of $28.5 mm up 29% vs. last quarter, as mix change toward construction loans is limiting near term loan sales .SBA closed construction loan pipeline to $87.1 mm.Vs Last Year, fees down $0.4 mm to $23.3 mm .$1.9 mm lower service charges as $2.5 mm Durbin impact is partially offset with the increase from acquisitions .Record $259 mm of mortgageoriginations, up 27% year over year .Record 2Q SBA production of $59.6 mm, up 88% vs. 2Q17 of $31.7 mm; SBA revenue down slightly year over year on lower loan sales ($28.5 mm in 2Q18 vs. $30 million in 2Q17) .Other income up $1.2 mm includes the benefit of Navitasfee income$23.7$22.4$23.3

57.9%57.8%57.9%56.2%55.8%55.8%$63.2$73.5$76.9$61.4$70.8$74.02Q171Q182Q18ucbi.com | 10(1)Net interest margin is calculated on a fully taxable equivalent basis(2)Excludes brokered depositsExpense Disciplineucbi.com | 10GAAPOperating (1)(1)See non-GAAP reconciliation table slides at the end of the exhibits for a reconciliation of operating performance measures to GAAP performance measures.Linked quarter, GAAP and operating expenses grew 5% and 4%, respectively .Operating efficiency ratio stable at 55.8% .Operating expenses up $3.2 mm vs. 1Q18, excluding merger-related and other charges .Full quarter of Navitasadded $1.6 mm in 2Q.Market expansions and acquisitions drove year- over-year GAAP and operating expenses higher by 22% and 20% .Operating efficiency ratio improved to 55.8% from 56.2% last yearEfficiency Ratio (1)$ in millions

Credit Quality ucbi.com | 11 (1) See non - GAAP reconciliation table slides at the end of the exhibits for a reconciliation of operating performance measures to G AAP performance measures ucbi.com | 11 0.09% 0.08% 0.07% 2Q17 1Q18 2Q18 Net Charge - Offs as % of Average Loans 0.24% 0.24% 0.20% 2Q17 1Q18 2Q18 Non - Performing Assets as % of Total Assets $0.8 $1.5 $1.8 $ 2.3 (1) 2Q17 1Q18 2Q18 Provision for Credit Losses $ in millions $ 3.8 0.85% 0.75% 0.74% 2Q17 1Q18 2Q18 Allowance for Loan Losses (1) 1Q18 $2.3 million provision due to initial reserve setup for Navitas acquisition
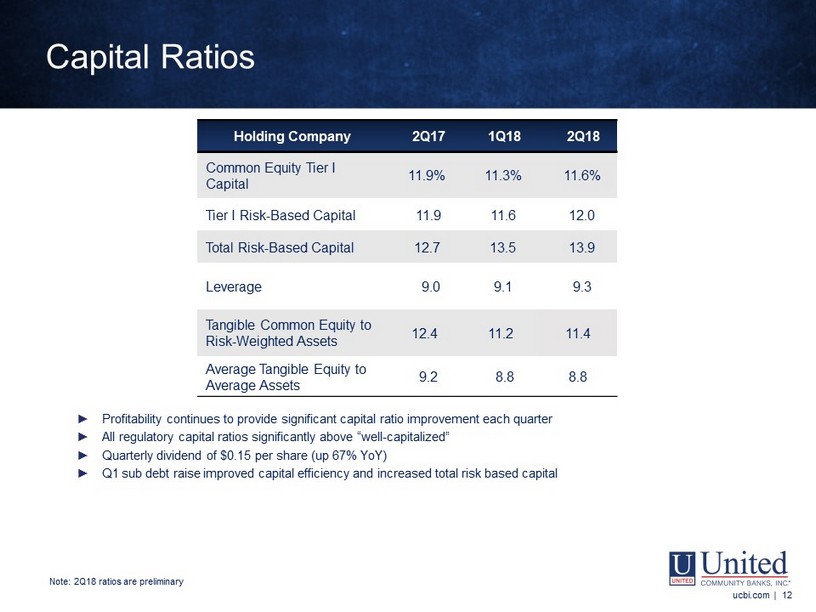
ucbi.com | 12 Holding Company 2Q17 1Q18 2Q18 Common Equity Tier I Capital 11.9% 11.3% 11.6% Tier I Risk-Based Capital 11.911.612.0 Total Risk-Based Capital 12.713.513.9 Leverage 9.09.19.3 Tangible Common Equity to Risk-Weighted Assets 12.411.211.4 Average Tangible Equity to Average Assets 9.28.88.8. Profitability continues to provide significant capital ratio improvement each quarter .All regulatory capital ratios significantly above “well-capitalized” .Quarterly dividend of $0.15 per share (up 67% YoY) .Q1 sub debt raise improved capital efficiency and increased total risk based capital ucbi.com | 12Capital Ratios Note: 2Q18 ratios are preliminary

ucbi.com | 13 Key Strengths ucbi.com | 13 » Culture and business model that attracts both bankers and potential acquisition partners » Positioned well in many of the South's fastest - growing markets » Superior customer service helps drive great core deposit growth » Well - developed credit model to drive consistent performance through cycles » Liquid balance sheet and strong capital offer flexibility in a rising rate environment
2018 INVESTOR PRESENTATION Exhibits SECOND QUARTER 2018 July 24, 2018

Cultural Pillars Customer Service Is at Our Foundation High - Quality Balance Sheet » Underwriting conservatism and portfolio diversification » Top quartile credit quality performance » Prudent capital, liquidity and interest - rate risk management » Focused on improving return to shareholders with increasing ROTCE and dividend growth Profitability » Managing a steady margin with minimal accretion income » Fee revenue expansion through focused growth initiatives » Continued operating expense discipline while investing in growth opportunities » Executing on M&A cost savings » High - quality, low - cost core deposit base Growth » Addition of Commercial Banking Solutions platforms (middle - market banking, SBA lending, senior care, income - property lending, asset - based lending, builder finance, renewable energy, equipment finance) and actively pursuing additional lending platforms » Entered into and continue to target new markets with team lift - outs (Charleston, Greenville, Atlanta, Raleigh) » Continuous emphasis on and enhancement of Mortgage product offerings to drive loan and revenue growth » Acquisitions that fit our footprint and culture and deliver desired financial returns Who We Are Full - Service Regional Bank with a Strong Culture Rooted in Sound Credit Underwriting & Growth ucbi.com | 15

16 Who We Are The Bank That Service Built ucbi.com | 16

Fastest Growing Southeast MSAs (1) 2018 - 2023 Proj. Population Growth 2018 Population 2023 Proj. Median Household Income 1. Myrtle Beach, SC 9.96% 470,010 $55,177 2. Cape Coral, FL 8.66% 740,553 $59,220 3. Charleston, SC 8.46% 785,518 $69,670 4. Orlando, FL 8.17% 2,518,915 $62,806 5. Raleigh, NC 8.08% 1,335,067 $76,237 6. Naples, FL 7.95% 374,242 $75,389 7. North Port, FL 7.54% 808,091 $66,409 8. Lakeland, FL 7.22% 683,670 $51,907 9. Charlotte, NC 7.22% 2,537,416 $65,758 10. Jacksonville, FL 6.89% 1,519,940 $65,428 16. Savannah, GA 6.60% 392,546 $61,718 18. Atlanta, GA 6.48% 5,919,767 $71,156 21. Greenville, SC 6.12% 901,549 $58,643 9.7% 8.9% ’18 – ’23 Proj. Household Income Growth 5.1% 3.5% ’18 – ’23 Proj. Population Growth Strong Demographic Profile (2) $54,241 $61,045 Median Household Income UCBI MSA Presence Who We Are Focused on High - Growth MSAs in Southeast (1) Includes MSAs with a population of greater than 300,000 (2) Weighted by state deposits ucbi.com | 17 United States United States United States

2015 2016 2017 1Q 2018 2Q 2018 2015 2016 2017 1Q 2018 2Q 2018 Demand Deposit 618$ 334$ 487$ 117$ 40$ Non-Interest Bearing Core NOW 441 5 107 4 (21) Demand Deposit 2,089$ 2,423$ 2,910$ 3,027$ 3,067$ MMDA 325 246 156 (7) 10 Savings 177 79 101 25 7 Interest Bearing Core Growth by Category 1,561$ 664$ 851$ 139$ 36$ Total CommercialNOW 1,109 1,114 1,221 1,225 1,204 MMDA 1,584 1,830 1,986 1,979 1,989 Atlanta MSA 223$ 168$ 91$ 38$ (19)$ Savings 469 548 649 675 681 North Georgia 158 133 80 58 15 Total Interest Bearing Core 3,162 3,492 3,856 3,878 3,874 North Carolina (1) 63 62 412 11 30 Coastal Georgia 24 16 28 40 (1) Total Core Trans Deposits 5,251 5,915 6,766 6,905 6,941 East Tennessee (2) 234 (16) (7) (2) 3 Gainesville MSA 34 48 20 5 3 Time (Customer) 1,251 1,267 1,522 1,487 1,491 South Carolina (3) 825 253 227 (11) 4 Public Funds (Customer) 1,032 1,128 1,148 1,190 1,089 Growth by Region 1,561$ 664$ 851$ 139$ 36$ Brokered 339 328 371 411 444 Total LoansTotal Deposits 7,873$ 8,638$ 9,808$ 9,993$ 9,965$ ucbi.com | 18 NOTE - Certain prior period amounts in the loans by category table have been reclassified to conform to the current presentation Deposit Mix $5.90 $7.53 $8.31 $9.44 $9.58 $9.52 - $1.00 $2.00 $3.00 $4.00 $5.00 $6.00 $7.00 $8.00 $9.00 $10.00 $11.00 2014 2015 2016 2017 1Q 2018 2Q 2018 Billions Public Funds (customer) Time (customer) Interest Bearing Core Transaction Non-Interest Bearing Core Transaction Time & Public Core Transaction Core Transaction Deposit Growth by Category & Region in millions Deposits by Category in millions (1) Includes $354 million from the acquisition of Four Oaks NB on November 1, 2017 (2) Includes $247 million from the acquisition of FNB on May 1, 2015 (3) Includes $790 million, $175 million and $226 million, respectively, from the acquisitions of Palmetto on September 1, 2015, Tidelands on July 1, 2016 and Horry County State Bank on July 31, 2017 ucbi.com | 18 Note – Column graph summarizes customer deposits, which excludes brokered deposits

ucbi.com | 19 2Q18 1Q18 2Q17 1Q18 2Q17 Commercial & Industrial 227.4$ 220.7$ 161.8$ 6.7$ 65.6$ Owner-Occupied CRE 74.7 67.1 114.0 7.6 (39.3) Income-Producing CRE 112.3 70.2 41.6 42.1 70.7 Commercial Constr. 186.8 145.6 121.8 41.2 65.0 Total Commercial 601.2 503.6 439.2 97.6 162.0 Residential Mortgage 63.9 38.3 48.3 25.6 15.6 Residential HELOC 66.6 53.6 64.7 13.0 1.9 Residential Construction 63.4 54.4 56.8 9.0 6.6 Consumer 17.7 15.8 57.9 1.9 (40.2) Total 812.8$ 665.8$ 666.9$ 147.0$ 145.9$ Variance-Incr(Decr) NOTE - Certain prior period amounts have been reclassified to conform to the current presentation (1) Represents new loans funded and net loan advances (net of payments on lines of credit) New Loans Funded and Advances $666.9 $665.8 $812.8 2Q17 1Q18 2Q18 New Loans Funded and Advances by Region New Loans Funded and Advances by Category 2Q18 1Q18 2Q17 1Q18 2Q17 Atlanta 142.3$ 121.1$ 122.5$ 21.2$ 19.8 Coastal Georgia 43.3 39.3 75.7 4.0 (32.4) North Georgia 65.2 60.2 64.2 5.0 1.0 North Carolina 113.2 35.9 29.9 77.3 83.3 Tennessee 32.7 28.8 40.2 3.9 (7.5) Gainesville 15.4 11.0 13.2 4.4 2.2 South Carolina 145.1 131.3 115.0 13.8 30.1 Total Community Banks 557.2 427.5 460.7 129.7 96.5 Asset-based Lending 1.0 10.8 17.6 (9.8) (16.6) Commercial RE 38.2 33.8 41.1 4.4 (2.9) Senior Care 32.9 36.1 8.3 (3.2) 24.6 Middle Market 9.4 6.9 35.4 2.5 (26.0) SBA 36.2 32.7 35.3 3.5 0.9 Renewable Energy 0.4 8.5 - (8.1) 0.4 Navitas 100.2 65.3 - 34.9 100.2 Builder Finance 37.3 44.1 28.1 (6.8) 9.2 255.6 238.3 165.8 17.4 89.8 Indirect Auto - - 40.4 - (40.4) Total 812.8$ 665.8$ 666.9$ 147.0$ 145.9$ Variance-Incr(Decr) Total Commercial Banking Solutions New Loans Funded and Advances (1) ucbi.com | 19 (1) Represents new loans funded and net loan advances (net of payments on lines of credit) $ in millions

Commercial RE Diversification –6/30/2018 ucbi.com | 20 Assisted Living/Nursing Home/Rehab Cntr266$ 21.0 %105$ 14.2 % Residential Construction in Process: SPEC144 11.4 88 12.0 Office Buildings 99 7.9 42 5.7 Multi-Residential Properties 97 7.6 32 4.3 Residential Construction in Process: PRESOLD 74 5.8 47 6.4 Hotels Motels 68 5.4 24 3.3 Residential Land Development - Lots Already Developed in Hands of Builders 64 5.1 60 8.2 Retail Building 58 4.6 47 6.4 Vacant (Improved) 50 4.0 44 5.9 Warehouse 50 3.9 35 4.8 Other Properties 49 3.9 42 5.7 Self Storage 46 3.6 27 3.6 Residential Land Development - Subdivisions in Process 43 3.4 30 4.1 Raw Land - Vacant (Unimproved) 39 3.1 33 4.4 Restaurants /Franchise Fast Food / Franchise Other 27 2.1 14 1.9 Residential Raw Land in the Hands of Builders/Developers 19 1.5 17 2.3 Mfg Facility14 1.1 5 0.7 Negative Pledge 11 0.9 7 0.9 Commercial Land Development 11 0.9 11 1.5 Churches 11 0.9 10 1.3 All Other 26 1.9 16 2.4 Total Commercial Construction1,266$ 100 %736$ 100 % Outstanding Committed Commercial Real Estate –Income Producing in millions Commercial Construction in millions Office Buildings 440$ 22.7 %398$ 21.8 % Retail Building 359 18.5 345 19.0 Investor Residential 201 10.4 197 10.8 Assisted Living/Nursing Home/Rehab Cntr209 10.8 187 10.3 Hotels Motels 176 9.1 172 9.5 Warehouse 169 8.7 163 8.9 Multi-Residential Properties 158 8.2 149 8.2 Other Properties 62 3.2 53 2.9 Restaurants /Franchise Fast Food / Franchise Other 52 2.7 46 2.5 Self Storage29 1.5 27 1.5 Convenience Stores 27 1.4 26 1.4 Mfg Facility 22 1.1 22 1.2 Leasehold Property 10 0.5 10 0.5 Mobile Home Parks 10 0.5 9 0.5 Automotive Service 8 0.4 8 0.5 Daycare Facility 4 0.2 4 0.2 All Other2 0.1 5 0.3 Total Commercial Real Estate - Income Producing 1,938$ 100 %1,821$ 100 % Committed Outstanding Outstanding Average Loan Size(in thousands )•Commercial Construction$322 •Commercial RE: •Composite CRE415 •Owner-Occupied 357 •Income-Producing 488 Committed Average Loan Size(in thousands )•Commercial Construction$553 •Commercial RE: •Composite CRE442 •Owner-Occupied 382 •Income-Producing 517 ucbi.com | 20
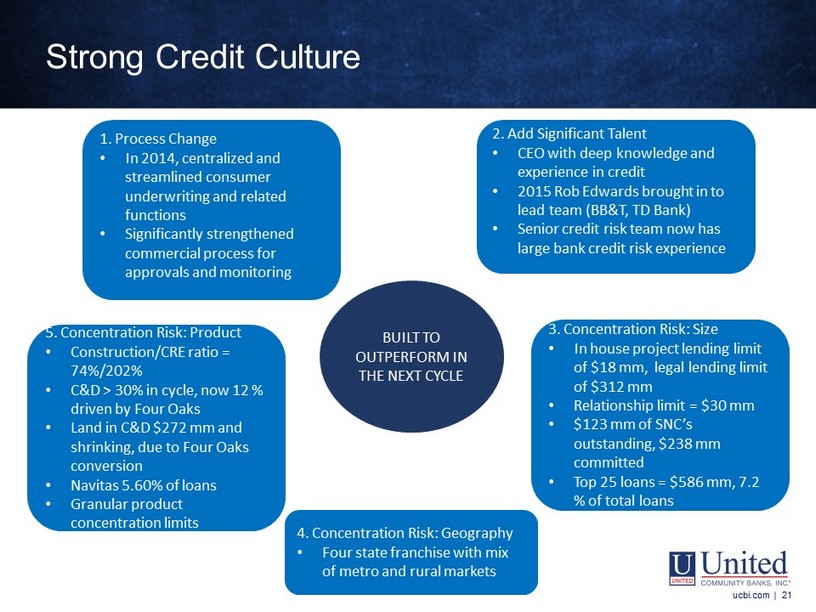
BUILT TO OUTPERFORM IN THE NEXT CYCLE 1. Process Change • In 2014, centralized and streamlined consumer underwriting and related functions • Significantly strengthened commercial process for approvals and monitoring 2. Add Significant Talent • CEO with deep knowledge and experience in credit • 2015 Rob Edwards brought in to lead team (BB&T, TD Bank) • Senior credit risk team now has large bank credit risk experience 3. Concentration Risk: Size • In house project lending limit of $18 mm, legal lending limit of $312 mm • Relationship limit = $30 mm • $ 123 mm of SNC’s outstanding, $238 mm committed • Top 25 loans = $586 mm, 7.2 % of total loans 4. Concentration Risk: Geography • Four state franchise with mix of metro and rural markets 5. Concentration Risk: Product • Construction/CRE ratio = 74%/202% • C&D > 30% in cycle, now 12 % driven by Four Oaks • Land in C&D $ 272 mm and shrinking, due to Four Oaks conversion • Navitas 5.60% of loans • Granular product concentration limits Strong Credit Culture ucbi.com | 21

2Q17 3Q17 4Q17 1Q18 2Q18(1)(1)(1)(1) Net Income Net income - GAAP28,267$ 27,946$ (11,916)$ 37,658$ 39,634$ Merger-related and other charges 1,830 3,420 7,358 2,646 2,873 Tax benefit on merger-related and other charges(675) (1,147) (1,165) (628) (121) Impairment of deferred tax asset due to federal tax rate reduction- - 38,199 - - Net income - Operating 29,422$ 30,219$ 32,476$ 39,676$ 42,386$ Diluted Earnings per share Diluted earnings per share - GAAP0.39$ 0.38$ (0.16)$ 0.47$ 0.49$ Merger-related and other charges 0.02 0.03 0.08 0.03 0.04 Impairment of deferred tax asset due to federal tax rate reduction- - 0.50 - - Diluted earnings per share - Operating 0.41$ 0.41$ 0.42$ 0.50$ 0.53$ Return on Assets Return on assets - GAAP1.06 % 1.01 % (0.40) % 1.26 % 1.30 % Merger-related and other charges 0.04 0.08 0.20 0.07 0.09 Impairment of deferred tax asset due to federal tax rate reduction- - 1.30 - - Return on assets - Operating1.10 % 1.09 % 1.10 % 1.33 % 1.39 % Book Value per shareBook Value per share - GAAP 15.83$ 16.50$ 16.67$ 17.02$ 17.29$ Effect of goodwill and other intangibles(2.09) (2.39) (3.02) (4.06) (4.04) Tangible book value per share 13.74$ 14.11$ 13.65$ 12.96$ 13.25$ ucbi.com | 22 Non-GAAP Reconciliation Tables ucbi.com | 22$ in thousands, except per share data(1)Merger-related and other charges for 2Q18, 1Q18, 4Q17 and 3Q17 include $593 thousand, $592 thousand, $517 thousand and $244 thousand, respectively, of intangible amortization resulting from payments made to executives under their change of control agreements. The resulting intangible assets are being amortized over 12 to 24 months.
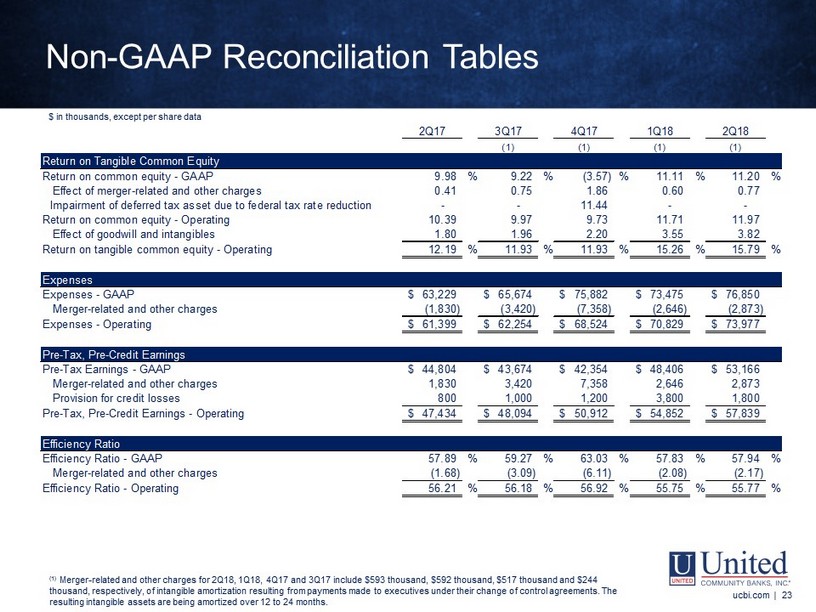
2Q17 3Q17 4Q17 1Q18 2Q18(1)(1)(1)(1) Return on Tangible Common Equity Return on common equity - GAAP 9.98 % 9.22 % (3.57) % 11.11 % 11.20 % Effect of merger-related and other charges 0.41 0.75 1.86 0.60 0.77 Impairment of deferred tax asset due to federal tax rate reduction- - 11.44 - - Return on common equity - Operating 10.39 9.97 9.73 11.71 11.97 Effect of goodwill and intangibles 1.80 1.96 2.20 3.55 3.82 Return on tangible common equity - Operating 12.19 % 11.93 % 11.93 % 15.26 % 15.79 % Expenses Expenses - GAAP 63,229$ 65,674$ 75,882$ 73,475$ 76,850$ Merger-related and other charges(1,830) (3,420) (7,358) (2,646) (2,873) Expenses - Operating 61,399$ 62,254$ 68,524$ 70,829$ 73,977$ Pre-Tax, Pre-Credit Earnings Pre-Tax Earnings - GAAP44,804$ 43,674$ 42,354$ 48,406$ 53,166$ Merger-related and other charges 1,830 3,420 7,358 2,646 2,873 Provision for credit losses 800 1,000 1,200 3,800 1,800 Pre-Tax, Pre-Credit Earnings - Operating 47,434$ 48,094$ 50,912$ 54,852$ 57,839$ Efficiency Ratio Efficiency Ratio - GAAP 57.89 % 59.27 % 63.03 % 57.83 % 57.94 % Merger-related and other charges(1.68) (3.09) (6.11) (2.08) (2.17) Efficiency Ratio - Operating 56.21 % 56.18 % 56.92 % 55.75 % 55.77 % ucbi.com | 23 Non-GAAP Reconciliation Tables ucbi.com | 23$ in thousands, except per share data(1) Merger-related and other charges for 2Q18, 1Q18, 4Q17 and 3Q17 include $593 thousand, $592 thousand, $517 thousand and $244 thousand, respectively, of intangible amortization resulting from payments made to executives under their change of control agreements. The resulting intangible assets are being amortized over 12 to 24 months.