Attached files
| file | filename |
|---|---|
| EX-99.2 - EX-99.2 - SYNOVUS FINANCIAL CORP | d533346dex992.htm |
| EX-99.1 - EX-99.1 - SYNOVUS FINANCIAL CORP | d533346dex991.htm |
| 8-K - FORM 8-K - SYNOVUS FINANCIAL CORP | d533346d8k.htm |
Exhibit 99.3
Second Quarter 2018 Results
July 24, 2018
Forward Looking Statements
This slide presentation
and certain of our other filings with the Securities and Exchange Commission contain statements that constitute “forward-looking statements” within the meaning of, and subject to the protections of, Section 27A of the Securities Act
of 1933, as amended, and Section 21E of the Securities Exchange Act of 1934, as amended. All statements other than statements of historical fact are forward-looking statements. You can identify these forward-looking statements through
Synovus’ use of words such as “believes,” “anticipates,” “expects,” “may,” “will,” “assumes,” “should,” “predicts,” “could,” “should,”
“would,” “intends,” “targets,” “estimates,” “projects,” “plans,” “potential” and other similar words and expressions of the future or otherwise regarding the outlook for
Synovus’ future business and financial performance and/or the performance of the banking industry and economy in general. These forward-looking statements include, among others, statements on (1) future loan growth; (2) future deposit
growth; (3) future net interest income and net interest margin; (4) future adjusted non-interest income; (5) future non-interest expense levels;
(6) future credit trends and key metrics; (7) future effective tax rates; (8) future capital ratios; (9) our strategy and initiatives for future growth, capital management, and strategic transactions; and (10) our
assumptions underlying these expectations. Prospective investors are cautioned that any such forward-looking statements are not guarantees of future performance and involve known and unknown risks and uncertainties which may cause the actual
results, performance or achievements of Synovus to be materially different from the future results, performance or achievements expressed or implied by such forward-looking statements. Forward-looking statements are based on the information known
to, and current beliefs and expectations of, Synovus’ management and are subject to significant risks and uncertainties. Actual results may differ materially from those contemplated by such forward-looking statements. A number of factors could
cause actual results to differ materially from those contemplated by the forward-looking statements in this presentation. Many of these factors are beyond Synovus’ ability to control or predict.
These forward-looking statements are based upon information presently known to Synovus’ management and are inherently subjective, uncertain and subject to change due to any
number of risks and uncertainties, including, without limitation, the risks and other factors set forth in Synovus’ filings with the Securities and Exchange Commission, including its Annual Report on Form
10-K for the year ended December 31, 2017 under the captions “Cautionary Notice Regarding Forward-Looking Statements” and “Risk Factors” and in Synovus’ quarterly reports on Form 10-Q and current reports on Form 8-K. We believe these forward-looking statements are reasonable; however, undue reliance should not be placed on any forward-looking
statements, which are based on current expectations and speak only as of the date that they are made. We do not assume any obligation to update any forward-looking statements as a result of new information, future developments or otherwise, except
as otherwise may be required by law.
Use of Non-GAAP Financial Measures
This slide presentation contains certain non-GAAP financial measures determined by methods other than in accordance with generally accepted
accounting principles. Such non-GAAP financial measures include the following: adjusted diluted earnings per share; adjusted return on average assets; adjusted return on average common equity; adjusted return
on average tangible common equity; average core deposits; cost of interest bearing core deposits; adjusted non-interest income; adjusted non-interest expense; adjusted
efficiency ratio; tangible common equity ratio; and common equity Tier 1 (CET1) ratio (fully phased-in). The most comparable GAAP measures to these measures are diluted earnings per share; return on average
assets; return on average common equity; total average deposits; cost of funds rate; total non-interest income; total non-interest expense; efficiency ratio; total
shareholders’ equity to total assets ratio; and CET1 ratio, respectively. Management uses these non-GAAP financial measures to assess the performance of Synovus’ business and the strength of its
capital position. Management believes that these non-GAAP financial measures provide meaningful additional information about
Synovus to assist management, investors, and bank regulators in evaluating Synovus’ operating results, financial strength, the performance of its business and
the strength of its capital position. However, these non-GAAP financial measures have inherent limitations as analytical tools and should not be considered in isolation or as a substitute for analyses of
operating results or capital position as reported under GAAP. The non-GAAP financial measures should be considered as additional views of the way our financial measures are affected by significant items and
other factors, and since they are not required to be uniformly applied, they may not be comparable to other similarly titled measures at other companies. Adjusted diluted earnings per share, adjusted return on average assets, and adjusted return on
average common equity are measures used by management to evaluate operating results exclusive of items that are not indicative of ongoing operations and impact
period-to-period comparisons. Adjusted return on average tangible common equity is a measure used by management to compare Synovus’ performance with other financial
institutions because it calculates the return available to common shareholders without the impact of intangible assets and their related amortization, thereby allowing management to evaluate the performance of the business consistently. Average core
deposits is a measure used by management to evaluate organic growth of deposits and the quality of deposits as a funding source. The cost of interest bearing core deposits is a measure used to evaluate the cost of deposits as a funding source
exclusive of brokered deposits and deposits. Adjusted non-interest income is a measure used by management to evaluate non-interest income exclusive of net investment
securities gains/losses, changes in fair value of private equity investments, net. Adjusted non-interest expense and the adjusted efficiency ratio are measures utilized by management to measure the success of
expense management initiatives focused on reducing recurring controllable operating costs. The tangible common equity ratio is used by management and bank regulators to assess the strength of our capital position. The computations of the non-GAAP financial measures used in this slide presentation are set forth in the Appendix to this slide presentation.
2
2Q18 Highlights
Profitability
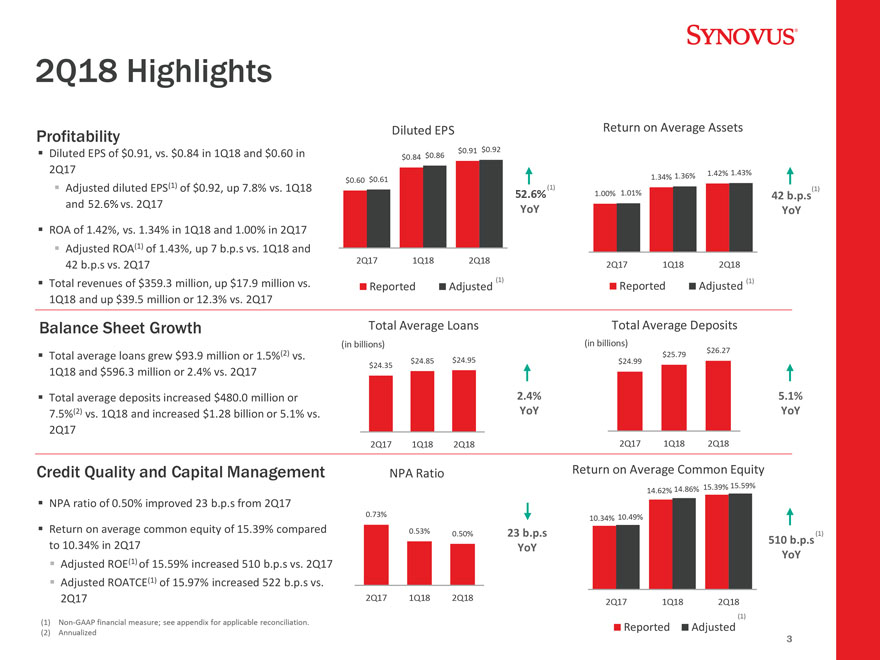
Diluted EPS of $0.91, vs. $0.84 in 1Q18 and $0.60 in 2Q17
$
Adjusted diluted EPS(1) of $0.92, up 7.8% vs. 1Q18 and 52.6% vs. 2Q17
ROA of 1.42%, vs. 1.34%
in 1Q18 and 1.00% in 2Q17 Adjusted ROA(1) of 1.43%, up 7 b.p.s vs. 1Q18 and 42 b.p.s vs. 2Q17 Total revenues of $359.3 million, up $17.9 million vs.
1Q18
and up $39.5 million or 12.3% vs. 2Q17
Balance Sheet Growth
(in
Total average loans grew $93.9 million or 1.5%(2) vs. 1Q18 and $596.3 million or 2.4% vs. 2Q17
Total average deposits increased $480.0 million or 7.5%(2) vs. 1Q18 and increased $1.28 billion or 5.1% vs.
2Q17
Credit Quality and Capital Management
NPA ratio of 0.50% improved 23 b.p.s from 2Q17
Return on average common equity of 15.39%
compared to 10.34% in 2Q17 Adjusted ROE(1) of 15.59% increased 510 b.p.s vs. 2Q17 Adjusted ROATCE(1) of 15.97% increased 522 b.p.s vs.
2Q17
(1) Non-GAAP financial measure; see appendix for applicable reconciliation. (2) Annualized
Diluted EPS
$0.91 $0.92
$0.84 $0.86
$0.60 $0.61
Return on Average Assets
(1)
52.6% YoY
NPA Ratio
0.73%
0.53% 0.50%
2Q17 1Q18 2Q18
23 b.p.s YoY
1.42% 1.43%
1.34% 1.36%
1.00% 1.01%
2Q17 1Q18 2Q18
(1)
Reported Adjusted
(1)
Reported Adjusted
(1)
42 b.p.s YoY
Total Average Loans
(in billions)
$24.85 $24.95
$24.35
2.4% YoY
2Q17 1Q18 2Q18
(1)
Reported Adjusted
3
Loans
Period-end Loan Balances
(in
billions)
$24.43(2) 11.74
48.1%
5.28
21.6%
7.41
30.3%
2Q17
$24.88(2) 12.10
48.5%
5.97
24.0%
6.84
27.5%
1Q18
$95.6
$25.13 (2)
12.28
48.8%
6.24
24.8%
6.64
26.4%
2Q18
$251.0
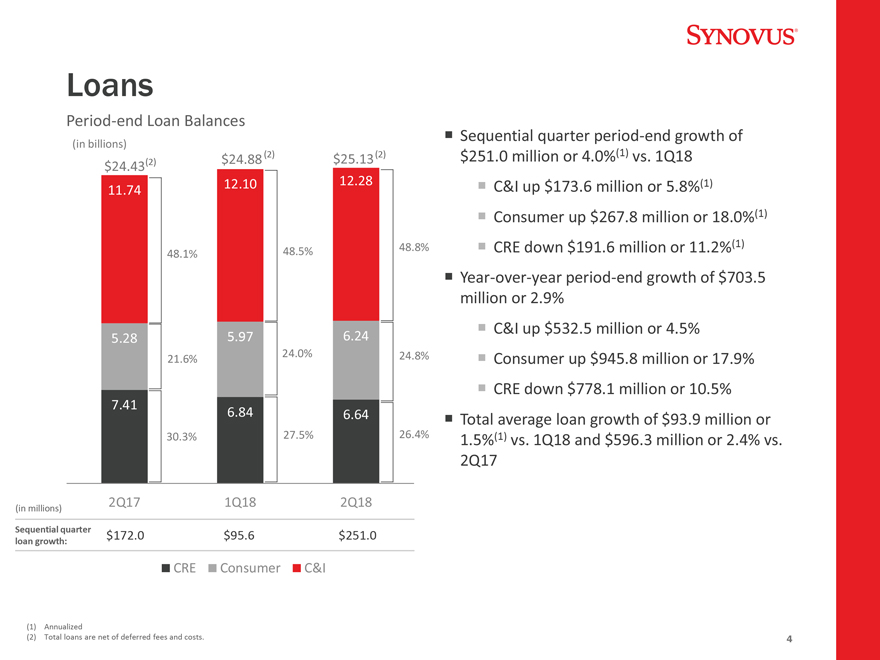
Sequential quarter period-end growth of $251.0 million or 4.0%(1) vs. 1Q18 C&I up $173.6 million or 5.8%(1) Consumer up
$267.8 million or 18.0%(1) CRE down $191.6 million or 11.2%(1) Year-over-year period-end growth of $703.5 million or 2.9% C&I up $532.5 million or 4.5% Consumer up $945.8
million or 17.9% CRE down $778.1 million or 10.5% Total average loan growth of $93.9 million or 1.5%(1) vs. 1Q18 and $596.3 million or 2.4% vs. 2Q17
Sequential quarter $172.0
loan growth:
(in millions)
CRE Consumer C&I
Sequential quarter period-end growth of $251.0 million or 4.0%(1) vs. 1Q18 C&I up $173.6 million or 5.8%(1) Consumer up
$267.8 million or 18.0%(1) CRE down $191.6 million or 11.2%(1) Year-over-year period-end growth of $703.5 million or 2.9% C&I up $532.5 million or 4.5% Consumer up $945.8 million
or 17.9% CRE down $778.1 million or 10.5% Total average loan growth of $93.9 million or 1.5%(1) vs. 1Q18 and $596.3 million or 2.4% vs. 2Q17 Annualized
Total loans are net of deferred fees and costs.
4
Deposits
Total Average Deposits
(in billions)
$24.99 1.38 3.25
0.81
4.84
7.42 7.30 2Q17
$25.79
1.95
3.04
0.81
5.03
7.56
7.39
1Q18
$26.27
1.92 3.18 0.83
5.00 7.79 7.54 2Q18
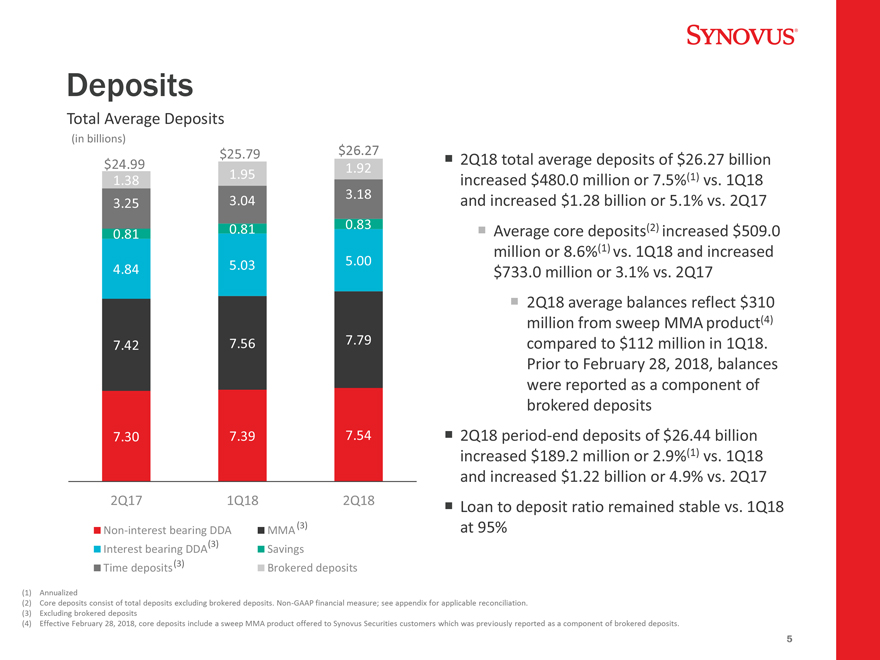
2Q18 total average deposits of $26.27 billion increased $480.0 million or 7.5%(1) vs. 1Q18 and increased $1.28 billion or 5.1% vs. 2Q17 Average core deposits(2)
increased $509.0 million or 8.6%(1) vs. 1Q18 and increased $733.0 million or 3.1% vs. 2Q17 2Q18 average balances reflect $310 million from sweep MMA product(4) compared to $112 million in 1Q18.
Prior to February 28, 2018, balances were reported as a component of brokered deposits 2Q18 period-end deposits of $26.44 billion
increased $189.2 million or 2.9%(1) vs. 1Q18 and increased $1.22 billion or 4.9% vs. 2Q17 Loan to deposit ratio remained stable vs. 1Q18 at 95%
Non-interest bearing DDA
(3)
Interest
bearing DDA Time deposits(3)
MMA(3) Savings
Brokered deposits
(1) Annualized
(2) Core deposits consist of total deposits excluding brokered deposits. Non-GAAP financial measure; see appendix for applicable reconciliation. (3) Excluding brokered deposits
(4) Effective
February 28, 2018, core deposits include a sweep MMA product offered to Synovus Securities customers which was previously reported as a component of brokered deposits.
5
Net interest income
(dollars in millions)
$284.6
$274.3
$251.1
3.86% 3.78%
3.51%
2Q17 1Q18 2Q18 Net Interest Income Net Interest Margin
(1) See slide 23 in the appendix for computation.
(2)
Non-GAAP financial measure; see appendix for applicable reconciliation.
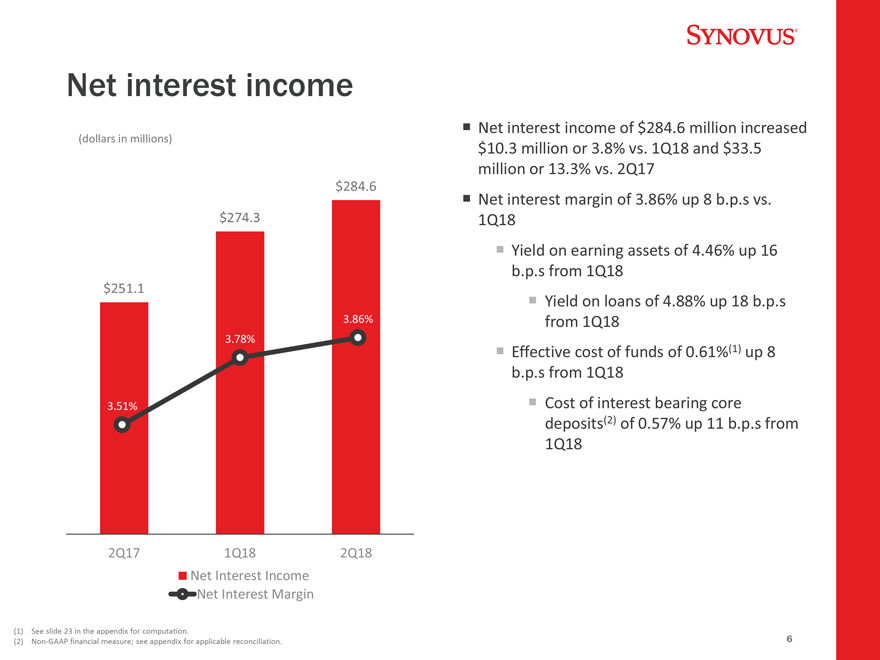
Net interest income of $284.6 million
increased
$10.3 million or 3.8% vs. 1Q18 and $33.5 million or 13.3% vs. 2Q17
Net interest margin of 3.86% up 8 b.p.s vs. 1Q18ï,¡ Yield on earning assets of 4.46% up 16 b.p.s from 1Q18ï,¡ Yield on loans of 4.88% up 18 b.p.s from
1Q18ï,¡ Effective cost of funds of 0.61%(1) up 8 b.p.s from 1Q18ï,¡ Cost of interest bearing core deposits(2) of 0.57% up 11 b.p.s from 1Q18
6
Non-interest income
(in millions)
$73.4
$68.7 6.4
$67.0
5.4 2.8 4.8 5.8 5.0
24.8
20.8 23.3
36.7 35.9 37.4
2Q17 1Q18 2Q18
Other income
Mortgage banking income
Fiduciary/asset management, brokerage, and insurance revenues
Core banking fees(2)
2Q18
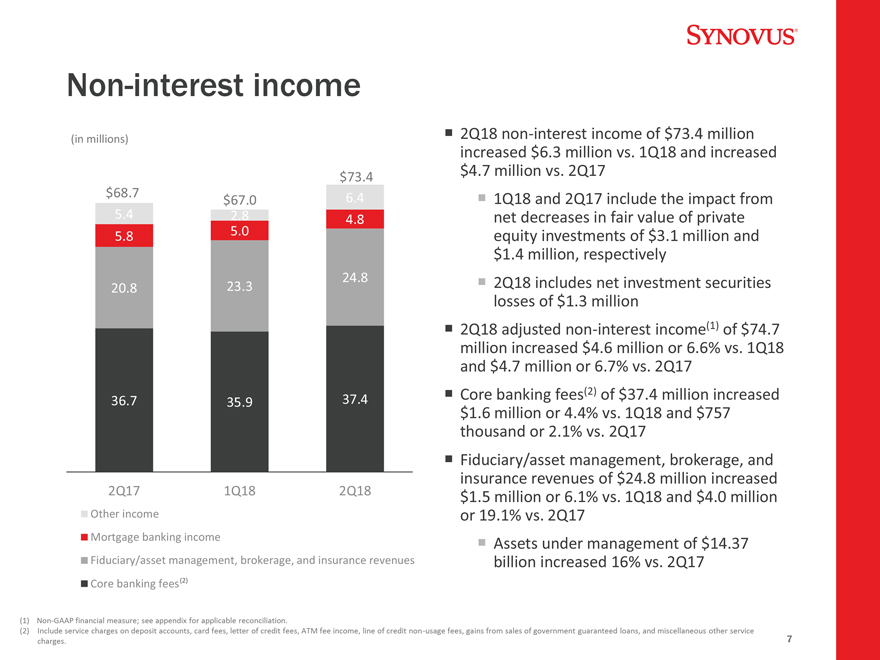
non-interest income of $73.4 million increased $6.3 million vs. 1Q18 and increased $4.7 million vs. 2Q17ï,¡ 1Q18 and 2Q17 include the impact from net decreases in fair value of private
equity investments of $3.1 million and $1.4 million, respectivelyï,¡ 2Q18 includes net investment securities losses of $1.3 million 2Q18 adjusted non-interest income(1) of
$74.7 million increased $4.6 million or 6.6% vs. 1Q18 and $4.7 million or 6.7% vs. 2Q17 Core banking fees(2) of $37.4 million increased $1.6 million or 4.4% vs. 1Q18 and $757 thousand or 2.1% vs. 2Q17 Fiduciary/asset
management, brokerage, and insurance revenues of $24.8 million increased $1.5 million or 6.1% vs. 1Q18 and $4.0 million or 19.1% vs. 2Q17ï,¡ Assets under management of $14.37 billion increased 16% vs. 2Q17
(1) Non-GAAP financial measure; see appendix for applicable reconciliation.
(2) Include service charges on deposit accounts, card fees, letter of credit fees, ATM fee income, line of credit non-usage fees, gains from
sales of government guaranteed loans, and miscellaneous other service charges.
7
Non-interest expense
(dollars in millions)
$204.1 $202.7 $195.2 $197.8 $191.7 $191.4
2Q17 1Q18 2Q18
Reported Adjusted
Efficiency
59.90% 57.16% 56.78% Ratio
Adjusted
Efficiency 59.56% 57.42% 56.41% Ratio(1)
(1) Non-GAAP financial measure; see appendix for applicable reconciliation.
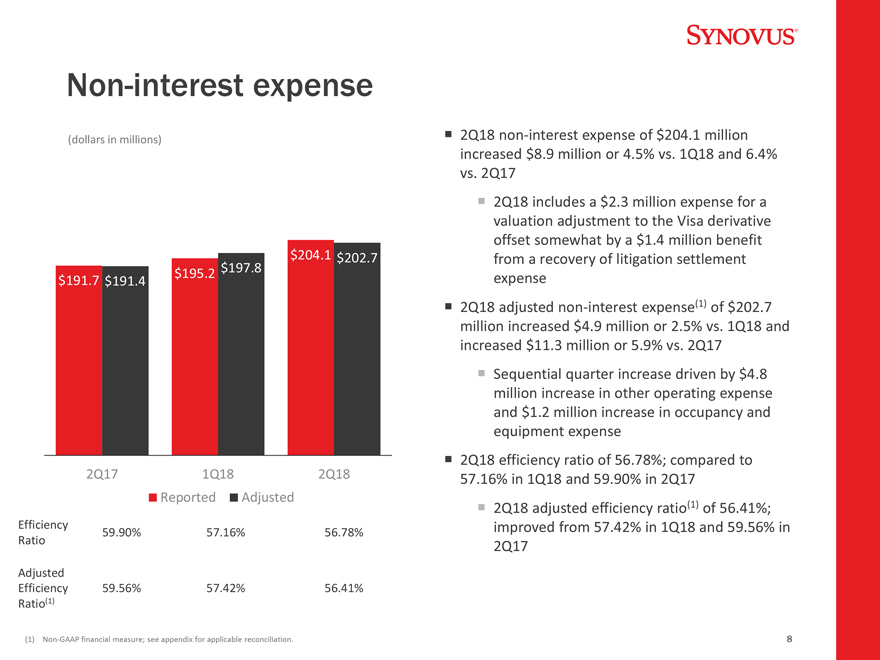
2Q18 non-interest expense of $204.1 million increased $8.9 million or 4.5% vs. 1Q18 and 6.4% vs. 2Q17
2Q18 includes a $2.3 million expense for a valuation adjustment to the Visa derivative offset somewhat by a $1.4 million benefit from a recovery of litigation settlement
expense
2Q18 adjusted non-interest expense(1) of $202.7 million increased $4.9 million or 2.5% vs. 1Q18 and
increased $11.3 million or 5.9% vs. 2Q17
Sequential quarter increase driven by $4.8 million increase in other operating expense and $1.2 million
increase in occupancy and equipment expense
2Q18 efficiency ratio of 56.78%; compared to
57.16% in 1Q18 and 59.90% in 2Q17
2Q18 adjusted efficiency ratio(1) of 56.41%; improved from
57.42% in 1Q18 and 59.56% in 2Q17
8
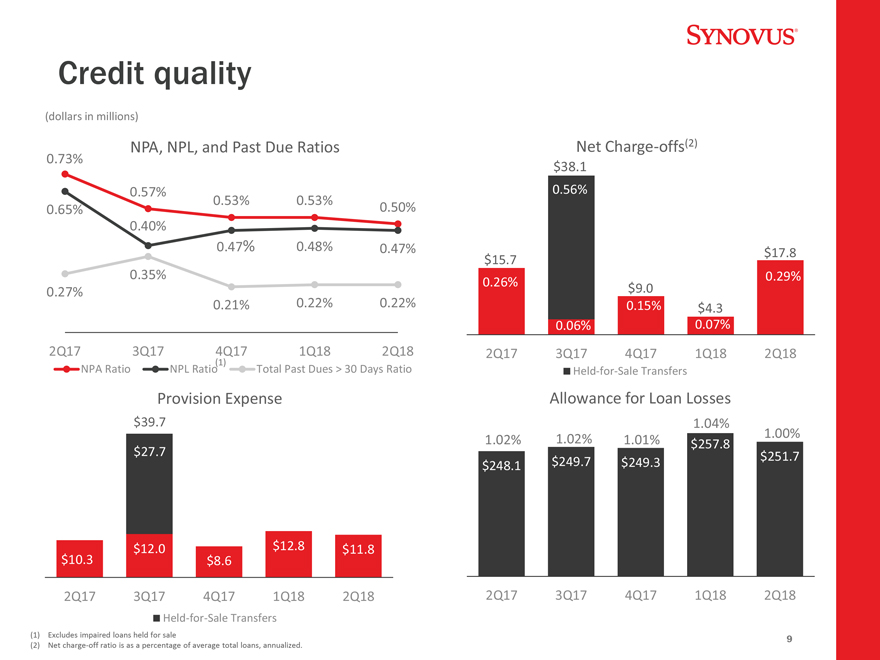
Credit quality
(dollars in millions)
0.73% NPA, NPL, and Past Due Ratios
0.57%
0.53% 0.53% (2) 0.65% 0.50% 0.40% 0.47% 0.48% 0.47% 0.35% 0.27% 0.22% 0.22% 0.21%
2Q17 3Q17
4Q17 1Q18 2Q18
(1)
NPA Ratio NPL Ratio Total Past Dues > 30 Days Ratio
Provision Expense
$39.7
$27.7
$27.7
$12.0 $12.8 $11.8
$10.3 $8.6
2Q17 3Q17 4Q17 1Q18 2Q18
Held-for-Sale Transfers
(1) Excludes impaired loans held for sale
(2) Net
charge-off ratio is as a percentage of average total loans, annualized.
Net Charge-offs(2)
$38.1
0.56% 0.56%
$17.8 $15.7
0.29%
0.26%
$9.0
0.15% 0. $15% 4.3
0.06% 0.07%
2Q17 3Q17 4Q17 1Q18 2Q18
Held-for-Sale Transfers
Allowance for Loan Losses
1.04%
1.00%
1.02% 1.02% 1.01% $257.8 $249.7 $251.7 $248.1 $249.3
2Q17 3Q17 4Q17 1Q18 2Q18
9
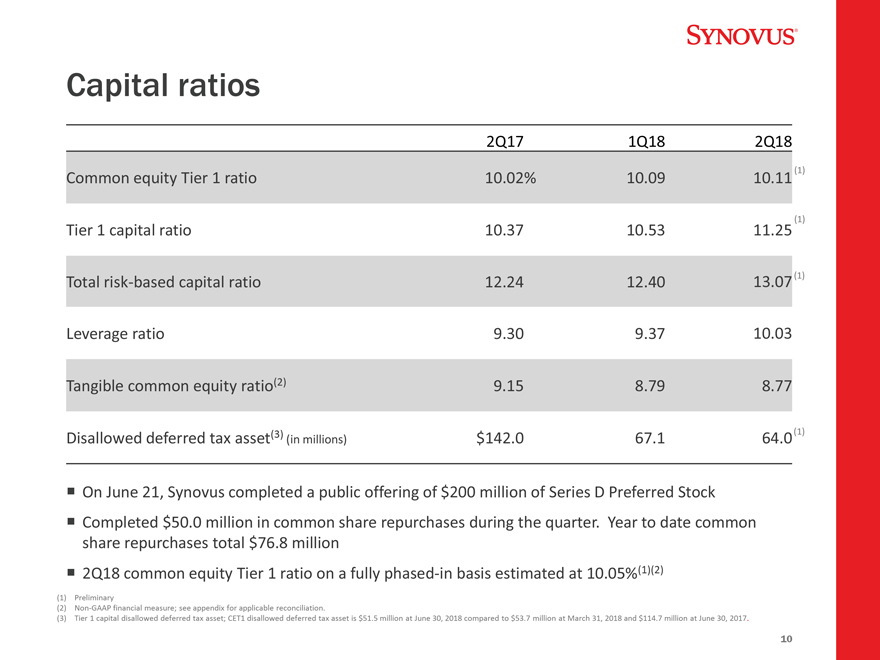
Capital ratios
2Q17 1Q18 2Q18
(1)
Common equity Tier 1 ratio 10.02% 10.09 10.11
Tier 1 capital ratio 10.37 10.53 11.25(1)
Total risk-based capital ratio 12.24 12.40 13.07(1)
Leverage ratio 9.30 9.37 10.03
Tangible common equity ratio(2) 9.15 8.79 8.77
tax (3) (1) Disallowed deferred asset (in millions) $142.0 67.1 64.0
On
June 21, Synovus completed a public offering of $200 million of Series D Preferred Stock Completed $50.0 million in common share repurchases during the quarter. Year to date common share repurchases total $76.8
million 2Q18 common equity Tier 1 ratio on a fully phased-in basis estimated at 10.05%(1)(2)
(1)
Preliminary
(2) Non-GAAP financial measure; see appendix for applicable reconciliation.
(3) Tier 1 capital disallowed deferred tax asset; CET1 disallowed deferred tax asset is $51.5 million at June 30, 2018 compared to $53.7 million at March 31,
2018 and $114.7 million at June 30, 2017.
10
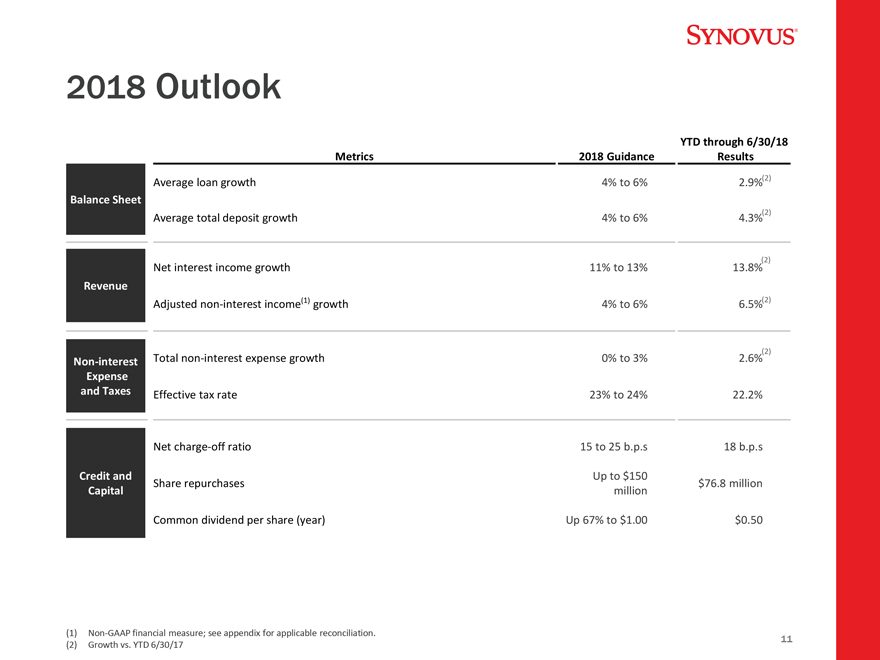
2018 Outlook
Balance Sheet
Revenue
Non-interest Expense and Taxes
Credit and Capital
Metrics
Average loan growth
Average total deposit growth
Net interest income growth
Adjusted non-interest
income(1) growth
Total non-interest expense growth
Effective tax rate
Net charge-off ratio
Share repurchases
Common dividend per share (year)
2018 Guidance
4% to 6%
4% to 6%
11% to 13%
4% to 6%
0% to 3%
23% to 24%
15 to 25 b.p.s
Up to $150 million
Up 67% to $1.00
YTD through 6/30/18 Results
2.9%(2)
(2)
4.3%
13.8%(2) 6.5%(2)
(2)
2.6%
22.2%
18 b.p.s
$76.8 million $0.50
(1) Non-GAAP financial measure; see appendix for applicable reconciliation. (2) Growth vs. YTD 6/30/17
11

Appendix
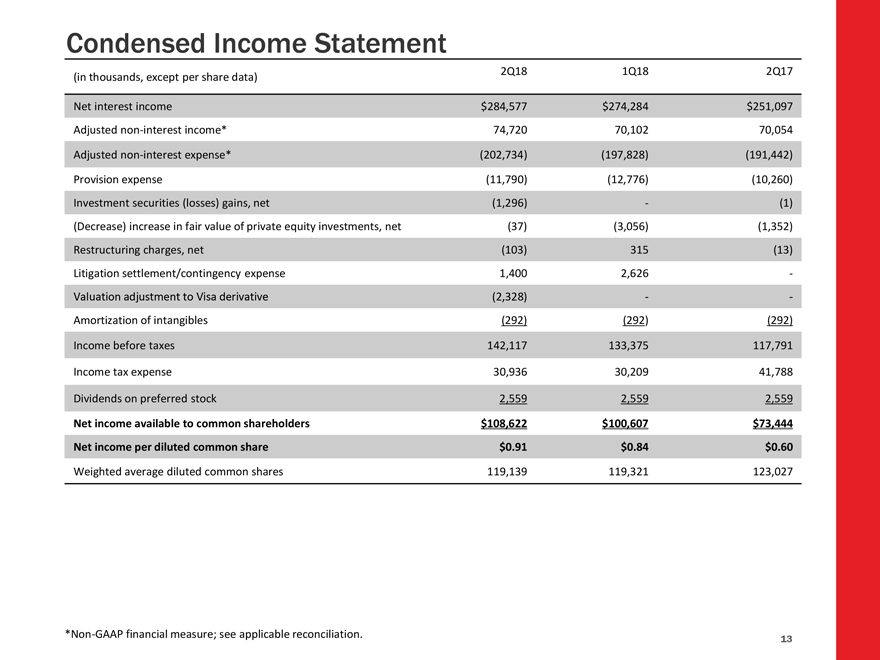
Condensed Income Statement
(in thousands, except
per share data)
Net interest income
Adjusted
non-interest income* Adjusted non-interest expense* Provision expense Investment securities (losses) gains, net
(Decrease) increase in fair value of private equity investments, net Restructuring charges, net Litigation settlement/contingency expense Valuation adjustment to Visa derivative
Amortization of intangibles Income before taxes Income tax expense Dividends on preferred stock
Net income available to common shareholders
Net income per diluted common share
Weighted average diluted common shares
2Q18
$284,577 74,720 (202,734) (11,790) (1,296) (37) (103) 1,400 (2,328) (292) 142,117 30,936
2,559 $108,622 $0.91
119,139
1Q18
$274,284 70,102 (197,828) (12,776) -(3,056) 315 2,626 -(292) 133,375 30,209 2,559 $100,607 $0.84
119,321
2Q17
$251,097 70,054 (191,442) (10,260) (1) (1,352) (13) --(292) 117,791 41,788 2,559 $73,444 $0.60
123,027
*Non-GAAP financial measure;
see applicable reconciliation.
13
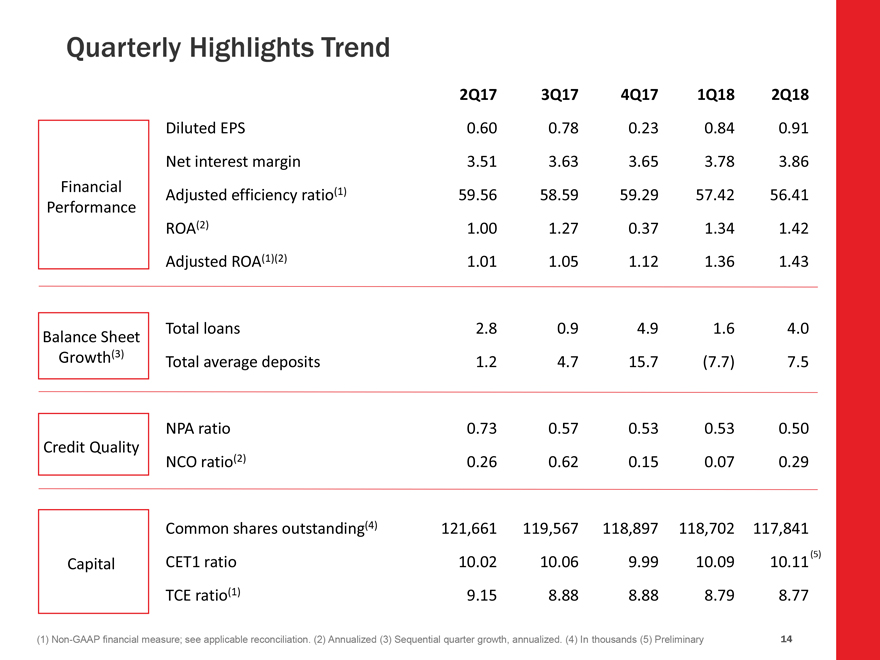
Quarterly Highlights Trend
Financial Performance
Balance Sheet Growth(3)
Credit Quality
Capital
Diluted EPS Net interest margin Adjusted efficiency ratio(1) ROA(2) Adjusted ROA(1)(2)
Total loans
Total average deposits
NPA ratio
NCO ratio(2)
Common shares outstanding(4) CET1 ratio TCE ratio(1)
2Q17
0.60 3.51 59.56 1.00 1.01
2.8
1.2
0.73
0.26
121,661 10.02 9.15
3Q17 4Q17 1Q18 2Q18
0.78 0.23 0.840.91
3.63 3.65 3.783.86
58.59 59.29
57.4256.41
1.27 0.37 1.341.42
1.05 1.12 1.361.43
0.9 4.9
1.64.0
4.7 15.7 (7.7)7.5
0.57 0.53 0.530.50
0.62 0.15
0.070.29
119,567 118,897 118,702117,841
10.06 9.99 10.0910.11 (5)
8.88 8.88 8.798.77
(1)
Non-GAAP financial measure; see applicable reconciliation. (2) Annualized (3) Sequential quarter growth, annualized. (4) In thousands (5) Preliminary
14
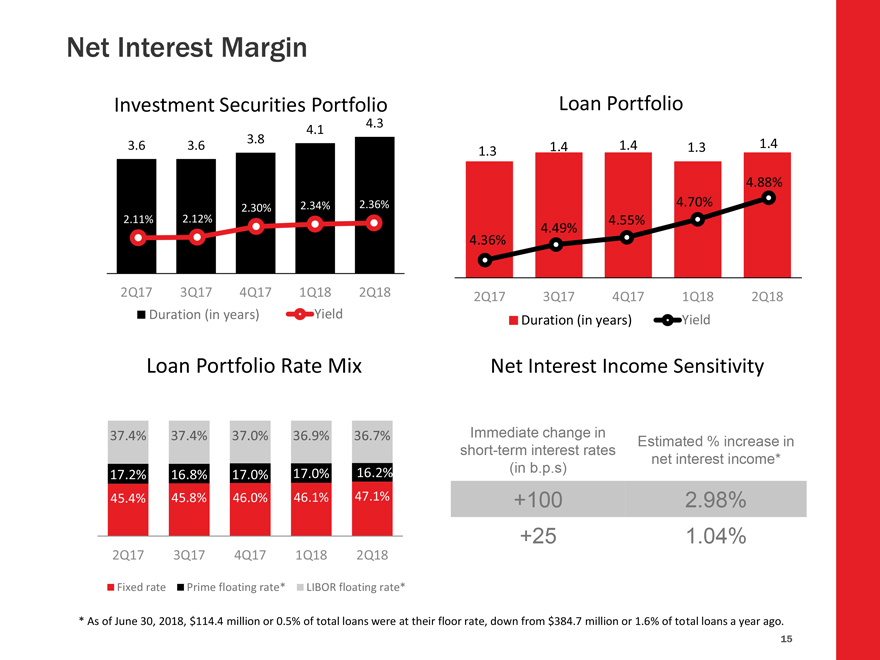
Net Interest Margin
Investment Securities
Portfolio
4.3 4.1 3.8 3.6 3.6
2.30% 2.34% 2.36% 2.11% 2.12%
2Q17 3Q17 4Q17 1Q18 2Q18 Duration (in years) Yield
Loan Portfolio Rate Mix
37.4% 37.4% 37.0% 36.9% 36.7%
17.2% 16.8% 17.0% 17.0% 16.2%
45.4% 45.8% 46.0% 46.1% 47.1%
2Q17 3Q17 4Q17 1Q18 2Q18
Fixed rate Prime floating rate* LIBOR floating rate*
Loan Portfolio
1.4 1.4 1.3 1.4 1.3
4.88% 4.70% 4.55% 4.49% 4.36%
2Q17 3Q17 4Q17 1Q18 2Q18 Duration (in years) Yield
Net Interest Income Sensitivity
Immediate change in
Estimated % increase in short-term interest rates net interest income* (in
b.p.s)
+100 2.98%
+25 1.04%
* As of June 30, 2018, $114.4 million or 0.5% of total loans were at their floor rate, down from $384.7 million or 1.6% of total loans a year ago.
15
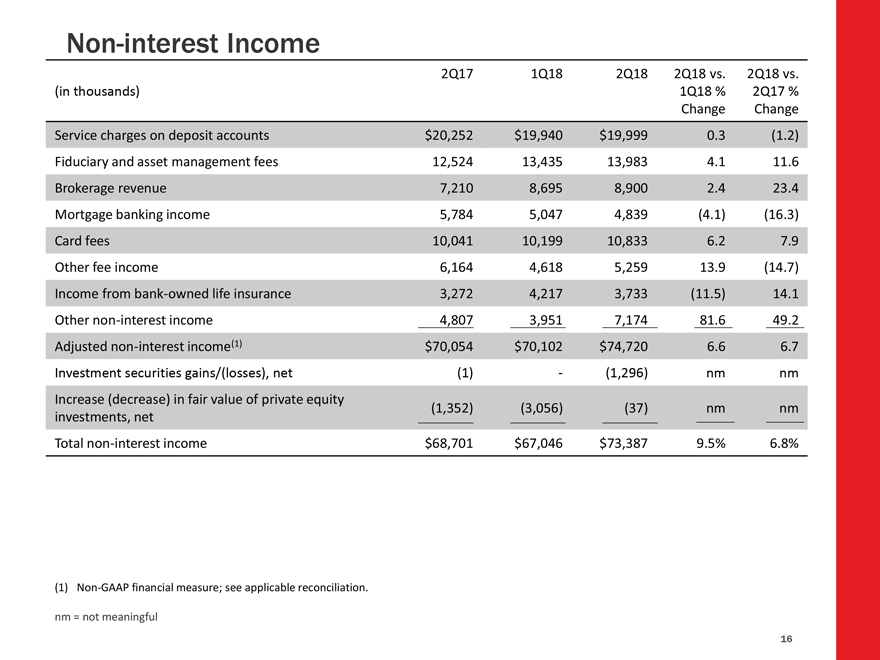
Non-interest Income
(in thousands)
Service charges on deposit accounts Fiduciary and asset management fees
Brokerage revenue Mortgage banking income Card fees Other fee income Income from bank-owned life insurance Other non-interest income Adjusted non-interest income(1)
Investment securities gains/(losses), net
Increase (decrease) in fair value
of private equity investments, net
Total non-interest income
2Q17 1Q18 2Q182Q18 vs.2Q18 vs.
1Q18 %2Q17 %
ChangeChange
$20,252 $19,940 $19,9990.3(1.2)
12,524 13,435 13,9834.111.6
7,210 8,695
8,9002.423.4
5,784 5,047 4,839(4.1)(16.3)
10,041 10,199 10,8336.27.9
6,164 4,618 5,25913.9(14.7)
3,272 4,217 3,733(11.5)14.1
4,807 3,951 7,17481.649.2
$70,054 $70,102 $74,7206.66.7
(1) - (1,296)nmnm
(1,352) (3,056) (37)nmnm
$68,701 $67,046 $73,3879.5%6.8%
(1) Non-GAAP financial measure; see applicable reconciliation.
nm = not meaningful
16
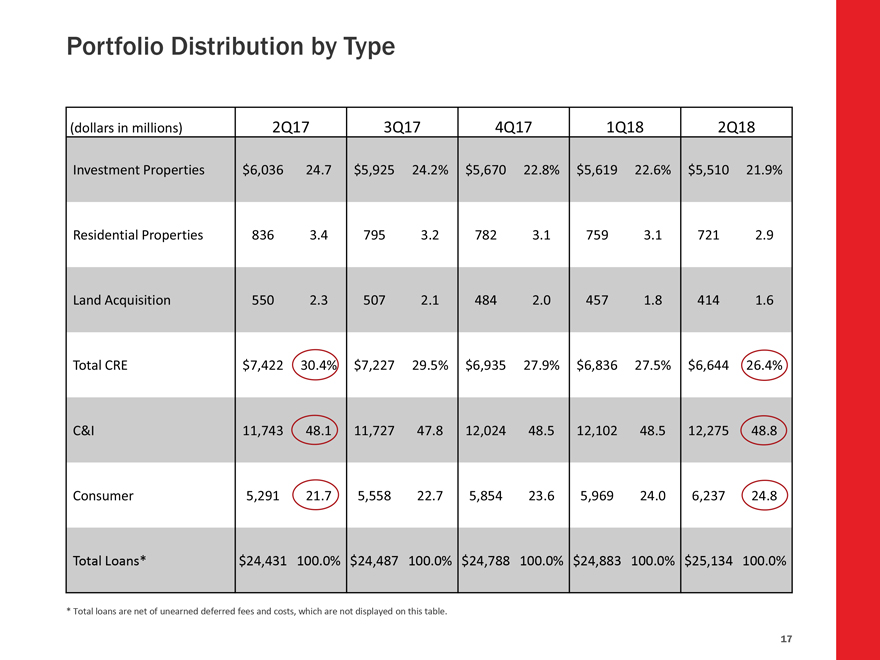
Portfolio Distribution by Type
(dollars in
millions) 2Q17 3Q174Q171Q182Q18
Investment Properties $6,036 24.7$5,92524.2%$5,67022.8%$5,61922.6%$5,51021.9%
Residential Properties 836 3.47953.27823.17593.17212.9
Land Acquisition 550 2.35072.14842.04571.84141.6
Total
CRE $7,422 30.4%$7,22729.5%$6,93527.9%$6,83627.5%$6,64426.4%
C&I 11,743
48.111,72747.812,02448.512,10248.512,27548.8
Consumer 5,291 21.75,55822.75,85423.65,96924.06,23724.8
Total Loans* $24,431 100.0%$24,487100.0%$24,788100.0%$24,883100.0%$25,134100.0%
* Total loans are net of unearned deferred fees and costs, which are not displayed on this table.
17
Commercial Real Estate
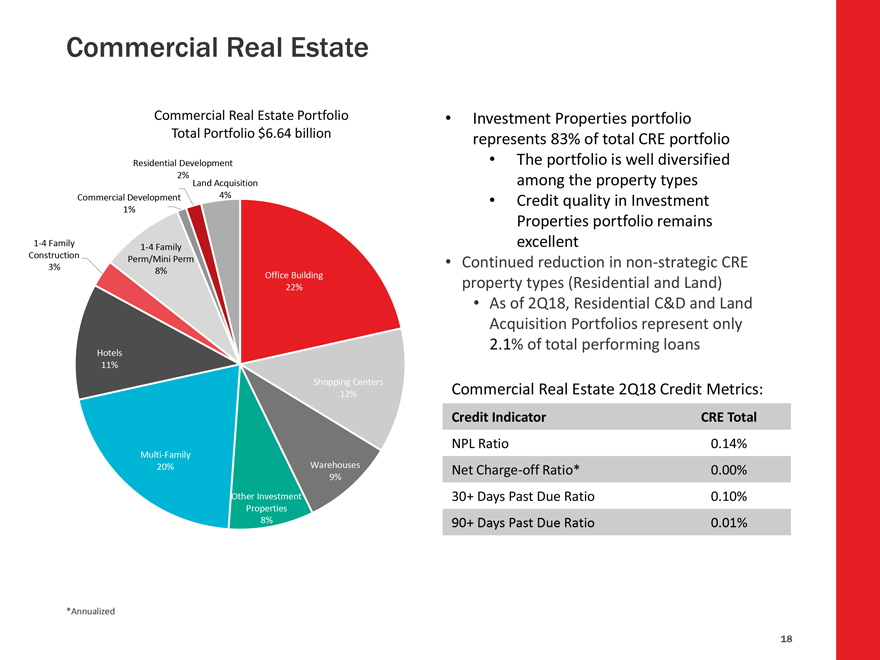
Commercial Real Estate
Portfolio Total Portfolio $6.64 billion
Residential Development
2% Land
Acquisition Commercial Development 4% 1%
1-4 Family
1-4 Family Construction
3% Perm/Mini Perm 8%
Office Building 22%
Hotels 11%
Shopping Centers 12%
Multi-Family
20% Warehouses 9%
Other Investment Properties 8%
*Annualized
• Investment Properties portfolio represents 83% of total CRE portfolio
• The portfolio is well diversified among the property types
•
Credit quality in Investment Properties portfolio remains excellent
• Continued reduction in non-strategic CRE
property types (Residential and Land)
• As of 2Q18, Residential C&D and Land Acquisition Portfolios represent only 2.1% of total performing loans
Commercial Real Estate 2Q18 Credit Metrics:
Credit
Indicator CRE Total
NPL Ratio 0.14%
Net Charge-off Ratio* 0.00%
30+
Days Past Due Ratio 0.10%
90+ Days Past Due Ratio 0.01%
18
Commercial Real Estate 2Q18 Credit Metrics:
Credit
Indicator CRE Total
NPL Ratio 0.14%
Net Charge-off Ratio* 0.00%
30+
Days Past Due Ratio 0.10%
90+ Days Past Due Ratio 0.01%
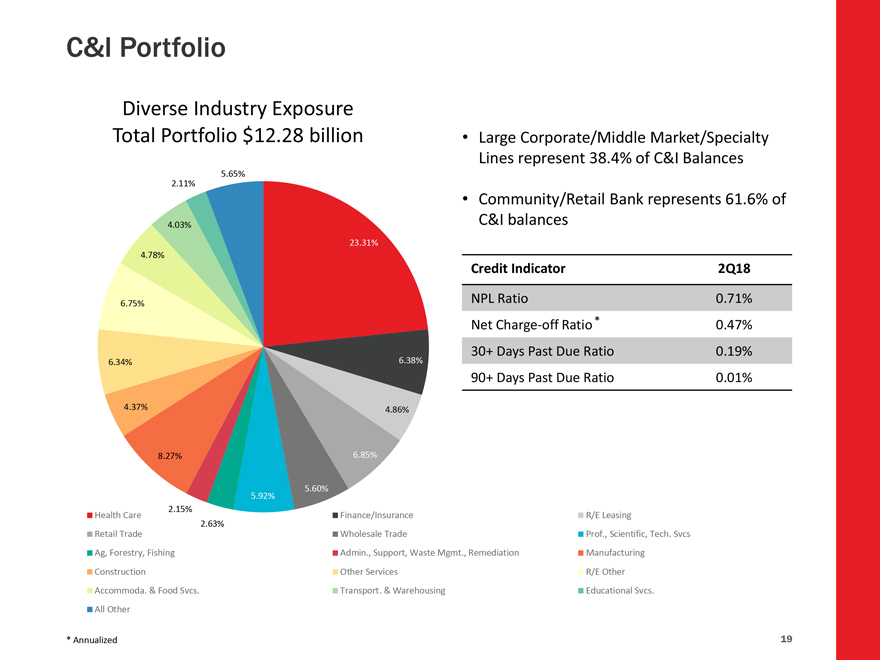
5.65%
2.11%
4.03%
23.31%
4.78%
6.75%
6.34% 6.38%
4.37% 4.86%
8.27% 6.85%
5.92% 5.60%
2.15%
2.63%
2.15%
Health Care Retail Trade Ag, Forestry, Fishing Construction Accommoda. & Food Svcs.
All Other
* Annualized
Finance/Insurance
Wholesale Trade
Admin., Support, Waste Mgmt., Remediation Other Services Transport. &
Warehousing
R/E Leasing
Prof., Scientific, Tech. Svcs Manufacturing R/E Other
Educational Svcs.
• Large Corporate/Middle Market/Specialty Lines represent 38.4% of C&I Balances
• Community/Retail Bank represents 61.6% of C&I balances
Credit
Indicator 2Q18
NPL Ratio 0.71%
Net Charge-off Ratio * 0.47%
30+ Days Past Due Ratio 0.19%
90+ Days Past Due
Ratio 0.01%
19
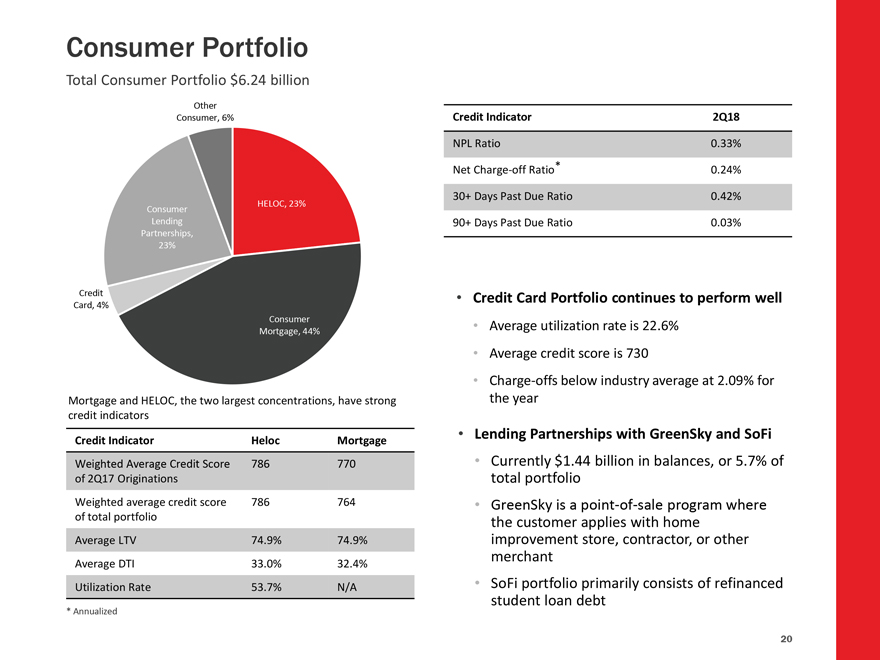
Consumer Portfolio
Total Consumer Portfolio
$6.24 billion
Other Consumer, 6%
HELOC, 23% Consumer Lending
Partnerships, 23%
Credit Card, 4%
Consumer Mortgage, 44%
Mortgage and HELOC, the two largest concentrations, have strong
credit
indicators
Credit Indicator Heloc Mortgage
Weighted Average Credit Score 786 770
of 2Q17
Originations
Weighted average credit score 786 764
of total portfolio
Average LTV 74.9% 74.9%
Average DTI 33.0% 32.4%
Utilization
Rate 53.7% N/A
* Annualized
Credit Indicator 2Q18
NPL
Ratio 0.33%
Net Charge-off Ratio * 0.24%
30+ Days Past Due Ratio 0.42%
90+ Days Past Due
Ratio 0.03%
• Credit Card Portfolio continues to perform well
• Average utilization rate is 22.6%
• Average credit score is 730
• Charge-offs below industry average at 2.09% for the year
• Lending Partnerships
with GreenSky and SoFi
• Currently $1.44 billion in balances, or 5.7% of total portfolio
• GreenSky is a point-of-sale program where the customer applies with home improvement store,
contractor, or other merchant
• SoFi portfolio primarily consists of refinanced student loan debt
20
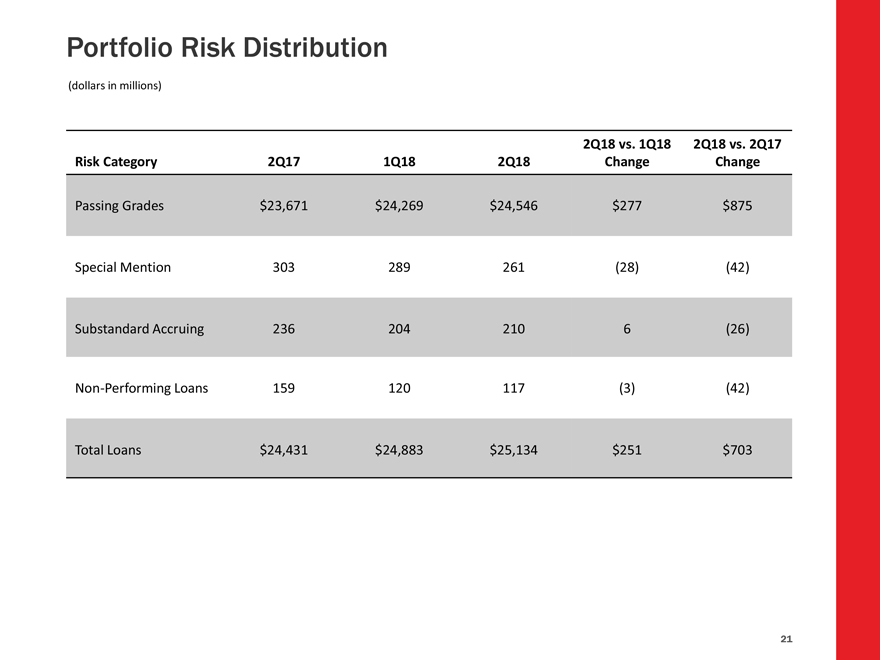
Portfolio Risk Distribution (dollars in millions) 2Q18 vs. 1Q18 2Q18 vs. 2Q17 Risk Category 2Q17 1Q18 2Q18 Change Change Passing Grades $23,671 $24,269 $24,546 $277 $875 Special Mention 303 289 261 (28) (42) Substandard Accruing 236 204 210 6 (26) Non-Performing Loans 159 120 117 (3) (42) Total Loans $24,431 $24,883 $25,134 $251 $703
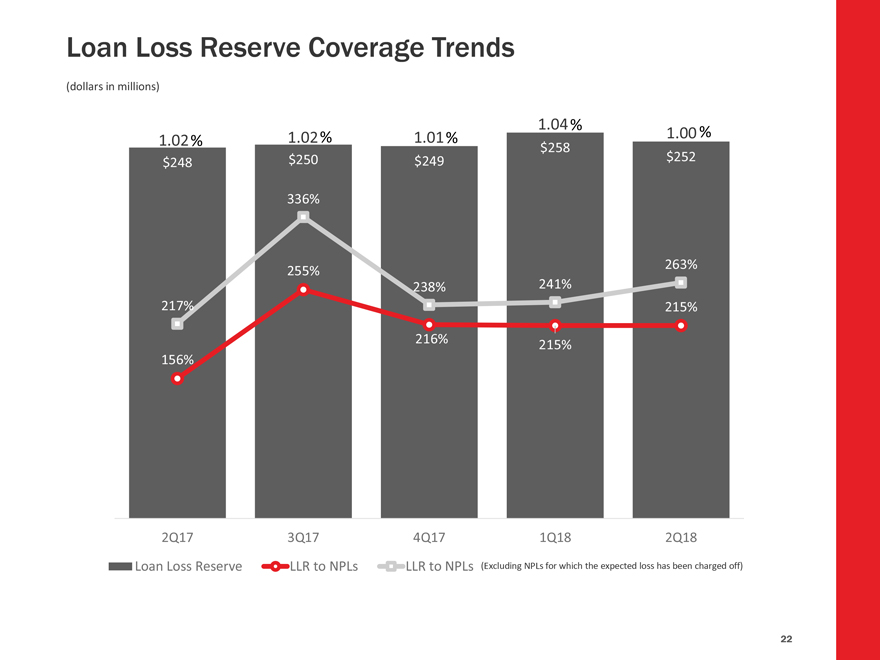
Loan Loss Reserve Coverage Trends (dollars in millions) 1.04% 1.02% 1.01% 1.00 % 1.02% $258 $250 $249 $252 $248 336% 263% 255% 238% 241% 217% 215% 216% 215% 156% 2Q17 3Q17 4Q17 1Q18 2Q18 Loan Loss Reserve LLR to NPLs LLR to NPLs (Excluding NPLs for which the expected loss has been charged off)
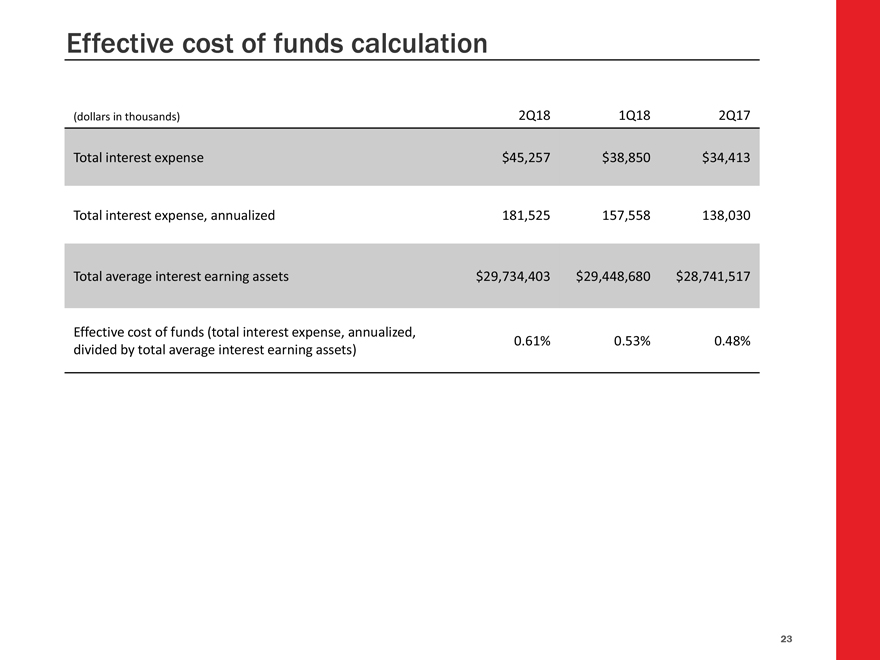
Effective cost of funds calculation (dollars in thousands) 2Q18 1Q18 2Q17 Total interest expense $45,257 $38,850 $34,413 Total interest expense, annualized 181,525 157,558 138,030 Total average interest earning assets $29,734,403 $29,448,680 $28,741,517 Effective cost of funds (total interest expense, annualized, 0.61% 0.53% 0.48% divided by total average interest earning assets)
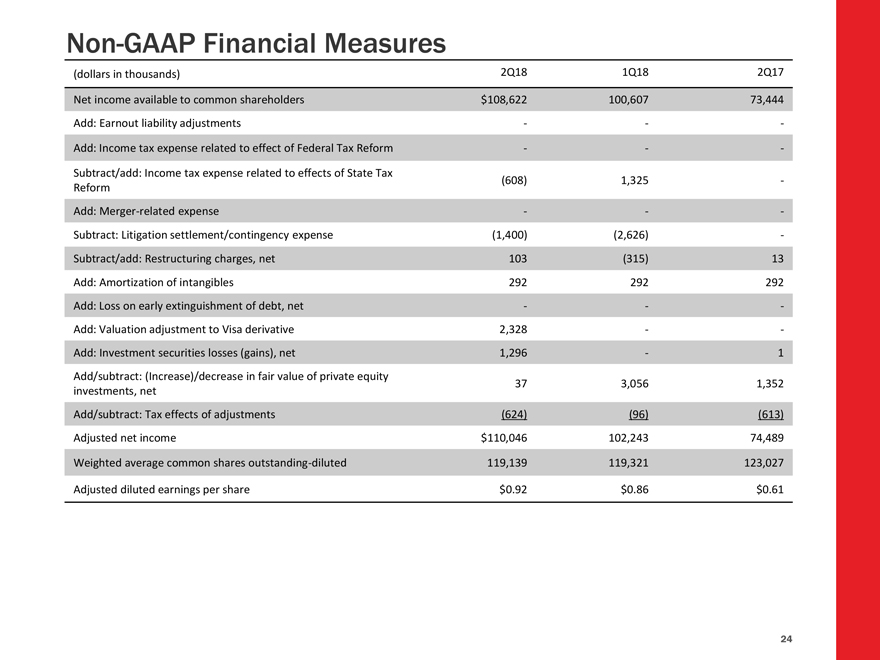
Non-GAAP Financial Measures (dollars in thousands) 2Q18 1Q18 2Q17 Net income available to common shareholders $108,622 100,607 73,444 Add: Earnout liability adjustments —Add: Income tax expense related to effect of Federal Tax Reform — Subtract/add: Income tax expense related to effects of State Tax (608) 1,325 -Reform Add: Merger-related expense —Subtract: Litigation settlement/contingency expense (1,400) (2,626) -Subtract/add: Restructuring charges, net 103 (315) 13 Add: Amortization of intangibles 292 292 292 Add: Loss on early extinguishment of debt, net —Add: Valuation adjustment to Visa derivative 2,328 —Add: Investment securities losses (gains), net 1,296—1 Add/subtract: (Increase)/decrease in fair value of private equity 37 3,056 1,352 investments, net Add/subtract: Tax effects of adjustments (624) (96) (613) Adjusted net income $110,046 102,243 74,489 Weighted average common shares outstanding-diluted 119,139 119,321 123,027 Adjusted diluted earnings per share $0.92 $0.86 $0.61
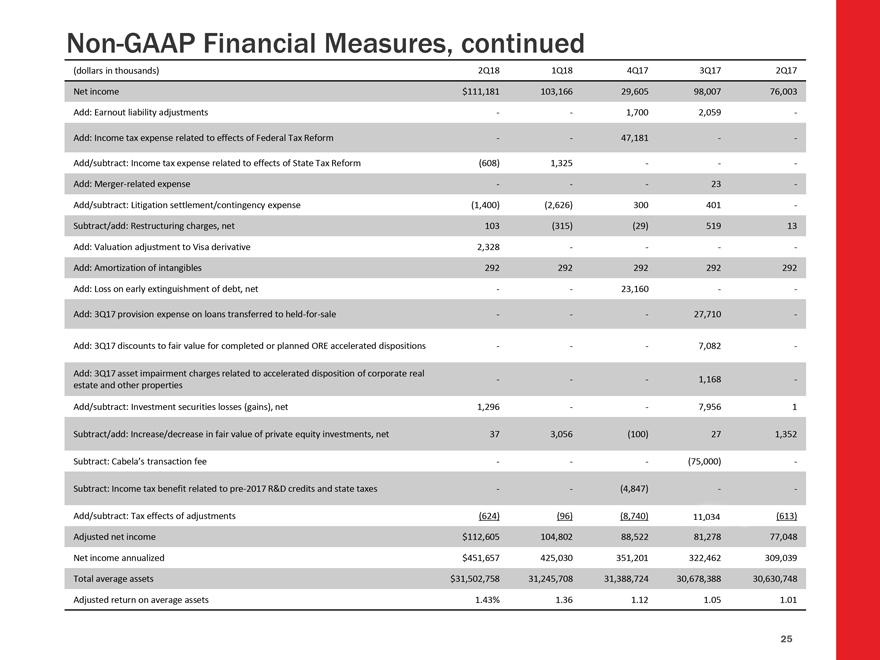
Non-GAAP Financial Measures, continued (dollars in thousands) 2Q18 1Q18 4Q17 3Q17 2Q17 Net income $111,181 103,166 29,605 98,007 76,003 Add: Earnout liability adjustments — 1,700 2,059—Add: Income tax expense related to effects of Federal Tax Reform — 47,181 — Add/subtract: Income tax expense related to effects of State Tax Reform (608) 1,325 —Add: Merger-related expense — 23 -Add/subtract: Litigation settlement/contingency expense (1,400) (2,626) 300 401 -Subtract/add: Restructuring charges, net 103 (315) (29) 519 13 Add: Valuation adjustment to Visa derivative 2,328 — -Add: Amortization of intangibles 292 292 292 292 292 Add: Loss on early extinguishment of debt, net — 23,160 — Add: 3Q17 provision expense on loans transferred to held-for-sale — 27,710—Add: 3Q17 discounts to fair value for completed or planned ORE accelerated dispositions — 7,082—Add: 3Q17 asset impairment charges related to accelerated disposition of corporate real — 1,168 -estate and other properties Add/subtract: Investment securities losses (gains), net 1,296 — 7,956 1 Subtract/add: Increase/decrease in fair value of private equity investments, net 37 3,056 (100) 27 1,352 Subtract: Cabela’s transaction fee — (75,000) -Subtract: Income tax benefit related to pre-2017 R&D credits and state taxes — (4,847) — Add/subtract: Tax effects of adjustments (624) (96) (8,740) 11,034 (613) Adjusted net income $112,605 104,802 88,522 81,278 77,048 Net income annualized $451,657 425,030 351,201 322,462 309,039 Total average assets $31,502,758 31,245,708 31,388,724 30,678,388 30,630,748 Adjusted return on average assets 1.43% 1.36 1.12 1.05 1.01
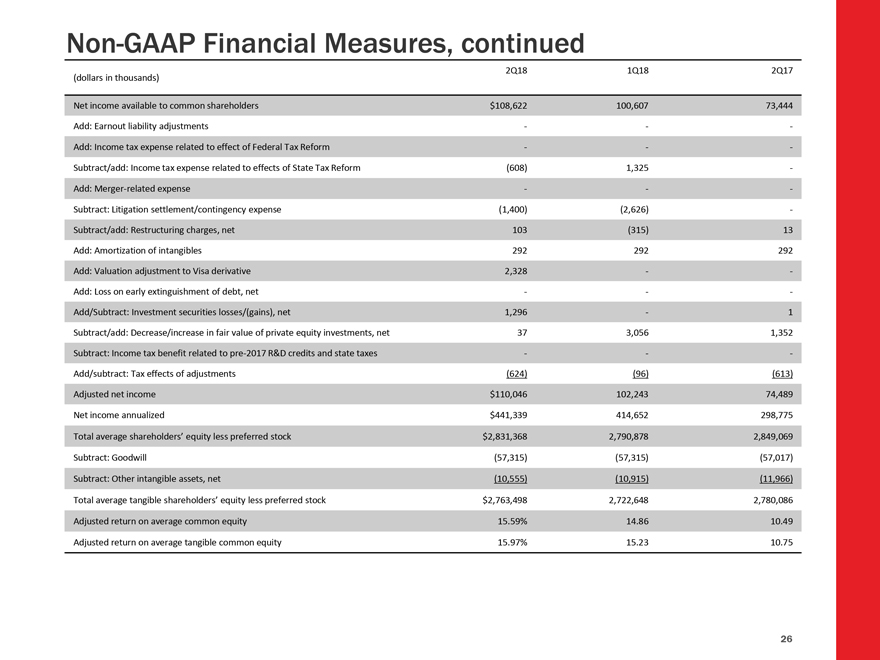
Non-GAAP Financial Measures, continued (dollars in thousands) 2Q18 1Q18 2Q17 Net income available to common shareholders $108,622 100,607 73,444 Add: Earnout liability adjustments —Add: Income tax expense related to effect of Federal Tax Reform —Subtract/add: Income tax expense related to effects of State Tax Reform (608) 1,325 -Add: Merger-related expense —Subtract: Litigation settlement/contingency expense (1,400) (2,626) -Subtract/add: Restructuring charges, net 103 (315) 13 Add: Amortization of intangibles 292 292 292 Add: Valuation adjustment to Visa derivative 2,328 —Add: Loss on early extinguishment of debt, net —Add/Subtract: Investment securities losses/(gains), net 1,296—1 Subtract/add: Decrease/increase in fair value of private equity investments, net 37 3,056 1,352 Subtract: Income tax benefit related to pre-2017 R&D credits and state taxes —Add/subtract: Tax effects of adjustments (624) (96) (613) Adjusted net income $110,046 102,243 74,489 Net income annualized $441,339 414,652 298,775 Total average shareholders? equity less preferred stock $2,831,368 2,790,878 2,849,069 Subtract: Goodwill (57,315) (57,315) (57,017) Subtract: Other intangible assets, net (10,555) (10,915) (11,966) Total average tangible shareholders’ equity less preferred stock $2,763,498 2,722,648 2,780,086 Adjusted return on average common equity 15.59% 14.86 10.49 Adjusted return on average tangible common equity 15.97% 15.23 10.75
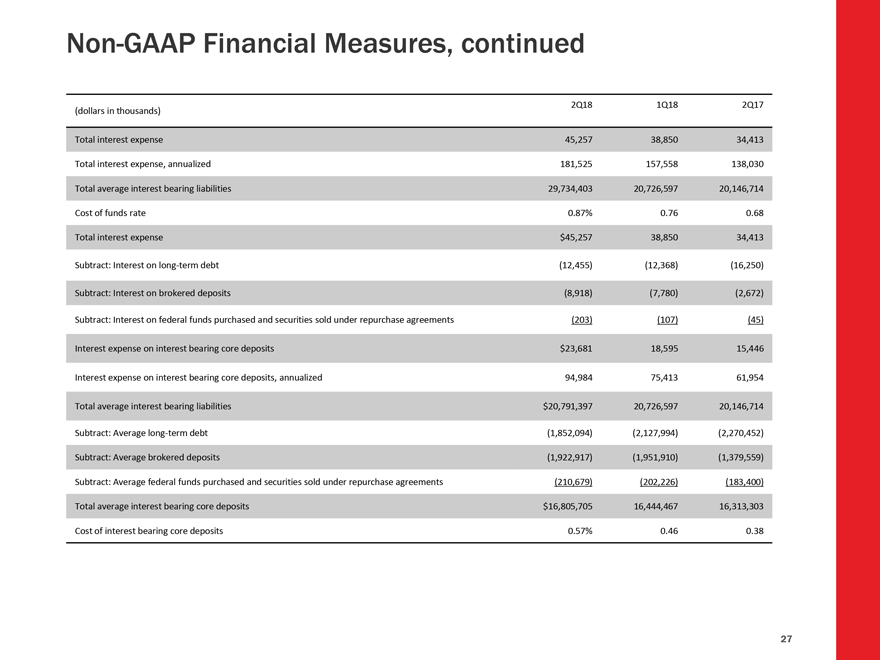
Non-GAAP Financial Measures, continued 2Q18 1Q18 2Q17 (dollars in thousands) Total interest expense 45,257 38,850 34,413 Total interest expense, annualized 181,525 157,558 138,030 Total average interest bearing liabilities 29,734,403 20,726,597 20,146,714 Cost of funds rate 0.87% 0.76 0.68 Total interest expense $45,257 38,850 34,413 Subtract: Interest on long-term debt (12,455) (12,368) (16,250) Subtract: Interest on brokered deposits (8,918) (7,780) (2,672) Subtract: Interest on federal funds purchased and securities sold under repurchase agreements (203) (107) (45) Interest expense on interest bearing core deposits $23,681 18,595 15,446 Interest expense on interest bearing core deposits, annualized 94,984 75,413 61,954 Total average interest bearing liabilities $20,791,397 20,726,597 20,146,714 Subtract: Average long-term debt (1,852,094) (2,127,994) (2,270,452) Subtract: Average brokered deposits (1,922,917) (1,951,910) (1,379,559) Subtract: Average federal funds purchased and securities sold under repurchase agreements (210,679) (202,226) (183,400) Total average interest bearing core deposits $16,805,705 16,444,467 16,313,303 Cost of interest bearing core deposits 0.57% 0.46 0.38
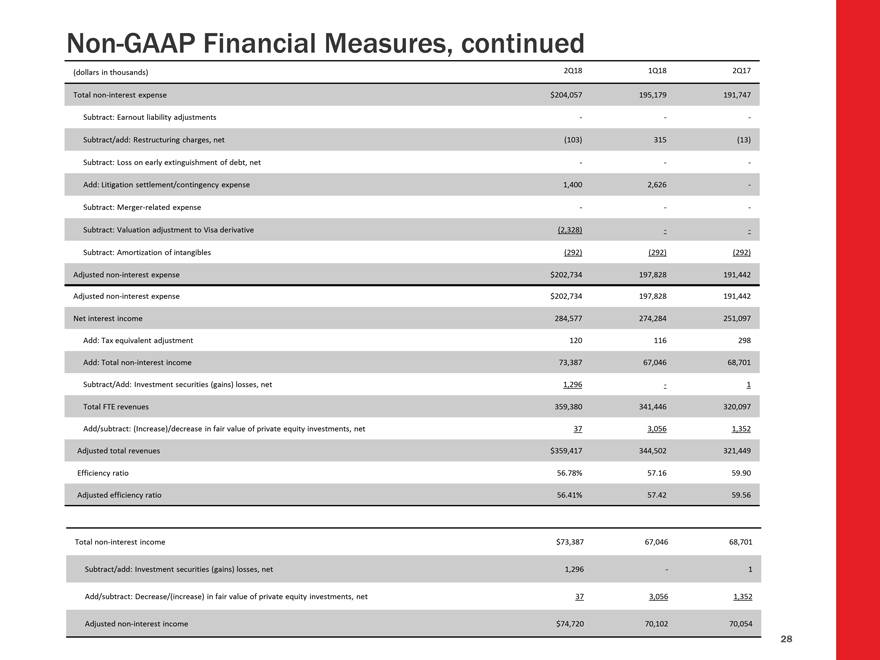
Non-GAAP Financial Measures, continued (dollars in thousands) 2Q18 1Q18 2Q17 Total non-interest expense $204,057 195,179 191,747 Subtract: Earnout liability adjustments —Subtract/add: Restructuring charges, net (103) 315 (13) Subtract: Loss on early extinguishment of debt, net —Add: Litigation settlement/contingency expense 1,400 2,626 -Subtract: Merger-related expense —Subtract: Valuation adjustment to Visa derivative (2,328) —Subtract: Amortization of intangibles (292) (292) (292) Adjusted non-interest expense $202,734 197,828 191,442 Adjusted non-interest expense $202,734 197,828 191,442 Net interest income 284,577 274,284 251,097 Add: Tax equivalent adjustment 120 116 298 Add: Total non-interest income 73,387 67,046 68,701 Subtract/Add: Investment securities (gains) losses, net 1,296—1 Total FTE revenues 359,380 341,446 320,097 Add/subtract: (Increase)/decrease in fair value of private equity investments, net 37 3,056 1,352 Adjusted total revenues $359,417 344,502 321,449 Efficiency ratio 56.78% 57.16 59.90 Adjusted efficiency ratio 56.41% 57.42 59.56 Total non-interest income $73,387 67,046 68,701 Subtract/add: Investment securities (gains) losses, net 1,296—1 Add/subtract: Decrease/(increase) in fair value of private equity investments, net 37 3,056 1,352 Adjusted non-interest income $74,720 70,102 70,054 28
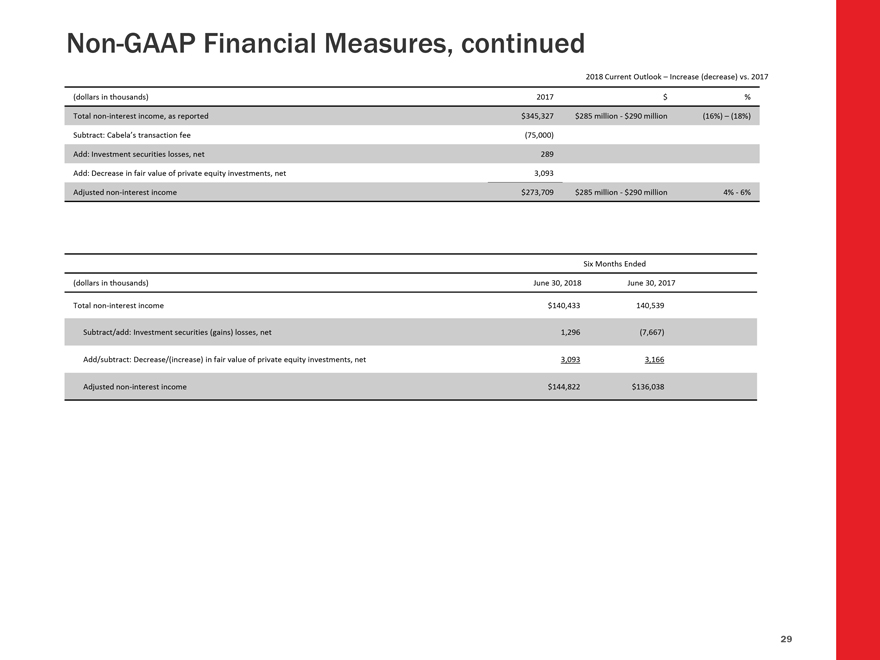
Non-GAAP Financial Measures, continued 2018 Current Outlook Increase (decrease) vs. 2017 (dollars in thousands) 2017 $ % Total
non-interest income, as reported $345,327 $285 million—$290 million (16%) (18%) Subtract: Cabela’s transaction fee (75,000) Add: Investment securities losses, net 289 Add: Decrease in fair value of private equity investments, net 3,093
Adjusted non-interest income $273,709 $285 million—$290 million 4%—6%
Six Months Ended (dollars in thousands) June 30, 2018 June 30, 2017 Total
non-interest income $140,433 140,539
Subtract/add: Investment securities (gains) losses, net 1,296 (7,667) Add/subtract: Decrease/(increase) in fair value of
private equity investments, net 3,093 3,166 Adjusted non-interest income $144,822 $136,038
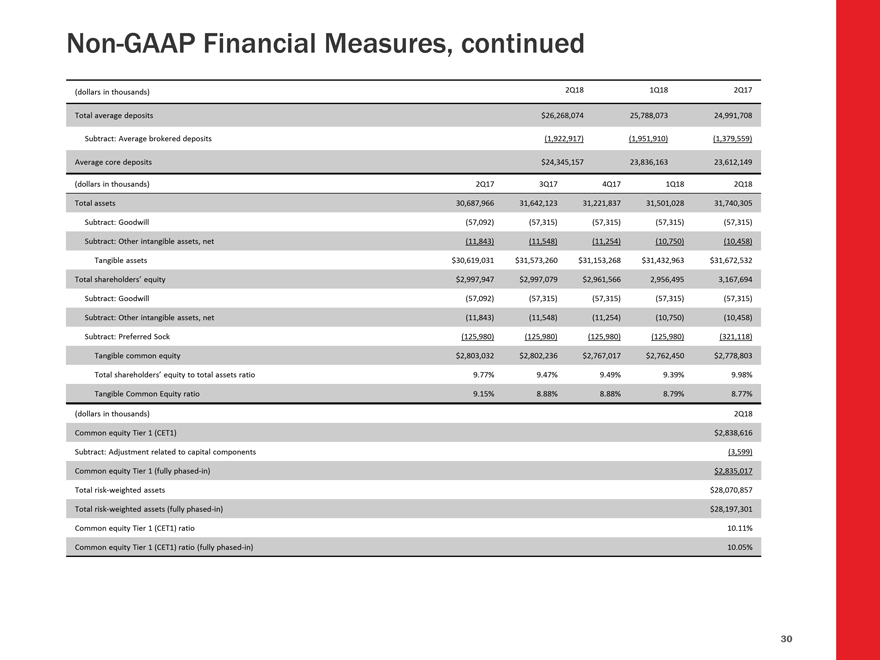
Non-GAAP Financial Measures, continued (dollars in thousands) 2Q18 1Q18 2Q17 Total average deposits $26,268,074 25,788,073 24,991,708 Subtract: Average brokered deposits (1,922,917) (1,951,910) (1,379,559) Average core deposits $24,345,157 23,836,163 23,612,149 (dollars in thousands) 2Q17 3Q17 4Q17 1Q18 2Q18 Total assets 30,687,966 31,642,123 31,221,837 31,501,028 31,740,305 Subtract: Goodwill (57,092) (57,315) (57,315) (57,315) (57,315) Subtract: Other intangible assets, net (11,843) (11,548) (11,254) (10,750) (10,458) Tangible assets $30,619,031 $31,573,260 $31,153,268 $31,432,963 $31,672,532 Total shareholders’ equity $2,997,947 $2,997,079 $2,961,566 2,956,495 3,167,694 Subtract: Goodwill (57,092) (57,315) (57,315) (57,315) (57,315) Subtract: Other intangible assets, net (11,843) (11,548) (11,254) (10,750) (10,458) Subtract: Preferred Sock (125,980) (125,980) (125,980) (125,980) (321,118) Tangible common equity $2,803,032 $2,802,236 $2,767,017 $2,762,450 $2,778,803 Total shareholders’ equity to total assets ratio 9.77% 9.47% 9.49% 9.39% 9.98% Tangible Common Equity ratio 9.15% 8.88% 8.88% 8.79% 8.77% (dollars in thousands) 2Q18 Common equity Tier 1 (CET1) $2,838,616 Subtract: Adjustment related to capital components (3,599) Common equity Tier 1 (fully phased-in) $2,835,017 Total risk-weighted assets $28,070,857 Total risk-weighted assets (fully phased-in) $28,197,301 Common equity Tier 1 (CET1) ratio 10.11% Common equity Tier 1 (CET1) ratio (fully phased-in) 10.05% 30