Attached files
| file | filename |
|---|---|
| EX-99.1 - EX-99.1 - SYNOVUS FINANCIAL CORP | d567303dex991.htm |
| 8-K - 8-K - SYNOVUS FINANCIAL CORP | d567303d8k.htm |
Exhibit 99.2
Synovus to Merge with Florida Community Bank Results in a Stronger Company with Elevated Growth and Meaningful Value Creation July 24, 2018
Forward Looking Statements This communication contains forward-looking statements within the meaning of the Private Securities Litigation Reform Act of 1995 including, but not limited to, Synovus’s and FCB Financial Holding’s expectations or predictions of future financial or business performance or conditions. Forward-looking statements are typically identified by words such as “believe,” “expect,” “anticipate,” “intend,” “target,” “estimate,” “continue,” “positions,” “plan,” “predict,” “project,” “forecast,” “guidance,” “goal,” “objective,” “prospects,” “possible” or “potential,” by future conditional verbs such as “assume,” “will,” “would,” “should,” “could” or “may”, or by variations of such words or by similar expressions. These forward-looking statements are subject to numerous assumptions, risks and uncertainties, which change over time. Forward-looking statements speak only as of the date they are made and we assume no duty to update forward-looking statements. Actual results may differ materially from current projections. In addition to factors previously disclosed in Synovus’s and FCB’s reports filed with the SEC and those identified elsewhere in this communication, the following factors, among others, could cause actual results to differ materially from forward-looking statements or historical performance: the occurrence of any event, change or other circumstances that could give rise to the right of one or both of the parties to terminate any definitive merger agreement between Synovus and FCB; the outcome of any legal proceedings that may be instituted against Synovus or FCB; the ability to obtain regulatory approvals and meet other closing conditions to the merger, including approval by Synovus and FCB shareholders on the expected terms and schedule, including the risk that regulatory approvals required for the merger are not obtained or are obtained subject to conditions that are not anticipated; delay in closing the merger; difficulties and delays in integrating the FCB business or fully realizing cost savings and other benefits; business disruption following the merger; changes in asset quality and credit risk; the inability to sustain revenue and earnings growth; changes in interest rates and capital markets; inflation; customer acceptance of Synovus’s products and services; customer borrowing, repayment, investment and deposit practices; customer disintermediation; the introduction, withdrawal, success and timing of business initiatives; competitive conditions; the inability to realize cost savings or revenues or to implement integration plans and other consequences associated with mergers, acquisitions and divestitures; economic conditions; and the impact, extent and timing of technological changes, capital management activities, and other actions of the Federal Reserve Board and legislative and regulatory actions and reforms. Annualized, pro forma, projected and estimated numbers are used for illustrative purpose only, are not forecasts and may not reflect actual results. Important Additional Information In connection with the proposed merger, Synovus will file with the SEC a Registration Statement on Form S-4 that will include the Joint Proxy Statement of Synovus and FCB and a Prospectus of Synovus. INVESTORS ARE URGED TO READ THE JOINT PROXY STATEMENT/PROSPECTUS AND OTHER RELEVANT DOCUMENTS FILED OR TO BE FILED WITH THE SEC CAREFULLY WHEN THEY BECOME AVAILABLE BECAUSE THEY WILL CONTAIN IMPORTANT INFORMATION. A free copy of the Joint Proxy Statement/Prospectus, as well as other filings containing information about Synovus and FCB, may be obtained at the SEC’s Internet site (http://www.sec.gov). Copies of the Joint Proxy Statement/Prospectus can also be obtained, free of charge, by directing a request to Synovus Investor Relations at Investor Relations, Synovus Financial Corp., 1111 Bay Avenue, Suite 500, P.O. Box 120, Columbus, GA 31901, by calling (888) SYNOVUS, or by sending an e-mail to steveadams@synovus.com or to FCB Investor Relations at Investor Relations, FCB Financial Holdings, Inc., 2500 Weston Road, Suite 300, Weston, Florida 33331, by calling (305) 668-5420 or by sending an e-mail to IR@fcb1923.com. Information regarding the persons who may, under the rules of the SEC, be considered participants in the solicitation of Synovus shareholders and FCB stockholders in connection with the proposed transaction will be set forth in the Joint Proxy Statement/Prospectus when it is filed with the SEC.
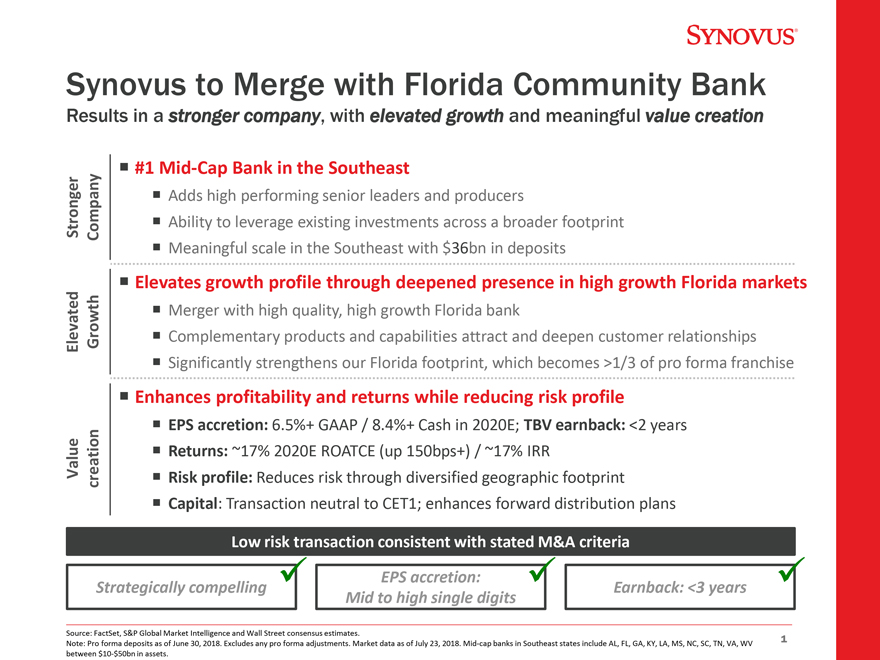
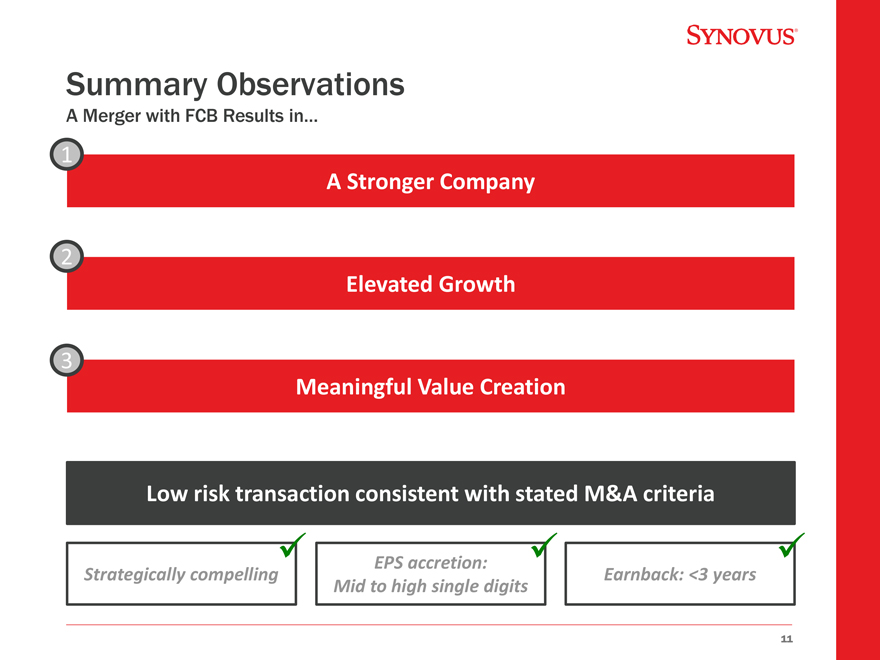
Synovus to Merge with Florida Community Bank Results in a stronger company, with elevated growth and meaningful value creation ï,¡ #1 Mid-Cap Bank in the Southeast ï,¡ Adds high performing senior leaders and producers Stronger Companyï,¡ Ability to leverage existing investments across a broader footprintï,¡ Meaningful scale in the Southeast with $36bn in deposits ï,¡ Elevates growth profile through deepened presence in high growth Florida markets ï,¡ Merger with high quality, high growth Florida bank Elevated Growthï,¡ Complementary products and capabilities attract and deepen customer relationshipsï,¡ Significantly strengthens our Florida footprint, which becomes >1/3 of pro forma franchise ï,¡ Enhances profitability and returns while reducing risk profile ï,¡ EPS accretion: 6.5%+ GAAP / 8.4%+ Cash in 2020E; TBV earnback: <2 years Valueï,¡ Returns: ~17% 2020E ROATCE (up 150bps+) / ~17% IRR creationï,¡ Risk profile: Reduces risk through diversified geographic footprint ï,¡ Capital: Transaction neutral to CET1; enhances forward distribution plans Low risk transaction consistent with stated M&A criteria  EPS accretion: Strategically compelling Earnback: <3 years Mid to high single digits Source: FactSet, S&P Global Market Intelligence and Wall Street consensus estimates. 1 Note: Pro forma deposits as of June 30, 2018. Excludes any pro forma adjustments. Market data as of July 23, 2018. Mid-cap banks in Southeast states include AL, FL, GA, KY, LA, MS, NC, SC, TN, VA, WV between $10-$50bn in assets.
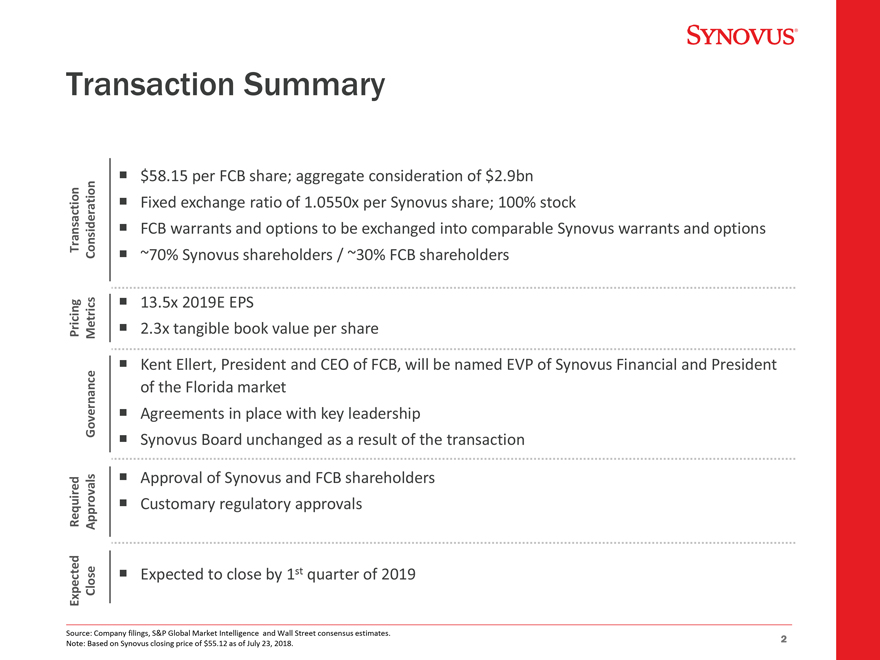
Transaction Summary ï,¡ $58.15 per FCB share; aggregate consideration of $2.9bnï,¡ Fixed exchange ratio of 1.0550x per Synovus share; 100% stock Transaction Considerationï,¡ FCB warrants and options to be exchanged into comparable Synovus warrants and optionsï,¡ ~70% Synovus shareholders / ~30% FCB shareholders ï,¡ 13.5x 2019E EPS Pricing Metricsï,¡ 2.3x tangible book value per share ï,¡ Kent Ellert, President and CEO of FCB, will be named EVP of Synovus Financial and President of the Florida market Governanceï,¡ Agreements in place with key leadershipï,¡ Synovus Board unchanged as a result of the transaction ï,¡ Approval of Synovus and FCB shareholders Required Approvalsï,¡ Customary regulatory approvals Expected Closeï,¡ Expected to close by 1st quarter of 2019 Source: Company filings, S&P Global Market Intelligence and Wall Street consensus estimates. 2 Note: Based on Synovus closing price of $55.12 as of July 23, 2018.
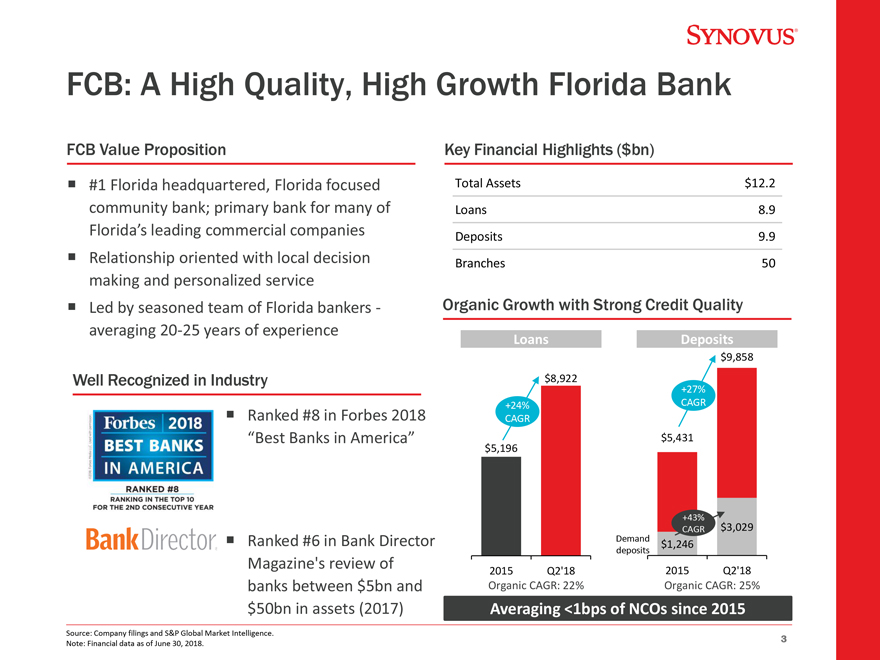
FCB: A High Quality, High Growth Florida Bank FCB Value Proposition Key Financial Highlights ($bn) ï,¡ #1 Florida headquartered, Florida focused Total Assets $12.2 community bank; primary bank for many of Loans 8.9 Florida’s leading commercial companies Deposits 9.9 ï,¡ Relationship oriented with local decision Branches 50 making and personalized serviceï,¡ Led by seasoned team of Florida bankers - Organic Growth with Strong Credit Quality averaging 20-25 years of experience Loans Deposits $9,858 Well Recognized in Industry $8,922 +27% +24% CAGR ï,¡ Ranked #8 in Forbes 2018 CAGR “Best Banks in America” $5,431 $5,196 +43% CAGR $3,029 ï,¡ Ranked #6 in Bank Director Demand $1,246 deposits Magazine’s review of 2015 Q2’18 2015 Q2’18 banks between $5bn and Organic CAGR: 22% Organic CAGR: 25% $50bn in assets (2017) Averaging <1bps of NCOs since 2015 Source: Company filings and S&P Global Market Intelligence. 3 Note: Financial data as of June 30, 2018.
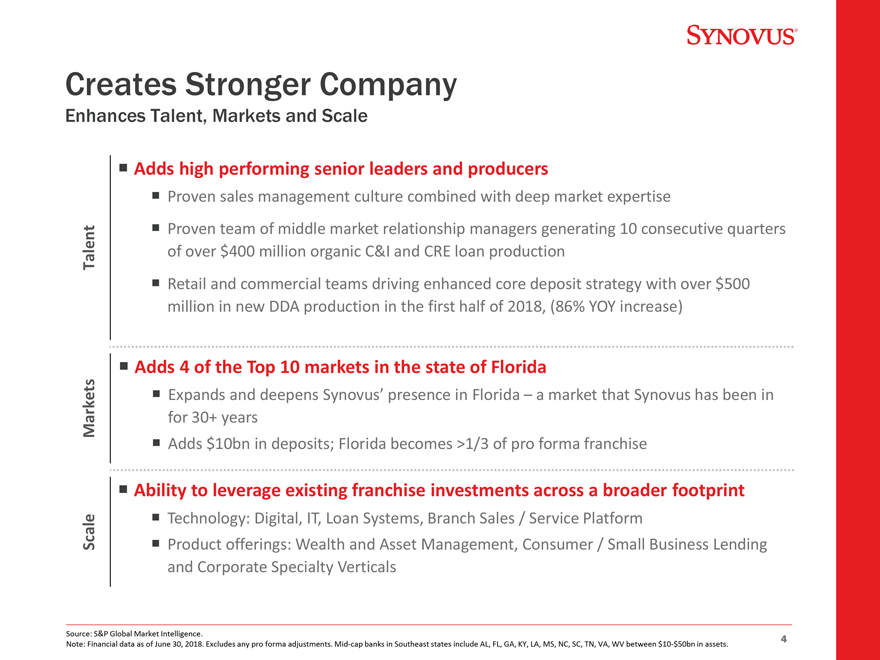
Creates Stronger Company Enhances Talent, Markets and Scale ï,¡ Adds high performing senior leaders and producers ï,¡ Proven sales management culture combined with deep market expertise ï,¡ Proven team of middle market relationship managers generating 10 consecutive quarters Talent of over $400 million organic C&I and CRE loan productionï,¡ Retail and commercial teams driving enhanced core deposit strategy with over $500 million in new DDA production in the first half of 2018, (86% YOY increase) ï,¡ Adds 4 of the Top 10 markets in the state of Florida ï,¡ Expands and deepens Synovus’ presence in Florida – a market that Synovus has been in Markets for 30+ years ï,¡ Adds $10bn in deposits; Florida becomes >1/3 of pro forma franchise ï,¡ Ability to leverage existing franchise investments across a broader footprint ï,¡ Technology: Digital, IT, Loan Systems, Branch Sales / Service Platform Scaleï,¡ Product offerings: Wealth and Asset Management, Consumer / Small Business Lending and Corporate Specialty Verticals Source: S&P Global Market Intelligence. 4 Note: Financial data as of June 30, 2018. Excludes any pro forma adjustments. Mid-cap banks in Southeast states include AL, FL, GA, KY, LA, MS, NC, SC, TN, VA, WV between $10-$50bn in assets.
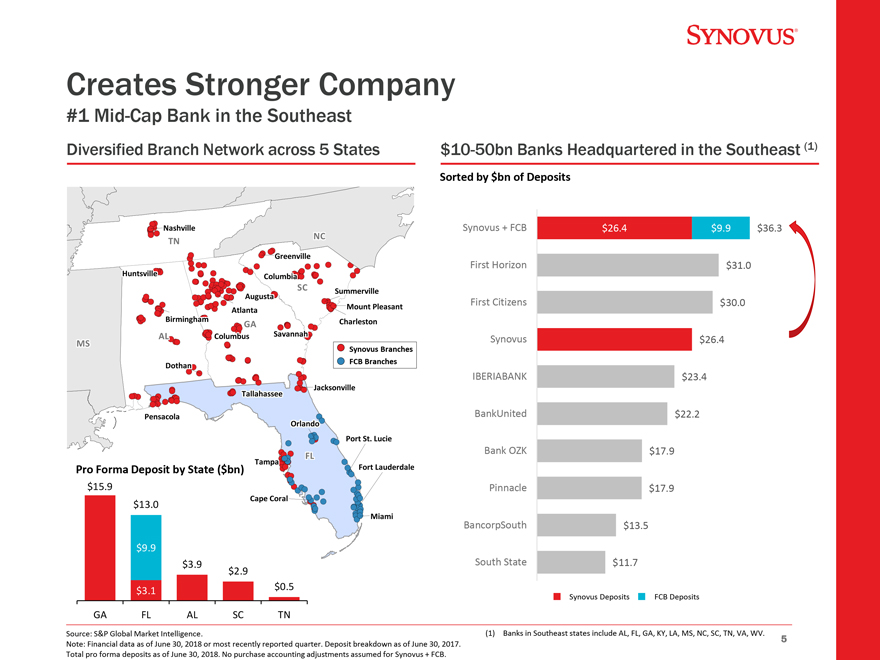
Creates Stronger Company #1 Mid-Cap Bank in the Southeast Diversified Branch Network across 5 States $10-50bn Banks Headquartered in the Southeast (1) Sorted by $bn of Deposits Nashville ill Synovus + FCB $26.4 $9.9 $36.3 NC TN Greenville ill First Horizon $31.0 Huntsville ill Columbia l SC Summerville r ill Augusta First Citizens $30.0 Mountt Pleasant Atlanta l Birmingham ir Charleston GA rl AL Columbus Savannah MS l s Synovus $26.4 1016841_1.wor (NY008P5T) Synovus Branches FCB Branches Dothan IBERIABANK $23.4 Tallahassee Jacksonville J c ill ll Pensacola BankUnited $22.2 c l Orlando rl Portt Stt.. Lucie L i Bank OZK $17.9 FL Tampa Pro Forma Deposit by State ($bn) Fort rt Lauderdale L r l $15.9 Pinnacle $17.9 Cape Coral r l $13.0 Miami i BancorpSouth $13.5 $9.9 $3.9 1016841 _1.wor (ny008p5t) South State $11.7 $2.9 $0.5 $3.1 Synovus Deposits FCB Deposits GA FL AL SC TN Source: S&P Global Market Intelligence. (1) Banks in Southeast states include AL, FL, GA, KY, LA, MS, NC, SC, TN, VA, WV. 5 Note: Financial data as of June 30, 2018 or most recently reported quarter. Deposit breakdown as of June 30, 2017. Total pro forma deposits as of June 30, 2018. No purchase accounting adjustments assumed for Synovus + FCB.
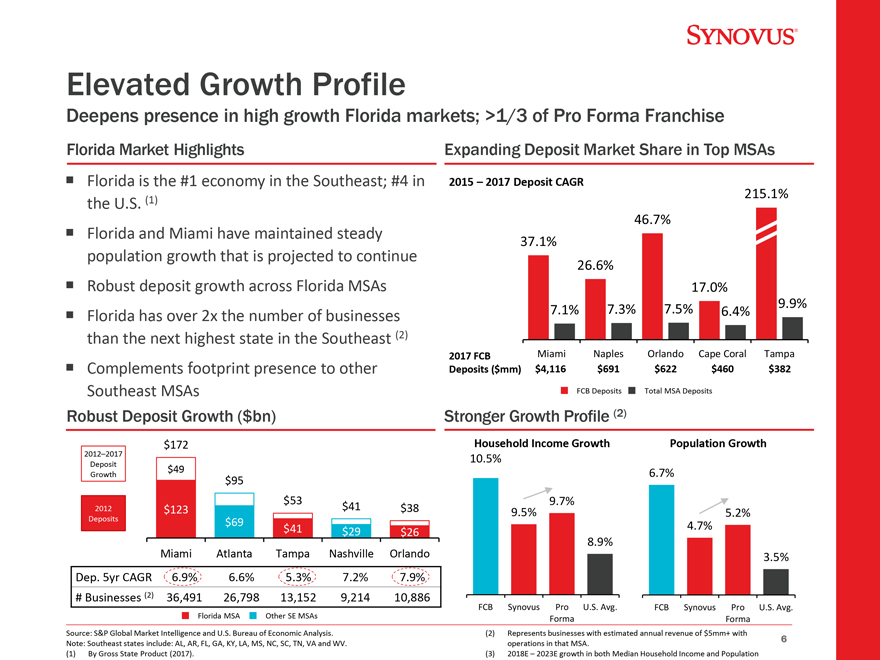
Elevated Growth Profile Deepens presence in high growth Florida markets; >1/3 of Pro Forma Franchise Florida Market Highlights Expanding Deposit Market Share in Top MSAs ï,¡ Florida is the #1 economy in the Southeast; #4 in 2015 – 2017 Deposit CAGR 215.1% the U.S. (1) 46.7% ï,¡ Florida and Miami have maintained steady 37.1% population growth that is projected to continue 26.6% ï,¡ Robust deposit growth across Florida MSAs 17.0% 9.9% 7.1% 7.3% 7.5% 6.4% ï,¡ Florida has over 2x the number of businesses than the next highest state in the Southeast (2) 2017 FCB Miami Naples Orlando Cape Coral Tampa ï,¡ Complements footprint presence to other Deposits ($mm) $4,116 $691 $622 $460 $382 Southeast MSAs FCB Deposits Total MSA Deposits Robust Deposit Growth ($bn) Stronger Growth Profile (2) $172 Household Income Growth Population Growth 2012–2017 10.5% Deposit $49 6.7% Growth $95 $53 9.7% 2012 $123 $41 $38 9.5% 5.2% Deposits $69 $41 4.7% $29 $26 8.9% Miami Atlanta Tampa Nashville Orlando 3.5% Dep. 5yr CAGR 6.9% 6.6% 5.3% 7.2% 7.9% # Businesses (2) 36,491 26,798 13,152 9,214 10,886 FCB Synovus Pro U.S. Avg. FCB Synovus Pro U.S. Avg. Florida MSA Other SE MSAs Forma Forma Source: S&P Global Market Intelligence and U.S. Bureau of Economic Analysis. (2) Represents businesses with estimated annual revenue of $5mm+ with 6 Note: Southeast states include: AL, AR, FL, GA, KY, LA, MS, NC, SC, TN, VA and WV. operations in that MSA. (1) By Gross State Product (2017). (3) 2018E – 2023E growth in both Median Household Income and Population
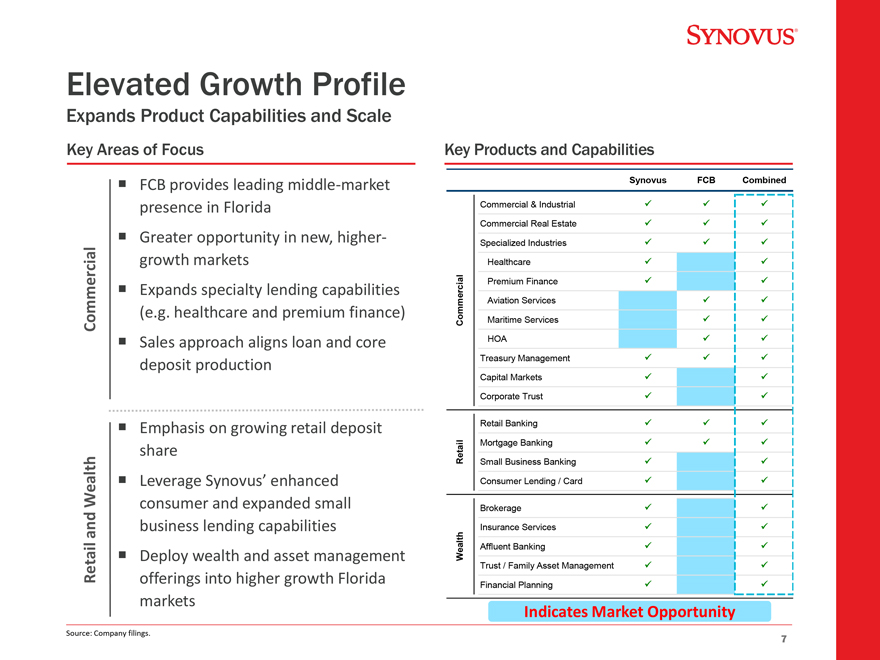
Elevated Growth Profile Expands Product Capabilities and Scale Key Areas of Focus Key Products and Capabilities ï,¡ FCB provides leading middle-market Synovus FCB Combined presence in Florida Commercial & Industrial Commercial Real Estate ï,¡ Greater opportunity in new, higher- Specialized Industries growth markets Healthcare l cia Premium Finance ï,¡ Expands specialty lending capabilities  mmer Aviation Services (e.g. healthcare and premium finance) Commercial Co Maritime Services ï,¡ Sales approach aligns loan and core HOA Treasury Management deposit production Capital Markets Corporate Trust ï,¡ Emphasis on growing retail deposit Retail Banking ail Mortgage Banking share Ret Small Business Banking Wealthï,¡ Leverage Synovus’ enhanced Consumer Lending / Card consumer and expanded small Brokerage and business lending capabilities Insurance Services Affluent Banking ï,¡ Deploy wealth and asset management Wealth Trust / Family Asset Management Retail offerings into higher growth Florida Financial Planning markets Indicates Market Opportunity Source: Company filings.
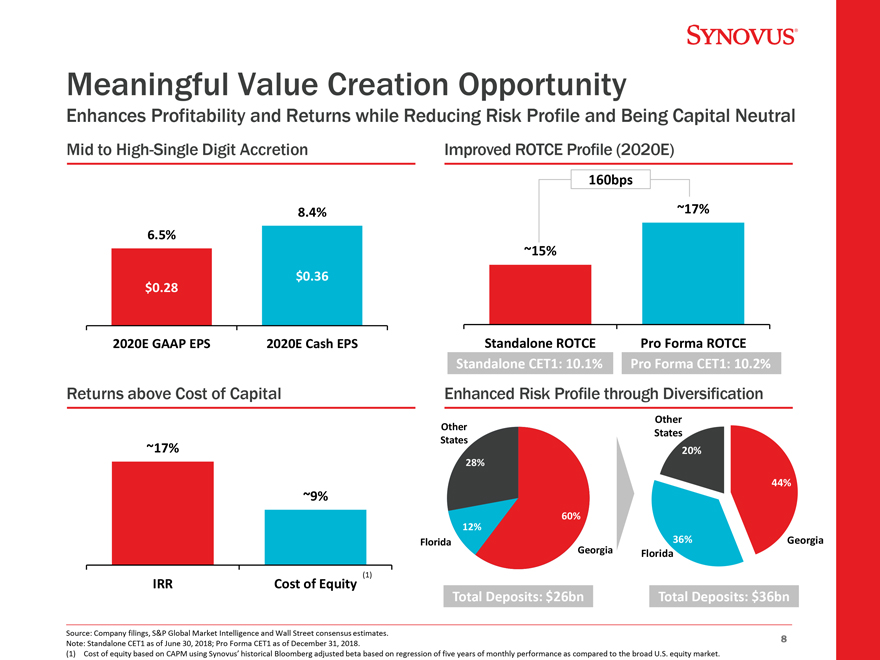
Meaningful Value Creation Opportunity Enhances Profitability and Returns while Reducing Risk Profile and Being Capital Neutral Mid to High-Single Digit Accretion Improved ROTCE Profile (2020E) 160bps 8.4% ~17% 6.5% ~15% $0.36 $0.28 2020E GAAP EPS 2020E Cash EPS Standalone ROTCE Pro Forma ROTCE Standalone CET1: 10.1% Pro Forma CET1: 10.2% Returns above Cost of Capital Enhanced Risk Profile through Diversification Other Other States States ~17% 20% 28% 44% ~9% 60% 12% Florida 36% Georgia Florida IRR Cost of Equity (1) Total Deposits: $26bn Total Deposits: $36bn Source: Company filings, S&P Global Market Intelligence and Wall Street consensus estimates. 8 Note: Standalone CET1 as of June 30, 2018; Pro Forma CET1 as of December 31, 2018. (1) Cost of equity based on CAPM using Synovus’ historical Bloomberg adjusted beta based on regression of five years of monthly performance as compared to the broad U.S. equity market.
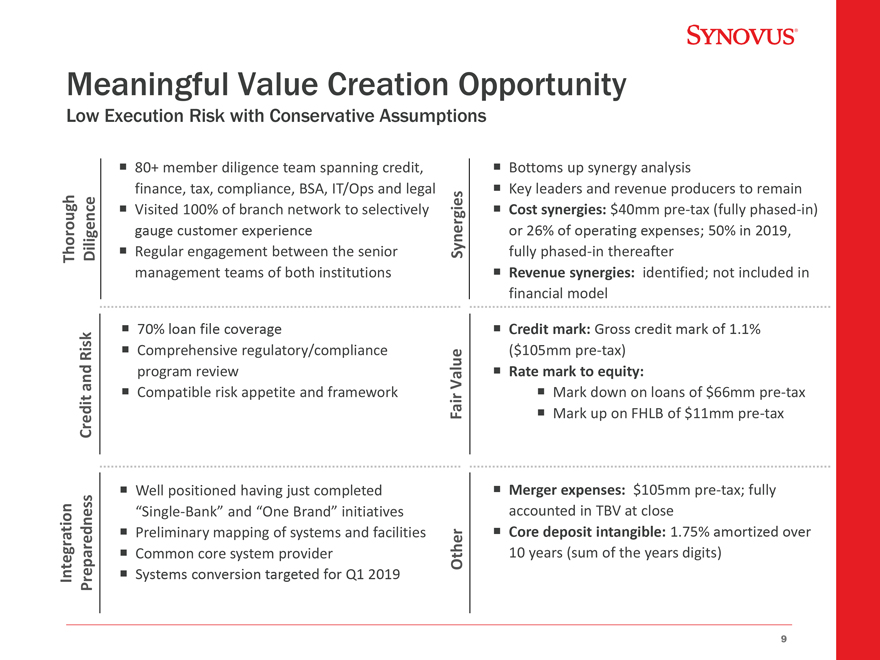
Meaningful Value Creation Opportunity Low Execution Risk with Conservative Assumptions ï,¡ 80+ member diligence team spanning credit, ï,¡ Bottoms up synergy analysis finance, tax, compliance, BSA, IT/Ops and legalï,¡ Key leaders and revenue producers to remainï,¡ Visited 100% of branch network to selectively ï,¡ Cost synergies: $40mm pre-tax (fully phased-gauge customer experience or 26% of operating expenses; 50% in 2019, Thorough Diligenceï,¡ Regular engagement between the senior Synergies fully phased-in thereafter management teams of both institutionsï,¡ Revenue synergies: identified; not included in financial model ï,¡ 70% loan file coverageï,¡ Credit mark: Gross credit mark of 1.1% Riskï,¡ Comprehensive regulatory/compliance ($105mm pre-tax) Rate mark and program review Valueï,¡ to equity: ï,¡ Compatible risk appetite and frameworkï,¡ Mark down on loans of $66mm pre-tax Credit Fairï,¡ Mark up on FHLB of $11mm pre-taxï,¡ Well positioned having just completed ï,¡ Merger expenses: $105mm pre-tax; fully “Single-Bank” and “One Brand” initiatives accounted in TBV at close ï,¡ Preliminary mapping of systems and facilitiesï,¡ Core deposit intangible: 1.75% amortized overï,¡ Common core system provider Other 10 years (sum of the years digits) Integration Preparednessï,¡ Systems conversion targeted for Q1 2019
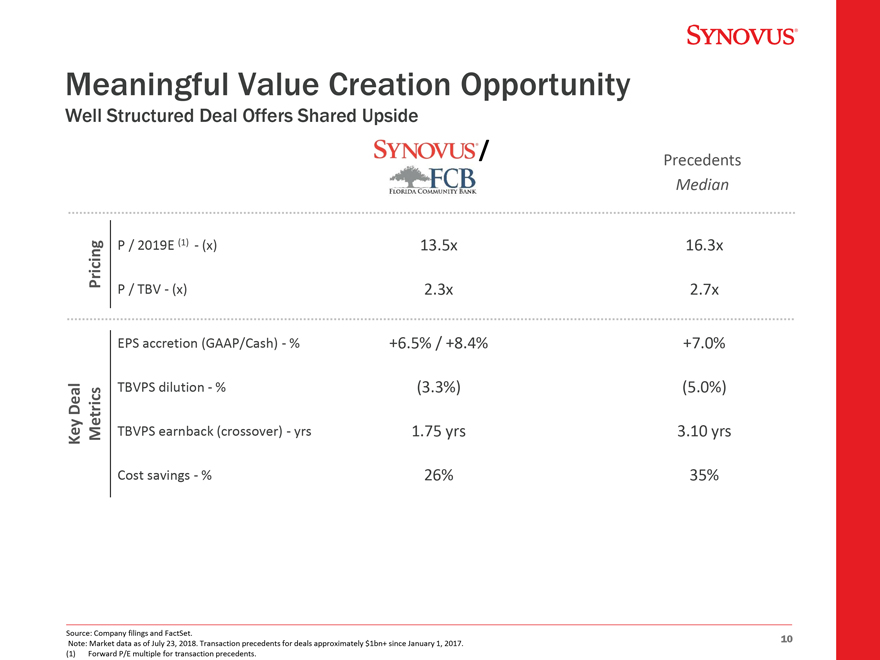
Meaningful Value Creation Opportunity Well Structured Deal Offers Shared / Precedents Median Pricing P / 2019E (1) - (x) 13.5x 16.3x P / TBV - (x) 2.3x 2.7x EPS accretion (GAAP/Cash) - % +6.5% / +8.4% +7.0% Deal TBVPS dilution - % (3.3%) (5.0%) Key Metrics TBVPS earnback (crossover) - yrs 1.75 yrs 3.10 yrs Cost savings - % 26% 35% Source: Company filings and FactSet. 10 Note: Market data as of July 23, 2018. Transaction precedents for deals approximately $1bn+ since January 1, 2017. (1) Forward P/E multiple for transaction precedents.
Meaningful Value Creation Opportunity Well Structured Deal Offers Shared / Precedents Median Pricing P / 2019E (1) - (x) 13.5x 16.3x P / TBV - (x) 2.3x 2.7x EPS accretion (GAAP/Cash) - % +6.5% / +8.4% +7.0% Deal TBVPS dilution - % (3.3%) (5.0%) Key Metrics TBVPS earnback (crossover) - yrs 1.75 yrs 3.10 yrs Cost savings - % 26% 35% Source: Company filings and FactSet. 10 Note: Market data as of July 23, 2018. Transaction precedents for deals approximately $1bn+ since January 1, 2017. (1) Forward P/E multiple for transaction precedents.
Appendix
12
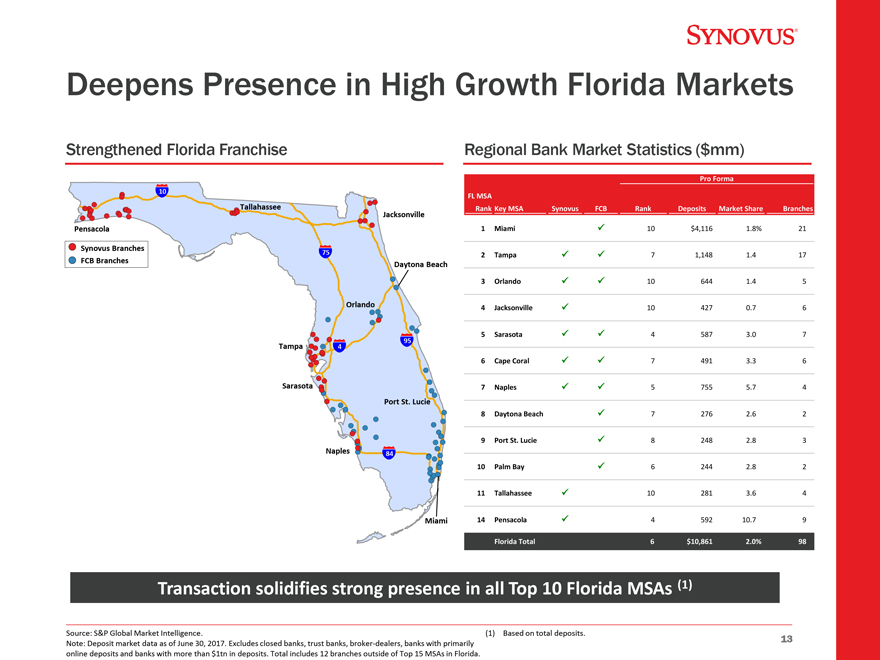
Deepens Presence in High Growth Florida Markets Strengthened Florida Franchise Regional Bank Market Statistics ($mm) Pro Forma 10 FL MSA Tallahassee Rank Key MSA Synovus FCB Rank Deposits Market Share Branches Jacksonville Pensacola 1 Miami 10 $4,116 1.8% 21 Synovus Branches 75 2 Tampa 7 1,148 1.4 17 FCB Branches Daytona Beach 3 Orlando 10 644 1.4 5 Orlando 4 Jacksonville 10 427 0.7 6 5 Sarasota 4 587 3.0 7 95 Tampa 4 6 Cape Coral 7 491 3.3 6 Sarasota 7 Naples 5 755 5.7 4 Port St. Lucie 8 Daytona Beach 7 276 2.6 2 9 Port St. Lucie 8 248 2.8 3 Naples 84 10 Palm Bay 6 244 2.8 2 11 Tallahassee 10 281 3.6 4 Miami 14 Pensacola 4 592 10.7 9 Florida Total 6 $10,861 2.0% 98 (NY008SR4) 1084465_ _ _ _ _ _ _ _ _ _ _ _ _ _ _ _ _ _ _ _ _ _ _ _ _ _ _ _ _ _ _ _ _ _ _ _ _ _ _ _ _ _ _ _ _ _ _ _ _1 Transaction solidifies strong presence in all Top 10 Florida MSAs (1) Source: S&P Global Market Intelligence. (1) Based on total deposits. 13 Note: Deposit market data as of June 30, 2017. Excludes closed banks, trust banks, broker-dealers, banks with primarily online deposits and banks with more than $1tn in deposits. Total includes 12 branches outside of Top 15 MSAs in Florida.
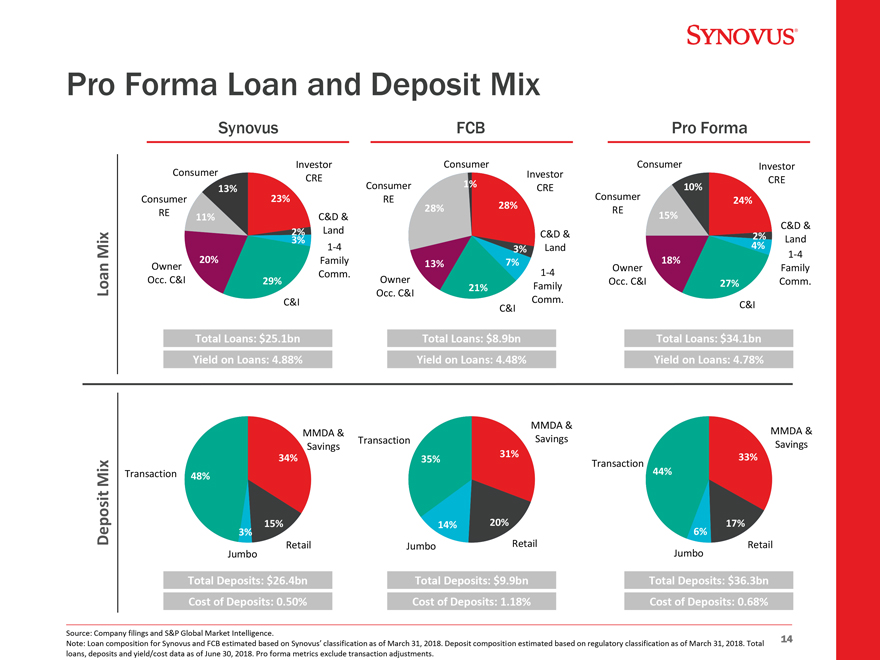
Pro Forma Loan and Deposit Mix Synovus FCB Pro Forma Consumer Investor Consumer Consumer Investor CRE Investor 1% CRE 13% Consumer CRE 10% Consumer 23% RE Consumer 24% 28% 28% RE RE 11% C&D & 15% C&D & 2% Land C&D & 3% 2% Land Mix 1-4 3% Land 4% 1-4 20% Family 13% 7% 18% Owner Owner Family Comm. 1-4 Occ. C&I 29% Owner Occ. C&I 27% Comm. 21% Family Loan Occ. C&I C&I Comm. C&I C&I Total Loans: $25.1bn Total Loans: $8.9bn Total Loans: $34.1bn Yield on Loans: 4.88% Yield on Loans: 4.48% Yield on Loans: 4.78% MMDA & MMDA & Savings MMDA & Transaction Savings Savings 34% 31% 33% 35% Transaction 44% Mix Transaction 48% 15% 14% 20% 17% Deposit 3% 6% Retail Jumbo Retail Retail Jumbo Jumbo Total Deposits: $26.4bn Total Deposits: $9.9bn Total Deposits: $36.3bn Cost of Deposits: 0.50% Cost of Deposits: 1.18% Cost of Deposits: 0.68% Source: Company filings and S&P Global Market Intelligence. 14 Note: Loan composition for Synovus and FCB estimated based on Synovus’ classification as of March 31, 2018. Deposit composition estimated based on regulatory classification as of March 31, 2018. Total loans, deposits and yield/cost data as of June 30, 2018. Pro forma metrics exclude transaction adjustments.
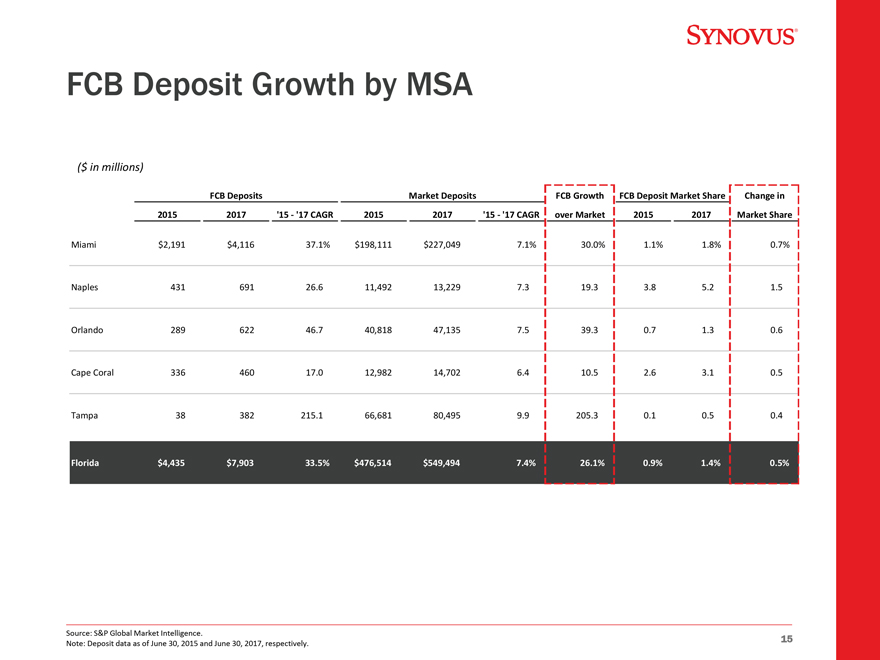
FCB Deposit Growth by MSA ($ in millions) FCB Deposits Market Deposits FCB Growth FCB Deposit Market Share Change in 2015 2017 ‘15 - ‘17 CAGR 2015 2017 ‘15 - ‘17 CAGR over Market 2015 2017 Market Share Miami $2,191 $4,116 37.1% $198,111 $227,049 7.1% 30.0% 1.1% 1.8% 0.7% Naples 431 691 26.6 11,492 13,229 7.3 19.3 3.8 5.2 1.5 Orlando 289 622 46.7 40,818 47,135 7.5 39.3 0.7 1.3 0.6 Cape Coral 336 460 17.0 12,982 14,702 6.4 10.5 2.6 3.1 0.5 Tampa 38 382 215.1 66,681 80,495 9.9 205.3 0.1 0.5 0.4 Florida $4,435 $7,903 33.5% $476,514 $549,494 7.4% 26.1% 0.9% 1.4% 0.5% Source: S&P Global Market Intelligence. 15 Note: Deposit data as of June 30, 2015 and June 30, 2017, respectively. vated Growth Profile Expands Product Capabilities and Scale Key Areas of Focus Key Products and Capabilities ï,¡ FCB provides leading middle-market Synovus FCB Combined presence in Florida Commercial & Industrial Commercial Real Estate ï,¡ Greater opportunity in new, higher- Specialized Industries growth markets Healthcare l cia Premium Finance ï,¡ Expands specialty lending capabilities  mmer Aviation Services (e.g. healthcare and premium finance) Commercial Co Maritime Services ï,¡ Sales approach aligns loan and core HOA Treasury Management deposit production Capital Markets Corporate Trust ï,¡ Emphasis on growing retail deposit Retail Banking ail Mortgage Banking share Ret Small Business Banking Wealthï,¡ Leverage Synovus’ enhanced Consumer Lending / Card consumer and expanded small Brokerage and business lending capabilities Insurance Services Affluent Banking ï,¡ Deploy wealth and asset management Wealth Trust / Family Asset Management Retail offerings into higher growth Florida Financial Planning markets Indicates Market Opportunity Source: Company filings. 7
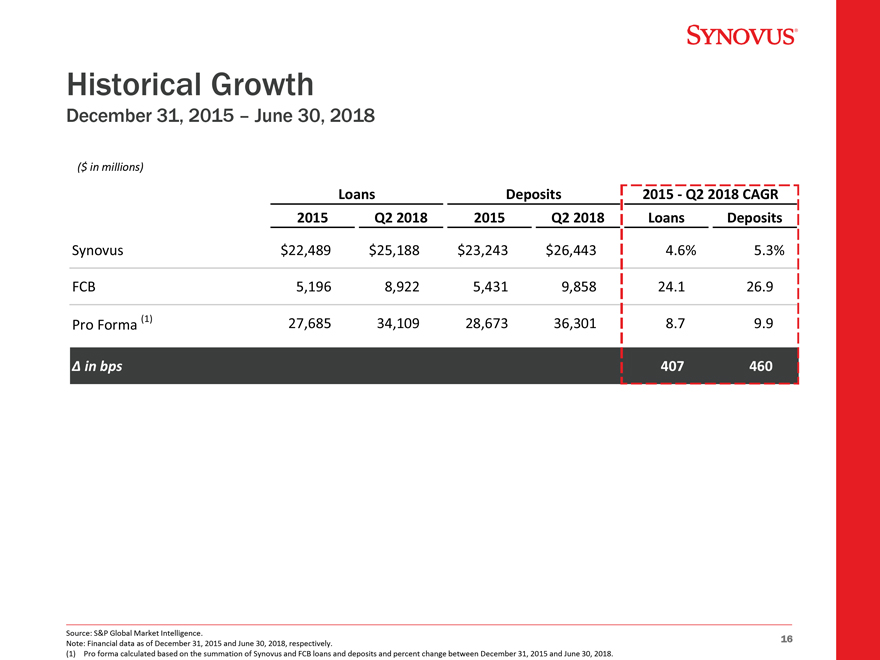
Historical Growth December 31, 2015 – June 30, 2018 ($ in millions) Loans Deposits 2015 - Q2 2018 CAGR 2015 Q2 2018 2015 Q2 2018 Loans Deposits Synovus $22,489 $25,188 $23,243 $26,443 4.6% 5.3% FCB 5,196 8,922 5,431 9,858 24.1 26.9 (1) 27,685 34,109 28,673 36,301 8.7 9.9 Pro Forma â^† in bps 407 460 Source: S&P Global Market Intelligence. 16 Note: Financial data as of December 31, 2015 and June 30, 2018, respectively. (1) Pro forma calculated based on the summation of Synovus and FCB loans and deposits and percent change between December 31, 2015 and June 30, 2018.
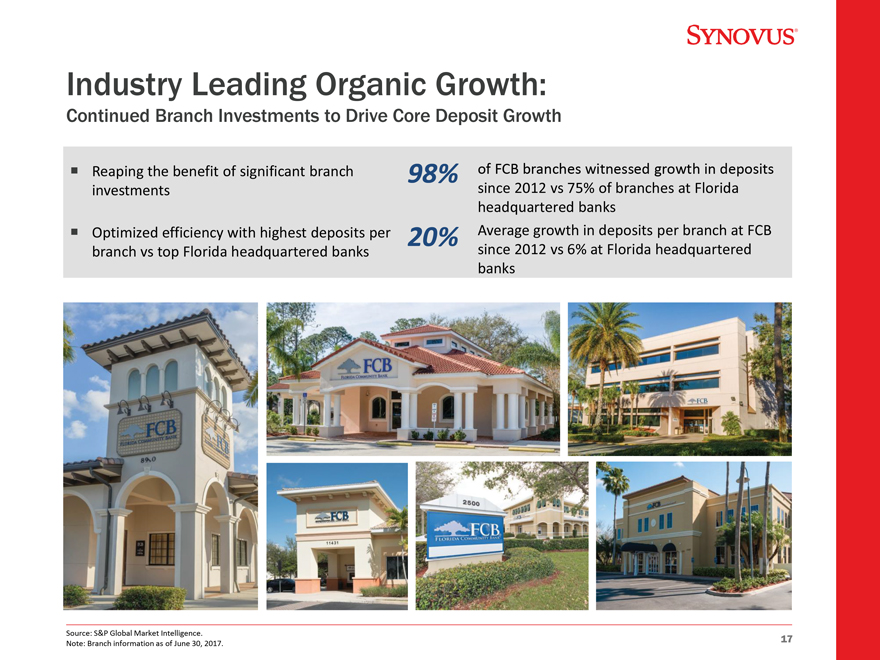
Industry Leading Organic Growth: Continued Branch Investments to Drive Core Deposit Growth ï,¡ Reaping the benefit of significant branch 98% of FCB branches witnessed growth in deposits investments since 2012 vs 75% of branches at Florida headquartered banksï,¡ Optimized efficiency with highest deposits per 20% Average growth in deposits per branch at FCB branch vs top Florida headquartered banks since 2012 vs 6% at Florida headquartered banks Source: S&P Global Market Intelligence. 17 Note: Branch information as of June 30, 2017.
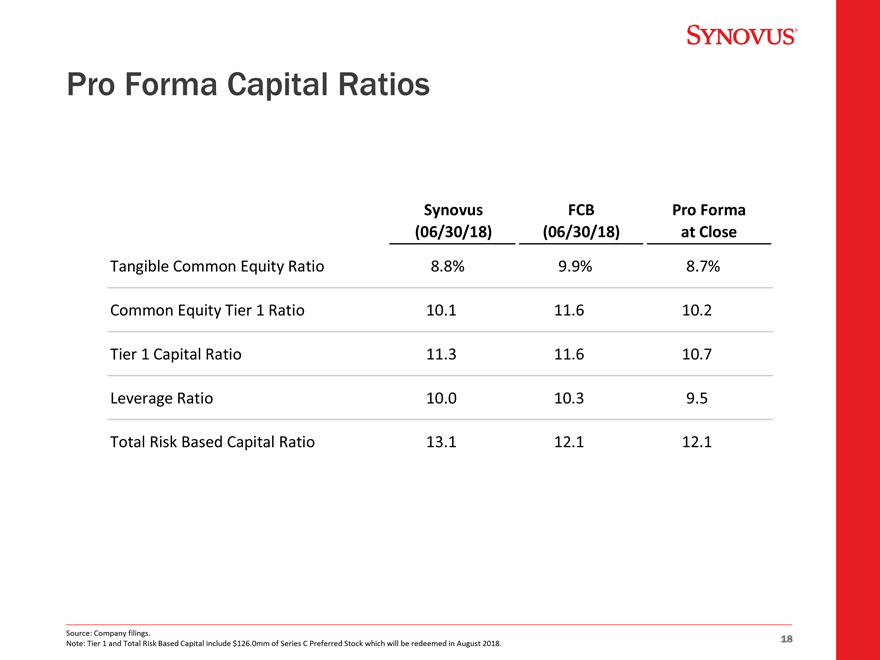
Pro Forma Capital Ratios Synovus FCB Pro Forma (06/30/18) (06/30/18) at Close Tangible Common Equity Ratio 8.8% 9.9% 8.7% Common Equity Tier 1 Ratio 10.1 11.6 10.2 Tier 1 Capital Ratio 11.3 11.6 10.7 Leverage Ratio 10.0 10.3 9.5 Total Risk Based Capital Ratio 13.1 12.1 12.1 Source: Company filings. 18 Note: Tier 1 and Total Risk Based Capital include $126.0mm of Series C Preferred Stock which will be redeemed in August 2018.