Attached files
| file | filename |
|---|---|
| EX-99.1 - EXHIBIT 99.1 - FLAGSTAR BANCORP INC | pressrelease2q2018.htm |
| 8-K - 8-K - FLAGSTAR BANCORP INC | a8-kearningsrelease2q2018.htm |

2nd Quarter 2018 Flagstar Bancorp, Inc. (NYSE: FBC) Earnings Presentation 2nd Quarter 2018 July 24, 2018

Cautionary statements 2nd Quarter 2018 This presentation contains "forward-looking statements" within the meaning of the Private Securities Litigation Reform Act of 1995, as amended. Forward-looking statements are based on management’s current expectations and assumptions regarding the Company’s business and performance, the economy and other future conditions, and forecasts of future events, circumstances and results. However, they are not guarantees of future performance and are subject to known and unknown risks, uncertainties, contingencies and other factors. Generally, forward-looking statements are not based on historical facts but instead represent our management’s beliefs regarding future events. Such statements may be identified by words such as believe, expect, anticipate, intend, plan, estimate, may increase, may fluctuate, and similar expressions or future or conditional verbs such as will, should, would and could. Such statements are based on management’s current expectations and are subject to risks, uncertainties and changes in circumstances. Actual results and capital and other financial conditions may differ materially from those included in these statements due to a variety of factors, including without limitation those found in periodic Flagstar reports filed with the U.S. Securities and Exchange Commission, which are available on the Company’s website (flagstar.com) and on the Securities and Exchange Commission's website (sec.gov). Any forward-looking statements made by or on behalf of us speak only as to the date they are made, and we do not undertake to update forward-looking statements to reflect the impact of circumstances or events that arise after the date the forward-looking statements were made, except as required under United States securities laws. In addition to results presented in accordance with GAAP, this presentation includes non-GAAP financial measures. The Company believes these non-GAAP financial measures provide additional information that is useful to investors in helping to understand the capital requirements Flagstar will face in the future and underlying performance and trends of Flagstar. Non-GAAP financial measures have inherent limitations, which are not required to be uniformly applied. Readers should be aware of these limitations and should be cautious with respect to the use of such measures. To compensate for these limitations, we use non-GAAP measures as comparative tools, together with GAAP measures, to assist in the evaluation of our operating performance or financial condition. Also, we ensure that these measures are calculated using the appropriate GAAP or regulatory components in their entirety and that they are computed in a manner intended to facilitate consistent period-to-period comparisons. Flagstar’s method of calculating these non-GAAP measures may differ from methods used by other companies. These non-GAAP measures should not be considered in isolation or as a substitute for those financial measures prepared in accordance with GAAP or in-effect regulatory requirements. Where non-GAAP financial measures are used, the most directly comparable GAAP or regulatory financial measure, as well as the reconciliation to the most directly comparable GAAP or regulatory financial measure, can be found in these conference call slides. Additional discussion of the use of non-GAAP measures can also be found in the Form 8-K Current Report related to this presentation and in periodic Flagstar reports filed with the U.S. Securities and Exchange Commission. These documents can all be found on the Company’s website at flagstar.com. 2

Executive Overview 2nd Quarter 2018 Sandro DiNello, CEO

Strategic highlights 2nd Quarter 2018 Unique • Produced solid earnings, despite challenging mortgage environment relationship-based - Strong, positive operating leverage with revenue increasing 10 percent while expense rose a modest 2 percent business model - Most profitable quarter in nearly six years (third quarter 2012) • Delivered strong performance, boosted by acquisitions of Desert Community Bank branches and warehouse business Grow community - Net interest income of $115 million; up 8 percent vs. 1Q18 and 19 percent vs. 2Q17 banking - Average deposits of $10.4 billion; up 11 percent (or 6 percent(1) ex. 1Q18 acquisitions) vs. prior quarter • Increased mortgage revenue(2) to $72 million, up 13 percent vs. 1Q18 and unchanged vs. 2Q17 Strengthen - Mortgage origination business softer than expected in what is typically a seasonally strong quarter mortgage revenues - GOS margin down 6 basis points to 0.71 percent due to wider spreads on a securitization late in quarter • Net income of $50 million or $0.85 per diluted share; up 43 percent vs. 1Q18 and up 22 percent vs. 2Q17 Highly profitable • Built scale and profitability in servicing business; over 583,000 loans serviced as of July 15, 2018 operations • Return on assets 1.1 percent; return on average equity 13.5 percent Positioned to thrive • Strong credit metrics and low delinquency levels supported by 1.5 percent allowance coverage ratio in any market • Strong Tier 1 leverage ratio of 8.7%, Capital Simplification NPR would improve Tier 1 leverage ratio to 9.1%(3) 1) Excludes $614 million of deposits from DCB acquisition on 3/19/2018. 2) Mortgage revenue is defined as net gain on loan sales plus net return on MSRs. 3) Non-GAAP number. Please see reconciliation on page 46. 4

Financial Overview 2nd Quarter 2018 Jim Ciroli, CFO

Financial highlights 2nd Quarter 2018 • Net income of $50 million, or $0.85 per diluted share, in 2Q18 Unique relationship- - Strong growth in net interest income, driven by acquisitions in late 1Q18 based business (1) model - Higher noninterest income on increased mortgage revenues and loan fees and charges - Acquisitions and disciplined expense management delivered positive operating leverage • Net interest income rose $9 million, or 8 percent, led by DCB branch and warehouse business acquisitions Grow community - Average earning assets rose 4 percent, led by strength of commercial loans (up 19 percent or 8 percent(1) ex. 1Q18 banking acquisitions) - Net interest margin rose 10 basis points to 2.86 percent on higher loan yields and continued deposit price discipline • Mortgage revenue(2) up $8 million, or 13 percent, on seasonal increase in originations and improved MSR return Higher mortgage - Net gain on loan sales rose $3 million, reflecting higher FOAL (up 17%), partially offset by lower GOS margin (down 6 revenues basis points) - Net return on MSRs higher due to better actual and expected prepayments and lower transaction costs • Negligible net charge-offs Strong • Nonperforming loan ratio fell to 0.30 percent; early stage consumer delinquencies low; no commercial loan delinquencies asset quality over 30 days • Allowance for loan losses covered 1.5 percent of loans HFI • Capital remained strong with regulatory capital ratios well above current “well capitalized” guidelines Robust capital - Tier 1 leverage at 8.7 percent with nearly 53 basis points of trapped capital in MSRs and DTAs position - Tier 1 leverage has approximately 370 basis point buffer to “well-capitalized” minimums that would grow to approximately 410 basis points under the Capital Simplification proposal 1) Excludes $499 million and $40 million of commercial loans from Santander Bank and DCB acquisitions on 3/12/2018 and 3/19/2018, respectively. 2) Mortgage revenue is defined as net gain on loan sales HFS plus the net return on the MSRs. 6

nd Quarterly income comparison 2 Quarter 2018 $mm Observations A Net interest income 2Q18 1Q18 $ Variance % Variance Net interest income A $115 $106 $9 8% • Net interest income rose $9mm or 8% Provision for loan losses ("PLL") (1) - (1) N/M - Average earning assets increased 4%, led by Net interest income after PLL 116 106 10 9% continued solid growth in commercial loans Net gain on loan sales 63 60 3 5% - Net interest margin rose 10 bps to 2.86% Loan fees and charges 24 20 4 20% Loan administration income 5 5 - - Net return on mortgage servicing rights 9 4 5 125% B Noninterest income Other noninterest income 22 22 - - Total noninterest income B 123 111 12 11% • Noninterest income increased $12mm or 11% Compensation and benefits 80 80 - - - Net gain on loan sales rose $3mm or 5% on Commissions and loan processing expense 40 32 8 25% seasonal increase in mortgage originations, partially offset by lower GOS margin due to wider Other noninterest expenses 57 61 (4) (7%) spreads on a securitization late in quarter Total noninterest expense C 177 173 4 2% - Net return on MSRs improved $5mm Income before income taxes 62 44 18 41% - Loan fees rose $4mm or 20% on higher mortgage Provision for income taxes 12 9 3 33% loan closings Net income $50 $35 $15 43% Diluted income per share $0.85 $0.60 $0.25 42% C Noninterest expense Profitability • Noninterest expense rose $4mm or 2% Net interest margin 2.86% 2.76% 10 bps Total revenues $239 $217 $22 10% - Compensation and benefits steady at $80mm, Net gain on loan sales / total revenue 26% 28% (200 bps) despite full quarter of DCB Mortgage rate lock commitments, fallout adjusted $9,011 $7,722 $1,289 17% - Commissions and loan processing expense Mortgage closings $9,040 $7,886 $1,154 15% increased $8mm on higher mortgage closings Net gain on loan sale margin, HFS 0.71% 0.77% (6 bps) - Low incremental expense from growing community banking N/M – not meaningful 7
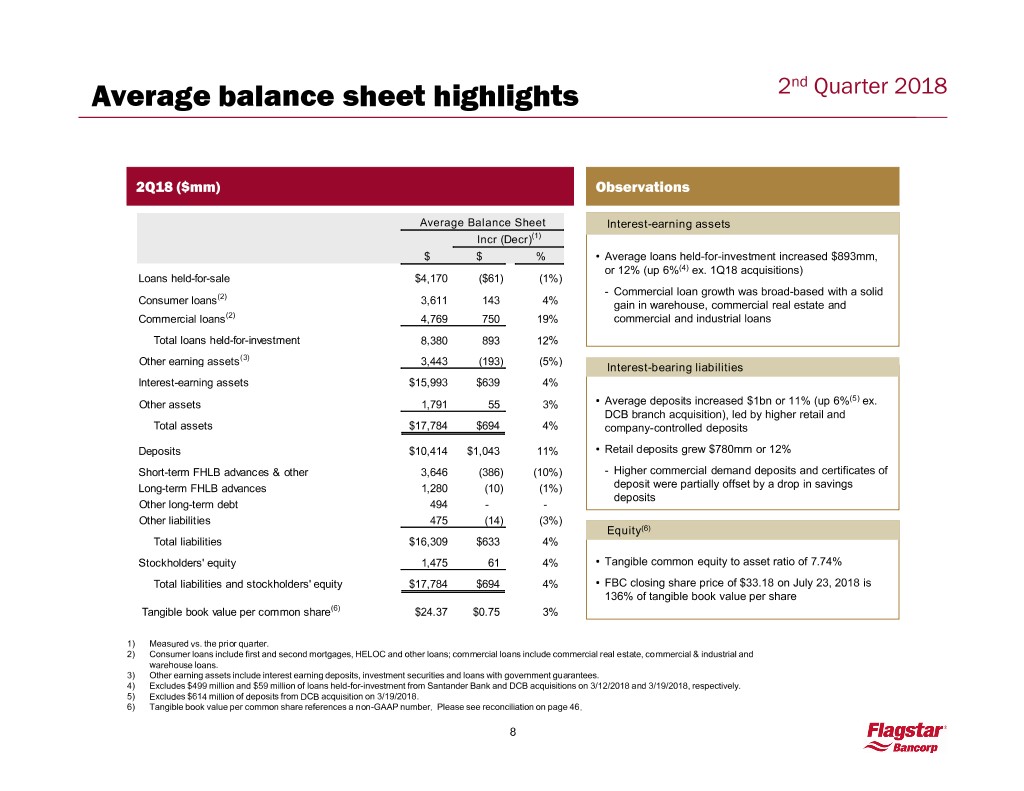
Average balance sheet highlights 2nd Quarter 2018 2Q18 ($mm) Observations Average Balance Sheet Interest-earning assets Incr (Decr)(1) $ $ % • Average loans held-for-investment increased $893mm, or 12% (up 6%(4) ex. 1Q18 acquisitions) Loans held-for-sale $4,170 ($61) (1%) (2) - Commercial loan growth was broad-based with a solid Consumer loans 3,611 143 4% gain in warehouse, commercial real estate and Commercial loans(2) 4,769 750 19% commercial and industrial loans Total loans held-for-investment 8,380 893 12% Other earning assets(3) 3,443 (193) (5%) Interest-bearing liabilities Interest-earning assets $15,993 $639 4% (5) Other assets 1,791 55 3% • Average deposits increased $1bn or 11% (up 6% ex. DCB branch acquisition), led by higher retail and Total assets $17,784 $694 4% company-controlled deposits Deposits $10,414 $1,043 11% • Retail deposits grew $780mm or 12% Short-term FHLB advances & other 3,646 (386) (10%) - Higher commercial demand deposits and certificates of Long-term FHLB advances 1,280 (10) (1%) deposit were partially offset by a drop in savings deposits Other long-term debt 494 - - Other liabilities 475 (14) (3%) Equity(6) Total liabilities $16,309 $633 4% Stockholders' equity 1,475 61 4% • Tangible common equity to asset ratio of 7.74% Total liabilities and stockholders' equity $17,784 $694 4% • FBC closing share price of $33.18 on July 23, 2018 is 136% of tangible book value per share Tangible book value per common share(6) $24.37 $0.75 3% 1) Measured vs. the prior quarter. 2) Consumer loans include first and second mortgages, HELOC and other loans; commercial loans include commercial real estate, commercial & industrial and warehouse loans. 3) Other earning assets include interest earning deposits, investment securities and loans with government guarantees. 4) Excludes $499 million and $59 million of loans held-for-investment from Santander Bank and DCB acquisitions on 3/12/2018 and 3/19/2018, respectively. 5) Excludes $614 million of deposits from DCB acquisition on 3/19/2018. 6) Tangible book value per common share references a non-GAAP number. Please see reconciliation on page 46. 8

Asset quality 2nd Quarter 2018 Performing TDRs and NPLs ($mm) Delinquencies ($mm) Performing TDRs NPLs 30-89 days Delinquenciespast due GreaterNPL than to LHFI 90 days Ratio past due $36$36 $36$36 $34 $34$34 $30$30 $76 $77 $78 $72 $70 30 31 29 0.44% 0.44% 29 27 30 31 29 29 0.38% 27 0.35% 0.30% 46 46 43 49 43 6 5 5 5 3 6/30/2017 9/30/2017 12/31/2017 3/31/2018 6/30/2018 6/30/2017 9/30/2017 12/31/2017 3/31/2018 6/30/2018 2Q17 3Q17 4Q17 1Q18 2Q18 Allowance coverage(1) (% of loans HFI) Representation & warranty reserve(2) ($mm) Total Consumer Commercial Reserve Repurchase pipeline $20 2.5% 2.3% $16 $15 2.0% 2.1% 2.0% 2.0% $13 $12 1.8% 1.7% 1.7% $6 1.7% 1.5% 1.7% 1.6% $5 $5 1.5% 1.4% $4 $3 6/30/2017 9/30/2017 12/31/2017 3/31/2018 6/30/2018 6/30/2017 9/30/2017 12/31/2017 3/31/2018 6/30/2018 1) Excludes loans carried under the fair value option and loans with government guarantees. 2) Please see slide 45 in the appendix for further details on the representation and warranty reserve. 9

Robust capital 2nd Quarter 2018 Flagstar Bancorp Capital Ratios Observations 2Q18 Tier 1 CET-1 Tier 1 Total RBC Balance sheet impact Net earnings contribution Leverage to RWA to RWA to RWA Additional impact from 2018 acquisitions(1) Change in MSR balance 2Q18 Actual 8.7% 10.8% 12.9% 14.0% Proforma ratio under Capital Simplification proposal(2) 1Q18 Actual 8.7% 10.8% 12.9% 14.1% Tier 1 Leverage Total Risk Based Capital • Tier 1 leverage ratio ended quarter at 8.7% (365bp stress buffer above “well capitalized”) 14.23% 14.17% - Decrease led by balance sheet growth (35bps), including the 14.14% 14.04% impact of 1Q18 acquisitions (24bps), largely offset by earnings -52bps -8bps +50bps retention (34bps) - Target range of 8-9% • Closely monitoring total risk-based capital ratio due to increase in risk weights and continued growth in commercial loans 9.18% 9.14% Well - Ended quarter at 14.0% (404bp stress buffer above “well Capitalized 8.72% 8.65% capitalized”) -24bps -11bps -6bps +34bps 10.0% - Target range of 13-14% • Capital Simplification proposal would increase Tier 1 leverage ratio ~50 bps(2) and total risk-based capital ratio by ~15 bps(2) to support balance sheet growth Well Capitalized • Flagstar will generate capital at pre-tax rate as it utilizes its NOL- 5.0% related DTAs - $56mm of NOL-related DTAs (31bps of Tier 1 leverage), approximately half of which we expect will be utilized in the second half of 2018 3/31/2018 6/30/2018 3/31/2018 6/30/2018 1) Full quarter impact on increase in average balances due to 1Q18 acquisitions 2) Non-GAAP number. Please see reconciliation on page 46. 10
Business Segment Overview 2nd Quarter 2018 Lee Smith, COO
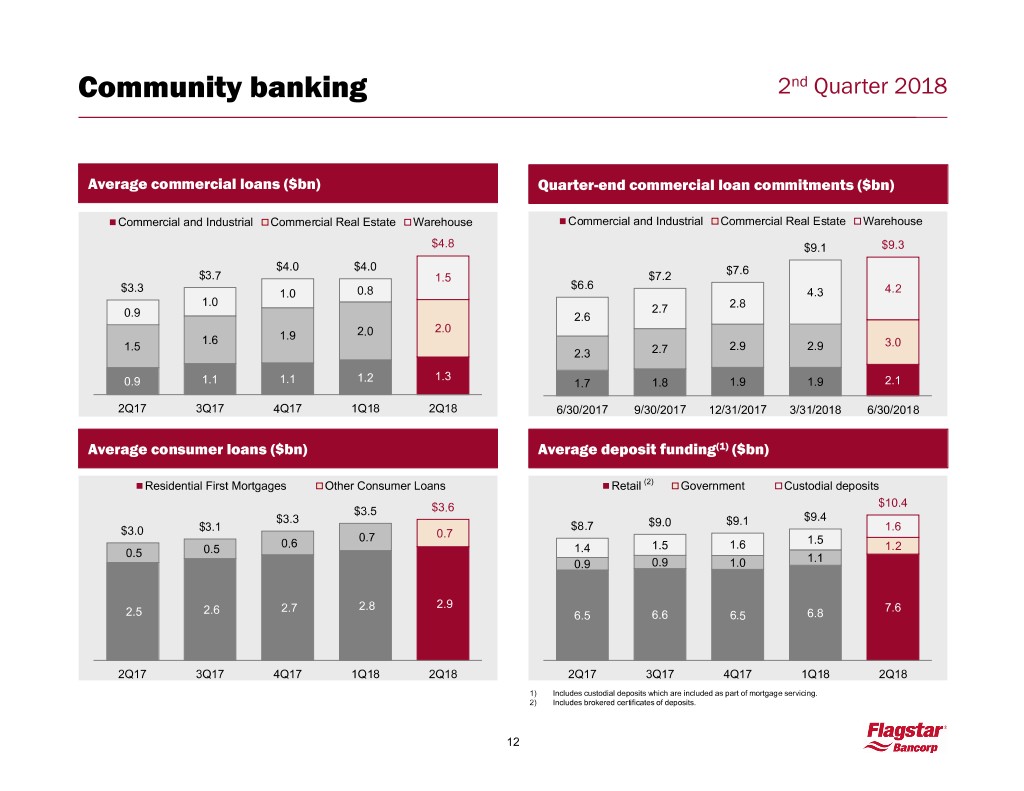
Community banking 2nd Quarter 2018 Average commercial loans ($bn) Quarter-end commercial loan commitments ($bn) Commercial and Industrial Commercial Real Estate Warehouse Commercial and Industrial Commercial Real Estate Warehouse $4.8 $9.1 $9.3 $4.0 $4.0 $7.6 $3.7 1.5 $7.2 $6.6 $3.3 1.0 0.8 4.3 4.2 1.0 2.7 2.8 0.9 2.6 2.0 2.0 1.6 1.9 1.5 2.9 2.9 3.0 2.3 2.7 1.3 0.9 1.1 1.1 1.2 1.7 1.8 1.9 1.9 2.1 2Q17 3Q17 4Q17 1Q18 2Q18 6/30/2017 9/30/2017 12/31/2017 3/31/2018 6/30/2018 Average consumer loans ($bn) Average deposit funding(1) ($bn) Residential First Mortgages Other Consumer Loans Retail (2) Government Custodial deposits $10.4 $3.5 $3.6 $3.3 $9.0 $9.1 $9.4 $3.0 $3.1 $8.7 1.6 0.7 0.7 0.6 1.5 0.5 1.4 1.5 1.6 1.2 0.5 1.1 0.9 0.9 1.0 2.7 2.8 2.9 7.6 2.5 2.6 6.5 6.6 6.5 6.8 2Q17 3Q17 4Q17 1Q18 2Q18 2Q17 3Q17 4Q17 1Q18 2Q18 1) Includes custodial deposits which are included as part of mortgage servicing. 2) Includes brokered certificates of deposits. 12

Mortgage originations 2nd Quarter 2018 Closings by purpose ($bn) Fallout-adjusted locks ($bn) Purchase originations Refinance originations $9.0 $9.0 $8.9 $8.6 $9.6 $9.7 $9.2 $9.0 $7.7 $7.9 3.7 4.1 4.4 2.6 3.4 6.4 5.5 5.5 5.3 4.5 2Q17 3Q17 4Q17 1Q18 2Q18 2Q17 3Q17 4Q17 1Q18 2Q18 Purchase 58% 55% 54% 59% 72% Mix % Closings by mortgage type ($bn) Net gain on loan sales – revenue and margin Conventional Government Jumbo Gain on loan sale ($mm) Gain on sale margin (HFS) $9.6 $9.7 $79 $9.2 $9.0 $75 2.5 $7.9 $66 $63 2.2 2.9 2.2 $60 1.9 2.3 2.4 2.2 2.7 0.91% 2.1 0.84% 0.77% 0.73% 0.71% 4.9 4.6 4.5 3.9 4.1 2Q17 3Q17 4Q17 1Q18 2Q18 2Q17 3Q17 4Q17 1Q18 2Q18 13
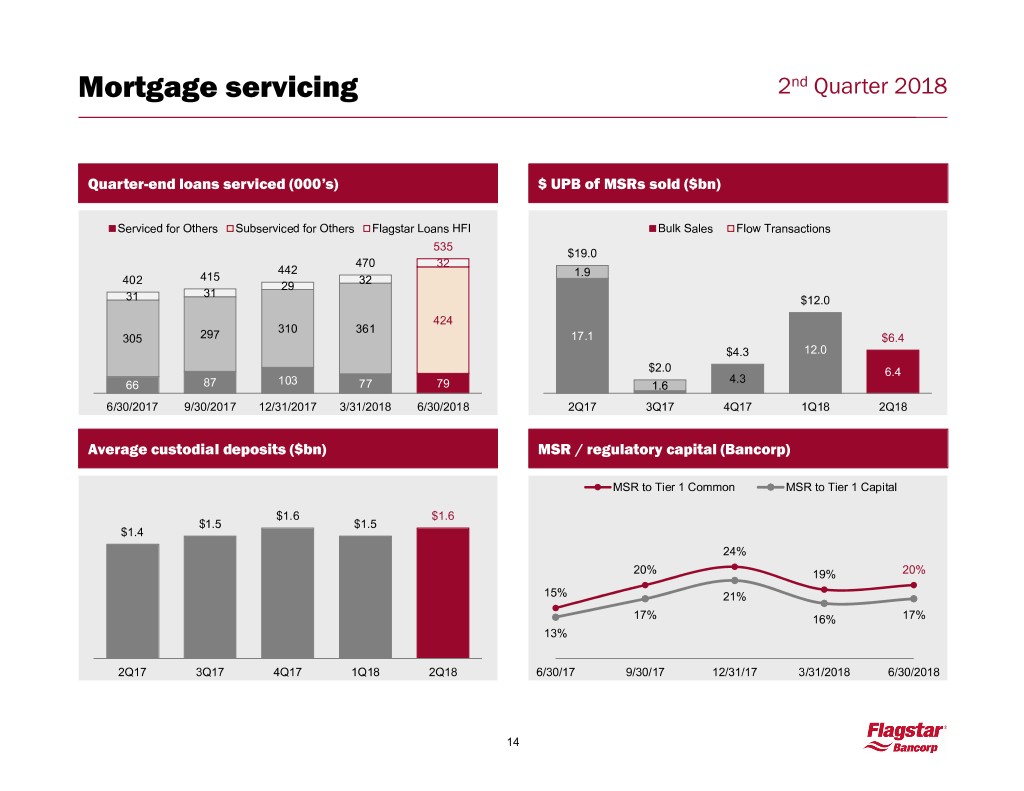
Mortgage servicing 2nd Quarter 2018 Quarter-end loans serviced (000’s) $ UPB of MSRs sold ($bn) Serviced for Others Subserviced for Others Flagstar Loans HFI Bulk Sales Flow Transactions 535 $19.0 470 32 442 1.9 402 415 32 29 31 31 $12.0 424 310 361 305 297 17.1 $6.4 $4.3 12.0 $2.0 6.4 4.3 66 87 103 77 79 1.6 6/30/2017 9/30/2017 12/31/2017 3/31/2018 6/30/2018 2Q17 3Q17 4Q17 1Q18 2Q18 Average custodial deposits ($bn) MSR / regulatory capital (Bancorp) MSR to Tier 1 Common MSR to Tier 1 Capital $1.6 $1.6 $1.5 $1.5 $1.4 24% 20% 19% 20% 15% 21% 17% 16% 17% 13% 2Q17 3Q17 4Q17 1Q18 2Q18 6/30/17 9/30/17 12/31/17 3/31/2018 6/30/2018 14

Noninterest expense and efficiency ratio 2nd Quarter 2018 ● Lower efficiency ratio led by strong, positive operating leverage Quarterly noninterest expense ($mm) and efficiency ratio Noninterest expense Efficiency ratio $178 $177 $171 $173 $154 80% 77% 74% 74% 72% 2Q17 3Q17 4Q17 1Q18 2Q18 15

Closing Remarks / Q&A 2nd Quarter 2018 Sandro DiNello, CEO
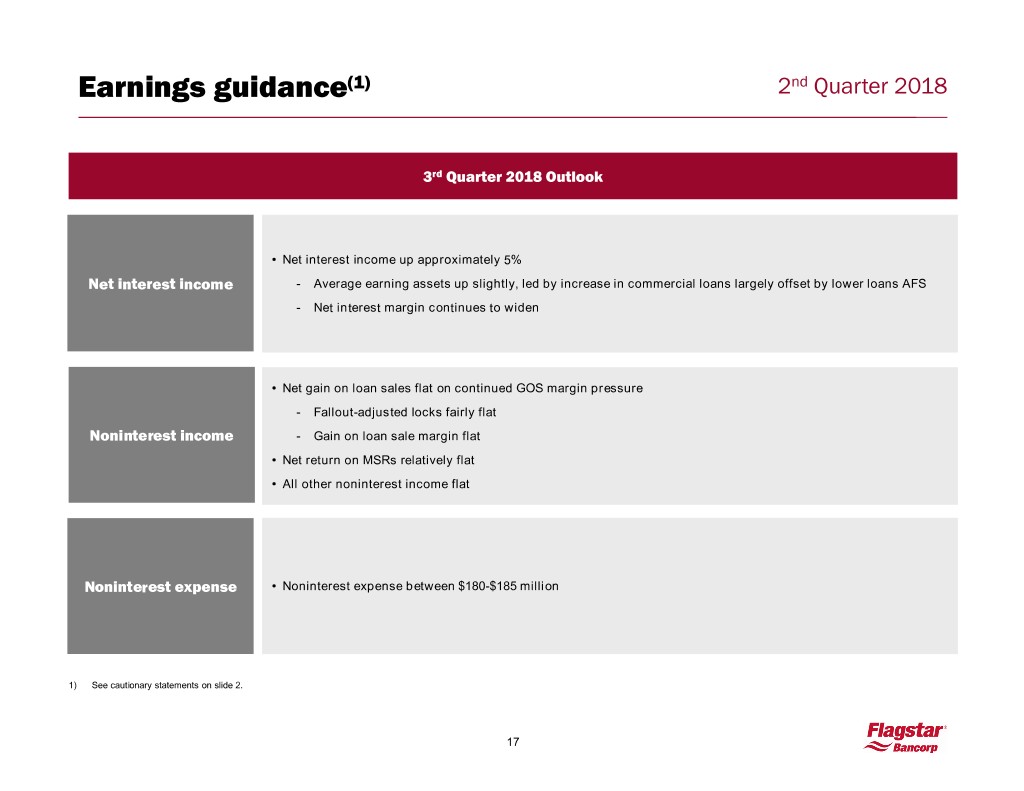
Earnings guidance(1) 2nd Quarter 2018 3rd Quarter 2018 Outlook • Net interest income up approximately 5% Net interest income - Average earning assets up slightly, led by increase in commercial loans largely offset by lower loans AFS - Net interest margin continues to widen • Net gain on loan sales flat on continued GOS margin pressure - Fallout-adjusted locks fairly flat Noninterest income - Gain on loan sale margin flat • Net return on MSRs relatively flat • All other noninterest income flat Noninterest expense • Noninterest expense between $180-$185 million 1) See cautionary statements on slide 2. 17
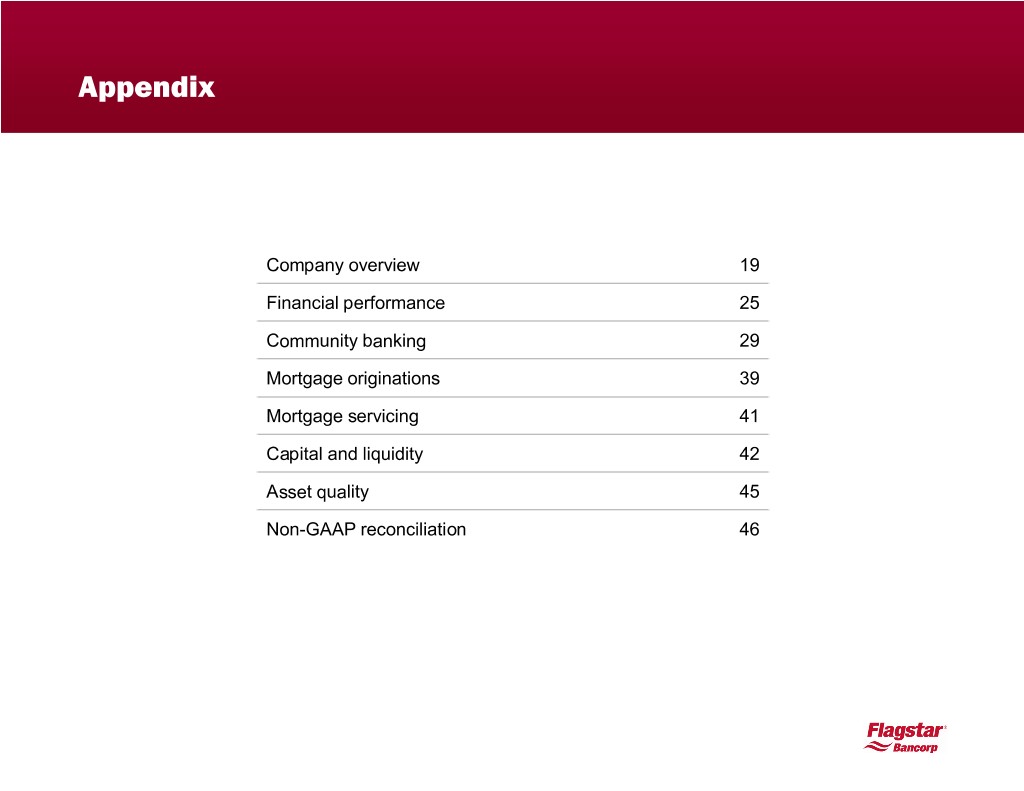
Appendix 2nd Quarter 2018 Company overview 19 Financial performance 25 Community banking 29 Mortgage originations 39 Mortgage servicing 41 Capital and liquidity 42 Asset quality 45 Non-GAAP reconciliation 46

COMPANY OVERVIEW Flagstar at a glance 2nd Quarter 2018 Corporate Overview • Traded on the NYSE (FBC) • Headquartered in Troy, MI 108 52 49 39 Pending Flagstar Opes Flagstar Acquisition of retail home retail home • Market capitalization $1.9bn Bank Wells Fargo lending lending Branches(1)(2) • Member of the Russell 2000 Index Branches offices(3) offices(4) 99 Branches in Community banking Michigan • Leading Michigan-based bank with a balanced, diversified lending platform • $18.1bn of assets and $10.6bn of deposits • More than 125k household & 17k business relationships Mortgage origination • Leading national originator of residential mortgages ($36.2bn during last twelve months to June 30, 2018) • 88 retail home lending offices operating in 31 states with direct-to-consumer in all 50 states • More than 1,000 correspondent and nearly 800 broker relationships Mortgage servicing • 7th largest sub-servicer of mortgage loans nationwide Operations center • Currently servicing approximately 583k loans as of July 15, 2018 • Efficiently priced deposits from escrow balances 1) Includes 8 Desert Community Bank branches in the High Desert region of San Bernardino County, CA. 2) Includes 1 branch in MI that opened on July 23, 2018 3) Includes seven home lending offices located in banking branches. 4) Opes has one retail lending office in Honolulu, HI that is not pictured on this map. 19
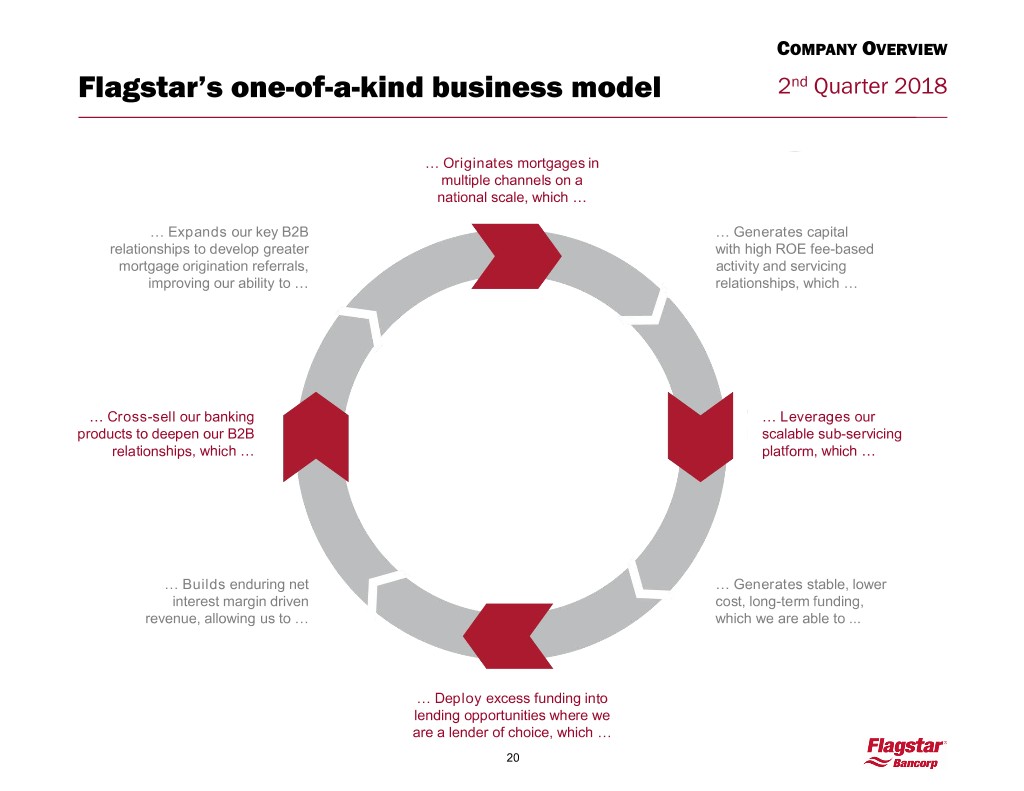
COMPANY OVERVIEW Flagstar’s one-of-a-kind business model 2nd Quarter 2018 … Originates mortgages in multiple channels on a national scale, which … … Expands our key B2B … Generates capital relationships to develop greater with high ROE fee-based mortgage origination referrals, activity and servicing improving our ability to … relationships, which … … Cross-sell our banking … Leverages our products to deepen our B2B scalable sub-servicing relationships, which … platform, which … … Builds enduring net … Generates stable, lower interest margin driven cost, long-term funding, revenue, allowing us to … which we are able to ... … Deploy excess funding into lending opportunities where we are a lender of choice, which … 20

COMPANY OVERVIEW Flagstar’s integrated business model 2nd Quarter 2018 ● Illustrative case studies detailed below: Residential MBS Investor Home Builder Wholesale Originator Initial relationship Initial relationship Initial relationship • Bulk sale of MSRs with subservicing • Provided home builder line of credit • Established correspondent lending retained (2013 - 2014) (2016) relationship (2017) Expanded relationship - Unsecured non-real estate - Purchased nearly $300mm of commitments of $30mm mortgages since inception (2017) • Provided MSR lending facility (2016) Expanded relationship Expanded relationship - Commitments of $50mm collateralized by FNMA MSRs • Participated in syndicated • Warehouse line of credit (2017) warehouse facility to captive - Subservice non-Flagstar mortgage mortgage operation (2016 - 2017) - Commitments of $50mm accounts providing fee income - Commitments of $36mm • Initiated subservicing agreement • Portfolio recapture services provided (2017) with direct-to-consumer refinancings - 1 of 3 participants in the of nearly $300mm since inception syndication - Entire portfolio of newly originated (2016) mortgage loans are on-boarded with Flagstar • Additional bulk and flow sales of MSRs with subservicing retained (2017 and 2018) 21

COMPANY OVERVIEW Flagstar has a strong executive team 2nd Quarter 2018 Board of Directors John Lewis Chairman Chief Audit Officer Sandro DiNello Brian Dunn President & CEO • CEO since 5/13 • Over 35 years of banking experience with Flagstar and its predecessors with a strong emphasis on community banking, including the management of retail operations and product strategy Chief Chief Mortgage Community Chief Risk General Operating Officer Financial Officer Banking Banking Officer Counsel Lee Smith Jim Ciroli Kristy Fercho Drew Ottaway Steve Figliuolo Patrick McGuirk • COO since 5/13 • CFO since 8/14 • Appointed • Executive Vice • CRO since 6/14 • General Counsel • Formerly a partner • More than 30 years President of President, Michigan • Over 35 years of since 6/15 of MatlinPatterson of banking and Mortgage effective Market President financial services • Over 20 years of Global Advisors and financial services 9/17 and Managing experience with financial services a Senior Director at experience with • Has 15 years Director, Lending Citizens Republic, legal experience Zolfo Cooper First Niagara, experience with • With Flagstar since Fleet Boston with the FDIC and • Extensive expe- Huntington and Fannie Mae in 12/15 and has 30 Financial, First Sidley Austin LLP rience in financial KeyCorp various executive years of banking Union and Chase management and and leadership and commercial Manhattan operations roles focused on lending experience building banking in southeast • Chartered Accoun- relationships and Michigan with tant in England and growth initiatives Comerica and NBD Wales 22
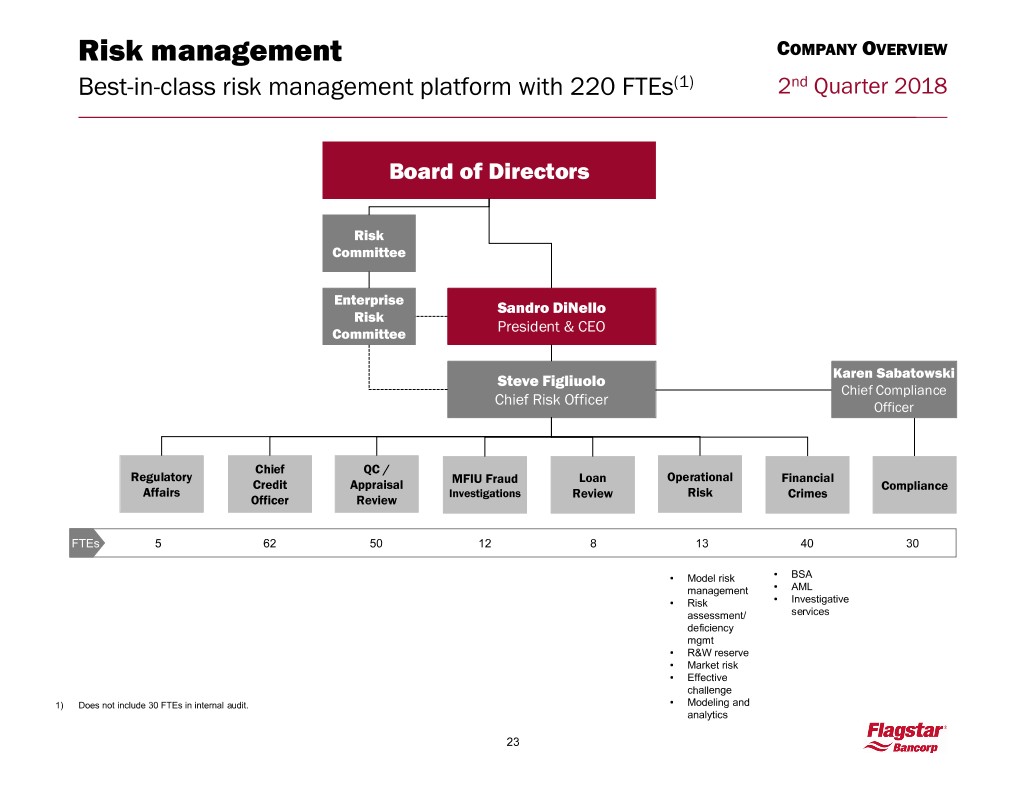
Risk management COMPANY OVERVIEW Best-in-class risk management platform with 220 FTEs(1) 2nd Quarter 2018 Board of Directors Risk Committee Enterprise Sandro DiNello Risk Committee President & CEO Karen Sabatowski Steve Figliuolo Chief Compliance Chief Risk Officer Officer Chief QC / Regulatory MFIU Fraud Loan Operational Financial Credit Appraisal Compliance Affairs Investigations Review Risk Crimes Officer Review FTEs 5 62 50 12 8 13 40 30 • Model risk • BSA management • AML • Risk • Investigative assessment/ services deficiency mgmt • R&W reserve • Market risk • Effective challenge 1) Does not include 30 FTEs in internal audit. • Modeling and analytics 23

COMPANY OVERVIEW Strong growth opportunities 2nd Quarter 2018 Grow community banking Strengthen mortgage business • Opportunistic team lift outs • Recruit experienced talent • Grow national lending platforms(1) - Distributed and direct-to-consumer retail - Expand warehouse lending (300bp spread) - TPO account executives - Grow home builder finance (450bp spread) • Grow servicing operations Build - Build MSR lending (375bp spread; LTVs<60%) - Acquire new sub-servicing relationships • Cultivate middle-market and business banking - Cross-sell additional revenue capabilities relationships • Add specialty lending disciplines and teams 1) Indicated spreads are targets and may not be reflective of actual spreads. 24

FINANCIAL PERFORMANCE Long-term targets 2nd Quarter 2018 Revenues Banking Mortgage • Lender of choice in key markets (Michigan, • Nationally recognized leader national lending platforms) • Growth trajectory 10 - 15% • Maintain market share - Every additional $1bn of earning assets increases - Widen margin pre-tax profits ~$20mm – $25mm - Rotate lower spread assets to higher spread assets - Expand retail originations while minimizing capital costs • Every 100k in new loans sub-serviced generates - Scalable platforms with balance sheet growth at low $4mm - $6mm of incremental pre-tax profits incremental cost Financial Performance Return on assets Return on equity • Long-term target of 1.1 – 1.7% • Long-term target of 12 - 17% - Add incremental revenue with low incremental cost - Add / increase high ROE businesses - Improved risk management will deliver long-run savings 25

FINANCIAL PERFORMANCE Higher net interest income is stabilizing earnings 2nd Quarter 2018 ● Sold lower performing assets and re-deployed capital into higher spread commercial loans ● Transition to more stable net interest income Average earning assets and net interest income Net interest income ($mm) Average earning assets ($bn) $16.0 CAGR 20% $15.4 $15.4 $14.7 $14.0 $115 CAGR 19% $12.8 $107 $106 $12.3 $12.3 $103 $11.9 $11.6 $97 $11.2 $10.7 $87 $10.4 $83 $79 $80 $9.4 $76 $77 $8.7 $73 $73 $65 $61 4Q14 1Q15 2Q15 3Q15 4Q15 1Q16 2Q16 3Q16 4Q16 1Q17 2Q17 3Q17 4Q17 1Q18 2Q18 26

FINANCIAL PERFORMANCE Price target has increased on improved prospects 2nd Quarter 2018 Analyst rating history $46 100% 8 out of 9 analysts $42 at Buy at 6/30/18 75% $38 $34 50% $30 As of 7/23/2018 Actual Price: $33.18 Target Price: $40.75 25% $26 $22 0% 6/17 7/17 8/17 9/17 10/17 11/17 12/17 1/18 2/18 3/18 4/18 5/18 6/18 Hold Buy Actual Price Target Price Source: Analyst ratings and target price (consensus estimate) as reported by First Call as of 6/30/2018. 27
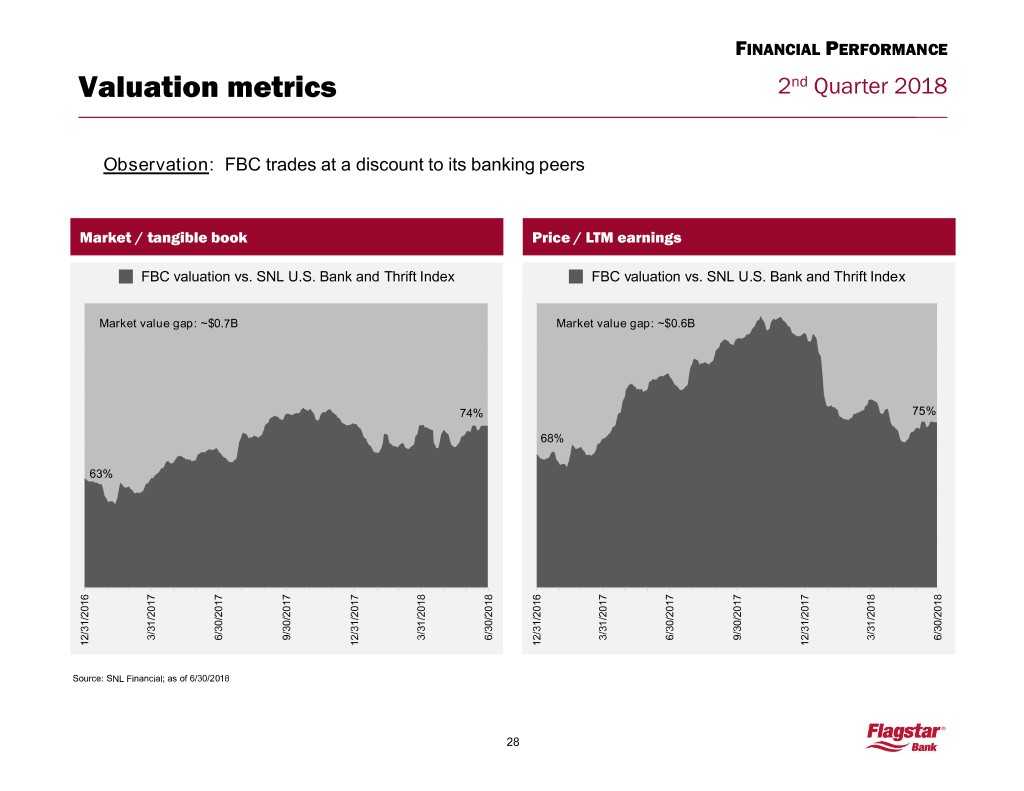
FINANCIAL PERFORMANCE Valuation metrics 2nd Quarter 2018 Observation: FBC trades at a discount to its banking peers Market / tangible book Price / LTM earnings . FBC valuation vs. SNL U.S. Bank and Thrift Index . FBC valuation vs. SNL U.S. Bank and Thrift Index Market value gap: ~$0.7B Market value gap: ~$0.6B 74% 75% 68% 63% 1/31/2017 2/28/2017 3/31/2017 4/30/2017 5/31/2017 6/30/2017 7/31/2017 8/31/2017 9/30/2017 1/31/2018 2/28/2018 3/31/2018 4/30/2018 5/31/2018 6/30/2018 1/31/2017 2/28/2017 3/31/2017 4/30/2017 5/31/2017 6/30/2017 7/31/2017 8/31/2017 9/30/2017 1/31/2018 2/28/2018 3/31/2018 4/30/2018 5/31/2018 6/30/2018 12/31/2016 10/31/2017 11/30/2017 12/31/2017 12/31/2016 10/31/2017 11/30/2017 12/31/2017 Source: SNL Financial; as of 6/30/2018 28

COMMUNITY BANKING Strong market position 2nd Quarter 2018 Market characteristics Flagstar’s branch network Leading position in Michigan 2017 Rank Deposits ($mm) % YoY Overall MI-based Institution Branches Total Share Change 1 Chase 234 $43,668 21% 5% 2 Comerica 197 29,481 14% 14% 3 PNC 117 17,796 8% 11% 4 Bank of America 190 17,425 8% 5% 5 Fifth Third 211 16,954 8% 7% 6 Huntington 316 14,756 7% 8% 7 1 Chemical 206 11,565 6% 6% 8 2 Flagstar(1) 113 9,631 5% 3% 9 Citizens 95 5,538 3% 9% 10 TCF 52 3,010 1% 13% Top 10 1,731 $169,825 81% 8% Attractive Midwest markets Flagstar Deposits Deposit Median Proj HHI Proj pop Market $mm % of total mkt share HHI(3) grow th(3)(4) grow th(3)(4) Oakland County(2) 3,497 35.6% 6.7% 76,705 11.7% 1.9% Fort Wayne(5) 1,302 13.3% 11.5% 54,542 9.1% 2.8% Grand Rapids MSA 415 4.2% 2.0% 61,391 10.9% 3.3% Ann Arbor MSA 351 3.6% 4.0% 69,221 8.9% 3.3% Key Flagstar markets 5,565 56.7% 6.0% 69,930 10.9% 2.3% Existing Flagstar Michigan branches (99) National aggregate 61,045 8.9% 3.5% Wells Fargo branches pending acquisition (52) Source: S&P Global Market Intelligence; Note: Deposit data as of June 30, 2017 and projections based on 2018 estimates; MI-based banks highlighted. 1) Reflects the pending acquisition of 14 Wells Fargo branches located in Michigan 2) Oakland County data excludes $1.5bn of custodial deposits held at company headquarters. 3) Flagstar Median HHI, projected HHI growth and projected population growth are deposit weighted. 4) 2018–2023 CAGR. 5) Fort Wayne, IN market area includes Forth Wayne, IN Fed District plus the cities of Monticello, Peru, Rochester, Rushville, and Wabash, IN and Van Wert, OH. 29

Deposits COMMUNITY BANKING Portfolio and strategy overview 2nd Quarter 2018 Total average deposits ($bn) (2) Retail deposits Other deposits $10.4 $9.4 $8.7 $9.0 $9.1 2.8 2.6 • Flagstar gathers deposits from consumers, 2.2 2.5 2.6 businesses and select governmental entities – Traditionally, CDs and savings accounts 7.6 6.5 6.5 6.5 6.8 represented the bulk of our branch-based retail depository relationships – Today, we are focused on growing DDA 2Q17 3Q17 4Q17 1Q18 2Q18 balances with consumer, business banking and 2Q18 total average deposits commercial relationships Government, Custodial, 11% – We additionally maintain depository 15% relationships in connection with our mortgage DDA, origination and servicing businesses, and with 17% Michigan governmental entities CD(2), 22% – Cost of total deposits equal to 0.82%(1) 74% retail MMDA, 2% Savings, 33% Total : $10.4bn 0.82% cost of total deposits(1) 1) Total deposits include noninterest bearing deposits. 2) Includes brokered CDs 30

COMMUNITY BANKING Deposit growth opportunities 2nd Quarter 2018 Core Deposits Other Deposits Retail Government • Average balance of $6.9bn during 2Q18 of which 55% are • Average balance of $1.2bn during 2Q18 demand & savings accounts • Cost of total government deposits: 1.08%(2) during 2Q18 • Cost of total core deposits(1): 0.95%(2) during 2Q18 • Michigan deposits are not required to be collateralized • Average core deposits of $72mm per branch • Strong, long-term relationships across the state • Flagstar’s branding is helping grow core deposits • Branch acquisitions significantly enhance core deposit base Commercial Custodial • Average balance of $0.7bn during 2Q18 • Average balance of $1.6bn during 2Q18 on 535k loans serviced and subserviced • Flagstar is focused on growing commercial deposits • Deposit balances increase along with the number of loans - Increasing balances with growing lines of serviced and subserviced business, including home builder finance • Offer complete line of treasury management services 1) Core deposits = total deposits excluding government deposits and custodial deposits. 2) Total deposits include noninterest bearing deposits. 31

Pending Wells Fargo Branch Acquisition COMMUNITY BANKING Transaction Overview 2nd Quarter 2018 • Flagstar is acquiring 52 branches located in Indiana, Michigan, Wisconsin and Ohio from Wells Fargo - Approximately $2.3 billion of deposits at an average cost of 0.04%(1) Transaction - 66% of deposits are located in IN (33 branches); 26 branches in Fort Wayne, IN (#1 market share) (2) summary - 27% are located in the Upper Peninsula of MI (14 branches); #1 market share (2) - 7% are located in WI (4 branches) and OH (1 branch) - Approximately $130 million of loans(1) • Effective deposit premium of approximately 7 percent based on balances as of December 31, 2017 Financial • Expected to be accretive to earnings per share in 2019 consideration • Tangible book value payback period of significantly less than 5 years • Conducted comprehensive due diligence • Transaction is subject to regulatory approval; closing is expected in early fourth quarter 2018 Other considerations • Intend to keep all branches and retain all employees • Target an 8 - 9 percent Tier 1 leverage ratio at close. Any capital needed is expected to be met through a combination of earnings retention and balance sheet management (1) As of December 31, 2017. (2) Source: FDIC Summary of Deposits as of June 30, 2017; acquired branch data as of December 31, 2017; Fort Wayne, IN market area includes Forth Wayne, IN Fed District plus the cities of Monticello, Peru, Rochester, Rushville, and Wabash, IN and Van Wert, OH; Upper Peninsula of MI market area includes the counties of Delta, Dickinson, Gogebic, Houghton, Iron, Marquette, and Menominee, MI. 32

Pending Wells Fargo Branch Acquisition COMMUNITY BANKING Strategic Rationale 2nd Quarter 2018 • Improves ability to increase presence in well-known Midwest market - #1 market share in Fort Wayne, IN and Upper Peninsula of MI markets(1) Builds Midwest footprint • Adds nearly 200,000 new customers/relationships; more than doubles customer base • Completion of the proposed Wells Fargo branch acquisition together with the recently completed DCB branch acquisition will significantly expand branch network in short time • Transformational banking transaction Enhances franchise • Moves funding from wholesale borrowings to core deposits, reducing rate sensitivity of funding base value - Interest-bearing demand deposits increase to 12 percent of total deposits - Total funding cost drops 21 basis points(2) • Transaction provides low-cost, stable funding • At closing, liquidity will be used to repay short-term FHLB advances Transforms funding - Wholesale funding ratio falls 13 percentage points to 23 percent(3) source - HFI loan-to-deposit ratio declines 18 percentage points to 66 percent(4) • Longer-term, larger branch network expands access to core deposits and other business opportunities (1) Source: FDIC Summary of Deposits as of June 30, 2017; acquired branch data as of December 31, 2017; Fort Wayne, IN market area includes Forth Wayne, IN Fed District plus the cities of Monticello, Peru, Rochester, Rushville, and Wabash, IN and Van Wert, OH; Upper Peninsula of MI market area includes the counties of Delta, Dickinson, Gogebic, Houghton, Iron, Marquette, and Menominee, MI. (2) Pro-forma as of March 31, 2018. Total funding cost is interest expense on interest-bearing liabilities divided by average funding liabilities (interest-bearing liabilities plus noninterest-bearing deposits). (3) Pro-forma as of March 31, 2018. Wholesale funding ratio is average wholesale funding (wholesale deposits plus FHLB advances) divided by average funding liabilities. (4) Pro-forma as of March 31, 2018. HFI loan-to-deposit ratio is average HFI loans (excluding warehouse loans) divided by total average deposits (excluding custodial deposits). 33

Lending COMMUNITY BANKING Portfolio and strategy overview 2nd Quarter 2018 Total average loans ($bn) Loans HFS Loans HFI Loans with government guarantees $12.8 $10.8 $12.1 $12.0 • Flagstar’s largest category of earning assets consists $10.8 of loans held-for-investment which averaged $8.3bn during 2Q18 7.3 7.5 8.3 6.2 6.8 – Loans to consumers consist of residential first and second mortgage loans, HELOC and other – C&I / CRE lending is an important growth strategy, 4.3 4.5 4.5 4.2 4.2 offering risk diversification and asset sensitivity 2Q17 3Q17 4Q17 1Q18 2Q18 – Warehouse lending to both originators that sell to Flagstar and those who sell to other investors 2Q18 average loans • Flagstar maintains a balance of mortgage loans held- 1st Mortgage for-sale which averaged $4.2bn during 2Q18 HFI, 22% – Essentially all of our mortgage loans originated are 1st Mortgage sold into the secondary market HFS, 32% 2nds, HELOC – Flagstar has the option to direct a portion of the & other, 6% mortgage loans it originates to its own balance sheet Warehouse, Loans with 12% government guarantees, CRE and C&I, 2% 26% 34

COMMUNITY BANKING Community banking growth model 2nd Quarter 2018 Relationship-based growth platform New banker additions (past 2 years) # of Avg Years • Primary focus is to build relationships Line of Service Additions Experience(1) - Recruit experienced bankers from larger regional banks Business Banking 9 25 - Retain seasoned bankers within our organization Commercial Lending 9 24 • Leverage deep industry experience and client Consumer Finance 1 18 relationships CRE Lending 6 20 - Focus on moving relationships and credit facilities to Flagstar Equip Financing 2 30 • Low incremental efficiency ratio Home Builder Finance 5 16 - Marginal cost of 15-30% that varies with type of Indirect Lending 4 24 loans underwritten • Estimated pre-tax contribution of $5bn loan growth Warehouse Lendng 5 26 could contribute ~$1.00 earnings per share Wealth Management 3 13 Grand Total 44 22 (1) We focus on recruitment of bankers with larger, regional bank lending experience. 35

Commercial lending COMMUNITY BANKING Diversified relationship-based commercial lending capabilities 2nd Quarter 2018 Overview Warehouse - $1.8bn (6/30/18) • Warehouse lines with approximately 324 active % Advances sold to Flagstar relationships nationwide, of which approximately 81% Warehouse sell a portion of their loans to Flagstar • Collateralized by mortgage loans being funded which ~125 are paid off once the loan is sold borrowers sell <25% • Diversified property types which are primarily income- Commercial producing in the normal course of business Real Estate • Focused on experienced top-tier developers with ~70 ~130 significant deposit and non-credit product opportunities borrowers borrowers sell 25% - 75% sell >75% • Lines of credit and term loans for working capital Commercial needs, equipment purchases, and expansion projects & Industrial • Primarily Michigan based relationships or relationships with national finance companies Average 25% advances sold to Flagstar Commercial Real Estate - $2.0bn (6/30/18) Commercial & Industrial - $1.3bn (6/30/18) Property type Industry Manufacturing 16% Office Owner occupied 11% Healthcare Retail 16% 15% Services 9% 22% Multi- Hospitality Distribution family 7% 7% 17% Home Financial, insurance & builder Other Government & real estate finance 6% education 28% 38% Other 6% 2% 69% Relationship-Based Lending(1) 1) Includes Michigan lending, national finance lending, and home builder finance lending 36

COMMUNITY BANKING Warehouse lending 2nd Quarter 2018 ● National relationship-based lending platform ● Attractive asset class with good spreads and low credit risk ● Strong growth potential and scalable platform ● Flagstar is well positioned to gain market share, leveraging relationships in complementary lines of business, including home builder finance and mortgage originations Warehouse lenders ranked by commitments ($mm) FBC warehouse loan commitments ($mm) YOY 1Q18 Outstandings Unfunded Commitments Rank Institution Growth Total Share $4.3 1 JPMorgan Chase 33% $12,000 19% $4.2 2 Wells Fargo 2% 5,700 9% 3 Texas Capital 39% 4,689 7% (1) $2.8 2.4 4 Flagstar Bancorp 75% 4,302 7% $2.6 $2.7 2.9 5 BB&T -1% 3,600 6% 6 TIAA FSB (Everbank) -10% 3,600 6% 1.4 1.5 1.7 7 Customers Bank -1% 3,473 6% 8 Comerica -20% 3,200 5% 1.8 1.4 9 First Tennessee -13% 2,915 5% 1.2 1.2 1.1 10 U.S. Bancorp 25% 2,560 4% Top 10 12% $46,039 74% 6/30/17 9/30/17 12/31/2017 3/31/2018 6/30/2018 1) Flagstar acquired Santander mortgage warehouse business on 3/12/2018. Source: Inside Mortgage Finance as of May 11, 2018. 37
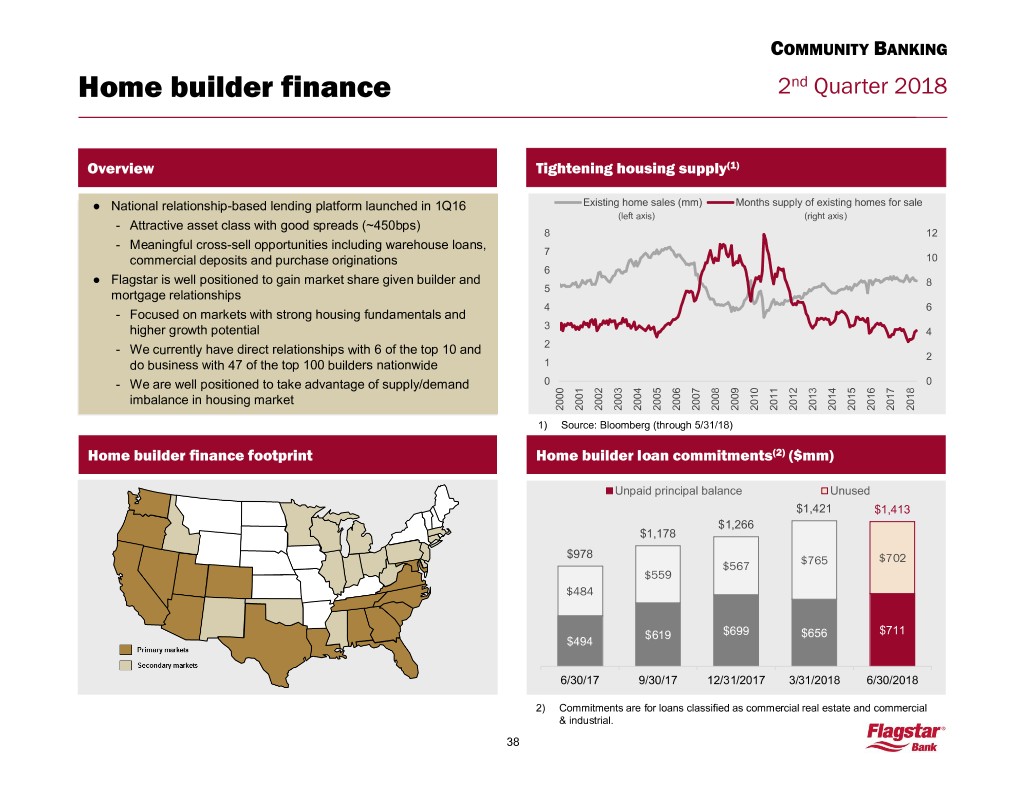
COMMUNITY BANKING Home builder finance 2nd Quarter 2018 Overview Tightening housing supply(1) ● National relationship-based lending platform launched in 1Q16 Existing home sales (mm) Months supply of existing homes for sale (left axis) (right axis) - Attractive asset class with good spreads (~450bps) 8 12 - Meaningful cross-sell opportunities including warehouse loans, 7 commercial deposits and purchase originations 10 6 ● Flagstar is well positioned to gain market share given builder and 8 5 mortgage relationships 4 6 - Focused on markets with strong housing fundamentals and 3 higher growth potential 4 - We currently have direct relationships with 6 of the top 10 and 2 2 do business with 47 of the top 100 builders nationwide 1 - We are well positioned to take advantage of supply/demand 0 0 imbalance in housing market 2000 2001 2002 2003 2004 2005 2006 2007 2008 2009 2010 2011 2012 2013 2014 2015 2016 2017 2018 1) Source: Bloomberg (through 5/31/18) Home builder finance footprint Home builder loan commitments(2) ($mm) Unpaid principal balance Unused $1,421 $1,413 $1,266 $1,178 $978 $702 $567 $765 $559 $484 $619 $699 $656 $711 $494 6/30/17 9/30/17 12/31/2017 3/31/2018 6/30/2018 2) Commitments are for loans classified as commercial real estate and commercial & industrial. 38

MORTGAGE ORIGINATIONS National distribution through multiple channels 2nd Quarter 2018 Residential mortgage originations by channel ($bn) Correspondent Broker Retail $7.3 $7.0 $7.0 $6.6 $5.8 $1.4 $1.3 $1.2 $1.1 $1.1 $1.3 $1.2 $1.3 $0.8 $1.0 2Q17 3Q17 4Q17 1Q18 2Q18 2Q17 3Q17 4Q17 1Q18 2Q18 2Q17 3Q17 4Q17 1Q18 2Q18 (1) • 4.7% market share with #5 national ranking(1) • 2.5% market share with #8 national ranking • Retail distribution share of 14% in 2Q18 vs. 9% in 2Q17 • More than 1,000 correspondent partners • Nearly 800 brokerage relationships • Opes acquisition and organic growth has • Top 10 relationships account for 12% of overall expanded our retail footprint to 88 locations in correspondent volume • Top 10 relationships account for 14% of overall 31 states • Warehouse lines with nearly 300 brokerage volume correspondent relationships • Direct-to-consumer is 11% of retail volume 1) Data source: As reported by Inside Mortgage Finance for 1Q18 published May 25, 2018. 39

Flagstar has restructured its operations to be profitable MORTGAGE ORIGINATIONS even at historical lows for the mortgage origination market 2nd Quarter 2018 U.S. residential mortgage origination market (historical and projected volumes) 5.7 $ in in $ trillions 4.4 4.1 4.0 3.6 3.5 3.0 2.9 2.4 2.3 2.2 2.1 2.1 2.0 2.0 2.0 1.9 1.9 1.8 1.7 1.7 1.7 1.6 1.6 1.5 1.5 1.3 1.3 1.2 1991 1992 1993 1994 1995 1996 1997 1998 1999 2000 2001 2002 2003 2004 2005 2006 2007 2008 2009 2010 2011 2012 2013 2014 2015 2016 2017 2018F 2019F Nominal ($) 0.6 0.9 1.0 0.8 0.6 0.8 0.8 1.7 1.4 1.1 2.2 2.9 3.8 2.8 3.0 2.7 2.4 1.5 2.0 1.7 1.4 2.0 1.8 1.3 1.7 2.1 1.8 1.7 1.7 Real(1) ($) 1.0 1.6 1.7 1.3 1.0 1.2 1.3 2.5 2.0 1.6 3.1 3.9 5.1 3.6 3.8 3.3 2.8 1.8 2.3 1.9 1.6 2.2 2.0 1.3 1.7 2.1 1.8 1.7 1.7 Adjusted(2) ($) 1.3 1.9 2.1 1.5 1.2 1.4 1.5 2.9 2.3 1.8 3.5 4.3 5.6 3.9 4.1 3.5 3.0 1.9 2.4 2.0 1.6 2.2 2.0 1.3 1.7 2.1 1.8 1.7 1.7 Source: Mortgage Bankers Association for actual periods and a blended average of forecast by Fannie Mae, Freddie Mac and Mortgage Bankers Association. 1. Adjusted for historical inflation as reported by Bureau of Labor Statistics (2017 = 100). 2. Adjusted for population growth as reported by the U.S. Census Bureau (2016 = 100). 40
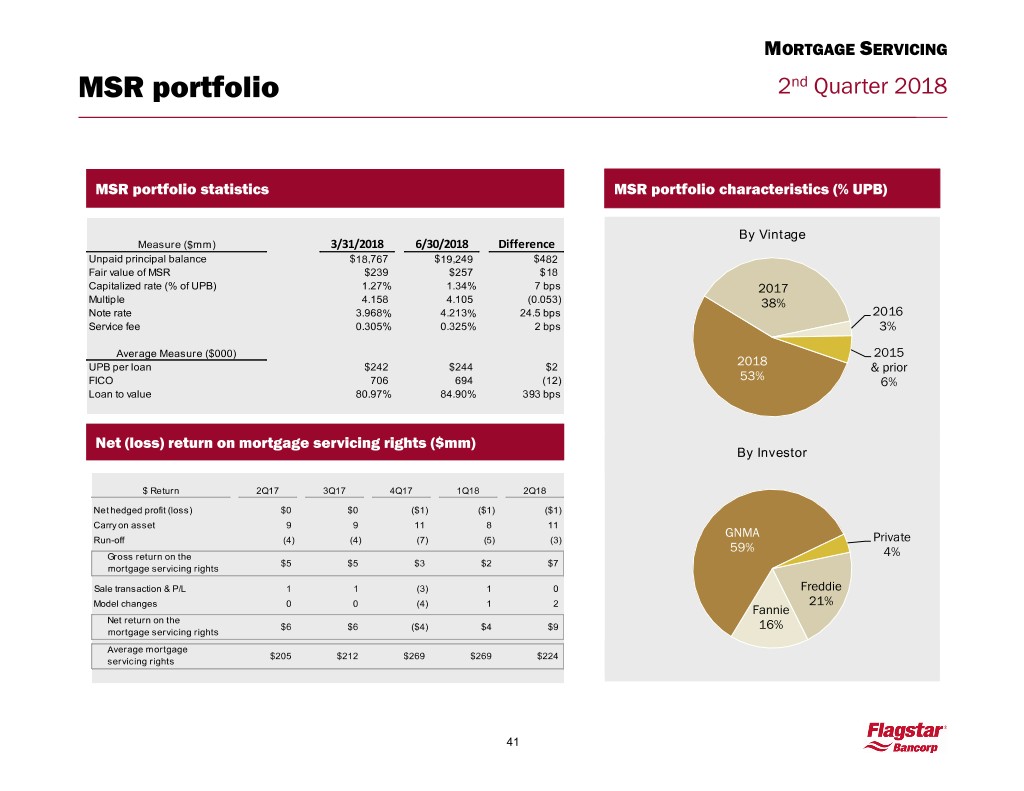
MORTGAGE SERVICING MSR portfolio 2nd Quarter 2018 MSR portfolio statistics MSR portfolio characteristics (% UPB) 2013 & Byby Vintage Measure ($mm) 3/31/2018 6/30/2018 Difference prior; 5% Unpaid principal balance $18,767 $19,249 $482 Fair value of MSR $239 $257 $18 2014; Capitalized rate (% of UPB) 1.27% 1.34% 7 bps 4% 2017 Multiple 4.158 4.105 (0.053) 38% Note rate 3.968% 4.213% 24.5 bps 2015; 2016 Service fee 0.305% 0.325% 2 bps 12% 3% Average Measure ($000) 2015 2018 2016 & UPB per loan $242 $244 $2 later; 79% & prior FICO 706 694 (12) 53% 6% Loan to value 80.97% 84.90% 393 bps Net (loss) return on mortgage servicing rights ($mm) By Investor $ Return 2Q17 3Q17 4Q17 1Q18 2Q18 Net hedged profit (loss) $0 $0 ($1) ($1) ($1) Carry on asset 9 9 11 8 11 GNMA Run-off (4) (4) (7) (5) (3) Private 59% Gross return on the 4% $5 $5 $3 $2 $7 mortgage servicing rights Sale transaction & P/L 1 1 (3) 1 0 Freddie 21% Model changes 0 0 (4) 1 2 Fannie Net return on the $6 $6 ($4) $4 $9 16% mortgage servicing rights Average mortgage $205 $212 $269 $269 $224 servicing rights 41
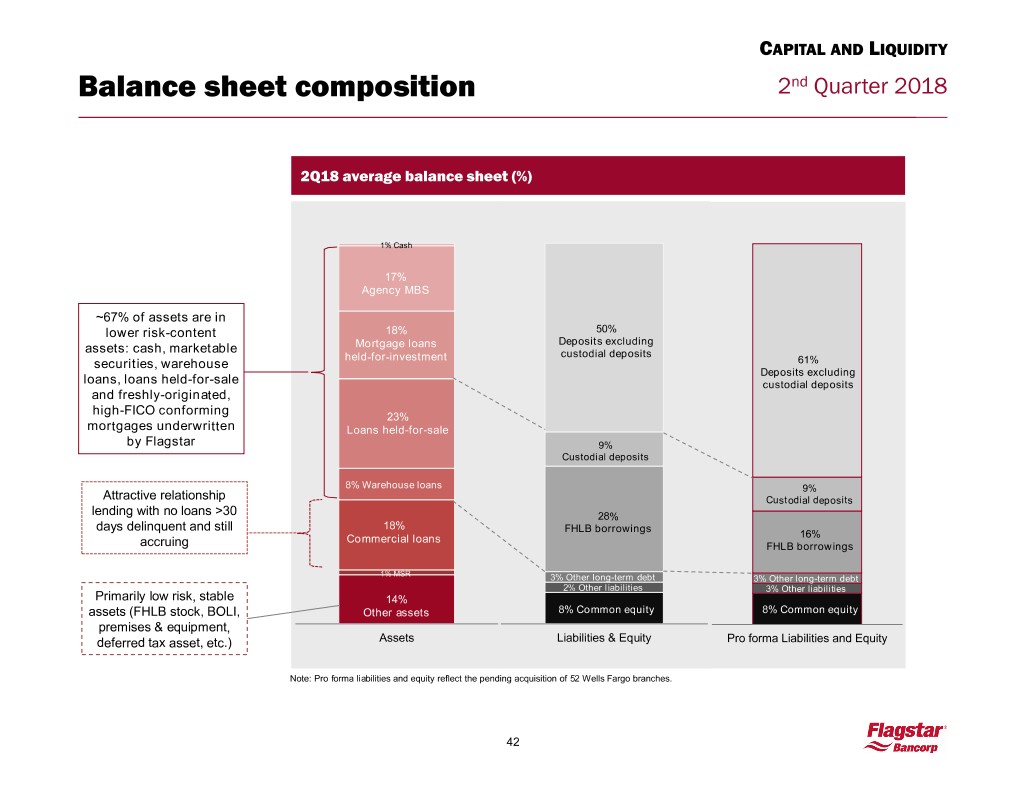
CAPITAL AND LIQUIDITY Balance sheet composition 2nd Quarter 2018 2Q18 average balance sheet (%) 1% Cash 17% Agency MBS ~67% of assets are in lower risk-content 18% 50% 61% Deposits excluding Deposits excluding assets: cash, marketable Mortgage loans held-for-investment custodial deposits custodial deposits securities, warehouse 61% Deposits excluding loans, loans held-for-sale custodial deposits and freshly-originated, high-FICO conforming 23% mortgages underwritten Loans held-for-sale by Flagstar 9% Custodial deposits 8% Warehouse loans 9%9% Attractive relationship CustodialCustodial deposits deposits lending with no loans >30 28% days delinquent and still 18% FHLB borrowings Commercial loans 16%16% accruing FHLBFHLB borrowings borrowings 1% MSR 3% Other long-term debt 3% Other long-term debt 2% Other liabilities 3% Other liabilities Primarily low risk, stable 14% assets (FHLB stock, BOLI, Other assets 8% Common equity 8% Common equity premises & equipment, deferred tax asset, etc.) Assets Liabilities & Equity Pro forma Liabilities and Equity Note: Pro forma liabilities and equity reflect the pending acquisition of 52 Wells Fargo branches. 42

CAPITAL AND LIQUIDITY Liquidity and funding 2nd Quarter 2018 HFI loan-to-deposit ratio(1) Commentary 78% ■ Flagstar has invested significantly in building its Community Bank, which 65% provides attractive core deposit funding for its balance sheet ■ These retail deposits are supplemented by custodial deposits from the servicing business 2Q18 Pro Forma ³ ■ Much of the remainder of Flagstar’s balance sheet is self- (2) Liquidity ratio funding given it is eligible collateral for FHLB advances Cash & investment securities FHLB borrowing capacity (which provides significant liquidity capacity) 35% ■ Pro forma HFI loan-to-deposit ratio(1) declines 13 percentage 24% 18% points to 65 percent 6% ■ Pro forma liquidity ratio(2) at June 30, 2018 increases 11 18% 17% percentage points to 35 percent 6/30/2018 Pro Forma ³ 1) HFI loan-to-deposit ratio is total average loans HFI (excluding warehouse loans) expressed as a percentage of total average deposits (excluding custodial deposits). 2) Cash, investment securities and FHLB borrowing capacity expressed as a percentage of total assets. 3) Pro-forma as of June 30, 2018 for the pending acquisition of 52 Wells Fargo branches. 43

CAPITAL AND LIQUIDITY Low interest rate risk 2nd Quarter 2018 Net interest margin – 12 month horizon instantaneous shocks ($mm) up 100 bps Bear Flattener 6/30/2018 500bps 450bps 400bps 350bps 300bps 250bps 200bps 150bps 100bps 50bps 0bps 1 3 6 1 2 3 5 7 10 20 30 month months months year years years years years years years years Scenario ($ in mm) +100bps Bear Flattener Net interest income $11 ($35) Noninterest Income ($11) to $0 $0 to $35 Economic value of equity, trend (6/30/17 – 6/30/18) 4% down 100bps up 100bps +/-100bps limit 2% 0% -2% -4% -6% -8% 6/30/2017 9/30/2017 12/31/2017 3/31/2018 6/30/2018 44
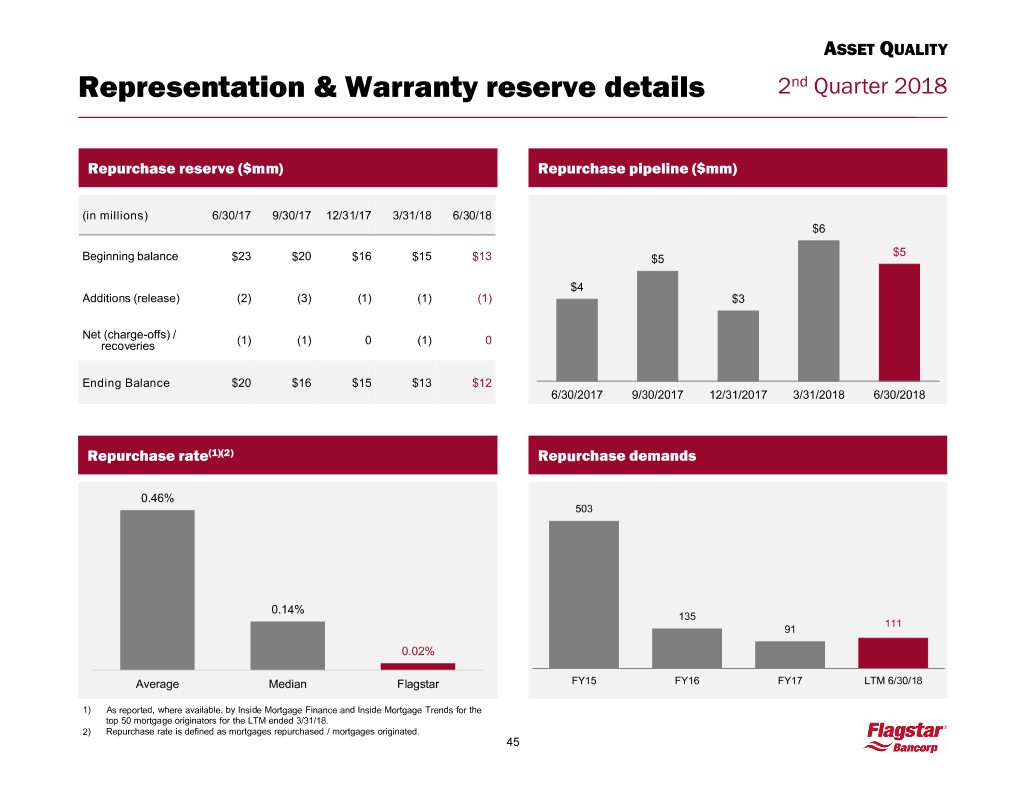
ASSET QUALITY Representation & Warranty reserve details 2nd Quarter 2018 Repurchase reserve ($mm) Repurchase pipeline ($mm) (in millions) 6/30/17 9/30/17 12/31/17 3/31/18 6/30/18 $6 $5 Beginning balance $23 $20 $16 $15 $13 $5 $4 Additions (release) (2) (3) (1) (1) (1) $3 Net (charge-offs) / recoveries (1) (1) 0 (1) 0 Ending Balance $20 $16 $15 $13 $12 6/30/2017 9/30/2017 12/31/2017 3/31/2018 6/30/2018 Repurchase rate(1)(2) Repurchase demands 0.46% 2 503 0.14% 135 111 91 0.02% Average Median Flagstar FY15 FY16 FY17 LTM 6/30/18 1) As reported, where available, by Inside Mortgage Finance and Inside Mortgage Trends for the top 50 mortgage originators for the LTM ended 3/31/18. 2) Repurchase rate is defined as mortgages repurchased / mortgages originated. 45
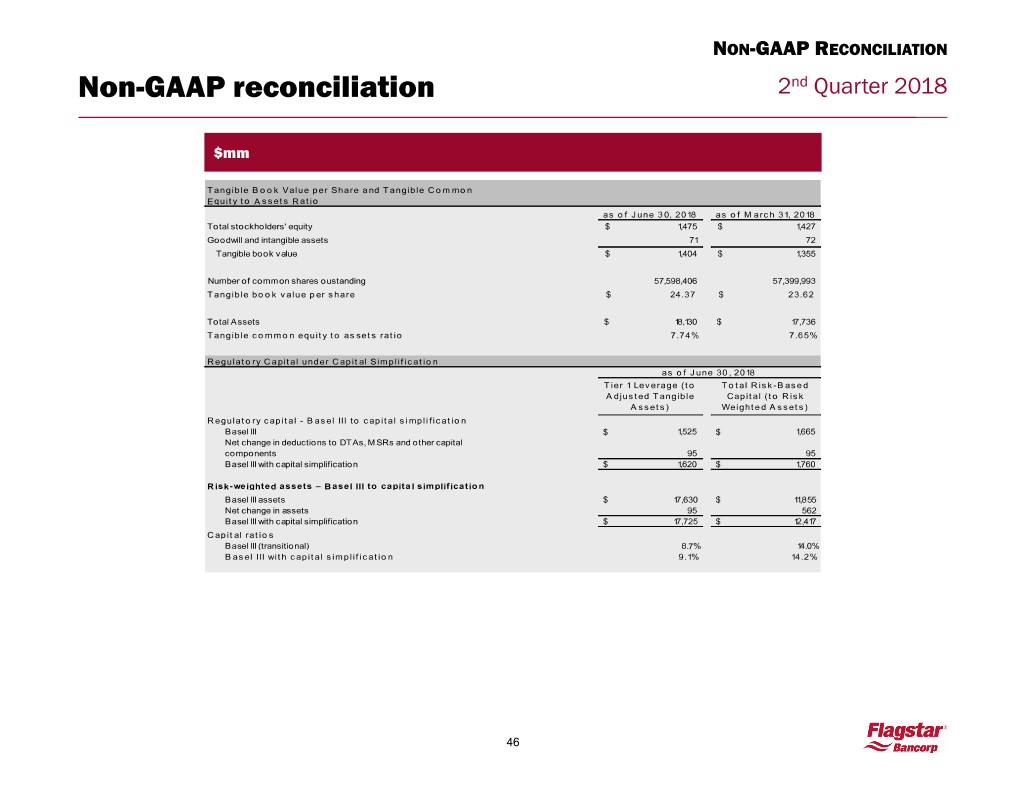
NON-GAAP RECONCILIATION Non-GAAP reconciliation 2nd Quarter 2018 $mm T angible B o o k Value per Share and T angible C o mmo n Equity to A ssets R atio as o f June 30, 2018 as o f M arch 31, 2018 Total stockholders' equity $ 1,475 $ 1,427 Goodwill and intangible assets 71 72 Tangible book value $ 1,404 $ 1,355 Number of common shares oustanding 57,598,406 57,399,993 T angible bo o k value per share $ 24.37 $ 23.62 Total Assets $ 18,130 $ 17,736 T angible co mmo n equity to assets ratio 7.74% 7.65% R egulato ry C apital under C apital Simplificatio n as o f June 30, 2018 T ier 1 Leverage (to T o tal R isk-B ased A djusted T angible C apital (to R isk A ssets) Weighted A ssets) R egulato ry capital - B asel III to capital simplificatio n Basel III $ 1,525 $ 1,665 Net change in deductions to DTAs, M SRs and other capital components 95 95 Basel III with capital simplification $ 1,620 $ 1,760 R isk-weighted assets – B asel III to capital simplificatio n Basel III assets $ 17,630 $ 11,855 Net change in assets 95 562 Basel III with capital simplification $ 17,725 $ 12,417 C apital ratio s Basel III (transitional) 8.7% 14.0% B asel III with capital simplificatio n 9.1% 14.2% 46
