Attached files
| file | filename |
|---|---|
| 8-K - 8-K FOR SECOND QUARTER 2018 EARNINGS RELEASE - SIERRA BANCORP | bsrr-8k_20180723.htm |
Exhibit 99.1

FOR IMMEDIATE RELEASE
|
Date: |
July 23, 2018 |
|
Contact: |
Kevin McPhaill, President/CEO |
|
Phone: |
(559) 782-4900 or (888) 454-BANK |
|
Website Address: |
www.sierrabancorp.com |
SIERRA BANCORP REPORTS EARNINGS
Porterville, CA – July 23, 2018 – Sierra Bancorp (Nasdaq: BSRR), parent of Bank of the Sierra, today announced its unaudited financial results for the three- and six-month periods ended June 30, 2018. Sierra Bancorp reported consolidated net income of $7.992 million for the second quarter of 2018, which is the highest quarterly net income ever reported by the Company and represents an increase of $2.790 million, or 54%, relative to the second quarter of 2017. The lift in net income is primarily the result of improvement in net interest income, a substantial net gain on the sale of other real estate owned (“OREO”) in the second quarter of 2018, and a lower tax accrual rate, partially offset by higher personnel costs and increases in certain other overhead expenses. The Company’s return on average assets was 1.34% in the second quarter of 2018, return on average equity was 12.44%, and diluted earnings per share were $0.52.
For the first six months of 2018 the Company recognized net income of $14.702 million, which reflects an increase of 51% relative to the same period in 2017. The Company’s financial performance metrics for the first half of 2018 include an annualized return on average equity of 11.53%, a return on average assets of 1.25%, and diluted earnings per share of $0.95.
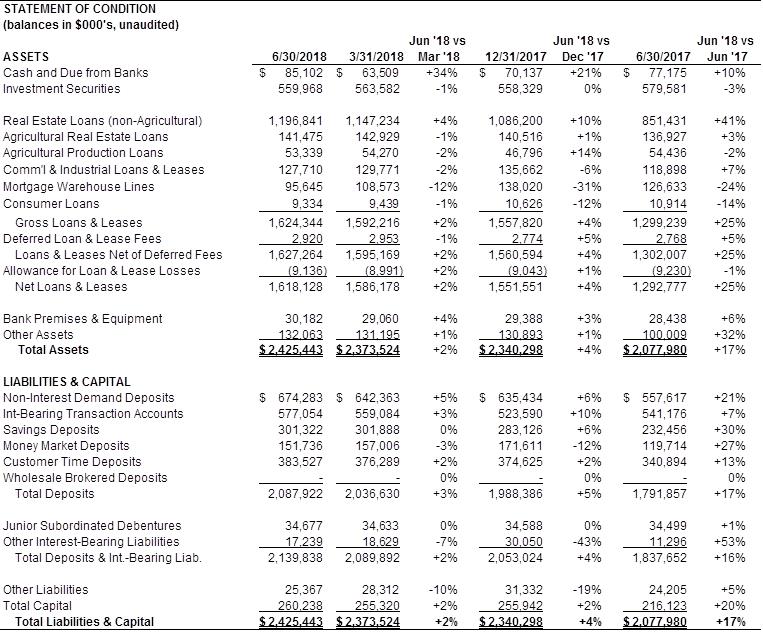
Total assets, loans and deposits reached record levels at June 30, 2018 due to continued strong growth. Assets totaled $2.425 billion at period-end, representing an increase of $85 million, or 4%, for the first half of 2018. The increase in assets resulted primarily from organic growth in real estate loans and agricultural production loans and a higher level of balances due from banks, partially offset by a drop in balances outstanding on mortgage warehouse lines and commercial loan runoff. Gross loans totaled $1.624 billion at June 30, 2018, representing an increase of $67 million, or 4%, during the first six months of the year. Total nonperforming assets were reduced by over $4 million, or 45%, during the first six months due primarily to the sale of OREO in the second quarter. Deposits were $2.088 billion at June 30, 2018, representing a year-to-date increase of close to $100 million, or 5%, including deposits from our Lompoc branch purchase which totaled $38 million on the acquisition date. Non-deposit borrowings were reduced by $13 million.
“Goals should never be easy; they should force you to work even if they are uncomfortable at the time.” – Michael Phelps
“We are excited to see another quarter with strong results, including the highest quarterly net income in the Bank’s history. Assets, loans and deposits also reached record levels because our team continues to work diligently to provide exceptional community banking throughout our markets,” observed Kevin McPhaill, President and CEO. “While these results are great, we feel that it is important to constantly look for opportunities to grow and expand our presence both organically and through additional acquisitions, and we remain optimistic as we look to the remainder of 2018,” he concluded.
Sierra Bancorp Financial Results
July 23, 2018
Page 2
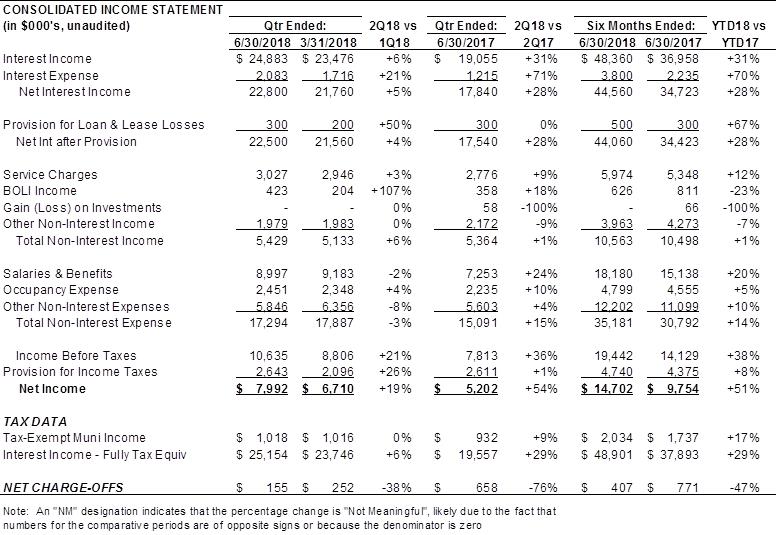
As noted above, net income increased by $2.790 million, or 54%, for the second quarter of 2018 relative to the second quarter of 2017, and by $4.948 million, or 51%, for the first six months of 2018 as compared to the same period in 2017. Significant variances in the components of pre-tax income and in our provision for income taxes, including some items of a nonrecurring nature, are noted below.
Net interest income increased by $4.960 million, or 28%, for the second quarter, and $9.837 million, or 28%, for the first half due to growth in average interest-earning assets totaling $311 million, or 17%, for the second quarter of 2018 over the second quarter of 2017, and growth of $319 million, or 17%, for the first half of 2018 over the first half of 2017. Organic growth was a factor in the increase in average earning assets, but the comparative results were also materially affected by our acquisition of Ojai Community Bank in the fourth quarter of 2017. The favorable impact of higher interest-earning assets was enhanced by an increase in our net interest margin totaling 31 basis points for the comparative quarters, and 30 basis points for the year-to-date period. Our net interest margin improvement reflects the fact that loan yields have increased more rapidly than deposit rates as market interest rates have gone up, as well as the fact that our acquisition resulted in strong growth in loans relative to lower-yielding investment balances. The comparative results were also impacted by non-recurring interest income, which totaled $125,000 in the second quarter of 2018 relative to $83,000 in the second quarter of 2017, and $227,000 in the first half of 2018 as compared to $219,000 in the first half of 2017. Moreover, discount accretion on loans from whole-bank acquisitions enhanced our net interest margin by approximately 11 basis points in the second quarter of 2018 as compared to five basis points in the second quarter 2017, and eight basis points for the first six months of 2018 relative to six basis points in the first six months of 2017.
The Company recorded a $300,000 loan loss provision in both the second quarter of 2018 and the second quarter of 2017, bringing year-to-date loan loss provisions to $500,000 in 2018 and $300,000 for 2017. The 2018 provision was deemed necessary subsequent to our determination of the appropriate level for our allowance for loan and lease losses, taking into consideration overall credit quality, growth in outstanding loan balances and reserves required for specifically identified impaired loan balances.
Total non-interest income reflects increases of $65,000 for the quarterly comparison and the comparative year-to-date results. Service charges on deposits were up 9% for the second quarter of 2018 and 12% for the first six months of 2018 relative to 2017, due to fees earned on deposit accounts added over the past year as well as the reclassification of certain income from other non-interest income to service charges for 2018. BOLI income increased for the second quarter of 2018 but declined for the first six months of 2018 relative to 2017, due to fluctuations in income on BOLI associated with deferred compensation plans. Other non-interest income was lower for both the quarter and year-to-date comparisons due in part to the income reclassification noted above, but mainly because of pass-through expenses associated with additional investments in low-income housing tax credit funds and other limited partnerships. Those expenses are netted out of revenue.
Total non-interest expense was up by $2.203 million, or 15%, for the second quarter of 2018 relative to the second quarter of 2017 and $4.389 million, or 14%, for the comparative six-month periods. Non-recurring acquisition costs included in non-interest expense totaled $151,000 in the second quarter of 2018 relative to $166,000 in the second quarter of 2017, and $437,000 for the first six months of 2018 as compared to $161,000 for the first six months of 2017. Salaries and benefits increased by $1.744 million, or 24%, for the second quarter and $3.042 million, or 20%, for the first half, due in large part to expenses for employees retained subsequent to our acquisitions, staffing costs for de novo branch offices that commenced operations in 2017, salary adjustments in the normal course of business, costs for non-acquisition related staff additions, and a sizeable increase in group health insurance costs.
Sierra Bancorp Financial Results
July 23, 2018
Page 3
Total occupancy expense increased by $216,000, or 10%, for the second quarter and $244,000, or 5%, for the first six months, due primarily to ongoing occupancy costs associated with a higher number of branches. Other non-interest expense was up by $243,000, or 4%, for the second quarter and $1.103 million, or 10%, for the year-to-date comparison. This line item includes the nonrecurring acquisition costs noted above, and it also reflects higher operating costs stemming from more branches, an increase in amortization expense associated with core deposit intangibles created pursuant to our acquisitions, and other increases in the normal course of business. The increases were partially offset by a $713,000 gain on sale of OREO in the second quarter of 2018.
The Company’s provision for income taxes was 25% of pre-tax income in the second quarter of 2018 relative to 33% in the second quarter of 2017, and 24% for the first six months of 2018 as compared to 31% for the first six months of 2017. The lower rate in 2018 is consistent with the reduction in our Federal income tax rate.
Balance sheet changes during the first half of 2018 include an increase in total assets of $85 million, or 4%, due to a higher level of balances due from banks and organic growth in loan balances. Cash and due from banks was up $15 million, or 21%, due to an $8 million increase in our interest-earning balance held at the Federal Reserve Bank and a $7 million increase in other clearing-related balances. Gross loans increased by $67 million, or 4%, due to strong organic growth in non-agricultural real estate loans and agricultural production loans which were up $111 million, or 10%, and $7 million, or 14%, respectively. Those increases were partially offset by a drop of $8 million, or 6%, in commercial loans and a decline of $42 million, or 31%, in mortgage warehouse loans, which went down because the utilization rate on mortgage warehouse lines dropped to 25% at June 30, 2018 from 34% at December 31, 2017 and we exited a couple of relationships. Consumer loans were also down by over $1 million, or 12%. While we have experienced a higher level of real-estate secured and agricultural lending activity in recent periods and our pipeline of loans in process of approval remains relatively robust, no assurance can be provided with regard to future loan growth as payoffs remain at relatively high levels and mortgage warehouse loan volumes are difficult to predict.
Total nonperforming assets, comprised of non-accrual loans and foreclosed assets, were reduced by $4 million, or 45%, during the first half of 2018 due to the sale of over $3 million in OREO, and an $870,000 drop in non-accruing loans resulting from net charge-offs, payoffs and upgrades. The Company’s ratio of nonperforming assets to loans plus foreclosed assets also fell to 0.32% at June 30, 2018 from 0.60% at December 31, 2017. All of the Company’s impaired assets are periodically reviewed, and are either well-reserved based on current loss expectations or are carried at the fair value of the underlying collateral, net of expected disposition costs. In addition to nonperforming assets, the Company had $12 million in loans classified as restructured troubled debt (TDRs) that were included with performing loans as of June 30, 2018.
The Company’s allowance for loan and lease losses was $9.1 million at June 30, 2018, a slight increase relative to December 31, 2017. The increase came from the addition of $500,000 via a loan loss provision, less the charge-off of $407,000 in previously-established reserves against the allowance for loan and lease losses. Because of growth in our loan portfolio, the allowance fell to 0.56% of total loans at June 30, 2018 from 0.58% at December 31, 2017. It should be noted that our need for reserves has been favorably impacted by acquired loans, which were booked at their fair values on the acquisition dates and thus did not initially require a loan loss allowance. Furthermore, loss reserves allocated to mortgage warehouse loans are relatively low because we have not experienced any losses in that portfolio segment. Management’s detailed analysis indicates that the Company’s allowance for loan and lease losses should be sufficient to cover credit losses inherent in loan and lease balances
Sierra Bancorp Financial Results
July 23, 2018
Page 4
outstanding as of June 30, 2018, but no assurance can be given that the Company will not experience substantial future losses relative to the size of the allowance.
Deposit balances reflect growth of $100 million, or 5%, during the first half of 2018, inclusive of Lompoc branch deposits and seasonal increases in commercial deposits. Lompoc branch deposits consisted of $32 million in non-maturity deposits and $6 million in time deposits at the acquisition date of May 18, 2018. Junior subordinated debentures increased slightly from the accretion of the discount on trust-preferred securities that were part of the Coast Bancorp acquisition, but other non-deposit borrowings were reduced by $13 million, or 43%, during the period.
Total capital was $260 million at June 30, 2018, reflecting a slight increase relative to year-end 2017 due to capital from stock options exercised and the addition of net income, net of dividends paid and a $6.2 million increase in our accumulated other comprehensive loss. There were no share repurchases executed by the Company during the first six months of 2018.
About Sierra Bancorp
Sierra Bancorp is the holding company for Bank of the Sierra (www.bankofthesierra.com), which is in its 41st year of operations and is the largest independent bank headquartered in California's South San Joaquin Valley. Bank of the Sierra is a community-centric regional bank, which delivers a broad range of retail and commercial banking services through a network of full-service branches located in the counties of Tulare, Kern, Kings, Fresno, Los Angeles, Ventura, San Luis Obispo, and Santa Barbara. The Bank also maintains a cyber branch, and offers specialized credit services through Agricultural, SBA, and Real Estate Industries loan centers. Bank of the Sierra holds a Bauer Financial 5-star rating, an honor only awarded to the strongest financial institutions in the country.
Forward-Looking Statements
The statements contained in this release that are not historical facts are forward-looking statements based on management's current expectations and beliefs concerning future developments and their potential effects on the Company. Readers are cautioned not to unduly rely on forward looking statements. Actual results may differ from those projected. These forward-looking statements involve risks and uncertainties including but not limited to the health of the national and local economies, the Company’s ability to attract and retain skilled employees, customers' service expectations, the Company's ability to successfully deploy new technology, the success of acquisitions and branch expansion, changes in interest rates, loan portfolio performance, and other factors detailed in the Company’s SEC filings, including the “Risk Factors” and “Management’s Discussion and Analysis of Financial Condition and Results of Operations” sections of the Company’s most recent Form 10-K and Form 10-Q.
Sierra Bancorp Financial Results
July 23, 2018
Page 5
CONSOLIDATED INCOME STATEMENT (in $000's, unaudited) Qtr Ended: 2Q18 vs Qtr Ended: 2Q18 vs Six Months Ended: YTD18 vs 6/30/2018 3/31/2018 1Q18 6/30/2017 2Q17 6/30/2018 6/30/2017 YTD17 Interest Income $ 24,883 $ 23,476 +6% $ 19,055 +31% $ 48,360 $ 36,958 +31% Interest Expense 2,083 1,716 +21% 1,215 +71% 3,800 2,235 +70% Net Interest Income 22,800 21,760 +5% 17,840 +28% 44,560 34,723 +28% Provision for Loan & Lease Losses 300 200 +50% 300 0% 500 300 +67% Net Int after Provision 22,500 21,560 +4% 17,540 +28% 44,060 34,423 +28% Service Charges 3,027 2,946 +3% 2,776 +9% 5,974 5,348 +12% BOLI Income 423 204 +107% 358 +18% 626 811 -23% Gain (Loss) on Investments - - 0% 58 -100% - 66 -100% Other Non-Interest Income 1,979 1,983 0% 2,172 -9% 3,963 4,273 -7% Total Non-Interest Income 5,429 5,133 +6% 5,364 +1% 10,563 10,498 +1% Salaries & Benefits 8,997 9,183 -2% 7,253 +24% 18,180 15,138 +20% Occupancy Expense 2,451 2,348 +4% 2,235 +10% 4,799 4,555 +5% Other Non-Interest Expenses 5,846 6,356 -8% 5,603 +4% 12,202 11,099 +10% Total Non-Interest Expense 17,294 17,887 -3% 15,091 +15% 35,181 30,792 +14% Income Before Taxes 10,635 8,806 +21% 7,813 +36% 19,442 14,129 +38% Provision for Income Taxes 2,643 2,096 +26% 2,611 +1% 4,740 4,375 +8% Net Income $ 7,992 $ 6,710 +19% $ 5,202 +54% $ 14,702 $ 9,754 +51% TAX DATA Tax-Exempt Muni Income $ 1,018 $ 1,016 0% $ 932 +9% $ 2,034 $ 1,737 +17% Interest Income - Fully Tax Equiv $ 25,154 $ 23,746 +6% $ 19,557 +29% $ 48,901 $ 37,893 +29% NET CHARGE-OFFS $ 155 $ 252 -38% $ 658 -76% $ 407 $ 771 -47% Note: An "NM" designation indicates that the percentage change is "Not Meaningful", likely due to the fact that numbers for the comparative periods are of opposite signs or because the denominator is zero
Sierra Bancorp Financial Results
July 23, 2018
Page 6

PER SHARE DATA (unaudited) Qtr Ended: 2Q18 vs Qtr Ended: 2Q18 vs Six Months Ended: YTD18 vs 6/30/2018 3/31/2018 1Q18 6/30/2017 2Q17 6/30/2018 6/30/2017 YTD17 Basic Earnings per Share $0.52 $0.44 +18% $0.38 +37% $0.96 $0.71 +35% Diluted Earnings per Share $0.52 $0.44 +18% $0.37 +41% $0.95 $0.70 +36% Common Dividends $0.16 $0.16 0% $0.14 +14% $0.32 $0.28 +14% Wtd. Avg. Shares Outstanding 15,254,575 15,232,696 0% 13,831,345 +10% 15,243,697 13,816,576 +10% Wtd. Avg. Diluted Shares 15,429,129 15,412,168 0% 14,010,328 +10% 15,420,886 14,009,485 +10% Book Value per Basic Share (EOP) $17.06 $16.75 +2% $15.62 +9% $17.06 $15.62 +9% Tangible Book Value per Share (EOP) $14.81 $14.56 +2% $14.84 0% $14.81 $14.84 0% Common Shares Outstanding (EOP) 15,258,100 15,246,780 0% 13,832,549 +10% 15,258,100 13,832,549 +10% KEY FINANCIAL RATIOS (unaudited) Qtr Ended: Qtr Ended: Six Months Ended: 6/30/2018 3/31/2018 6/30/2017 6/30/2018 6/30/2017 Return on Average Equity 12.44% 10.61% 9.75% 11.53% 9.31% Return on Average Assets 1.34% 1.16% 1.02% 1.25% 0.98% Net Interest Margin (Tax-Equiv.) 4.24% 4.20% 3.93% 4.22% 3.92% Efficiency Ratio (Tax-Equiv.) 60.44% 65.72% 63.30% 63.01% 66.18% Net C/O's to Avg Loans (not annualized) 0.01% 0.02% 0.05% 0.03% 0.06%
Sierra Bancorp Financial Results
July 23, 2018
Page 7
STATEMENT OF CONDITION (balances in $000's, unaudited) Jun '18 vs Jun '18 vs Jun '18 vs ASSETS 6/30/2018 3/31/2018 Mar '18 12/31/2017 Dec '17 6/30/2017 Jun '17 Cash and Due from Banks $ 85,102 $ 63,509 +34% $ 70,137 +21% $ 77,175 +10% Investment Securities 559,968 563,582 -1%558,329 0%579,581 -3% Real Estate Loans (non-Agricultural) 1,196,841 1,147,234 +4%1,086,200 +10%851,431 +41% Agricultural Real Estate Loans 141,475 142,929 -1%140,516 +1%136,927 +3% Agricultural Production Loans 53,339 54,270 -2% 46,796 +14% 54,436 -2% Comm'l & Industrial Loans & Leases 127,710 129,771 -2%135,662 -6%118,898 +7% Mortgage Warehouse Lines 95,645 108,573 -12%138,020 -31%126,633 -24% Consumer Loans9,3349,439 -1% 10,626 -12% 10,914 -14%Gross Loans & Leases 1,624,344 1,592,216 +2%1,557,820 +4%1,299,239 +25% Deferred Loan & Lease Fees2,9202,953 -1% 2,774 +5% 2,768 +5%Loans & Leases Net of Deferred Fees 1,627,264 1,595,169 +2%1,560,594 +4%1,302,007 +25% Allowance for Loan & Lease Losses (9,136) (8,991) +2% (9,043) +1% (9,230) -1%Net Loans & Leases 1,618,128 1,586,178 +2%1,551,551 +4%1,292,777 +25% Bank Premises & Equipment 30,182 29,060 +4% 29,388 +3% 28,438 +6% Other Assets 132,063 131,195 +1%130,893 +1%100,009 +32% Total Assets $ 2,425,443 $ 2,373,524 +2% $ 2,340,298 +4% $ 2,077,980 +17% LIABILITIES & CAPITALNon-Interest Demand Deposits $ 674,283 $ 642,363 +5% $ 635,434 +6% $ 557,617 +21% Int-Bearing Transaction Accounts 577,054 559,084 +3%523,590 +10%541,176 +7% Savings Deposits 301,322 301,888 0%283,126 +6%232,456 +30% Money Market Deposits 151,736 157,006 -3%171,611 -12%119,714 +27% Customer Time Deposits 383,527 376,289 +2%374,625 +2%340,894 +13% Wholesale Brokered Deposits-- 0% - 0% - 0%Total Deposits 2,087,922 2,036,630 +3%1,988,386 +5%1,791,857 +17% Junior Subordinated Debentures 34,677 34,633 0% 34,588 0% 34,499 +1% Other Interest-Bearing Liabilities 17,239 18,629 -7% 30,050 -43% 11,296 +53%Total Deposits & Int.-Bearing Liab. 2,139,838 2,089,892 +2%2,053,024 +4%1,837,652 +16% Other Liabilities 25,367 28,312 -10% 31,332 -19% 24,205 +5% Total Capital 260,238 255,320 +2%255,942 +2%216,123 +20%Total Liabilities & Capital $ 2,425,443 $ 2,373,524 +2% $ 2,340,298 +4% $ 2,077,980 +17%
Sierra Bancorp Financial Results
July 23, 2018
Page 8

GOODWILL & INTANGIBLE ASSETS (balances in $000's, unaudited) Jun '18 vs Jun '18 vs Jun '18 vs 6/30/2018 3/31/2018 Mar '18 12/31/2017 Dec '17 6/30/2017 Jun '17 Goodwill 27,357 27,357 0% 27,357 0% 8,268 +231% Core Deposit Intangible 6,919 6,004 +15% 6,234 +11% 2,589 +167% Total Intangible Assets 34,276 33,361 +3% 33,591 +2% 10,857 +216% CREDIT QUALITY (balances in $000's, unaudited) Jun '18 vs Jun '18 vs Jun '18 vs 6/30/2018 3/31/2018 Mar '18 12/31/2017 Dec '17 6/30/2017 Jun '17 Non-Accruing Loans $ 3,093 $ 3,089 0% $ 3,963 -22% $ 5,652 -45% Foreclosed Assets 2,112 5,371 -61% 5,481 -61% 2,141 -1% Total Nonperforming Assets $ 5,205 $ 8,460 -38% $ 9,444 -45% $ 7,793 -33% Performing TDR's (not incl. in NPA's) $ 11,981 $ 11,185 +7% $ 12,413 -3% $ 13,640 -12% Non-Perf Loans to Gross Loans 0.19% 0.19% 0.25% 0.44% NPA's to Loans plus Foreclosed Assets 0.32% 0.53% 0.60% 0.60% Allowance for Ln Losses to Loans 0.56% 0.56% 0.58% 0.71% SELECT PERIOD-END STATISTICS (unaudited) 6/30/2018 3/31/2018 12/31/2017 6/30/2017 Shareholders Equity / Total Assets 10.7% 10.8% 10.9% 10.4% Gross Loans / Deposits 77.8% 78.2% 78.3% 72.5% Non-Int. Bearing Dep. / Total Dep. 32.3% 31.5% 32.0% 31.1%

####################################
AVG BAL SHEET, INTEREST INC/EXP, & YIELD/RATE (balances in $000's, unaudited) For the quarter ended For the quarter ended For the quarter ended June 30, 2018 March 31, 2018 June 30, 2017 Average Balance Income/ Expense Yield/ Rate Average Balance Income/ Expense Yield/ Rate Average Balance Income/ Expense Yield/ Rate Assets Investments: Federal funds sold/due from time $ 13,080 $ 61 1.84% $ 30,476 $ 118 1.55% $ 53,965 $ 139 1.02% Taxable 424,446 2,300 2.14% 425,075 2,338 2.20% 437,470 2,147 1.94% Non-taxable 141,224 1,018 3.61% 141,579 1,016 3.63% 131,972 932 4.30% Total investments 578,750 3,379 2.49% 597,130 3,472 2.51% 623,407 3,218 2.36% Loans and Leases: Real estate 1,325,251 17,800 5.39% 1,254,596 16,644 5.38% 969,925 12,207 5.05% Agricultural Production 53,867 753 5.61% 50,131 658 5.32% 50,942 620 4.88% Commercial 124,320 1,489 4.80% 127,316 1,379 4.39% 116,719 1,577 5.42% Consumer 9,760 297 12.21% 10,493 293 11.32% 11,577 307 10.64% Mortgage warehouse lines 89,633 1,126 5.04% 83,348 978 4.76% 97,191 1,077 4.44% Other 2,503 39 6.25% 3,013 52 7.00% 3,309 49 5.94% Total loans and leases 1,605,334 21,504 5.37% 1,528,897 20,004 5.31% 1,249,663 15,837 5.08% Total interest earning assets 2,184,084 $ 24,883 4.62% 2,126,027 $ 23,476 4.53% 1,873,070 $ 19,055 4.19% Other earning assets 10,436 10,195 8,689 Non-earning assets 205,446 201,397 156,643 Total assets $ 2,399,966 $ 2,337,619 $ 2,038,402 Liabilities and shareholders' equity Interest bearing deposits: Demand deposits $ 139,546 $ 109 0.31% $ 116,829 $ 88 0.31% $ 157,482 $ 122 0.31% NOW 422,619 116 0.11% 409,198 117 0.12% 374,304 104 0.11% Savings accounts 301,528 80 0.11% 293,716 76 0.10% 228,859 58 0.10% Money market 153,143 37 0.10% 164,824 42 0.10% 118,172 23 0.08% Time Deposits 380,778 1,252 1.32% 375,718 995 1.07% 341,442 561 0.66% Total interest bearing deposits 1,397,614 1,594 0.46% 1,360,285 1,318 0.39% 1,220,259 868 0.29% Borrowed funds: Junior Subordinated Debentures 34,651 436 5.05% 34,606 385 4.51% 34,475 337 3.92% Other Interest-Bearing Liabilities 23,719 53 0.90% 10,759 13 0.49% 10,233 10 0.39% Total borrowed funds 58,370 489 3.36% 45,365 398 3.56% 44,708 347 3.11% Total interest bearing liabilities 1,455,984 $ 2,083 0.57% 1,405,650 $ 1,716 0.50% 1,264,967 $ 1,215 0.39% Demand deposits - non-interest bearing 656,486 643,524 533,570 Other liabilities 29,786 31,936 25,945 Shareholders' equity 257,710 256,509 213,920 Total liabilities and shareholders' equity $ 2,399,966 $ 2,337,619 $ 2,038,402 Interest income/interest earning assets 4.62% 4.53% 4.19% Interest expense/interest earning assets 0.38% 0.33% 0.26% Net interest income and margin $ 22,800 4.24% $ 21,760 4.20% $ 17,840 3.93% NOTE: Where impacted by non-taxable income, yields and net interest margins have been computed on a tax equivalent basis utilizing a 21% tax rate for periods ending after December 31, 2017, and a 35% tax rate for periods ending on or before December 31, 2017