Attached files
| file | filename |
|---|---|
| EX-99.1 - EX-99.1_PR CARDINAL 52 WEEKS DATA - REATA PHARMACEUTICALS INC | reta-ex991_35.htm |
| 8-K - 8-K CARDINAL PHASE 2 48/52 WEEK DATA - REATA PHARMACEUTICALS INC | reta-8k_20180723.htm |
Management call to discuss phase 2 cardinal and phoenix updates Exhibit 99.2
Forward-Looking Statements This presentation contains certain “forward-looking” statements that are made pursuant to the safe harbor provisions of the Private Securities Litigation Reform Act of 1995. All statements, other than statements of historical or present facts, are forward-looking statements, including statements regarding our future financial condition, business strategy, and plans and objectives of management for future operations. In some cases, you can identify forward-looking statements by terminology such as “believe,” “will,” “may,” “estimate,” “continue,” “aim,” “assume,” “anticipate,” “contemplate,” “model,” “intend,” “target,” “project,” “should,” “plan,” “expect,” “predict,” “could,” “possible,” “seek,” “goal”, “potential,” “hypothesize,” “likely” or the negative of these terms or other similar terms or expressions that concern our expectations, strategy, plans, or intentions. These statements are based on our intentions, beliefs, projections, outlook, analyses, or current expectations using currently available information, are not guarantees of future performance, and involve certain risks and uncertainties. Although we believe that the expectations reflected in these forward-looking statements are reasonable, we cannot assure you that our expectations will prove to be correct. Therefore, actual outcomes and results could materially differ from what is expressed, implied, or forecast in these statements. Any differences could be caused by a number of factors including but not limited to: the success, cost, and timing of our product development activities and clinical trials; our ability to advance our NRF2 activators and other technologies; our ability to obtain and maintain regulatory approval of our product candidates, and limitations and warnings in the label of an approved product candidate; our ability to obtain funding for our operations, including funding necessary to complete further development and commercialization of our product candidates; our plans to research, develop, and commercialize our product candidates; the commercialization of our product candidates, if approved; the rate and degree of market acceptance of our product candidates; the size and growth potential of the markets for our product candidates, and our ability to identify target patient populations and serve those markets, especially for diseases with small patient populations; the success of competing therapies that are or may become available; our expectations regarding our ability to obtain and maintain intellectual property protection for our product candidates; the ability to license additional intellectual property relating to our product candidates and to comply with our existing license agreements; our ability to contract with third-party suppliers and manufacturers and their ability to perform adequately; our ability to attract collaborators with development, regulatory, and commercialization expertise; our ability to attract and retain key scientific or management personnel; our ability to grow our organization and increase the size of our facilities to meet our anticipated growth; the accuracy of our estimates regarding expenses, future revenue, capital requirements, and needs for additional financing; and regulatory developments in the United States and foreign countries. Additional factors that could cause actual results to differ materially from our expectations can be found in our Securities and Exchange Commission filings. Moreover, we operate in a very competitive and rapidly changing environment. New risk factors emerge from time to time, and it is not possible for our management to predict all risk factors, nor can we assess the effects of all factors on our business or the extent to which any factor, or combination of factors, may cause actual results to differ materially from those contained in, or implied by, any forward-looking statements. All forward-looking statements included in this presentation are expressly qualified in their entirety by these cautionary statements. The forward-looking statements speak only as of the date made and, other than as required by law, we undertake no obligation to publicly update or revise any forward-looking statements, whether as a result of new information, future events, or otherwise.
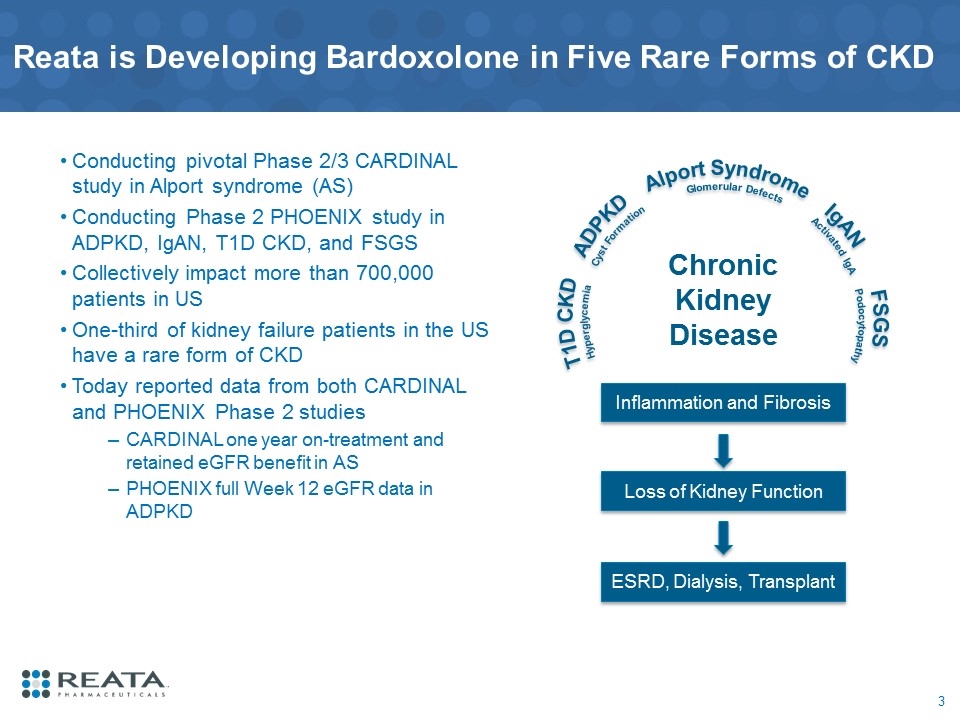
Reata is Developing Bardoxolone in Five Rare Forms of CKD Conducting pivotal Phase 2/3 CARDINAL study in Alport syndrome (AS) Conducting Phase 2 PHOENIX study in ADPKD, IgAN, T1D CKD, and FSGS Collectively impact more than 700,000 patients in US One-third of kidney failure patients in the US have a rare form of CKD Today reported data from both CARDINAL and PHOENIX Phase 2 studies CARDINAL one year on-treatment and retained eGFR benefit in AS PHOENIX full Week 12 eGFR data in ADPKD Inflammation and Fibrosis Loss of Kidney Function ESRD, Dialysis, Transplant Chronic Kidney Disease T1D CKD ADPKD Alport Syndrome IgAN FSGS Hyperglycemia Cyst Formation Glomerular Defects Activated IgA Podocytopathy
FDA Has Accepted Retained eGFR Benefit for Approval in Rare Forms of CKD The “on-treatment” eGFR improvement is the full clinical benefit to the patient, but FDA requires additional evidence that it will likely delay kidney failure Withdrawal of drug after long-term treatment provides evidence whether an intervention protected or harmed the kidney during treatment If retained eGFR is higher than placebo, the treatment protected kidney function If retained eGFR is lower than placebo, the treatment harmed kidney function A positive retained eGFR benefit: Provides evidence that drug treatment may delay or prevent kidney failure Suggests drug treatment did not improve kidney function through a damaging mechanism In rare forms of CKD, FDA has accepted for approval the placebo-corrected “retained eGFR benefit” after withdrawal of drug FDA approved tolvaptan for ADPKD on a placebo-corrected (but below baseline) retained eGFR benefit of 1.27 ml/min1,2 1Units of ml/min/1.73 m2 are represented as ml/min throughout this presentation; 2Torres 2017
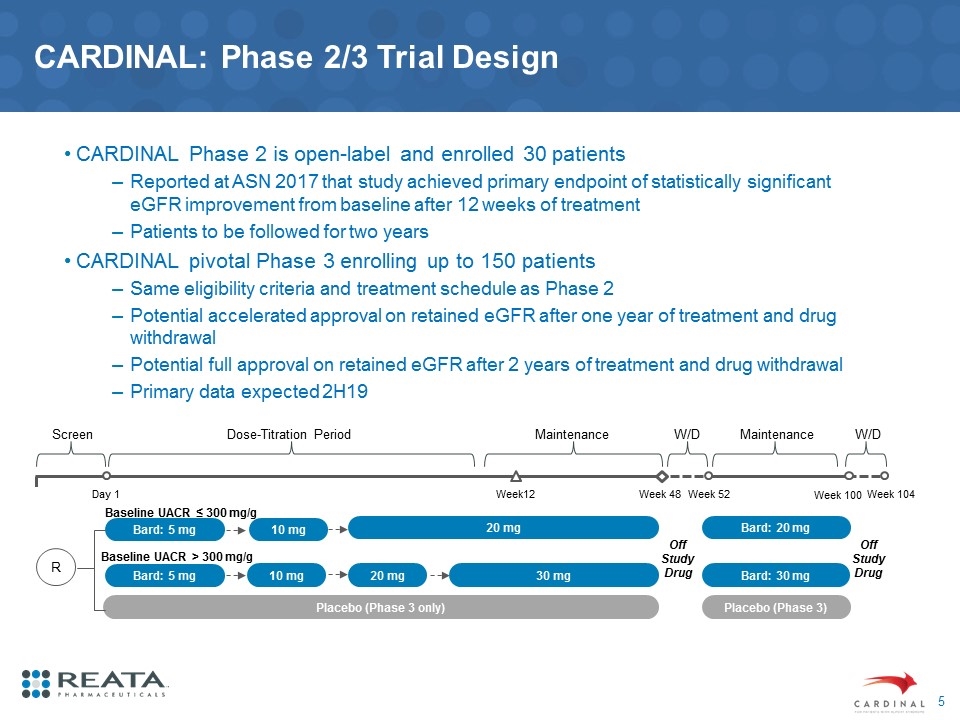
CARDINAL: Phase 2/3 Trial Design CARDINAL Phase 2 is open-label and enrolled 30 patients Reported at ASN 2017 that study achieved primary endpoint of statistically significant eGFR improvement from baseline after 12 weeks of treatment Patients to be followed for two years CARDINAL pivotal Phase 3 enrolling up to 150 patients Same eligibility criteria and treatment schedule as Phase 2 Potential accelerated approval on retained eGFR after one year of treatment and drug withdrawal Potential full approval on retained eGFR after 2 years of treatment and drug withdrawal Primary data expected 2H19 Week12 Week 48 Week 52 Off Study Drug Week 100 Baseline UACR ≤ 300 mg/g Baseline UACR > 300 mg/g Week 104 Off Study Drug Day 1 W/D Placebo (Phase 3 only) Placebo (Phase 3) Bard: 5 mg Bard: 5 mg 10 mg 10 mg 20 mg 30 mg 20 mg Bard: 30 mg Bard: 20 mg R Screen Dose-Titration Period Maintenance W/D Maintenance
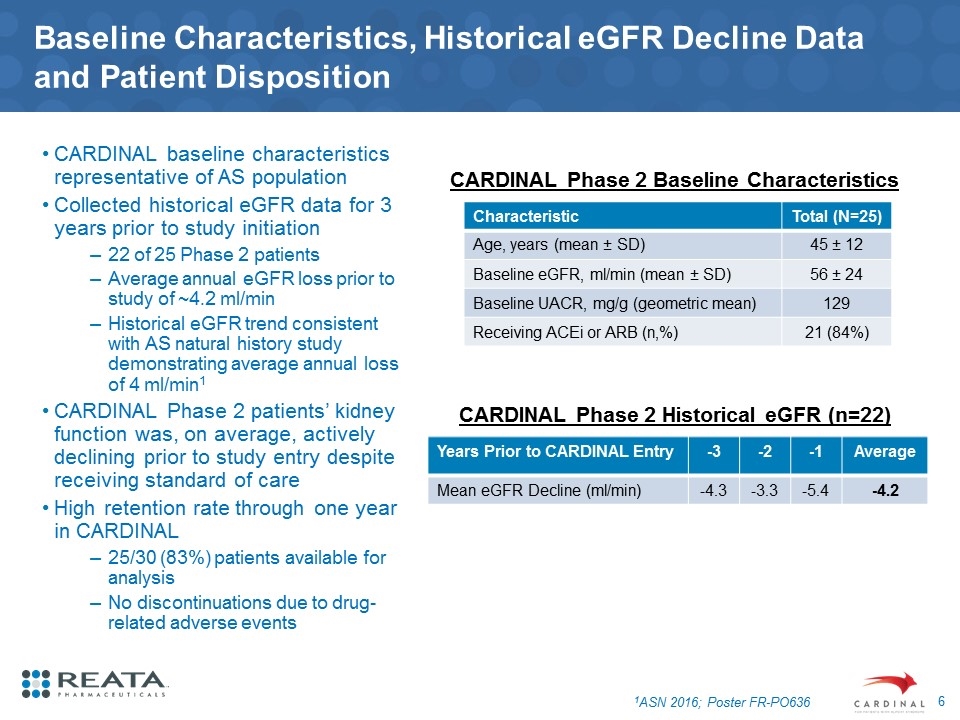
Baseline Characteristics, Historical eGFR Decline Data and Patient Disposition CARDINAL baseline characteristics representative of AS population Collected historical eGFR data for 3 years prior to study initiation 22 of 25 Phase 2 patients Average annual eGFR loss prior to study of ~4.2 ml/min Historical eGFR trend consistent with AS natural history study demonstrating average annual loss of 4 ml/min1 CARDINAL Phase 2 patients’ kidney function was, on average, actively declining prior to study entry despite receiving standard of care High retention rate through one year in CARDINAL 25/30 (83%) patients available for analysis No discontinuations due to drug-related adverse events Characteristic Total (N=25) Age, years (mean ± SD) 45 ± 12 Baseline eGFR, ml/min (mean ± SD) 56 ± 24 Baseline UACR, mg/g (geometric mean) 129 Receiving ACEi or ARB (n,%) 21 (84%) 1ASN 2016; Poster FR-PO636 CARDINAL Phase 2 Baseline Characteristics Years Prior to CARDINAL Entry -3 -2 -1 Average Mean eGFR Decline (ml/min) -4.3 -3.3 -5.4 -4.2 CARDINAL Phase 2 Historical eGFR (n=22)
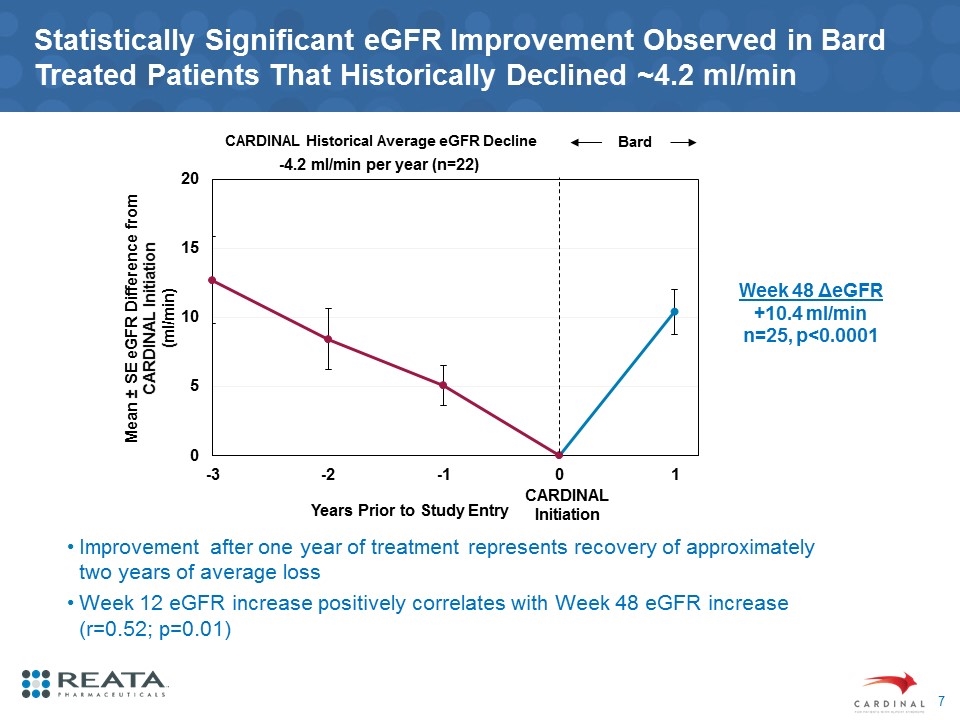
Statistically Significant eGFR Improvement Observed in Bard Treated Patients That Historically Declined ~4.2 ml/min Improvement after one year of treatment represents recovery of approximately two years of average loss Week 12 eGFR increase positively correlates with Week 48 eGFR increase (r=0.52; p=0.01) CARDINAL Initiation -4.2 ml/min per year (n=22) CARDINAL Historical Average eGFR Decline Bard Week 48 ΔeGFR +10.4 ml/min n=25, p<0.0001
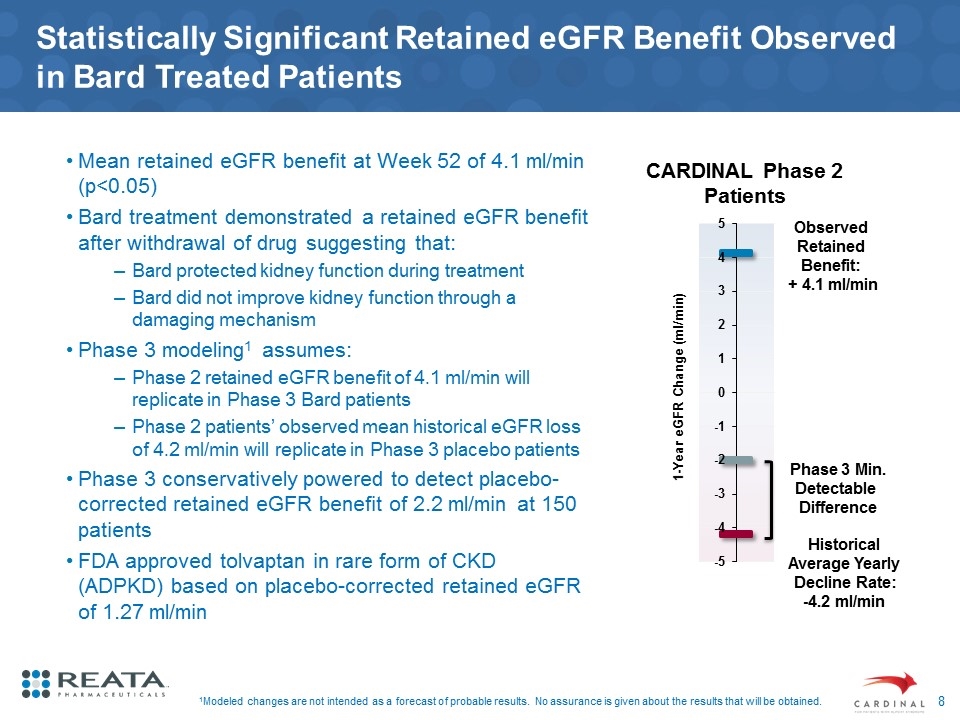
Statistically Significant Retained eGFR Benefit Observed in Bard Treated Patients Mean retained eGFR benefit at Week 52 of 4.1 ml/min (p<0.05) Bard treatment demonstrated a retained eGFR benefit after withdrawal of drug suggesting that: Bard protected kidney function during treatment Bard did not improve kidney function through a damaging mechanism Phase 3 modeling1 assumes: Phase 2 retained eGFR benefit of 4.1 ml/min will replicate in Phase 3 Bard patients Phase 2 patients’ observed mean historical eGFR loss of 4.2 ml/min will replicate in Phase 3 placebo patients Phase 3 conservatively powered to detect placebo-corrected retained eGFR benefit of 2.2 ml/min at 150 patients FDA approved tolvaptan in rare form of CKD (ADPKD) based on placebo-corrected retained eGFR of 1.27 ml/min 1Modeled changes are not intended as a forecast of probable results. No assurance is given about the results that will be obtained. CARDINAL Phase 2 Patients Historical Average Yearly Decline Rate: -4.2 ml/min Observed Retained Benefit: + 4.1 ml/min Phase 3 Min. Detectable Difference
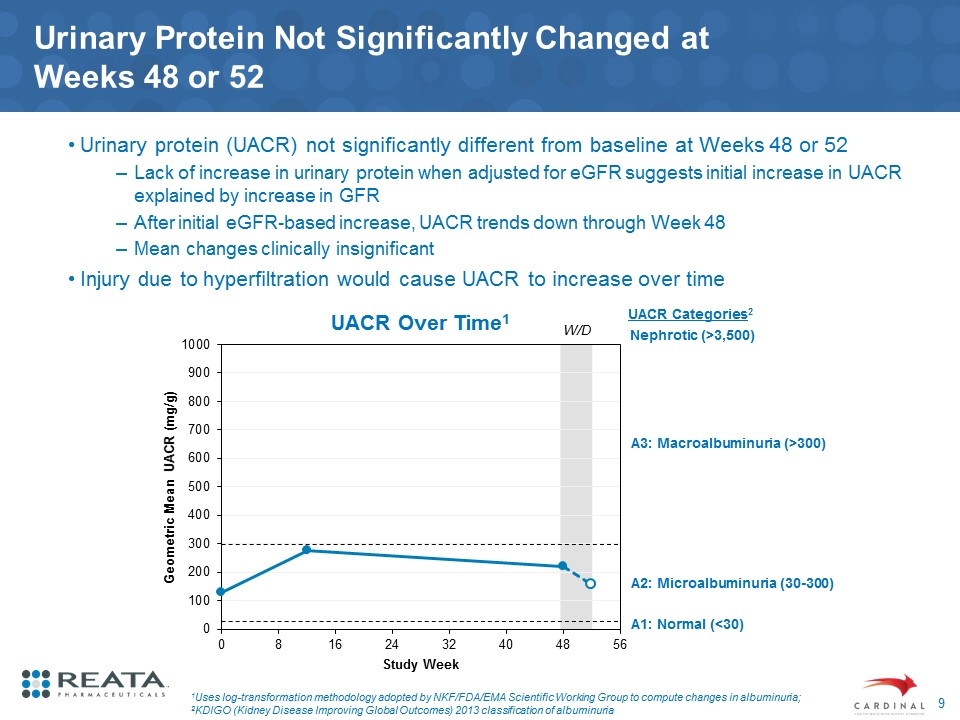
Urinary Protein Not Significantly Changed at Weeks 48 or 52 Urinary protein (UACR) not significantly different from baseline at Weeks 48 or 52 Lack of increase in urinary protein when adjusted for eGFR suggests initial increase in UACR explained by increase in GFR After initial eGFR-based increase, UACR trends down through Week 48 Mean changes clinically insignificant Injury due to hyperfiltration would cause UACR to increase over time 1Uses log-transformation methodology adopted by NKF/FDA/EMA Scientific Working Group to compute changes in albuminuria; 2KDIGO (Kidney Disease Improving Global Outcomes) 2013 classification of albuminuria UACR Over Time1 W/D A1: Normal (<30) UACR Categories2 A2: Microalbuminuria (30-300) A3: Macroalbuminuria (>300) Nephrotic (>3,500)
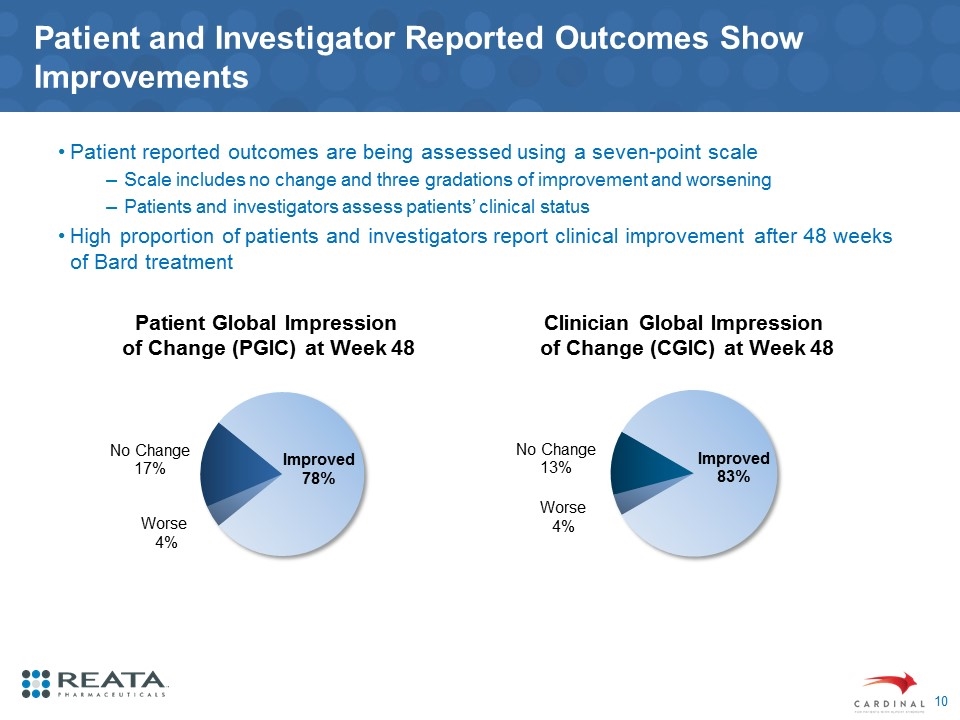
Patient and Investigator Reported Outcomes Show Improvements Patient reported outcomes are being assessed using a seven-point scale Scale includes no change and three gradations of improvement and worsening Patients and investigators assess patients’ clinical status High proportion of patients and investigators report clinical improvement after 48 weeks of Bard treatment Patient Global Impression of Change (PGIC) at Week 48 Clinician Global Impression of Change (CGIC) at Week 48 Worse 4% Worse 4% Improved 78%
Phase 2 Summary of Safety Bard well-tolerated with high retention rate through one year No discontinuations due to drug-related adverse events No drug-related SAEs, changes in blood pressure, or fluid overload-events AEs have been generally mild to moderate in intensity Most commonly reported AE is muscle spasms Associated with reductions in CK No safety concerns have been noted by the data monitoring committee (DMC)
CARDINAL Phase 2 Data Summary Observed increases in on-treatment eGFR (+10.4 ml/min) and retained eGFR (+4.1 ml/min) for one year in Bard treated patients that historically declined an average of ~4.2 ml/min annually Improvement above baseline in retained eGFR suggests disease-modifying activity Lack of significant proteinuria increase after one year suggests that on-treatment UACR changes are not due to injury 78% of patients reported that they were clinically improved after one year of treatment Bard has been well-tolerated without any safety concerns noted by the DMC Phase 3 conservatively powered and can detect small, placebo-corrected retained eGFR benefit of 2.2 ml/min at 150 patients Patients who have durable increases in eGFR may never need dialysis or a kidney transplant
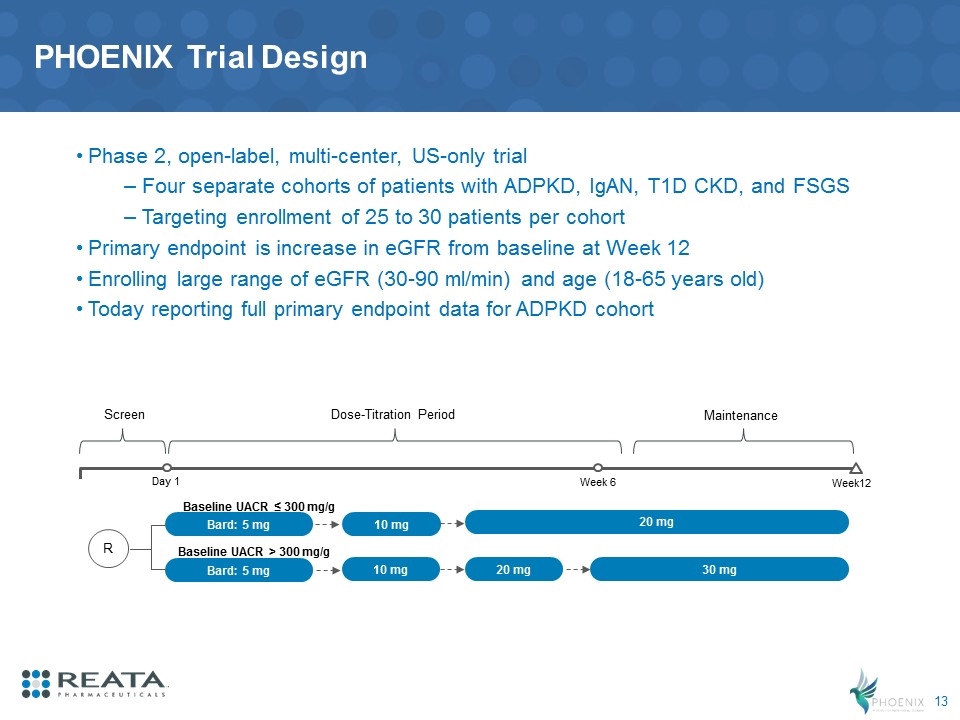
PHOENIX Trial Design Phase 2, open-label, multi-center, US-only trial Four separate cohorts of patients with ADPKD, IgAN, T1D CKD, and FSGS Targeting enrollment of 25 to 30 patients per cohort Primary endpoint is increase in eGFR from baseline at Week 12 Enrolling large range of eGFR (30-90 ml/min) and age (18-65 years old) Today reporting full primary endpoint data for ADPKD cohort Week12 Baseline UACR ≤ 300 mg/g Baseline UACR > 300 mg/g Day 1 Bard: 5 mg Bard: 5 mg 10 mg 10 mg 20 mg 30 mg 20 mg R Screen Dose-Titration Period Maintenance Week 6
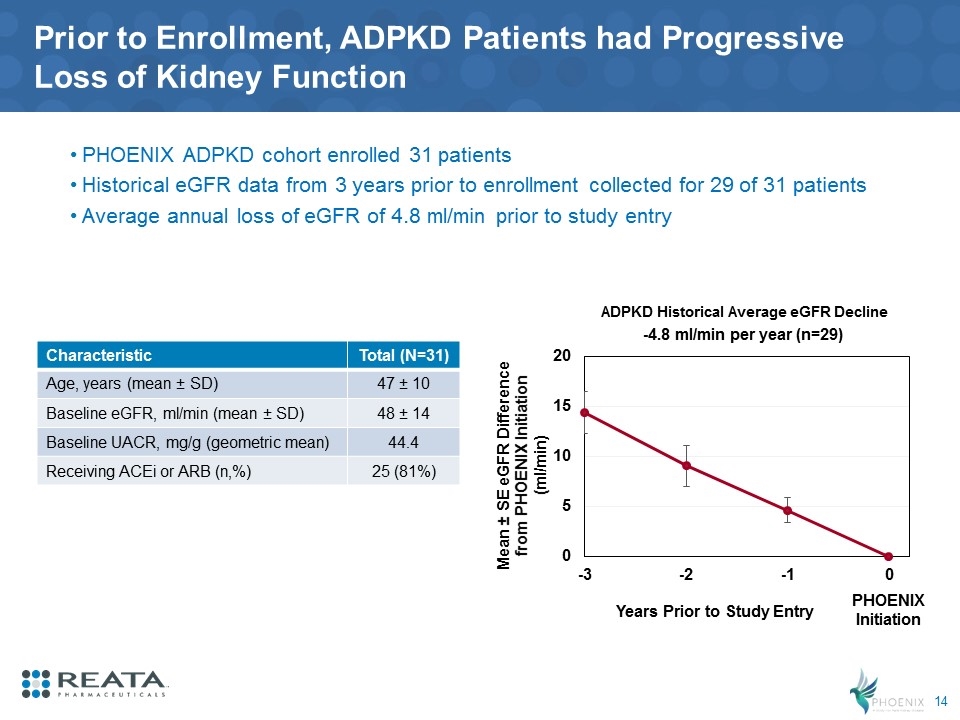
Prior to Enrollment, ADPKD Patients had Progressive Loss of Kidney Function PHOENIX ADPKD cohort enrolled 31 patients Historical eGFR data from 3 years prior to enrollment collected for 29 of 31 patients Average annual loss of eGFR of 4.8 ml/min prior to study entry PHOENIX Initiation Characteristic Total (N=31) Age, years (mean ± SD) 47 ± 10 Baseline eGFR, ml/min (mean ± SD) 48 ± 14 Baseline UACR, mg/g (geometric mean) 44.4 Receiving ACEi or ARB (n,%) 25 (81%) -4.8 ml/min per year (n=29) ADPKD Historical Average eGFR Decline
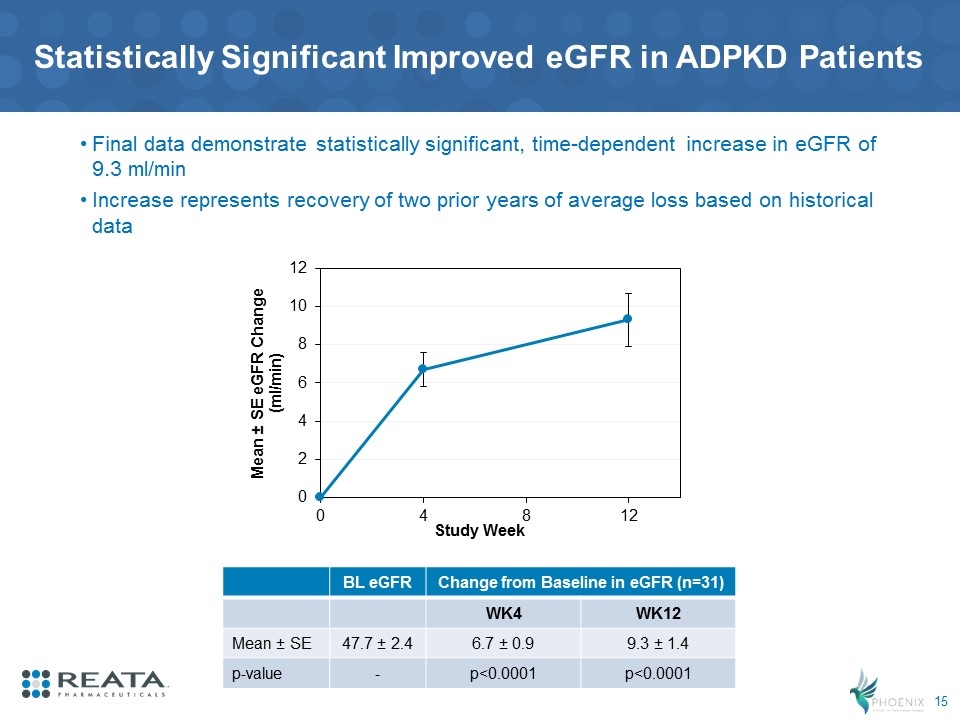
Statistically Significant Improved eGFR in ADPKD Patients BL eGFR Change from Baseline in eGFR (n=31) WK4 WK12 Mean ± SE 47.7 ± 2.4 6.7 ± 0.9 9.3 ± 1.4 p-value - p<0.0001 p<0.0001 Final data demonstrate statistically significant, time-dependent increase in eGFR of 9.3 ml/min Increase represents recovery of two prior years of average loss based on historical data
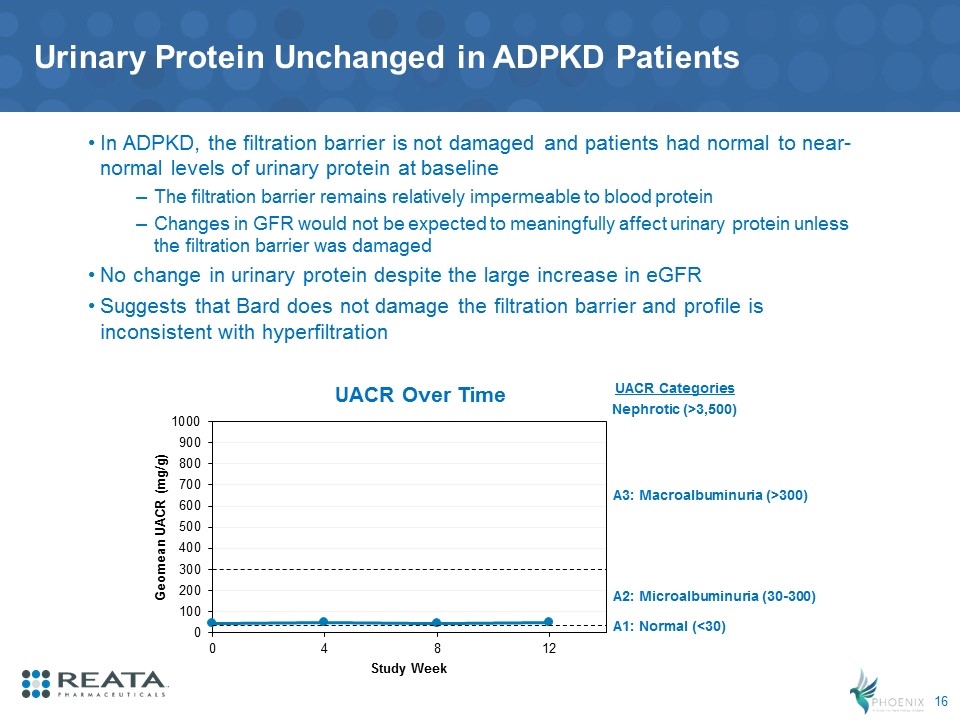
Urinary Protein Unchanged in ADPKD Patients In ADPKD, the filtration barrier is not damaged and patients had normal to near-normal levels of urinary protein at baseline The filtration barrier remains relatively impermeable to blood protein Changes in GFR would not be expected to meaningfully affect urinary protein unless the filtration barrier was damaged No change in urinary protein despite the large increase in eGFR Suggests that Bard does not damage the filtration barrier and profile is inconsistent with hyperfiltration UACR Over Time A1: Normal (<30) UACR Categories A2: Microalbuminuria (30-300) A3: Macroalbuminuria (>300) Nephrotic (>3,500)
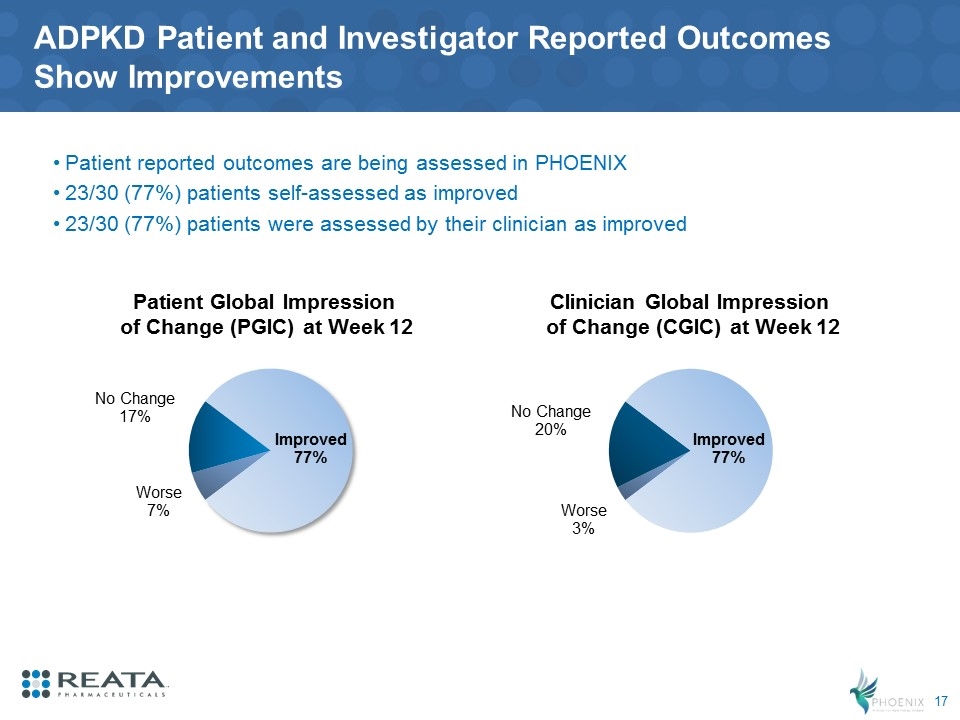
ADPKD Patient and Investigator Reported Outcomes Show Improvements Patient reported outcomes are being assessed in PHOENIX 23/30 (77%) patients self-assessed as improved 23/30 (77%) patients were assessed by their clinician as improved Patient Global Impression of Change (PGIC) at Week 12 Clinician Global Impression of Change (CGIC) at Week 12
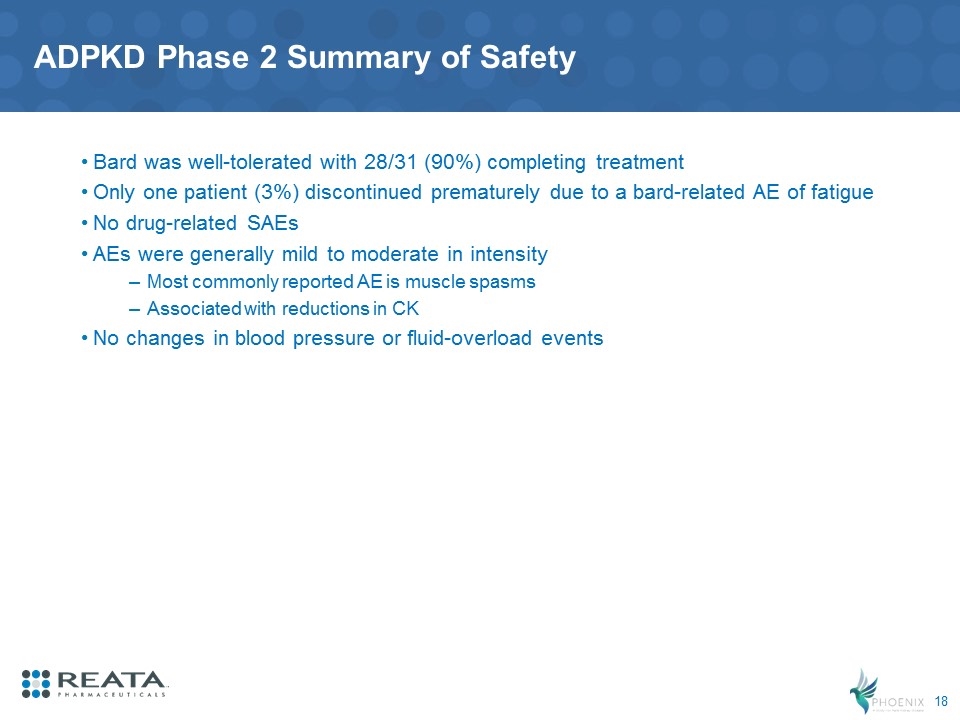
ADPKD Phase 2 Summary of Safety Bard was well-tolerated with 28/31 (90%) completing treatment Only one patient (3%) discontinued prematurely due to a bard-related AE of fatigue No drug-related SAEs AEs were generally mild to moderate in intensity Most commonly reported AE is muscle spasms Associated with reductions in CK No changes in blood pressure or fluid-overload events
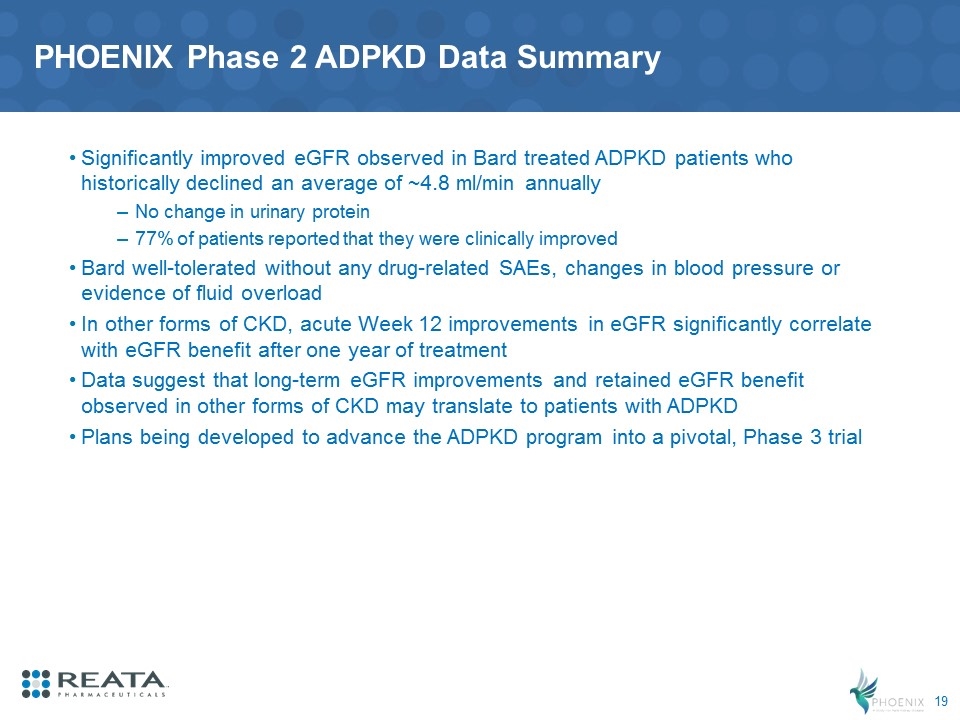
PHOENIX Phase 2 ADPKD Data Summary Significantly improved eGFR observed in Bard treated ADPKD patients who historically declined an average of ~4.8 ml/min annually No change in urinary protein 77% of patients reported that they were clinically improved Bard well-tolerated without any drug-related SAEs, changes in blood pressure or evidence of fluid overload In other forms of CKD, acute Week 12 improvements in eGFR significantly correlate with eGFR benefit after one year of treatment Data suggest that long-term eGFR improvements and retained eGFR benefit observed in other forms of CKD may translate to patients with ADPKD Plans being developed to advance the ADPKD program into a pivotal, Phase 3 trial
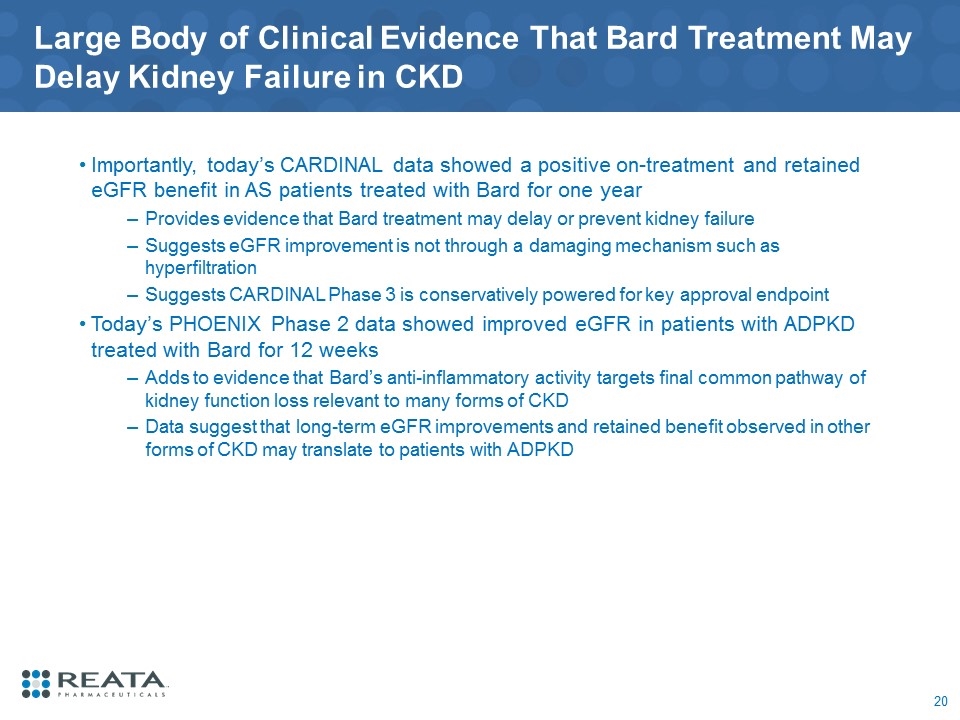
Large Body of Clinical Evidence That Bard Treatment May Delay Kidney Failure in CKD Importantly, today’s CARDINAL data showed a positive on-treatment and retained eGFR benefit in AS patients treated with Bard for one year Provides evidence that Bard treatment may delay or prevent kidney failure Suggests eGFR improvement is not through a damaging mechanism such as hyperfiltration Suggests CARDINAL Phase 3 is conservatively powered for key approval endpoint Today’s PHOENIX Phase 2 data showed improved eGFR in patients with ADPKD treated with Bard for 12 weeks Adds to evidence that Bard’s anti-inflammatory activity targets final common pathway of kidney function loss relevant to many forms of CKD Data suggest that long-term eGFR improvements and retained benefit observed in other forms of CKD may translate to patients with ADPKD
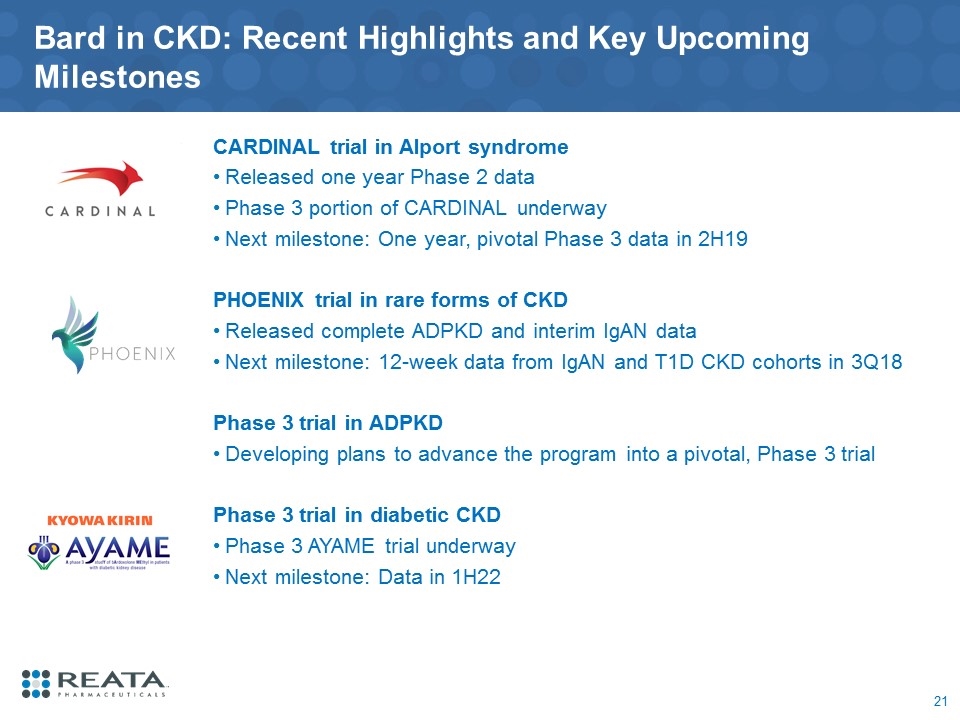
Bard in CKD: Recent Highlights and Key Upcoming Milestones CARDINAL trial in Alport syndrome Released one year Phase 2 data Phase 3 portion of CARDINAL underway Next milestone: One year, pivotal Phase 3 data in 2H19 PHOENIX trial in rare forms of CKD Released complete ADPKD and interim IgAN data Next milestone: 12-week data from IgAN and T1D CKD cohorts in 3Q18 Phase 3 trial in ADPKD Developing plans to advance the program into a pivotal, Phase 3 trial Phase 3 trial in diabetic CKD Phase 3 AYAME trial underway Next milestone: Data in 1H22
Q&A
