Attached files
| file | filename |
|---|---|
| EX-99.2 - EXHIBIT 99.2 - FB Financial Corp | a51841272ex99_2.htm |
| EX-99.1 - EXHIBIT 99.1 - FB Financial Corp | a51841272ex99_1.htm |
| 8-K - FB FINANCIAL CORPORATION 8-K - FB Financial Corp | a51841272.htm |

Second Quarter 2018 Earnings Presentation July 24, 2018

Certain statements contained in this presentation are forward-looking statements within the meaning of Section 27A of the Securities Act of 1933, as amended, and Section 21E of the Securities Exchange Act of 1934, as amended. These forward-looking statements include, without limitation, statements relating to the Company’s business, cash flows, condition (financial or otherwise), credit quality, financial performance, liquidity, short and long-term performance goals, prospects, results of operations, strategic initiatives and the timing, benefits, costs and synergies of future acquisition, disposition and other growth opportunities. These statements, which are based upon certain assumptions and estimates and describe the Company’s future plans, results, strategies and expectations, can generally be identified by the use of the words and phrases “may,” “will,” “should,” “could,” “would,” “goal,” “plan,” “potential,” “estimate,” “project,” “believe,” “intend,” “anticipate,” “expect,” “target,” “aim,” “predict,” “continue,” “seek,” “projection” and other variations of such words and phrases and similar expressions. These forward-looking statements are not historical facts, and are based upon current expectations, estimates and projections about the Company’s industry, management’s beliefs and certain assumptions made by management, many of which, by their nature, are inherently uncertain and beyond the Company’s control. The inclusion of these forward-looking statements should not be regarded as a representation by the Company or any other person that such expectations, estimates and projections will be achieved. Accordingly, the Company cautions investors that any such forward-looking statements are not guarantees of future performance and are subject to risks, assumptions and uncertainties that are difficult to predict and that are beyond the Company’s control. Although the Company believes that the expectations reflected in these forward-looking statements are reasonable as of the date of this presentation, actual results may prove to be materially different from the results expressed or implied by the forward-looking statements. A number of factors could cause actual results to differ materially from those contemplated by the forward-looking statements in this presentation including, without limitation, the risks and other factors set forth in the Company’s Annual Report on Form 10-K for the year ended December 31, 2017, filed with the SEC on March 16, 2018 under the captions “Cautionary note regarding forward-looking statements” and “Risk factors.” Many of these factors are beyond the Company’s ability to control or predict. If one or more events related to these or other risks or uncertainties materialize, or if the Company’s underlying assumptions prove to be incorrect, actual results may differ materially from the forward-looking statements. Accordingly, investors should not place undue reliance on any such forward-looking statements. Any forward-looking statement speaks only as of the date of this presentation, and the Company does not undertake any obligation to publicly update or review any forward-looking statement, whether as a result of new information, future developments or otherwise, except as required by law. New risks and uncertainties may emerge from time to time, and it is not possible for the Company to predict their occurrence or how they will affect the Company. Forward looking statements

Use of non-GAAP financial measures This presentation contains certain financial measures that are not measures recognized under U.S. generally accepted accounting principles (“GAAP”) and therefore are considered non-GAAP financial measures. These non‐GAAP financial measures include, without limitation, adjusted net income, adjusted diluted earnings per share, core net income, core diluted earnings per share, adjusted pro forma net income, adjusted pro forma diluted earnings per share, pro forma core net income, pro forma core diluted earnings per share, core noninterest expense, core noninterest income, core efficiency ratio (tax-equivalent basis), banking segment core efficiency ratio (tax-equivalent basis), mortgage segment core efficiency ratio (tax-efficiency basis), adjusted mortgage contribution, adjusted return on average assets and equity, core return on average assets and equity and core total revenue. Each of these non-GAAP metrics excludes certain income and expense items that the Company’s management considers to be non‐core/adjusted in nature. The Company refers to these non‐GAAP measures as adjusted or core measures. The corresponding Earnings Release also presents tangible assets, tangible common equity, tangible book value per common share, tangible common equity to tangible assets, return on tangible common equity, return on average tangible common equity, adjusted return on average assets, adjusted return on average equity, core return on average tangible common equity, adjusted return on average tangible common equity, pro forma return on average assets and equity, pro forma adjusted return on average assets and equity and pro forma core return on average assets and equity. Each of these non-GAAP metrics excludes the impact of goodwill and other intangibles.The Company’s management uses these non-GAAP financial measures in their analysis of the Company’s performance, financial condition and the efficiency of its operations as management believes such measures facilitate period-to-period comparisons and provide meaningful indications of its operating performance as they eliminate both gains and charges that management views as non-recurring or not indicative of operating performance. Management believes that these non-GAAP financial measures provide a greater understanding of ongoing operations and enhance comparability of results with prior periods as well as demonstrating the effects of significant non-core gains and charges in the current and prior periods. The Company’s management also believes that investors find these non-GAAP financial measures useful as they assist investors in understanding the Company’s underlying operating performance and in the analysis of ongoing operating trends. In addition, because intangible assets such as goodwill and other intangibles, and the other items excluded each vary extensively from company to company, the Company believes that the presentation of this information allows investors to more easily compare the Company’s results to the results of other companies. However, the non-GAAP financial measures discussed herein should not be considered in isolation or as a substitute for the most directly comparable or other financial measures calculated in accordance with GAAP. Moreover, the manner in which the Company calculates the non-GAAP financial measures discussed herein may differ from that of other companies reporting measures with similar names. You should understand how such other banking organizations calculate their financial measures similar or with names similar to the non-GAAP financial measures the Company has discussed herein when comparing such non-GAAP financial measures. The following tables provide a reconciliation of these measures to the most directly comparable GAAP financial measures.

Three months endedJune 30, 2018 Non-GAAP adjusted results1 Reported GAAP results Diluted earnings per share $0.72 $0.70 Net income ($million) $22.7 $22.1 Net interest margin 4.81% 4.81% Return on average assets 1.91% 1.86% Return on average equity 14.8% 14.4% Return on average tangible common equity 19.6% 19.0% Efficiency ratio 62.1% 64.5% 2Q 2018 highlights Key highlights Financial results 1 Adjusted results are non-GAAP financial measures that adjust GAAP reported net income and other metrics for certain income and expense items as outlined in the non-GAAP reconciliation calculations, using a combined marginal income tax rate of 26.06% excluding one-time items. See “Use of non-GAAP financial measures” and the Appendix hereto.2 Includes accretion from acquired / purchased loans and collection of interest income on nonaccrual loans, which contributed 20 basis points to net interest margin. Adjusted diluted EPS of $0.721, resulting in adjusted ROAA of 1.91%1Loans (HFI) grew to $3.4 billion, a 73.3% increase from 2Q 2017; grew 21.1% annualized from 1Q 2018Customer deposits grew to $3.8 billion, a 41.0% increase from 2Q 2017; grew 17.3% annualized from 1Q 2018Continued customer-focused balance sheet growth resulting in a net interest margin of 4.81% for 2Q 2018, compared to 4.64% for 1Q 2018Continuing to gain positive operating leverage, Banking Segment core efficiency ratio improved to 51.7%1 in 2Q 2018, down 874 basis points from 2Q 2017Mortgage banking income of $28.5 million, a 5.6% decrease from 2Q 2017, driven by lower interest rate lock commitment (IRLC) volume of $2.0 billion for the quarter, down 8.4% from 2Q 2017Completed $151.8 million follow-on secondary offering on May 31, 2018 2

4 0.91% 1.21% 1.46% 1.52% 1.85% 2014 2015 2016 2017 YTD 2018 0.50% 0.29% 0.32% 0.30% 0.26% 2Q17 3Q17 4Q17 1Q18 2Q18 4.19% 4.61% 4.63% 4.64% 4.81% 2Q17 3Q17 4Q17 1Q18 2Q18 Consistently delivering balanced profitability and growth Drivers of profitability Pro forma return on average assets, adjusted1 Net interest margin $36 $38 $37 $33 $36 2Q17 3Q17 4Q17 1Q18 2Q18 Noninterest income ($mn) 88% 96% 101% 97% 97% 72% 84% 86% 86% 87% 16% 12% 15% 11% 10% 2Q17 3Q17 4Q17 1Q18 2Q18 Loans excluding HFS Loans HFS Loans / deposits 1Our pro forma net income includes a pro forma provision for federal income taxes using a combined effective income tax rate of 35.63%, 35.08% and 36.75% for the years ended December 31, 2014, 2015 and 2016, respectively, and also includes the exclusion of a one-time tax charge from C Corp conversion in 3Q 2016 and the 4Q 2017 benefit from the 2017 Tax Cuts and Jobs Act. The years ended December 31 2014, 2015, 2016 and 2017 are annual percentages. NPLs (HFI) / loans (HFI) (%)

5 Peer-leading net interest margin remains strong Historical yield and costs 1Includes tax-equivalent adjustment NIM (%) 4.19% 4.61% 4.63% 4.64% 4.81% Impact of accretion and nonaccrual interest collections (bps) 15 28 28 20 20 Deposit cost (%) 0.34% 0.46% 0.50% 0.55% 0.62% Loan (HFI) yield 2Q17 1Q18 2Q18 Contractual interest rate on loans HFI1 4.63% 5.28% 5.37% Origination and other loan fee income 0.30% 0.37% 0.46% 4.93% 5.65% 5.83% Nonaccrual interest collections 0.07% 0.05% 0.03% Accretion on purchased loans 0.17% 0.21% 0.23% Syndication fee income 0.02% 0.01% 0.03% Total loan yield (HFI) 5.19% 5.92% 6.12% Average interest earning assets Yield on loans Cost of deposits NIM $0 $500 $1,000 $1,500 $2,000 $2,500 $3,000 $3,500 $4,000 $4,500 $5,000 -- 1.0% 2.0% 3.0% 4.0% 5.0% 6.0% 7.0% 2Q17 3Q17 4Q17 1Q18 2Q18 Avg. interest earning assets ($mm) Yields and Costs (%)

6 Total HFI loans: $1,240 million 1-4 family19% 1-4 family HELOC13% Multifamily3% C&D8% CRE14% C&I38% Other5% 1-4 family15% 1-4 family HELOC6% Multifamily2% C&D15% CRE17% C&I39% Other6% Consistent loan growth and balanced portfolio Total loan growth 1 ($million) and commercial real estate concentration Loan portfolio breakdown 4Q12 2Q18 Total HFI loans: $3,416 million 1Exclude HFS loans, C&I includes owner-occupied CRE 2Risk-based capital at First Bank as defined in Call Report. 2Q 2018 calculation is preliminary and subject to change. 3Excludes owner-occupied CRE $1,971 $3,115 $3,167 $3,245 $3,416 2Q17 3Q17 4Q17 1Q18 2Q18 Commercial real estate (CRE) concentrations2 % of Risk-Based Capital 1Q18 2Q18 (preliminary) C&D loans subject to 100% risk-based capital threshold3 98% 105% Total CRE loans subject to 300% risk-based capital threshold3 229% 239%

7 Stable, low cost core deposit franchise 26.2% 24.9% 24.2% 24.7% 24.8% 0.34% 0.46% 0.50% 0.55% 0.62% 0.0% 5.0% 10.0% 15.0% 20.0% 25.0% 30.0% 2Q17 3Q17 4Q17 1Q18 2Q18 Noninterest bearing (%) Cost of total deposits (%) $715 $925 $888 $931 $971 2Q17 3Q17 4Q17 1Q18 2Q18 $2,726 $3,614 $3,578 $3,685 $3,844 $2 $104 $86 $81 $66 $2,728 $3,718 $3,664 $3,766 $3,910 2Q17 3Q17 4Q17 1Q18 2Q18 Customer deposits Brokered and internet time deposits Total deposits ($million) 1Includes mortgage servicing-related escrow deposits of$49.9million, $56.8 million, $53.7, $74.1 million and $88.4 million for the quarters ended June 30, 2017, September 30, 2017, December 31, 2017, March 31, 2018 and June 30, 2018 respectively. Noninterest bearing deposits ($million)1 Deposit composition Cost of deposits Noninterest-bearing25% Interest-bearing checking23% Money market28% Savings5% Time19% 48% Checking accounts

8 Mortgage operations overview 2Q 2018 Mortgage Segment pre-tax contribution of $1.9 million. Total mortgage pre-tax contribution (including retail footprint) of $3.2 million, 10.4% of adjusted consolidated pre-tax income, down from 29.6% in 2Q 2017 Mortgage banking income $28.5 million, down 5.6% from 2Q 2017, up 7.8% from 1Q 2018 Expect to sell $3.3 billion of loans serviced during the 3rdquarter with no material gain Including the impact of MSR sales, we expect total mortgage pre-tax contribution (including retail footprint) to be $5-$7 million in 3Q & 4Q 2018 compared to the pre-tax contribution in 3Q & 4Q 2017 of $9.7 million Highlights Gain on Sale Total pre-tax contribution, adjusted2(%) Mortgage production Consumer Direct Correspondent Third party originated Retail Retail footprint Total Mortgage (including retail footprint) Banking (excluding retail footprint) 10.4% 89.6% 2Q18 1Q18 2Q17 1Q18 2Q18 Fair value changes Fair value MSR change Mortgage banking income ($mm) Servicing Revenue 2Q17 Total Income 2Q18 $2,158mm $2,129mm IRLC volume: $1,976mm IRLC pipeline1: $547mm $693mm $598mm Refinance %: 36% 42% 29% Purchase %: 64% 58% 71% 1As of the respective period end. 2See “Use of non-GAAP financial measures” and the Appendix hereto. Mortgage banking income ($mm) $23.9 $23.5 $27.0 $5.4 ($0.1) ($2.3) $2.7 $4.8 $5.6 ($1.8) ($1.7) ($1.8) $30.2 $26.5 $28.5 impact total

9 Improving operating leverage Consolidated 2Q 2018 core efficiency ratio of 62.1% driven by Banking Segment core efficiency ratio of 51.7%, which has improved by 874 basis points since 2Q 2017 2Q 2018 illustrates continued operating leverage achieved through organic growth, merger and ongoing cost efficiencies Total revenue at the consolidated level increased by more than twice the rate of total noninterest expense in 2Q 2018 as compared to 2Q 2017 Continued investment in revenue producers, IT systems and back office personnel to build upon scalable platform Continue to refine mortgage banking with operational efficiency improvements 60.4% 56.2% 55.5% 55.2% 51.7% 70.2% 64.4% 63.6% 65.5% 62.1% 78.3% 79.9% 83.8% 85.7% 83.6% 2Q17 3Q17 4Q17 1Q18 2Q18 Banking Segment Consolidated Mortgage Segment Core efficiency ratio (tax-equivalent basis)1 Improving operating efficiency 1 See “Use of non-GAAP financial measures” and the Appendix hereto.

10 Asset quality remains strong 0.25% 0.15% (0.05%) 0.01% 0.11% 2Q17 3Q17 4Q17 1Q18 2Q18 1.18% 0.75% 0.76% 0.75% 0.77% 2Q17 3Q17 4Q17 1Q18 2Q18 $38 $60 $55 $53 $58 $16 $92 $89 $86 $78 2Q17 3Q17 4Q17 1Q18 2Q18 Classified Purchased credit impaired 0.50% 0.29% 0.32% 0.30% 0.26% 0.58% 0.88% 1.52% 0.59% 0.52% 2Q17 3Q17 4Q17 1Q18 2Q18 NPLs (HFI) / loans (HFI) NPAs / assets Classified & PCI loans ($million) Net recoveries (charge-offs) / average loans Nonperforming ratios LLR / loans 1Includes acquired excess land and facilities for all periods subsequent to the acquisition of the Clayton Banks and GNMA rebooked loans for the third and fourth quarters of 2017 –see page 8 of the Quarterly Financial Supplement. 1

11 Common Equity Tier 1 Capital89% Trust Preferred6% Tier 2 ALLL5% Total capital1: $524.1 million Strong capital position for future growth 1 Total regulatory capital, FB Financial Corporation. 2Q 2018 calculation is preliminary and subject to change. 2 See “Use of non-GAAP financial measures” and the Appendix hereto. Capital position Simple capital structure 2Q17 1Q18 2Q181 Shareholder’s equity / Assets 15.2% 12.9% 12.8% TCE / TA2 13.9% 10.2% 10.1% Common equity tier 1 / Risk-weighted assets 17.2% 11.0% 10.7% Tier 1 capital / Risk-weighted assets 18.3% 11.8% 11.4% Total capital / Risk-weighted assets 19.1% 12.3% 12.0% Tier 1 capital / Average assets 15.5% 10.7% 10.9% Tangible book value per share $11.56 $11.58 $14.99 $15.66 3Q16 4Q16 1Q18 2Q18

Appendix 12

13 GAAP reconciliation and use of non-GAAP financial measures Net income, adjusted Net income, adjusted Second Quarter First Quarter Fourth Quarter Third Quarter Second Quarter Pre-tax net income $ 29,859 $ 25,236 $ 27,504 $ 12,990 $ 17,813 Plus merger and offering-related expenses671 1,193 2,069 15,711 767 Less signficant gains (losses) on securities, other real estate owned and other items- - - - - Pre-tax net income, adjusted30,530$ 26,429$ 29,573$ 28,701$ 18,580$ Income tax expense, adjusted7,794 5,793 11,308 10,765 6,875 Net income, adjusted22,736$ 20,636$ 18,265$ 17,936$ 11,705$ Weighted average common shares outstanding fully diluted31,294,044 31,421,830 31,166,080 30,604,537 26,301,458 Earnings per share, adjusted Diluted earning per share0.70$ 0.63$ 0.74$ 0.27$ 0.43$ Plus merger and offering-related expenses0.02 0.04 0.07 0.51 0.03 Less signficant gains (losses) on securities, other real estate owned and other items- - - - - Tax effect - (0.01) (0.22) (0.20) (0.01) Diluted earnings per share, adjusted0.72$ 0.66$ 0.59$ 0.58$ 0.45$ Previously reported core results*Fourth Quarter Third Quarter Second Quarter First Quarter Core net income 18,677$ 18,516$ 12,919$ 10,284$ Core diluted earnings per share0.60$ 0.60$ 0.49$ 0.42$ * Non-GAAP reconciliations of previously reported core results are included in previously issued earnings release supplements.20182017Previously, the Company adjusted reported net income for the following items: (i) change in fair value in MSRs, net, and (ii) Gains (losses) from securities, OREO, MSRs, other assets, and other items. Beginning with the first quarter of 2018, the Company is only adjusting reported earnings for (i) merger and conversion costs, (ii) impact of tax reform (fourth quarter 2017); and (iii) other significant items impacting comparability between quarterly and annual periods including costs related to the secondary stock offering completed by our primary shareholder during the second quarter of 2018. Prior periods have been adjusted to conform to this presentation, see below for previously reported amounts: 2017

14 GAAP reconciliation and use of non-GAAP financial measures Pro forma net income, adjusted Pro forma net income, adjusted YTD 20182017201620152014Pre-tax net income $ 55,095 $ 73,485 $ 62,324 $ 50,824 $ 34,731 Plus merger and offering-related expenses1,864 19,034 3,268 3,543 - Less signficant gains (losses) on securities, other real estate owned and other items- - (3,539) 4,638 2,000 Pre tax net income, adjusted 56,959$ 92,519$ 69,131$ 49,729$ 32,731$ Pro forma income tax expense, adjusted13,587 34,749 25,404 18,425 11,662 Pro forma net income, adjusted 43,372$ 57,770$ 43,727$ 31,304$ 21,069$ Weighted average common shares outstanding fully diluted31,275,846 28,207,602 19,312,174 17,180,000 17,180,000 Pro forma diluted earnings per share, adjusted Diluted earning per share1.33$ 1.86$ 2.10$ 2.79$ 1.89$ Plus merger and offering-related expenses0.06 0.67 0.17 0.21 - Less signficant gains (losses) on securities, other real estate owned and other items- - (0.18) 0.27 0.12 Tax effect (0.01) (0.48) (0.19) (0.91) (0.54) Pro forma diluted earnings per share, adjusted1.38$ 2.05$ 2.26$ 1.82$ 1.23$ Previously reported pro forma core results*2017201620152014Pro forma core net income 60,396$ 46,120$ 34,577$ 22,872$ Pro forma core diluted earnings per share2.14$ 2.39$ 2.01$ 1.33$ * Non-GAAP reconciliations of previously reported core results are included in previously issued earnings release supplements.
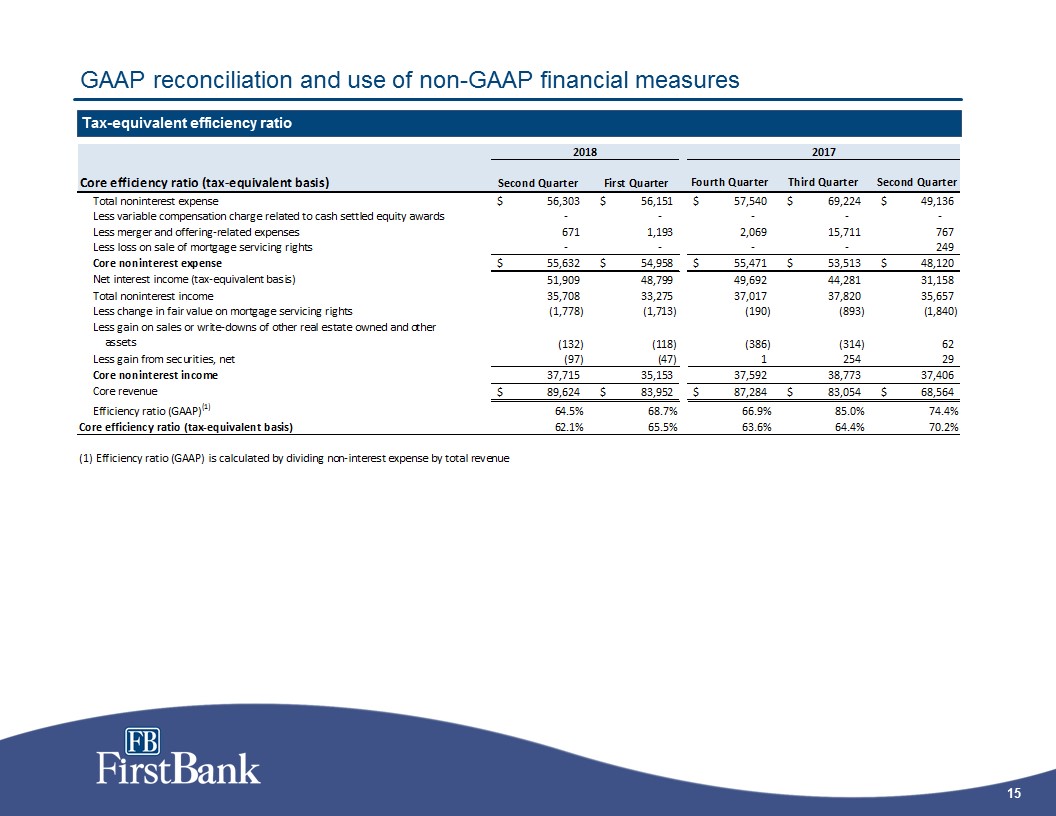
15 GAAP reconciliation and use of non-GAAP financial measures Tax-equivalent efficiency ratio Core efficiency ratio (tax-equivalent basis)Second Quarter First Quarter Fourth Quarter Third Quarter Second Quarter Total noninterest expense56,303$ 56,151$ 57,540$ 69,224$ 49,136$ Less variable compensation charge related to cash settled equity awards- - - - - Less merger and offering-related expenses671 1,193 2,069 15,711 767 Less loss on sale of mortgage servicing rights- - - - 249 Core noninterest expense55,632$ 54,958$ 55,471$ 53,513$ 48,120$ Net interest income (tax-equivalent basis)51,909 48,799 49,692 44,281 31,158 Total noninterest income35,708 33,275 37,017 37,820 35,657 Less change in fair value on mortgage servicing rights(1,778) (1,713) (190) (893) (1,840) Less gain on sales or write-downs of other real estate owned and other assets(132) (118) (386) (314) 62 Less gain from securities, net(97) (47) 1 254 29 Core noninterest income37,715 35,153 37,592 38,773 37,406 Core revenue89,624$ 83,952$ 87,284$ 83,054$ 68,564$ Efficiency ratio (GAAP)(1)64.5%68.7%66.9%85.0%74.4%Core efficiency ratio (tax-equivalent basis)62.1%65.5%63.6%64.4%70.2%20182017(1) Efficiency ratio (GAAP) is calculated by dividing non-interest expense by total revenue

16 GAAP reconciliation and use of non-GAAP financial measures Segment tax-equivalent efficiency ratio Banking segment core efficiency ratio (tax equivalent)Second Quarter First Quarter Fourth Quarter Third Quarter Second Quarter Core consolidated noninterest expense55,632$ 54,958$ 55,471$ 53,513$ 48,120$ Less Mortgage segment noninterest expense19,582 18,910 20,117 19,757 19,802 Add loss on sale of mortgage servicing rights- - - - 249 Adjusted Banking segment noninterest expense36,050 36,048 35,354 33,756 28,567 Adjusted core revenue89,624 83,952 87,284 83,054 68,564 Less Mortgage segment noninterest income 21,650 20,363 23,825 23,836 23,121 Less change in fair value on mortgage servicing rights(1,778) (1,713) (190) (893) (1,840) Adjusted Banking segment total revenue69,752$ 65,302$ 63,649$ 60,111$ 47,283$ Banking segment core efficiency ratio (tax-equivalent basis)51.7%55.2%55.5%56.2%60.4%Mortgage segment core efficiency ratio (tax equivalent)Consolidated noninterest expense56,303$ 56,151$ 57,540$ 69,224$ 49,136$ Less loss on sale of mortgage servicing rights- - - - 249 Less Banking segment noninterest expense36,721 37,241 37,423 49,467 29,334 Adjusted Mortgage segment noninterest expense19,582$ 18,910$ 20,117$ 19,757$ 19,553$ Total noninterest income35,708 33,275 37,017 37,820 35,657 Less Banking segment noninterest income 14,058 12,912 13,192 13,984 12,536 Less change in fair value on mortgage servicing rights(1,778) (1,713) (190) (893) (1,840) Adjusted Mortgage segment total revenue23,428$ 22,076$ 24,015$ 24,729$ 24,961$ Mortgage segment core efficiency ratio (tax-equivalent basis)83.6%85.7%83.8%79.9%78.3%20182017

17 GAAP reconciliation and use of non-GAAP financial measures Mortgage contribution, adjusted Mortgage contribution, adjusted Second Quarter First Quarter Fourth Quarter Third Quarter Second Quarter Mortgage segment pre-tax net contribution1,916$ 1,111$ 3,269$ 3,948$ 3,747$ Retail footprint: Mortgage banking income6,894 6,108 6,455 7,498 7,118 Mortgage banking expenses5,649 5,097 5,294 6,216 5,368 Retail footprint pre-tax net contribution 1,245 1,011 1,161 1,282 1,750 Total mortgage banking pre-tax net contribution3,161$ 2,122$ 4,430$ 5,230$ 5,497$ Pre-tax net income29,859 25,236 27,504 12,990 17,813 % total mortgage banking pre-tax net contribution10.6%8.4%16.1%40.3%30.9%Pre-tax net income, adjusted30,530 26,429 29,573 28,701 18,580 % total mortgage banking pre-tax net contribution, adjusted10.4%8.0%15.0%18.2%29.6%20182017

18 GAAP reconciliation and use of non-GAAP financial measures Tangible assets and equity Return on average tangible equity Tangible assets and equity Second Quarter First Quarter Fourth Quarter Third Quarter Second Quarter Tangible Assets Total assets $ 4,923,249 $ 4,725,416 $ 4,727,713 $ 4,581,943 $ 3,346,570 Less goodwill 137,190 137,190 137,190 138,910 46,867 Less intangibles, net 13,203 14,027 14,902 12,550 4,048 Tangible assets $ 4,772,856 $ 4,574,199 $ 4,575,621 $ 4,430,483 $ 3,295,655 Tangible Common Equity Total shareholders' equity $ 630,959 $ 611,075 $ 596,729 $ 572,528 $ 509,517 Less goodwill 137,190 137,190 137,190 138,910 46,867 Less intangibles, net 13,203 14,027 14,902 12,550 4,048 Tangible common equity $ 480,566 $ 459,819 $ 444,637 $ 421,068 $ 458,602 Common shares outstanding 30,683,353 30,671,763 30,535,517 30,526,592 28,968,160 Book value per common share $ 20.56 $ 19.92 $ 19.54 $ 18.76 $ 17.59 Tangible book value per common share $ 15.66 $ 14.99 $ 14.56 $ 13.79 $ 15.83 Total shareholders' equity to total assets 12.8% 12.9% 12.6% 12.5% 15.2% Tangible common equity to tangible assets 10.1% 10.2% 9.7% 9.5% 13.9% Net income $ 22,065 $ 19,754 $ 23,018 $ 8,388 $ 11,239 Return on tangible common equity 18.4% 17.4% 20.5% 7.9% 9.8% 2018 2017 Return on average tangible common equity Second Quarter First Quarter Fourth Quarter Third Quarter Second Quarter Total average shareholders' equity $ 615,950 $ 599,198 $ 578,856 $ 550,409 $ 398,805 Less average goodwill 137,190 137,190 137,190 108,220 46,839 Less intangibles, net 13,615 14,465 13,726 9,983 4,124 Average tangible common equity $ 465,145 $ 447,544 $ 427,940 $ 432,206 $ 347,842 Net income $ 22,065 $ 19,754 $ 23,018 $ 8,388 $ 11,239 Return on average tangible common equity 19.0% 17.9% 21.3% 7.7% 13.0% 2018 2017

19 GAAP reconciliation and use of non-GAAP financial measures Return on average tangible equity, adjusted Return on average assets and equity, adjusted Return on average tangible equity, adjusted Second Quarter First Quarter Fourth Quarter Third Quarter Second Quarter Average tangible common equity 465,145 447,544 427,940 432,206 347,842 Net income, adjusted $ 22,736 $ 20,636 $ 18,265 $ 17,936 $ 11,705 Return on average tangible equity, adjusted 19.6% 18.7% 16.9% 16.5% 13.5% 2018 2017 Return on average assets and equity, adjusted Second Quarter First Quarter Fourth Quarter Third Quarter Second Quarter Net income $ 22,065 $ 19,754 $ 23,018 $ 8,388 $ 11,239 Average assets 4,763,991 4,678,494 4,664,669 4,162,478 3,224,783 Average equity 615,950 599,198 578,856 550,409 398,805 Return on average assets 1.86% 1.71% 1.96% 0.80% 1.40% Return on average equity 14.4% 13.4% 15.8% 6.1% 11.3% Net income, adjusted 22,736 20,636 18,265 17,936 11,705 Return on average assets, adjusted 1.91% 1.79% 1.55% 1.71% 1.46% Return on average equity, adjusted 14.8% 14.0% 12.5% 12.9% 11.8% Previously reported core metrics* Fourth Quarter Third Quarter Second Quarter Core return on average tangible common equity 17.4% 17.0% 14.9% Core return on average assets 1.59% 1.76% 1.61% Core return on average equity 12.8% 13.3% 13.0% Core total revenue $ 86,575 $ 82,383 $ 67,833 * Non-GAAP reconciliations of previously reported core results are included in previously issued earnings release supplements. 2018 2017 2017

20 GAAP reconciliation and use of non-GAAP financial measures Return on average assets and equity, adjusted Pro forma return on average assets and equity, adjusted YTD 20182017201620152014 Pro forma Net income41,819$ 52,398$ 40,951$ 47,856$ 32,462$ Average assets 4,719,932 3,811,158 3,001,275 2,577,895 2,311,297 Average equity 607,708 466,219 276,587 228,844 203,615 Pro forma return on average assets1.79%1.37%1.36%1.86%1.40%Pro forma return on average equity13.9%11.2%14.8%20.9%15.9% Pro forma net income, adjusted $ 43,372 $ 57,770 $ 43,727 $ 31,304 $ 21,069 Pro forma return on average assets, adjusted1.85%1.52%1.46%1.21%0.91%Pro forma return on average equity, adjusted14.4%12.4%15.8%13.7%10.3%Previously reported core metrics*2017201620152014Pro forma core return on average assets1.56%1.54%1.34%0.99%Pro forma core return on average equity13.0%16.7%15.1%11.2%* Non-GAAP reconciliations of previously reported core results are included in previously issued earnings release supplements.