Attached files
| file | filename |
|---|---|
| EX-99.1 - EXHIBIT 99.1 - CHART INDUSTRIES INC | ex991gtls-2018630xpressrel.htm |
| 8-K - 8-K - CHART INDUSTRIES INC | gtls-20180719x8kearningsre.htm |

Chart Industries, Inc. Second Quarter 2018 July 19, 2018 © 2018 Chart Industries, Inc. Confidential and Proprietary
Forward-Looking Statements Certain statements made in this presentation are forward-looking statements within the meaning of the Private Securities Litigation Reform Act of 1995. Forward-looking statements include statements concerning Chart Industries’ plans, objectives, future orders, revenues, margins, tax rates and tax planning, earnings or performance, liquidity and cash flow, capital expenditures, business trends, and other information that is not historical in nature. Forward-looking statements may be identified by terminology such as "may," "will," "should," "could," "expects," "anticipates," "believes," "projects," "forecasts," “outlook,” “guidance,” "continue," or the negative of such terms or comparable terminology. Forward-looking statements contained in this presentation or in other statements made by the Company are made based on management's expectations and beliefs concerning future events impacting the Company and are subject to uncertainties and factors relating to the Company's operations and business environment, all of which are difficult to predict and many of which are beyond the Company's control, that could cause the Company's actual results to differ materially from those matters expressed or implied by forward-looking statements. Factors that could cause the Company’s actual results to differ materially from those described in the forward-looking statements include those found in Item 1A (Risk Factors) in the Company’s most recent Annual Report on Form 10-K filed with the SEC, which should be reviewed carefully, as well as risks and uncertainties related to the integration of the Hudson businesses with the Company’s, and risks and uncertainties associated with the strategic review process underway with respect to the BioMedical segment, and the results of such process, including any possible divestiture or transaction, and the uncertainty whether any such possible transaction is completed, and if so, the terms, structure and timing of any such transaction. The Company undertakes no obligation to update or revise any forward-looking statement. Chart Industries is a leading diversified global manufacturer of highly engineered equipment for the industrial gas, energy, and biomedical industries. The majority of Chart Industries' products are used throughout the liquid gas supply chain for purification, liquefaction, distribution, storage and end-use applications, a large portion of which are energy-related. Chart Industries has domestic operations located across the United States and an international presence in Asia, Australia, Europe and Latin America. For more information, visit: http://www.chartindustries.com. © 2018 Chart Industries, Inc. Confidential and Proprietary 2
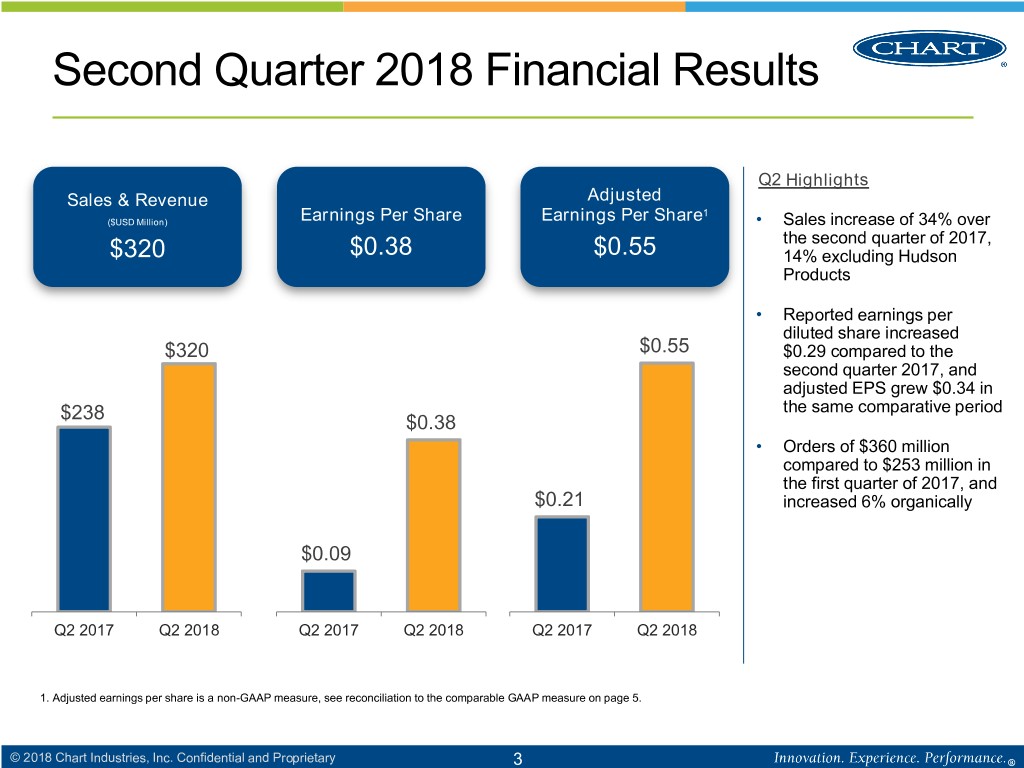
Second Quarter 2018 Financial Results Q2 Highlights Sales & Revenue Adjusted 1 ($USD Million) Earnings Per Share Earnings Per Share • Sales increase of 34% over the second quarter of 2017, $320 $0.38 $0.55 14% excluding Hudson Products • Reported earnings per diluted share increased $320 $0.55 $0.29 compared to the second quarter 2017, and adjusted EPS grew $0.34 in the same comparative period $238 $0.38 • Orders of $360 million compared to $253 million in the first quarter of 2017, and $0.21 increased 6% organically $0.09 Q2 2017 Q2 2018 Q2 2017 Q2 2018 Q2 2017 Q2 2018 1. Adjusted earnings per share is a non-GAAP measure, see reconciliation to the comparable GAAP measure on page 5. © 2018 Chart Industries, Inc. Confidential and Proprietary 3
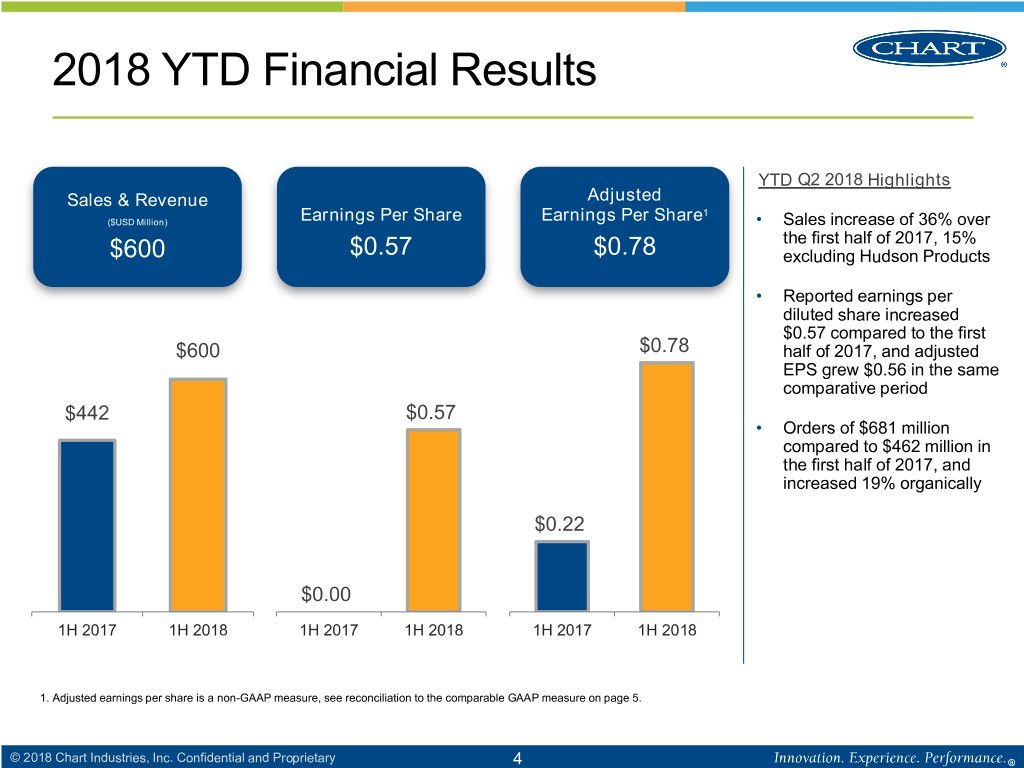
2018 YTD Financial Results YTD Q2 2018 Highlights Sales & Revenue Adjusted 1 ($USD Million) Earnings Per Share Earnings Per Share • Sales increase of 36% over the first half of 2017, 15% $600 $0.57 $0.78 excluding Hudson Products • Reported earnings per diluted share increased $0.57 compared to the first $600 $0.78 half of 2017, and adjusted EPS grew $0.56 in the same comparative period $442 $0.57 • Orders of $681 million compared to $462 million in the first half of 2017, and increased 19% organically $0.22 $0.00 1H 2017 1H 2018 1H 2017 1H 2018 1H 2017 1H 2018 1. Adjusted earnings per share is a non-GAAP measure, see reconciliation to the comparable GAAP measure on page 5. © 2018 Chart Industries, Inc. Confidential and Proprietary 4
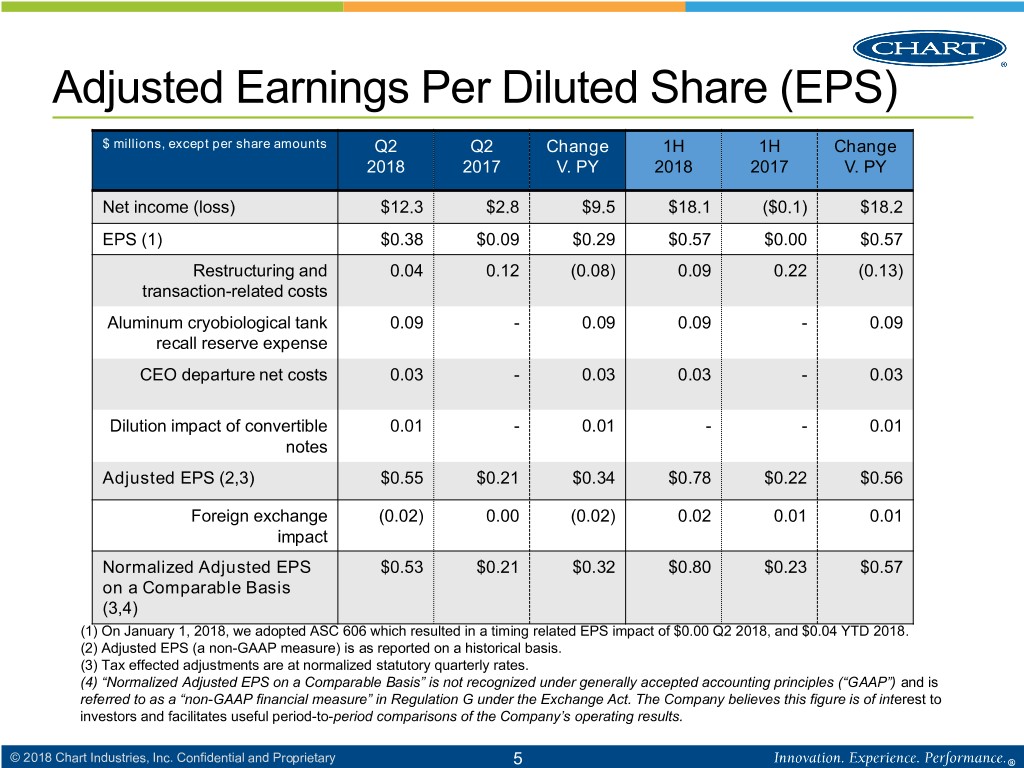
Adjusted Earnings Per Diluted Share (EPS) $ millions, except per share amounts Q2 Q2 Change 1H 1H Change 2018 2017 V. PY 2018 2017 V. PY Net income (loss) $12.3 $2.8 $9.5 $18.1 ($0.1) $18.2 EPS (1) $0.38 $0.09 $0.29 $0.57 $0.00 $0.57 Restructuring and 0.04 0.12 (0.08) 0.09 0.22 (0.13) transaction-related costs Aluminum cryobiological tank 0.09 - 0.09 0.09 - 0.09 recall reserve expense CEO departure net costs 0.03 - 0.03 0.03 - 0.03 Dilution impact of convertible 0.01 - 0.01 - - 0.01 notes Adjusted EPS (2,3) $0.55 $0.21 $0.34 $0.78 $0.22 $0.56 Foreign exchange (0.02) 0.00 (0.02) 0.02 0.01 0.01 impact Normalized Adjusted EPS $0.53 $0.21 $0.32 $0.80 $0.23 $0.57 on a Comparable Basis (3,4) (1) On January 1, 2018, we adopted ASC 606 which resulted in a timing related EPS impact of $0.00 Q2 2018, and $0.04 YTD 2018. (2) Adjusted EPS (a non-GAAP measure) is as reported on a historical basis. (3) Tax effected adjustments are at normalized statutory quarterly rates. (4) “Normalized Adjusted EPS on a Comparable Basis” is not recognized under generally accepted accounting principles (“GAAP”) and is referred to as a “non-GAAP financial measure” in Regulation G under the Exchange Act. The Company believes this figure is of interest to investors and facilitates useful period-to-period comparisons of the Company’s operating results. © 2018 Chart Industries, Inc. Confidential and Proprietary 5
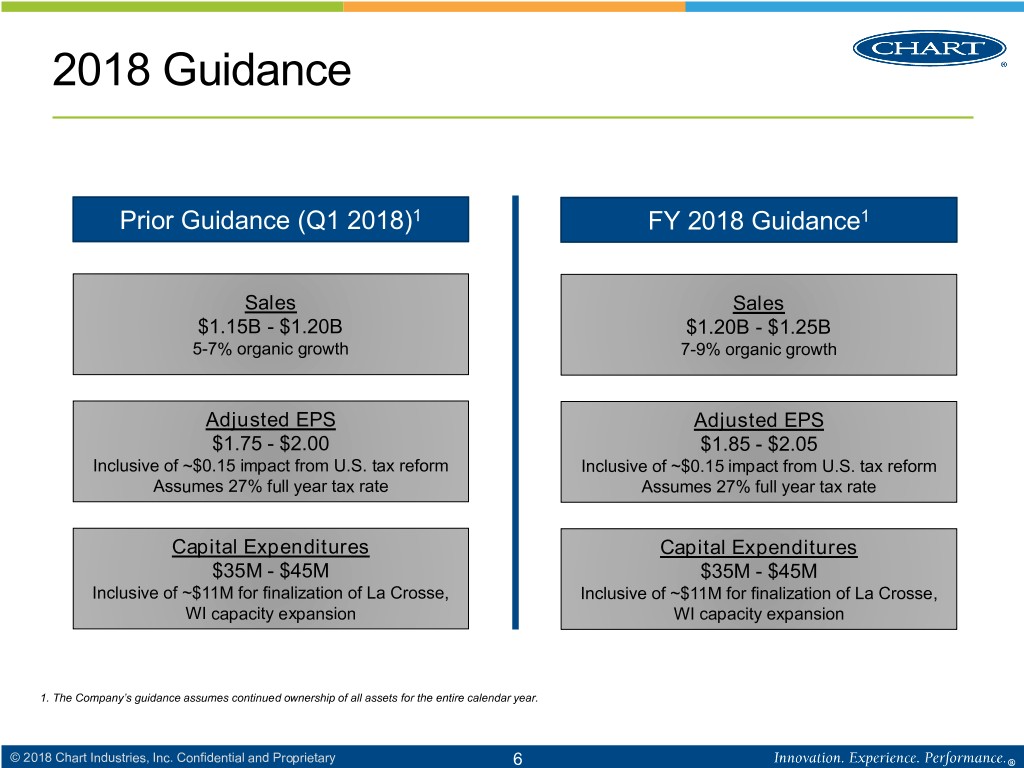
2018 Guidance Prior Guidance (Q1 2018)1 FY 2018 Guidance1 Sales Sales $1.15B - $1.20B $1.20B - $1.25B 5-7% organic growth 7-9% organic growth Adjusted EPS Adjusted EPS $1.75 - $2.00 $1.85 - $2.05 Inclusive of ~$0.15 impact from U.S. tax reform Inclusive of ~$0.15 impact from U.S. tax reform Assumes 27% full year tax rate Assumes 27% full year tax rate Capital Expenditures Capital Expenditures $35M - $45M $35M - $45M Inclusive of ~$11M for finalization of La Crosse, Inclusive of ~$11M for finalization of La Crosse, WI capacity expansion WI capacity expansion 1. The Company’s guidance assumes continued ownership of all assets for the entire calendar year. © 2018 Chart Industries, Inc. Confidential and Proprietary 6
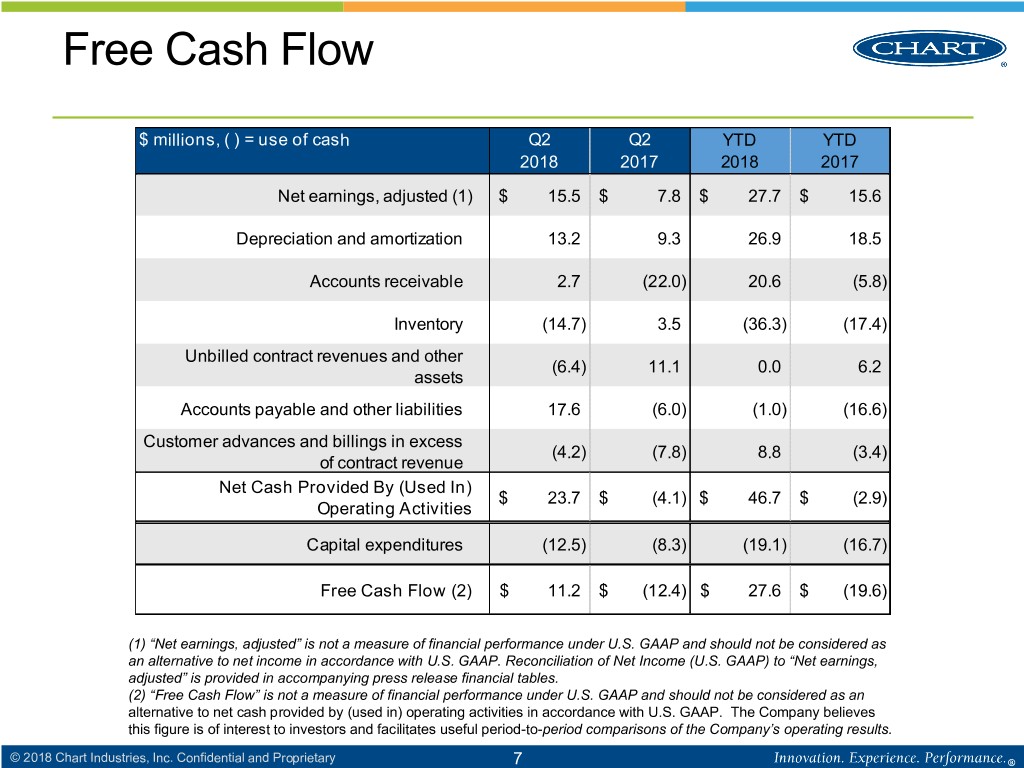
Free Cash Flow $ millions, ( ) = use of cash Q2 Q2 YTD YTD 2018 2017 2018 2017 Net earnings, adjusted (1) $ 15.5 $ 7.8 $ 27.7 $ 15.6 Depreciation and amortization 13.2 9.3 26.9 18.5 Accounts receivable 2.7 (22.0) 20.6 (5.8) Inventory (14.7) 3.5 (36.3) (17.4) Unbilled contract revenues and other (6.4) 11.1 0.0 6.2 assets Accounts payable and other liabilities 17.6 (6.0) (1.0) (16.6) Customer advances and billings in excess (4.2) (7.8) 8.8 (3.4) of contract revenue Net Cash Provided By (Used In) $ 23.7 $ (4.1) $ 46.7 $ (2.9) Operating Activities Capital expenditures (12.5) (8.3) (19.1) (16.7) Free Cash Flow (2) $ 11.2 $ (12.4) $ 27.6 $ (19.6) (1) “Net earnings, adjusted” is not a measure of financial performance under U.S. GAAP and should not be considered as an alternative to net income in accordance with U.S. GAAP. Reconciliation of Net Income (U.S. GAAP) to “Net earnings, adjusted” is provided in accompanying press release financial tables. (2) “Free Cash Flow” is not a measure of financial performance under U.S. GAAP and should not be considered as an alternative to net cash provided by (used in) operating activities in accordance with U.S. GAAP. The Company believes this figure is of interest to investors and facilitates useful period-to-period comparisons of the Company’s operating results. © 2018 Chart Industries, Inc. Confidential and Proprietary 7
www.ChartIndustries.com © 2018 Chart Industries, Inc. Confidential and Proprietary 8
