Attached files
| file | filename |
|---|---|
| EX-99.1 - EXHIBIT 99.1 FINANCIAL SUPPLEMENT - FIRST HORIZON CORP | a2q18financialsupplementdo.htm |
| 8-K - 8-K - FIRST HORIZON CORP | a2q18financialsupplement8-.htm |

First Horizon National Corporation Second Quarter 2018 Earnings July 17, 2018

. Portions of this presentation use non-GAAP financial information. Each of those portions is so noted, and a reconciliation of that non-GAAP information to comparable GAAP information is provided in a footnote or in the appendix at the end of this presentation. . This presentation contains forward-looking statements, which may include guidance, involving significant risks and uncertainties which will be identified by words such as “believe”,“expect”,“anticipate”,“intend”,“estimate”, “should”,“is likely”,“will”,“going forward” and other expressions that indicate future events and trends and may be followed by or reference cautionary statements. A number of factors could cause actual results to differ materially from those in the forward-looking statements. These factors are outlined in our recent earnings and other press releases and in more detail in the most current 10-Q and 10-K. FHN disclaims any obligation to update any such forward-looking statements or to publicly announce the result of any revisions to any of the forward-looking statements to reflect future events or developments. 2

Second Quarter 2018 Highlights Sustainable Earnings Growth, Delivering on Capital Bank Merger Commitments EPS ROTCE1 ROA Reported $0.25 -7% Reported 12.6% -143bps Reported 0.86% -9bps Adjusted1 $0.36 +6% Adjusted1 18.2% +85bps Adjusted1 1.22% +5bps . Accelerating earnings growth . Strong net interest income growth and net interest margin expansion . Delivering higher returns and improved efficiency . Demonstrating higher earnings accretion from Capital Bank merger . Completed systems conversion . Accelerated achievement of cost savings . Meaningful ongoing revenue synergies realized . Excellent credit quality trends All comparisons are 2Q18 vs 1Q18. 1Adjusted EPS, Adjusted ROA, ROTCE and Adjusted ROTCE are Non-GAAP numbers and are reconciled in the appendix. Adjusted numbers exclude notable items as outlined in the appendix. 3

FINANCIAL RESULTS 4

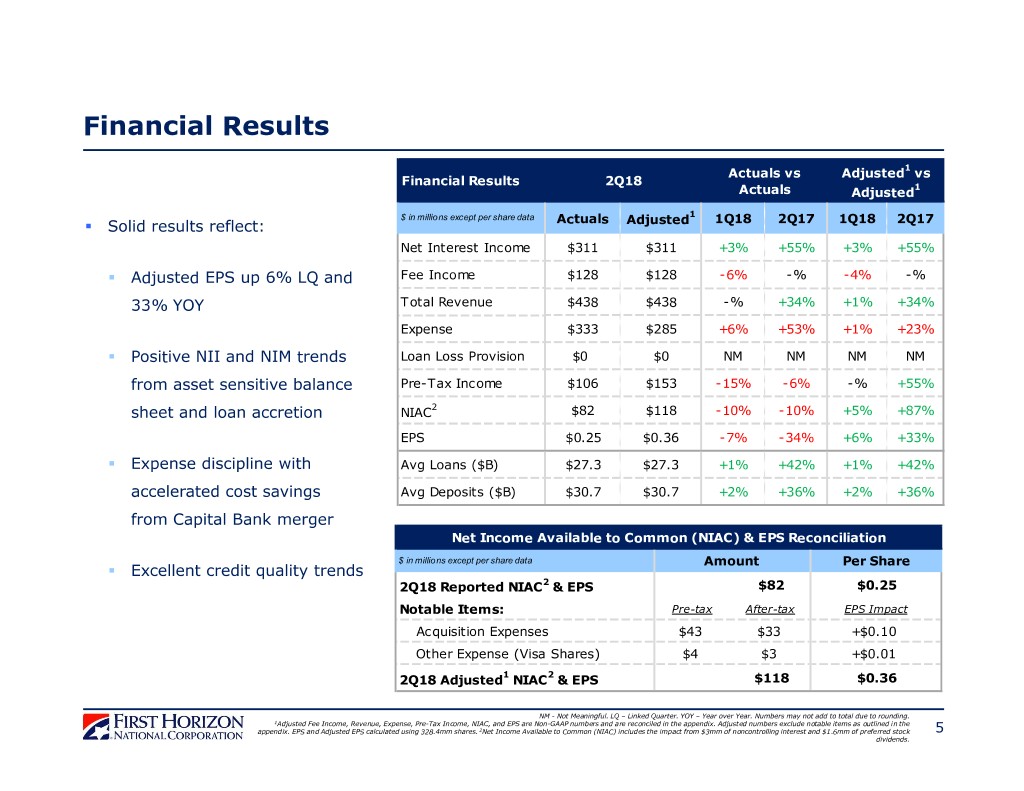
Financial Results Actuals vs Adjusted1 vs Financial Results 2Q18 Actuals Adjusted1 $ in millions except per share data 1 . Solid results reflect: Actuals Adjusted 1Q18 2Q17 1Q18 2Q17 Net Interest Income $311 $311 +3% +55% +3% +55% . Adjusted EPS up 6% LQ and Fee Income $128 $128 -6% -% -4% -% 33% YOY Total Revenue $438 $438 -% +34% +1% +34% Expense $333 $285 +6% +53% +1% +23% . Positive NII and NIM trends Loan Loss Provision $0 $0 NM NM NM NM from asset sensitive balance Pre-Tax Income $106 $153 -15% -6% -% +55% sheet and loan accretion NIAC2 $82 $118 -10% -10% +5% +87% EPS $0.25 $0.36 -7% -34% +6% +33% . Expense discipline with Avg Loans ($B) $27.3 $27.3 +1% +42% +1% +42% accelerated cost savings Avg Deposits ($B) $30.7 $30.7 +2% +36% +2% +36% from Capital Bank merger Net Income Available to Common (NIAC) & EPS Reconciliation $ in millions except per share data Amount Per Share . Excellent credit quality trends 2Q18 Reported NIAC2 & EPS $82 $0.25 Notable Items: Pre-tax After-tax EPS Impact Acquisition Expenses $43 $33 +$0.10 Other Expense (Visa Shares) $4 $3 +$0.01 2Q18 Adjusted1 NIAC2 & EPS $118 $0.36 NM - Not Meaningful. LQ – Linked Quarter. YOY – Year over Year. Numbers may not add to total due to rounding. 1Adjusted Fee Income, Revenue, Expense, Pre-Tax Income, NIAC, and EPS are Non-GAAP numbers and are reconciled in the appendix. Adjusted numbers exclude notable items as outlined in the appendix. EPS and Adjusted EPS calculated using 328.4mm shares. 2Net Income Available to Common (NIAC) includes the impact from $3mm of noncontrolling interest and $1.6mm of preferred stock 5 dividends.

Successful Execution on Capital Bank Merger Priorities Improved EPS Accretion From Higher Cost Savings and Revenue Synergies . Current earnings accretion estimate more than Current 2019 Earnings Accretion Estimate 2x Original 2x original announcement Current Estimate . Cost savings of $12mm achieved in 2Q18 17% Other -1% . ~55% of total cost saves now in run rate Revenue Synergies +2% . Total of closed or in-process revenue synergies Higher Cost 1 of $17mm (YTD Annualized) Original Savings Estimate +3% . 306 total deals1 closed or in-process 8% Tax Reform . Completed systems conversion at end of May +5% Expected Cost Savings in 2018 Ahead of Original Estimates Revenue Synergies 2018 Cost Saves ~$53mm Annual 2019 Cost Saves ~$85mm Annual Revenue Synergies (YTD Annualized)¹ 1Q18 $5mm $22mm $22mm $21mm $19mm 1H18 $17mm $16mm $16mm $12mm # of Deals (YTD)¹ $8mm 36 1Q18 Deals 306 1H18 1Q18 2Q18 3Q18 4Q18 1Q19 2Q19 3Q19 4Q19 Deals Achieved Expected Numbers may not add to total due to rounding. 1Represents revenue synergy transactions that are closed or in-process from consumer lending, commercial lending, wealth management referrals, merchant services, treasury management, franchise finance, and private-client referrals. 6

Net Interest Income and Net Interest Margin Strong Performance Driven by Multiple Factors Loan Yield Betas Have Outpaced Deposit Betas . NIM expansion from 2.92% in 1Q17 to 3.53% in 6.00% 2Q18 driven by: 71% Loan Beta vs 32% Deposit Beta 4.79% 5.00% . Balance sheet growth 4.00% 3.65% . Net benefit from short term rate increases 3.00% 1.74% . Accretion from CBF loans 2.00% . 67% of the loan book is floating rate 1.00% 0.64% 0.12% . 26% of deposits are non-interest bearing 0.00% 3Q15 4Q15 1Q16 2Q16 3Q16 4Q16 1Q17 2Q17 3Q17 4Q17 1Q18 2Q18 Fed Funds Rate Loan Yield Total Deposit Cost NII and NIM Linked-Quarter Change Drivers NIM Expansion and Loan Growth Drive NII Increase ($ in millions) ($ in millions) NII NIM $330 3.53% 3.60% 1Q18 - Reported $301.2 3.43% $310 3.50% Less: 1Q18 CBF Loan Accretion -$13.7 -16bps $290 3.40% 3.33% 1 $270 1Q18 - Core $287.4 3.27% 3.30% $250 Days +$2.3 — bp 3.20% $230 Loan Fees +$1.6 +2bps 3.10% $210 2.92% Other +$1.3 +4bps $190 3.00% 1 $292.6 3.33% $170 2.90% 2Q18 - Core 1Q17 2Q17 3Q17 4Q17 1Q18 2Q18 2Q18 CBF Loan Accretion +$18.3 +21bps NII (left axis) CBF Loan Accretion Impact 2Q18 - Reported $310.9 3.53% NIM (right axis) NIM - Core¹ Numbers may not add to total due to rounding. 1Core excludes the accretion from CBF’s loans, and is a Non-GAAP number reconciled in the table found on this slide. The average earning assets impact from CBF’s loan accretion was $166mm in 2Q18 and $179mm in 1Q18. 7

Building Higher Return Balance Sheet Economic Profit Focus Driving Improved Loan Portfolio Mix . Strong growth in highly profitable specialty lending areas, especially Loans to Mortgage Companies . Tennessee markets steady with solid growth in Middle-Tennessee . Capital Bank markets have strong post-conversion pipelines . Repositioning balance sheet by growing profitable relationships and products and exiting low relationship value loan portfolios . Strategic exit of ~$150mm of low relationship value loans YTD . Sale of ~$120mm (UPB) of sub-prime auto loans in 2Q18 Growth in Higher Return Areas1 Regional Bank Loan Growth 1 Private Client/Wealth Loans to Mortgage Companies $26.3B $26.0B $26.5B $2,355mm $2,974mm $2,840mm $1,785mm 1Q18 2Q18 1Q18 2Q18 Franchise Finance Healthcare $18.5B $18.8B $788mm $753mm $747mm $703mm 2Q17 3Q17 4Q17 1Q18 2Q18 1Q18 2Q18 1Q18 2Q18 UPB – Unpaid Principal Balance. LQ – Linked Quarter. Numbers may not add to total due to rounding. 1Amounts are based on period-end balances . 8

Asset Quality Stable Credit Trends Reflect Strong Underwriting Discipline . Credit quality environment remains stable Asset Quality Highlights . Net charge-offs at $2mm in 2Q18 ($ in millions) 2Q17 3Q17 4Q17 1Q18 2Q18 . 32% decline in criticized loans mainly from upgrade of ~$310mm of TRUPs loans Charge-offs ($10) ($11) ($17) ($8) ($10) . NPA decline 9% LQ Recoveries $7 $8 $9 $7 $8 . Non-strategic average loans declined 5% LQ, Net Charge-offs $3 $2 $8 $1 $2 20% YOY Provision/(Credit) ($2) $0 $3 ($1) $0 . Capital Bank credit performance as expected . Allowance to loans ratio at 67bps Allowance for Loan Losses Net Charge-Offs (NCOs) ($ in B) ($ in millions) $30 $28 $27 $28 180bps $12 0.40% $25 150bps $20 $20 $9 0.30% $20 120bps $6 0.20% $15 90bps 99bps 97bps $10 60bps $3 0.10% 69bps 69bps 67bps $5 30bps $0 0.00% $0 0bps 2Q17 3Q17 4Q17 1Q18 2Q18 ($3) (0.10%) 2Q17 3Q17 4Q17 1Q18 2Q18 Period-end Loans (Left Axis) ALLL to Loans Ratio (Right Axis) NCOs $ Provision $ NCO %¹ (Right Axis) LQ – Linked Quarter. YOY – Year over Year. Numbers may not add to total due to rounding. 1Net charge-off % is annualized and as % of average loans. 9

Well-Positioned For Consistent Top-Quartile Returns Strong Momentum and Current Tailwinds Are Positive ROTCE1 ROA Efficiency Ratio Below 60%2 17%-19%2 1.25%-1.45%2 75.9% 72.3% 17.4% 18.2% 65.1% 1.17% 1.22% 14.1% 62.2% 12.6% 0.95% 54.9% 54.9% 10.6% 0.87% 0.86% 2016 1Q18 2Q18 2016 1Q18 2Q18 2016 2Q18 2Q18 adj.¹ Reported Adjusted¹ Reported Adjusted¹ Regional Bank - Reported Consolidated Current Environment for Banking Industry Remains Favorable Macro . Continued solid GDP growth and low unemployment rate Trends . Low risk of near-term recession Credit . Credit quality remains stable and benign Environment Interest . Continued hikes in short term interest rates Rates . Increasing deposit competition 1ROTCE, Adjusted ROTCE, Adjusted ROA, and Adjusted Efficiency Ratio are non-GAAP numbers and are reconciled in the Appendix. 2Percentages represent medium-term targets. 10

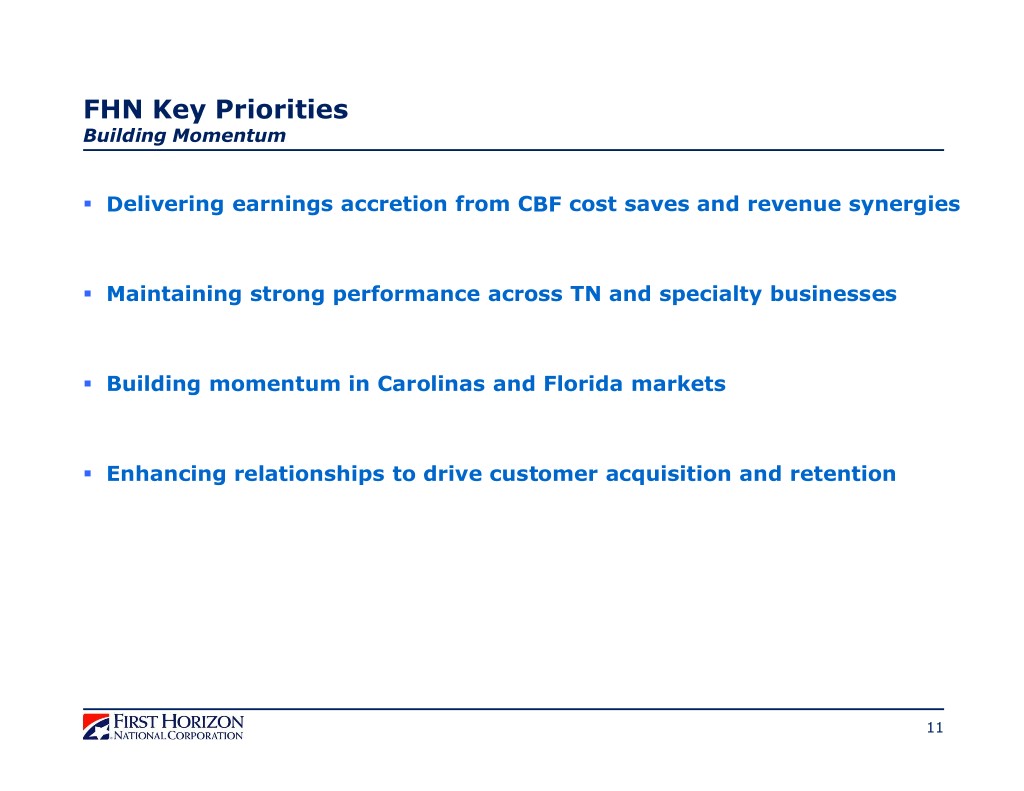
FHN Key Priorities Building Momentum . Delivering earnings accretion from CBF cost saves and revenue synergies . Maintaining strong performance across TN and specialty businesses . Building momentum in Carolinas and Florida markets . Enhancing relationships to drive customer acquisition and retention 11

APPENDIX 12

NOTABLE ITEMS Pre-Tax Pre-Tax 2017 2018 Amount1 Amount1 Acquisition Expense ($31.4mm) 1Q None Gain on property sale $3.3mm Mortgage Repurchase Reserve Release $20.0mm Acquisition Expense ($43.2mm) Acquisition Expense ($6.4mm) 2Q Effective tax rate adjustment associated with reversal of a capital loss deferred tax $19.5mm Other Expense (Visa Shares) ($4.1mm) valuation allowance1 Loss on equity securities repurchase ($14.3mm) Acquisition Expense ($8.2mm) Legal Matters ($8.2mm) 3Q Tax rate adjustments primarily associated with the reversal of a capital loss deferred $13.7mm tax valuation allowance and certain discrete period items1 Tax Reform-Related Adjustments1 ($82.0mm) Other Tax Adjustments1 $10.7mm 4Q Acquisition Expense ($46.7mm) Legal Matters ($32.1mm) Employee Bonuses ($9.9mm) 1All notable item amounts are calculated on a pre-tax basis with the exception of the tax adjustments in 2Q17, 3Q17, and 4Q17. 13

2Q18 Credit Quality Summary by Portfolio Regional BankingCorporate5 Non-Strategic FHNC Commercial Commercial HE & Permanent HE & Permanent ($ in millions) (C&I & CRE Other1 Subtotal (C&I & Other2 Total HELOC Mortgage HELOC Mortgage Other) Other) Period End Loans $16,020 $4,136 $5,734 $653 $26,543 $44 $419 $489 $201 $6 $27,702 30+ Delinquency % 0.15% 0.06% 0.51% 1.62% 0.25% 3.32% 0.00% 2.63% 2.28% 1.31% 0.31% Dollars $23 $3 $30 $11 $66 $1 $0 $13 $5 $0 $85 NPL3 % 0.10% 0.03% 0.57% 0.11% 0.19% 3.94% 0.71% 9.55% 11.08% 0.00% 0.45% Dollars $16 $1 $33 $1 $51 $2 $3 $47 $22 $0 $125 Net Charge-offs4 % 0.06% 0.01% NM 2.20% 0.09% NM NM NM NM NM 0.03% Dollars $2 $0 $0 $4 $6 NM $0 ($3) $0 $0 $2 Allowance $96 $34 $16 $11 $156 NM $1 $16 $12 $0 $185 Allowance / Loans % 0.60% 0.82% 0.27% 1.74% 0.59% NM 0.31% 3.28% 5.77% 1.11% 0.67% Allowance / Net Charge-offs 10.57x 55.04x NM 0.78x 7.04x NM NM NM NM NM 26.70x Numbers may not add to total due to rounding. Data as of 2Q18. NM - Not meaningful. 1Credit card, Permanent Mortgage, and Other. 2Credit card, OTC, and Other Consumer. 3Non-performing loan excludes held-for-sale loans. 4Net charge-offs are annualized. 14 5Exercised clean-up calls on jumbo securitizations in 1Q13, 3Q12, 2Q11, and 4Q10, which are now on the balance sheet in the Corporate segment.

Select C&I and CRE Portfolio Metrics 2Q18 Average Regional Bank Commercial Loans C&I: Loans to Mortgage Companies Energy, 1% ($ in billions) Correspondent, 2% Healthcare, 4% $2.4 Franchise Finance, 4% $2.1 $2.1 Corporate, 6% $2.0 $1.9 $1.9 $1.9 $1.8 $1.5 $1.6 $1.5 Loans to Mortgage $1.3 Commercial, 42% Companies, 10% Asset-Based Lending, 10% Commercial Real Estate, Specialty 1Q17 2Q17 3Q17 4Q17 1Q18 2Q18 16% Areas Business Banking, Period-end Balance Average Balance 5% CRE: Collateral Type CRE: Geographic Distribution Land, 2% Hospitality, 10% Other, 16% NC, 33% Multi-Family, 26% Other, 14% TX, 6% Industrial, SC, 7% Retail, 12% Office 20% Office, 15% FL, 15% TN, 18% 18% Data as of 2Q18. Numbers may not add to total due to rounding. 15

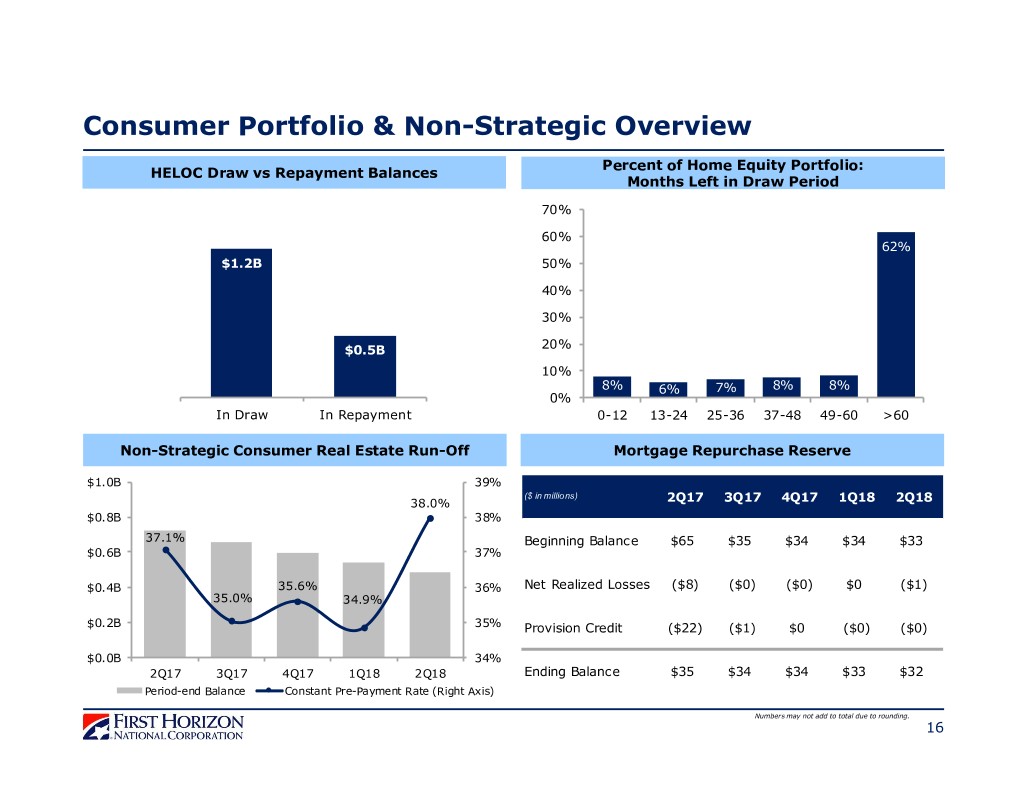
Consumer Portfolio & Non-Strategic Overview Percent of Home Equity Portfolio: HELOC Draw vs Repayment Balances Months Left in Draw Period 70% 60% 62% $1.2B 50% 40% 30% $0.5B 20% 10% 8% 6% 7% 8% 8% 0% In Draw In Repayment 0-12 13-24 25-36 37-48 49-60 >60 Non-Strategic Consumer Real Estate Run-Off Mortgage Repurchase Reserve $1.0B 39% ($ in millions) 38.0% 2Q17 3Q17 4Q17 1Q18 2Q18 $0.8B 38% 37.1% Beginning Balance $65 $35 $34 $34 $33 $0.6B 37% $0.4B 35.6% 36% Net Realized Losses ($8) ($0) ($0) $0 ($1) 35.0% 34.9% $0.2B 35% Provision Credit ($22) ($1) $0 ($0) ($0) $0.0B 34% 2Q17 3Q17 4Q17 1Q18 2Q18 Ending Balance $35 $34 $34 $33 $32 Period-end Balance Constant Pre-Payment Rate (Right Axis) Numbers may not add to total due to rounding. 16

Reconciliation to GAAP Financials Slides in this presentation use non-GAAP information of adjusted fee income, adjusted revenue, adjusted noninterest expense, adjusted pre-tax income, adjusted net income available to common, and adjusted earnings per share. That information is not presented according to generally accepted accounting principles (GAAP) and is reconciled to GAAP information below. % Change ($ in millions) 2Q18 1Q18 2Q17 LQ YOY Adjusted Fee Income & Revenue Revenue (GAAP) $438 $437 $328 0% 34% Fee Income (GAAP) $128 $136 $128 -6% 0% Plus: Notable Items (GAAP) $0 -$3 $0 Adjusted Fee Income (Non-GAAP) $128 $133 $128 -4% 0% Plus: Net Interest Income (GAAP) $311 $301 $201 Adjusted Revenue (Non-GAAP) $438 $434 $328 1% 34% Adjusted Noninterest Expense Noninterest Expense (GAAP) $333 $313 $218 6% 53% Plus: Notable Items (GAAP) -$47 -$31 $14 Adjusted Noninterest Expense (Non-GAAP) $285 $282 $232 1% 23% Adjusted Pre-Tax Income Pre-Tax Income (GAAP) $106 $125 $112 -15% -6% Plus: Notable Items (GAAP) $47 $28 -$14 Adjusted Pre-Tax Income (Non-GAAP) $153 $153 $99 0% 55% Adjusted Net Income Net Income (GAAP) $86 $95 $95 -9% -10% Plus: Tax-affected Notable Items (GAAP)1 $36 $21 -$28 Adjusted Net Income (Non-GAAP) $122 $116 $67 5% 81% Adjusted Net Income Available to Common (NIAC) & Earnings Per Share (EPS) Net Income Available to Common (GAAP) $82 $91 $91 -10% -10% Plus: Tax-affected Notable Items (GAAP)1 $36 $21 -$28 Adjusted Net Income Available to Common (Non-GAAP) (a) $118 $112 $63 5% 87% Average Common Diluted Shares (GAAP) 328 330 236 Adjusted Average Common Diluted Shares (Non-GAAP) (b) 328 330 236 Earnings Per Share (GAAP) $0.25 $0.27 $0.38 -7% -34% Adjusted Earnings Per Share (Non-GAAP) (a/b) $0.36 $0.34 $0.27 6% 33% Numbers may not add to total due to rounding. NM – Not Meaningful. 1Tax-affected notable items assume an effective tax rate of ~24% in 2Q18 and 1Q18, and ~39% in 2Q17. 17

Reconciliation to GAAP Financials Slides in this presentation use non-GAAP information of adjusted efficiency ratio, return on tangible common equity, adjusted return on tangible common equity, and adjusted return on average assets. That information is not presented according to generally accepted accounting principles (GAAP) and is reconciled to GAAP information below. Change ($ in millions) 2Q18 1Q18 2016 LQ Adjusted Efficiency Ratio Noninterest Expense (GAAP) (a) $333 $313 $925 Revenue Excluding Securities Gains (GAAP) (b) $438 $437 $1,280 Efficiency Ratio (GAAP) (a/b) 76% 72% 72% N/A Adjusted Noninterest Expense1 (Non-GAAP) (c) $285 $282 N/A Adjusted Revenue1 Excluding Securities Gains (Non-GAAP) (d) $438 $434 N/A Adjusted Efficiency Ratio (Non-GAAP) (c/d) 65% 65% N/A N/A Return on Tangible Common Equity (ROTCE) Average Total Equity (GAAP) $4,553 $4,574 $2,691 Less: Average Noncontrolling Interest (GAAP) -$295 -$295 -$295 Less: Average Preferred Stock (GAAP) -$96 -$96 -$96 Average Common Equity (GAAP) (e) $4,161 $4,183 $2,300 Less: Average Intangible Assets (GAAP) -$1,569 -$1,568 -$215 Average Tangible Common Equity (Non-GAAP) (f) $2,592 $2,615 $2,086 Annualized Net Income Available to Common (GAAP) (g) $327 $368 $221 Return on Average Common Equity (ROE) (GAAP) (g/e) 7.9% 8.8% 9.6% -92bps Return on Average Tangible Common Equity (ROTCE) (Non-GAAP) (g/f) 12.6% 14.1% 10.6% -143bps Adjusted Return on Tangible Common Equity (ROTCE) Annualized Adjusted Net Income Available to Common1 (Non-GAAP) (h) $473 $455 N/A Average Tangible Common Equity (Non-GAAP) (f) $2,592 $2,615 N/A Adjusted Return on Average Tangible Common Equity (ROTCE) (Non-GAAP) (h/f) 18.2% 17.4% N/A 85bps Adjusted Return on Average Assets (ROA) Annualized Net Income (GAAP) (i) $345 $385 $239 Average Total Assets (GAAP) (j) $40,174 $40,351 $27,427 Return on Average Assets (GAAP) (i/j) 0.86% 0.95% 0.87% -9bps Annualized Adjusted Net Income1 (Non-GAAP) (k) $490 $472 N/A Average Total Assets (GAAP) (l) $40,174 $40,351 N/A Adjusted Return on Average Assets (Non-GAAP) (k/l) 1.22% 1.17% N/A 5bps Numbers may not add to total due to rounding. N/A – Not Applicable. 1Adjusted Noninterest Expense, Adjusted Revenue, Adjusted Net Income Available to Common, and Adjusted Net Income are Non-GAAP numbers that are reconciled on the previous slide. 18
