Attached files
| file | filename |
|---|---|
| EX-99.1 - EXHIBIT 99.1 - EMMIS COMMUNICATIONS CORP | ex99107122018.htm |
| 8-K - 8-K - EMMIS COMMUNICATIONS CORP | emms8k07122018.htm |
Emmis Communications Annual Meeting of Shareholders July 12, 2018 10:00 a.m.

• Note: Certain statements in this presentation constitute “forward- looking statements” within the meaning of the Private Securities Litigation Reform Act of 1995. Such forward-looking statements involve known and unknown risks, uncertainties and other factors which may cause the actual results, performance or achievements of the Company to be materially different from any future results, performance or achievements expressed or implied by such forward-looking statements. Reference is made to the company’s Annual Report on Form 10-K and other public documents filed with the Securities and Exchange Commission for additional information concerning such risks and uncertainties. • Additional disclosure related to non-GAAP financial measures can be found under the Investors tab on our website, www.emmis.com. 2
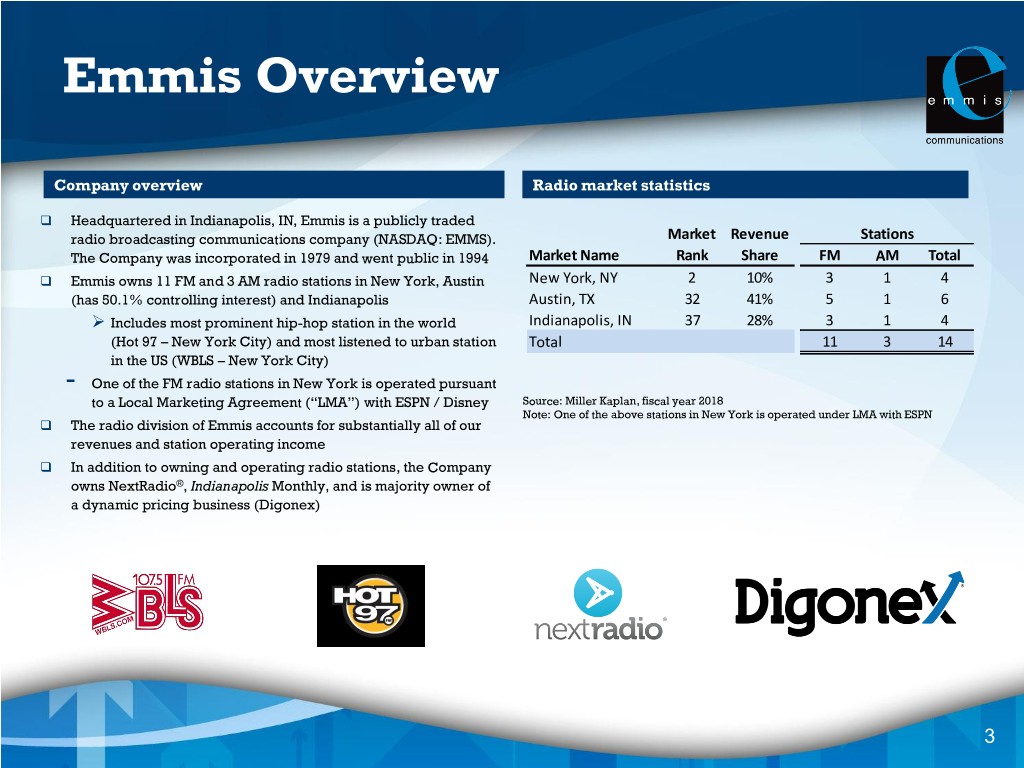
Emmis Overview Company overview Radio market statistics Headquartered in Indianapolis, IN, Emmis is a publicly traded radio broadcasting communications company (NASDAQ: EMMS). Market Revenue Stations The Company was incorporated in 1979 and went public in 1994 Market Name Rank Share FM AM Total Emmis owns 11 FM and 3 AM radio stations in New York, Austin New York, NY 2 10% 3 1 4 (has 50.1% controlling interest) and Indianapolis Austin, TX 32 41% 5 1 6 Includes most prominent hip-hop station in the world Indianapolis, IN 37 28% 3 1 4 (Hot 97 – New York City) and most listened to urban station Total 11 3 14 in the US (WBLS – New York City) - One of the FM radio stations in New York is operated pursuant to a Local Marketing Agreement (“LMA”) with ESPN / Disney Source: Miller Kaplan, fiscal year 2018 Note: One of the above stations in New York is operated under LMA with ESPN The radio division of Emmis accounts for substantially all of our revenues and station operating income In addition to owning and operating radio stations, the Company owns NextRadio®, Indianapolis Monthly, and is majority owner of a dynamic pricing business (Digonex) 3
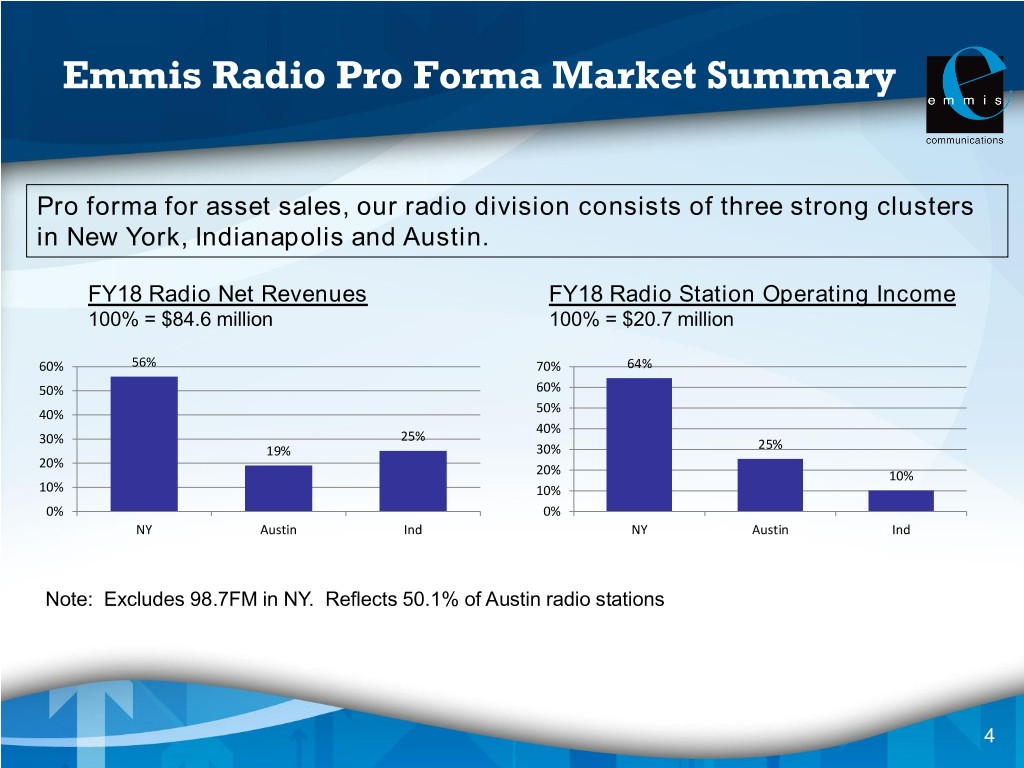
Emmis Radio Pro Forma Market Summary Pro forma for asset sales, our radio division consists of three strong clusters in New York, Indianapolis and Austin. FY18 Radio Net Revenues FY18 Radio Station Operating Income 100% = $84.6 million 100% = $20.7 million 60% 56% 70% 64% 50% 60% 40% 50% 40% 30% 25% 19% 30% 25% 20% 20% 10% 10% 10% 0% 0% NY Austin Ind NY Austin Ind Note: Excludes 98.7FM in NY. Reflects 50.1% of Austin radio stations 4
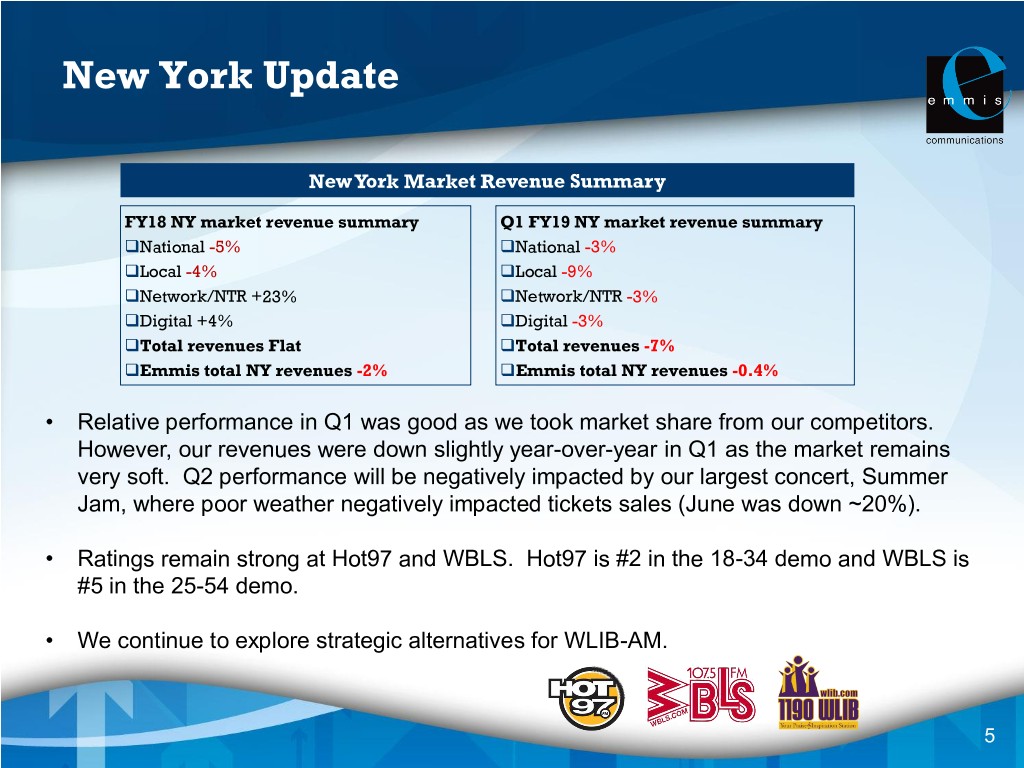
New York Update New York Market Revenue Summary FY18 NY market revenue summary Q1 FY19 NY market revenue summary National -5% National -3% Local -4% Local -9% Network/NTR +23% Network/NTR -3% Digital +4% Digital -3% Total revenues Flat Total revenues -7% Emmis total NY revenues -2% Emmis total NY revenues -0.4% • Relative performance in Q1 was good as we took market share from our competitors. However, our revenues were down slightly year-over-year in Q1 as the market remains very soft. Q2 performance will be negatively impacted by our largest concert, Summer Jam, where poor weather negatively impacted tickets sales (June was down ~20%). • Ratings remain strong at Hot97 and WBLS. Hot97 is #2 in the 18-34 demo and WBLS is #5 in the 25-54 demo. • We continue to explore strategic alternatives for WLIB-AM. 5
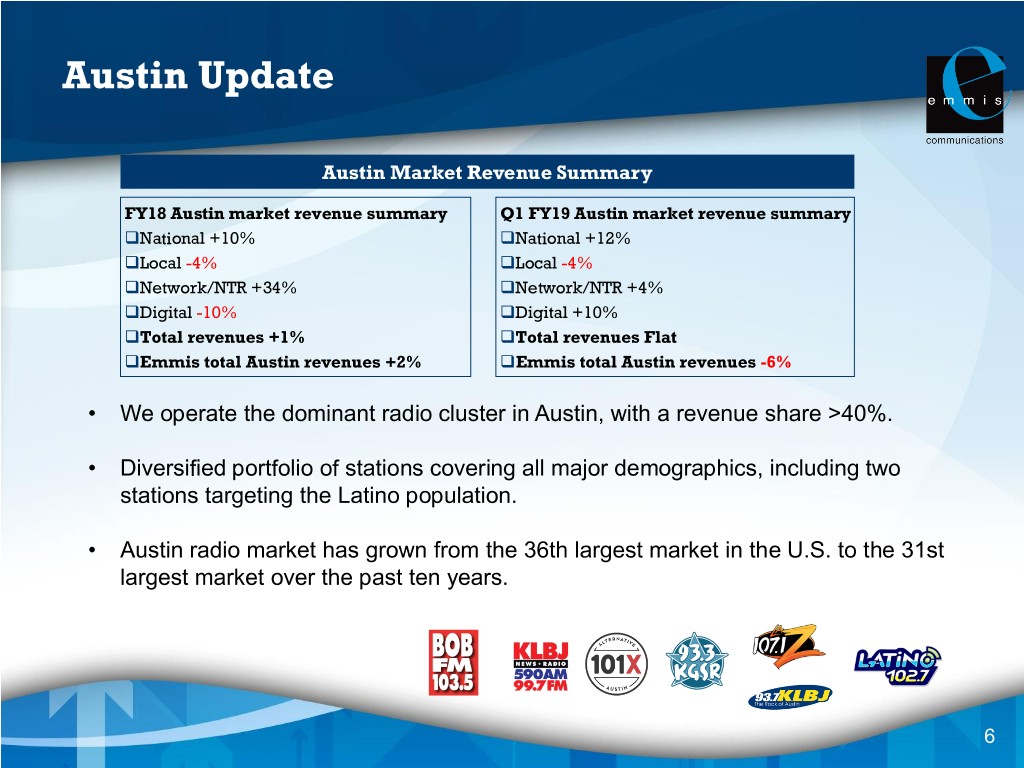
Austin Update Austin Market Revenue Summary FY18 Austin market revenue summary Q1 FY19 Austin market revenue summary National +10% National +12% Local -4% Local -4% Network/NTR +34% Network/NTR +4% Digital -10% Digital +10% Total revenues +1% Total revenues Flat Emmis total Austin revenues +2% Emmis total Austin revenues -6% • We operate the dominant radio cluster in Austin, with a revenue share >40%. • Diversified portfolio of stations covering all major demographics, including two stations targeting the Latino population. • Austin radio market has grown from the 36th largest market in the U.S. to the 31st largest market over the past ten years. 6

Indianapolis Update Indianapolis Market Revenue Summary FY18 Indy market revenue summary Q1 FY19 Indy market revenue summary National +1% National +2% Local -6% Local -9% Network/NTR +7% Network/NTR +7% Digital -12% Digital +20% Total revenues -3% Total revenues -4% Emmis total Indy revenues -13% Emmis total Indy revenues -7% • Strong cluster that captures about 28% of market revenues. • Ratings challenges at our country station and soft rock station negatively impacted revenues in FY18 and early in FY19. • These ratings have rebounded nicely and we expect much better performance in the back half of the current fiscal year. 7
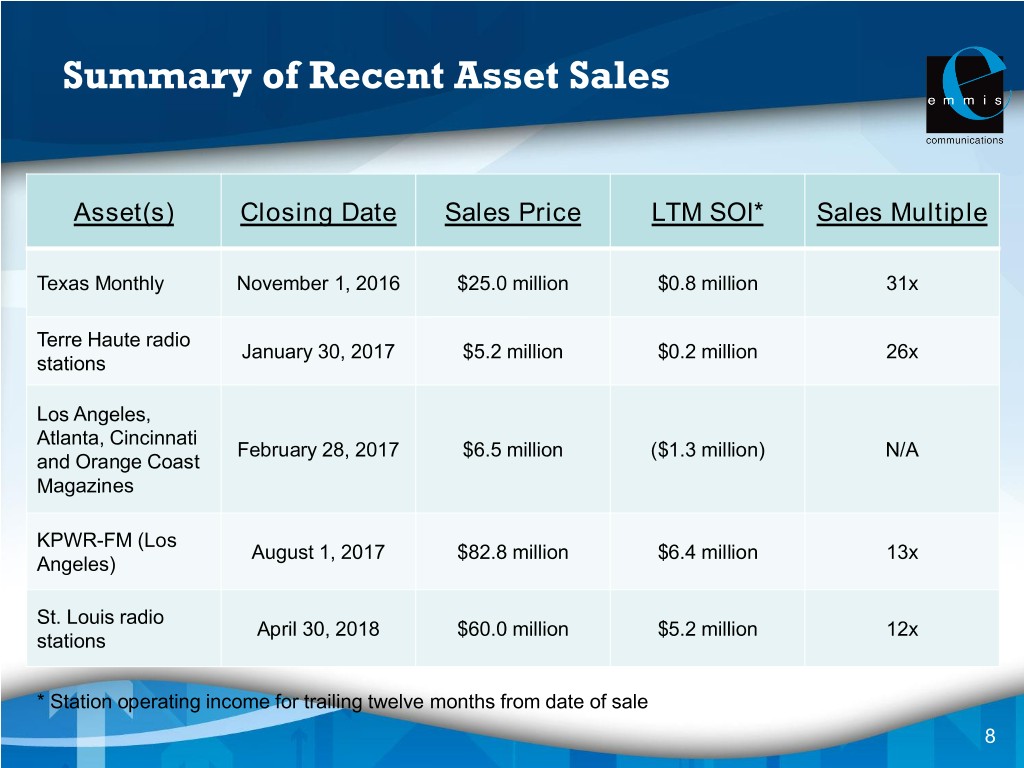
Summary of Recent Asset Sales Asset(s) Closing Date Sales Price LTM SOI* Sales Multiple Texas Monthly November 1, 2016 $25.0 million $0.8 million 31x Terre Haute radio January 30, 2017 $5.2 million $0.2 million 26x stations Los Angeles, Atlanta, Cincinnati February 28, 2017 $6.5 million ($1.3 million) N/A and Orange Coast Magazines KPWR-FM (Los August 1, 2017 $82.8 million $6.4 million 13x Angeles) St. Louis radio April 30, 2018 $60.0 million $5.2 million 12x stations * Station operating income for trailing twelve months from date of sale 8
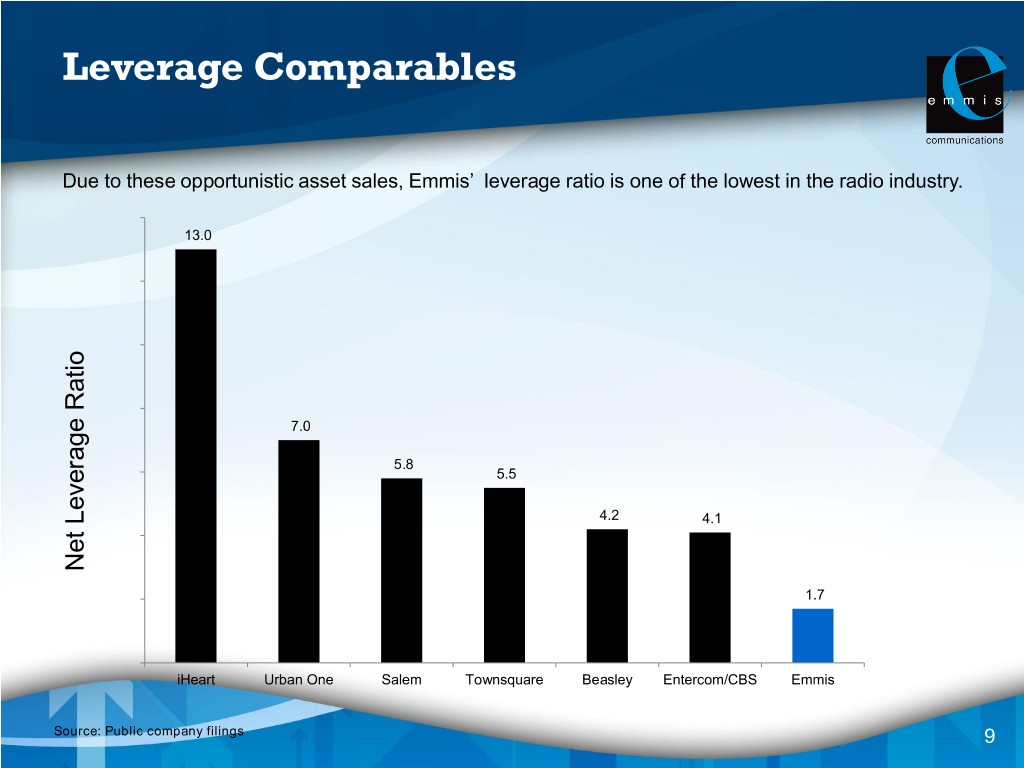
Leverage Comparables Due to these opportunistic asset sales, Emmis’ leverage ratio is one of the lowest in the radio industry. 13.0 7.0 5.8 5.5 4.2 4.1 Net Leverage Ratio Leverage Net 1.7 iHeart Urban One Salem Townsquare Beasley Entercom/CBS Emmis Source: Public company filings 9
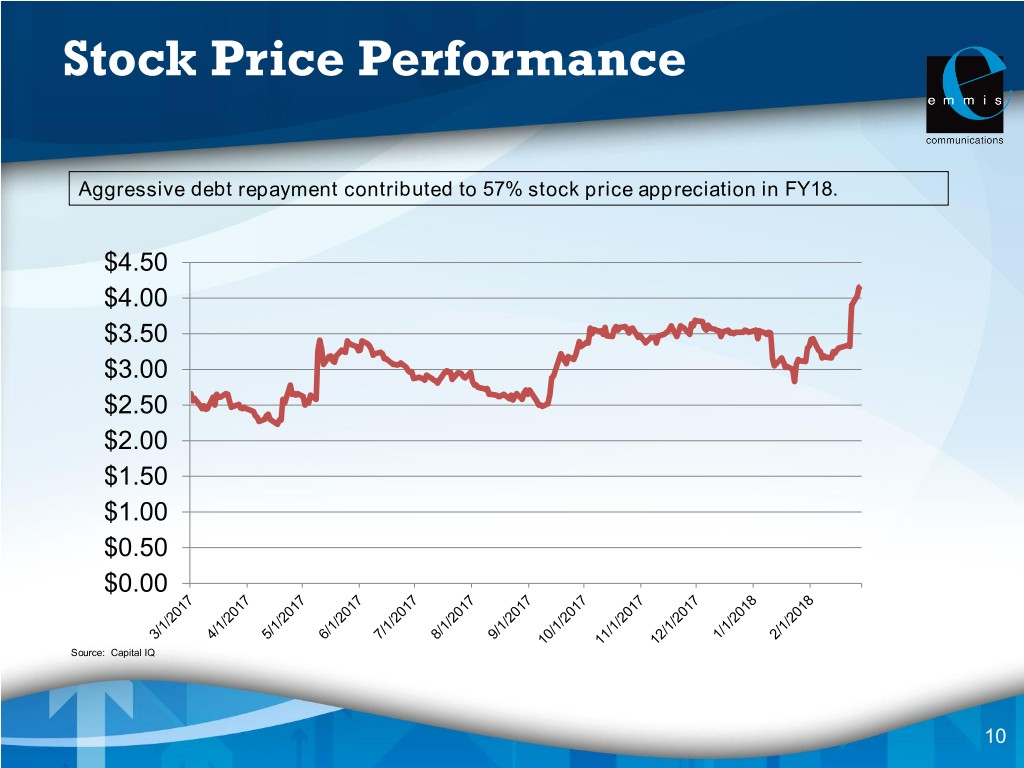
Stock Price Performance Aggressive debt repayment contributed to 57% stock price appreciation in FY18. $4.50 $4.00 $3.50 $3.00 $2.50 $2.00 $1.50 $1.00 $0.50 $0.00 Source: Capital IQ 10
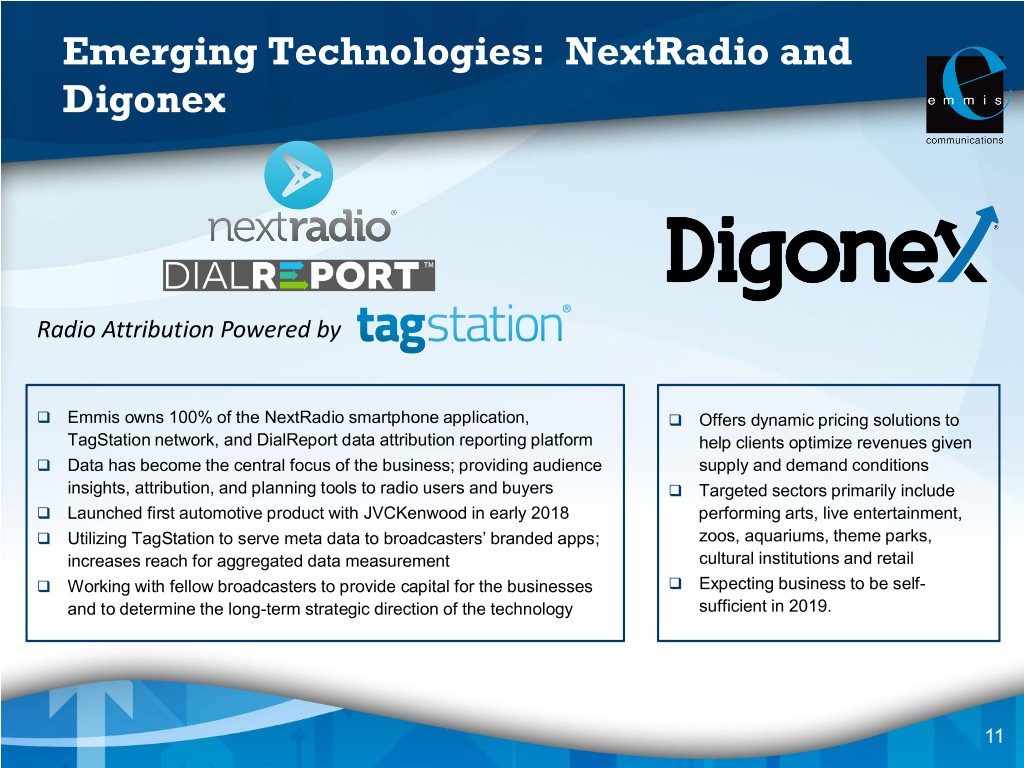
Emerging Technologies: NextRadio and Digonex Radio Attribution Powered by Emmis owns 100% of the NextRadio smartphone application, Offers dynamic pricing solutions to TagStation network, and DialReport data attribution reporting platform help clients optimize revenues given Data has become the central focus of the business; providing audience supply and demand conditions insights, attribution, and planning tools to radio users and buyers Targeted sectors primarily include Launched first automotive product with JVCKenwood in early 2018 performing arts, live entertainment, Utilizing TagStation to serve meta data to broadcasters’ branded apps; zoos, aquariums, theme parks, increases reach for aggregated data measurement cultural institutions and retail Working with fellow broadcasters to provide capital for the businesses Expecting business to be self- and to determine the long-term strategic direction of the technology sufficient in 2019. 11
Strategic Priorities in FY19 Pursue businesses that exhibit strong long-term growth characteristics • Targeting businesses both inside and outside traditional media where we can leverage our organizational strengths Opportunistically dispose of assets when it makes sense for shareholders • History of disciplined, highly-accretive dispositions • Source of capital for acquisitions of new businesses Significantly reduce or eliminate the cash burn of our emerging technologies 12
Emmis Communications Annual Meeting of Shareholders July 12, 2018 10:00 a.m.
