Attached files
| file | filename |
|---|---|
| EX-99.3 - EX-99.3 - Broadcom Inc. | d431012dex993.htm |
| EX-99.1 - EX-99.1 - Broadcom Inc. | d431012dex991.htm |
| EX-2.1 - EX-2.1 - Broadcom Inc. | d431012dex21.htm |
| 8-K - 8-K - Broadcom Inc. | d431012d8k.htm |
Broadcom to Acquire CA Technologies July 11, 2018 Exhibit 99.2
Cautionary Note Regarding Forward-Looking Statements This presentation contains forward-looking statements (including within the meaning of Section 21E of the United States Securities Exchange Act of 1934, as amended, and Section 27A of the United States Securities Act of 1933, as amended) concerning Broadcom and CA. These statements include, but are not limited to, statements regarding the expected completion and timing of the proposed transaction, expected benefits and costs of the proposed transaction, and management plans relating to the proposed transaction, and statements that address each company’s expected future business and financial performance and other statements identified by words such as “will”, “expect”, “believe”, “anticipate”, “estimate”, “should”, “intend”, “plan”, “potential”, “predict” “project”, “aim”, and similar words, phrases or expressions. These forward-looking statements are based on current expectations and beliefs of the management of Broadcom and CA (as the case may be), as well as assumptions made by, and information currently available to, such management, current market trends and market conditions and involve risks and uncertainties, many of which are outside of each company’s and each company’s management’s control, and which may cause actual results to differ materially from those contained in forward-looking statements. Accordingly, you should not place undue reliance on such statements. Those risks, uncertainties and assumptions include: the risk that the proposed transaction may not be completed in a timely manner or at all, which may adversely affect Broadcom’s and CA’s business and the price of the common stock of Broadcom and CA; the failure to satisfy any of the conditions to the consummation of the proposed transaction, including the adoption of the Merger Agreement by the stockholders of CA and the receipt of certain regulatory approvals; the occurrence of any event, change or other circumstance that could give rise to the termination of the Merger Agreement; the effect of the presentation or pendency of the proposed transaction on Broadcom’s and CA’s business relationships, operating results and business generally; risks that the proposed transaction disrupts current plans and operations and the potential difficulties in employee retention as a result of the proposed transaction; risks related to diverting management’s attention from ongoing business operations; the outcome of any legal proceedings that may be instituted related to the Merger Agreement or the proposed transaction; unexpected costs, charges or expenses resulting from the proposed transaction; the ability of Broadcom to achieve its plans, forecasts and other expectations with respect to CA’s business after completion of the proposed transaction; and other risks described in CA’s filings and Broadcom’s and its predecessors’ filings with the United States Securities and Exchange Commission, such as Quarterly Reports on Form 10-Q and Annual Reports on Form 10-K. Other particular uncertainties that could materially affect future results include risks associated with: any loss of Broadcom’s or CA’s significant customers and fluctuations in the timing and volume of significant customer demand; Broadcom’s dependence on contract manufacturing and outsourced supply chain; Broadcom’s dependency on a limited number of suppliers; any other acquisitions Broadcom may make, such as delays, challenges and expenses associated with receiving governmental and regulatory approvals and satisfying other closing conditions, and with integrating acquired companies with Broadcom’s existing businesses and Broadcom’s ability to achieve the benefits, growth prospects and synergies expected by such acquisitions; Broadcom’s ability to accurately estimate customers’ demand and adjust its manufacturing and supply chain accordingly; Broadcom’s significant indebtedness, including the additional significant indebtedness that Broadcom expects to incur in connection with the proposed transaction and the need to generate sufficient cash flows to service and repay such debt; dependence on a small number of markets and the rate of growth in these markets; dependence on and risks associated with distributors of Broadcom products; dependence on senior management; quarterly and annual fluctuations in operating results; global economic conditions and concerns; the amount and frequency of Broadcom stock repurchases; cyclicality in the semiconductor or enterprise software industry or in target markets; Broadcom’s competitive performance and ability to continue achieving design wins with its customers, as well as the timing of any design wins; prolonged disruptions of Broadcom’s or its contract manufacturers’ manufacturing facilities or other significant operations; Broadcom’s ability to improve its manufacturing efficiency and quality; Broadcom’s dependence on outsourced service providers for certain key business services and their ability to execute to Broadcom’s requirements; Broadcom’s ability to maintain or improve gross margin; each of Broadcom’s and CA’s ability to protect its respective intellectual property and the unpredictability of any associated litigation expenses; any expenses or reputational damage associated with resolving customer product warranty and indemnification claims; Broadcom’s and CA’s ability to sell to new types of customers and to keep pace with technological advances; market acceptance of the end products into which Broadcom’s and CA’s products are designed; Broadcom’s overall cash tax costs, legislation that may impact its overall cash tax costs and its ability to maintain tax concessions in certain jurisdictions; and other events and trends on a national, regional and global scale, including those of a political, economic, business, competitive and regulatory nature. Forward-looking statements speak only as of the date of this communication. Neither Broadcom nor CA undertake any intent or obligation to publicly update or revise any of the estimates and other forward-looking statements made in this presentation, whether as a result of new information, future events or otherwise, except as required by law. Non-GAAP Financial Measures In addition to GAAP reporting, Broadcom provides investors with net revenue, net income, operating income, gross margin, operating expenses and other data on a non-GAAP basis. This non-GAAP information includes the effect, where applicable, of purchase accounting on revenue, and excludes amortization of acquisition-related intangible assets, stock-based compensation expense, restructuring, impairment and disposal charges, acquisition-related costs, including integration costs, purchase accounting effect on inventory, litigation settlements, debt-related costs, gain (loss) on extinguishment of debt, gain (loss) on dispositions of acquisition-related assets, income (loss) from discontinued operations and non-GAAP tax reconciling adjustments. Management does not believe that these items are reflective of the Company’s underlying performance. The exclusion of these and other similar items from Broadcom’s non-GAAP financial results should not be interpreted as implying that these items are non-recurring, infrequent or unusual. Broadcom believes this non-GAAP financial information provides additional insight into the Company’s on-going performance and has therefore chosen to provide this information to investors for a more consistent basis of comparison and to help them evaluate the results of the Company’s on-going operations and enable more meaningful period to period comparisons. These non-GAAP measures are provided in addition to, and not as a substitute for, or superior to, measures of financial performance prepared in accordance with GAAP. Broadcom is not readily able to provide a reconciliation of the projected non-GAAP financial information presented herein to the relevant projected GAAP measures without unreasonable effort. A reconciliation of non-GAAP to GAAP historical financial data is available in the Investor Center on the Broadcom website. Important Information
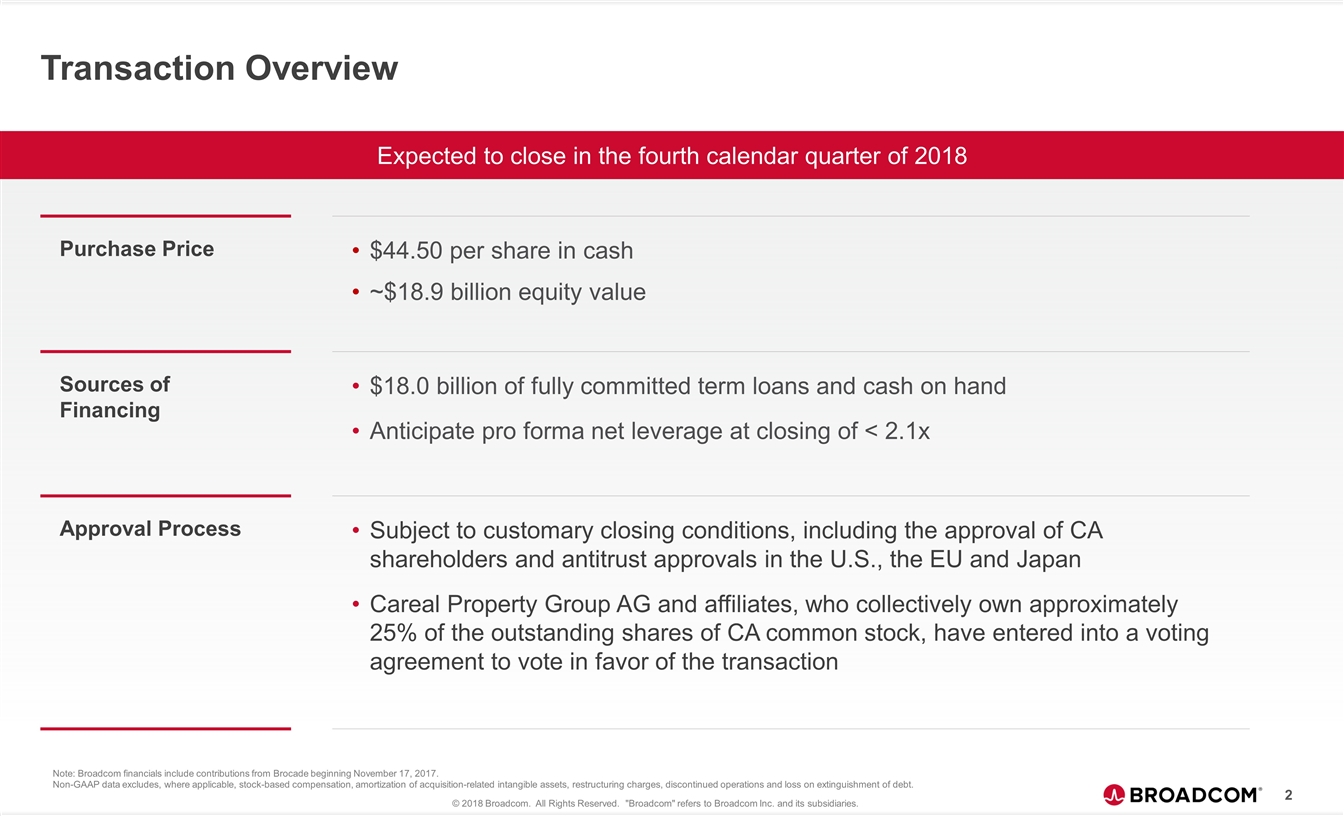
Transaction Overview Purchase Price $44.50 per share in cash ~$18.9 billion equity value Sources of Financing $18.0 billion of fully committed term loans and cash on hand Anticipate pro forma net leverage at closing of < 2.1x Approval Process Subject to customary closing conditions, including the approval of CA shareholders and antitrust approvals in the U.S., the EU and Japan Careal Property Group AG and affiliates, who collectively own approximately 25% of the outstanding shares of CA common stock, have entered into a voting agreement to vote in favor of the transaction Note: Broadcom financials include contributions from Brocade beginning November 17, 2017. Non-GAAP data excludes, where applicable, stock-based compensation, amortization of acquisition-related intangible assets, restructuring charges, discontinued operations and loss on extinguishment of debt. Expected to close in the fourth calendar quarter of 2018
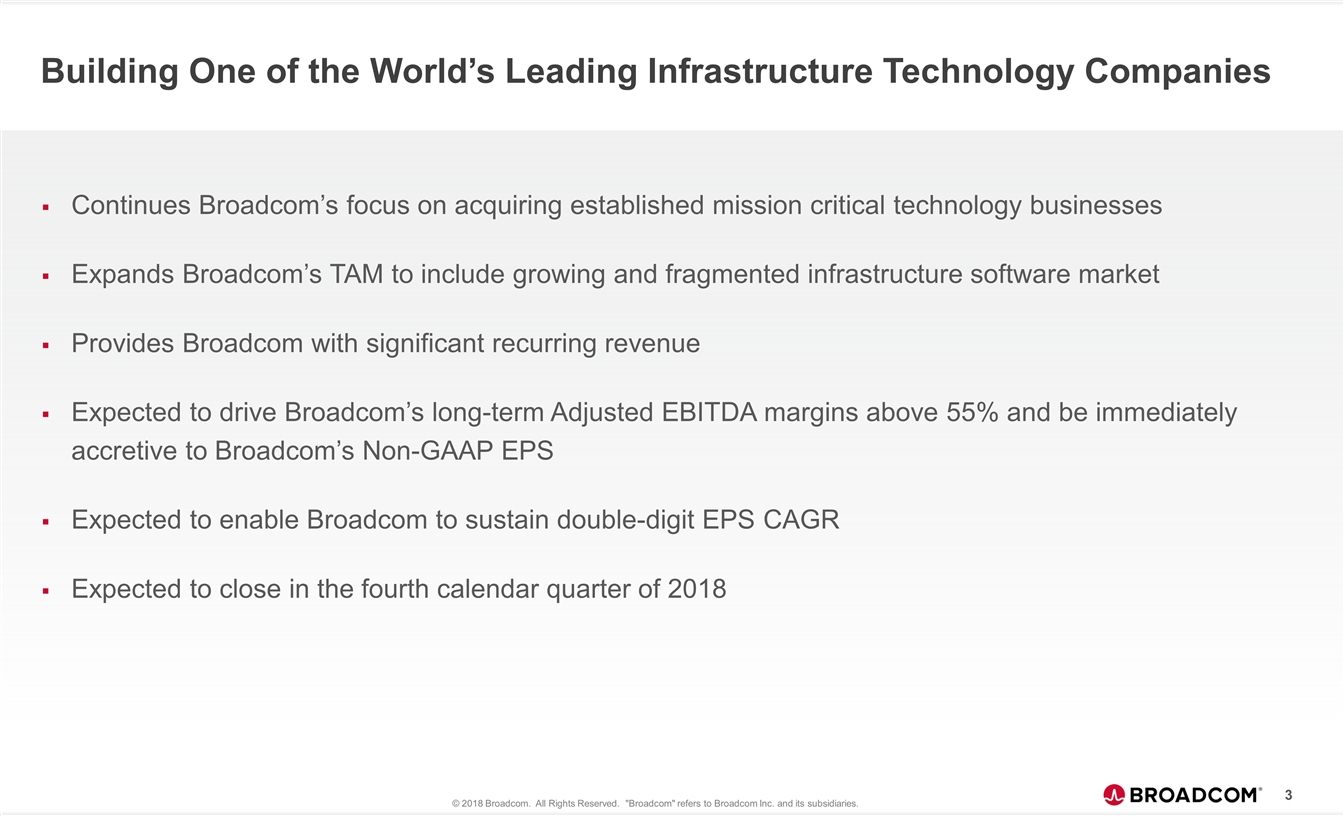
Continues Broadcom’s focus on acquiring established mission critical technology businesses Expands Broadcom’s TAM to include growing and fragmented infrastructure software market Provides Broadcom with significant recurring revenue Expected to drive Broadcom’s long-term Adjusted EBITDA margins above 55% and be immediately accretive to Broadcom’s Non-GAAP EPS Expected to enable Broadcom to sustain double-digit EPS CAGR Expected to close in the fourth calendar quarter of 2018 Building One of the World’s Leading Infrastructure Technology Companies
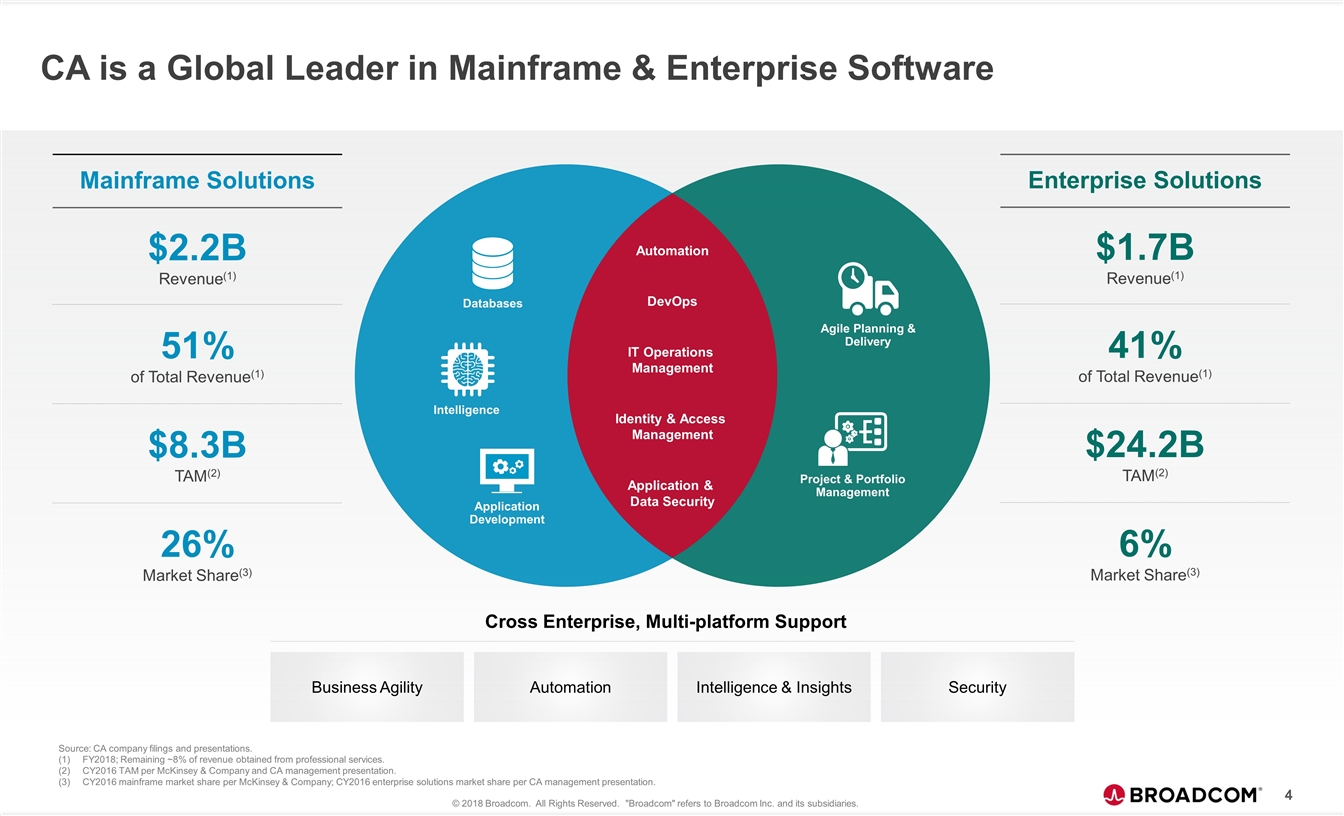
CA is a Global Leader in Mainframe & Enterprise Software Databases Intelligence Application Development Agile Planning & Delivery Project & Portfolio Management Automation DevOps IT Operations Management Identity & Access Management Application & Data Security Mainframe Solutions $2.2B Revenue(1) 51% of Total Revenue(1) $8.3B TAM(2) 26% Market Share(3) Enterprise Solutions $1.7B Revenue(1) 41% of Total Revenue(1) $24.2B TAM(2) 6% Market Share(3) Source: CA company filings and presentations. FY2018; Remaining ~8% of revenue obtained from professional services. CY2016 TAM per McKinsey & Company and CA management presentation. CY2016 mainframe market share per McKinsey & Company; CY2016 enterprise solutions market share per CA management presentation. Business Agility Automation Intelligence & Insights Security Cross Enterprise, Multi-platform Support
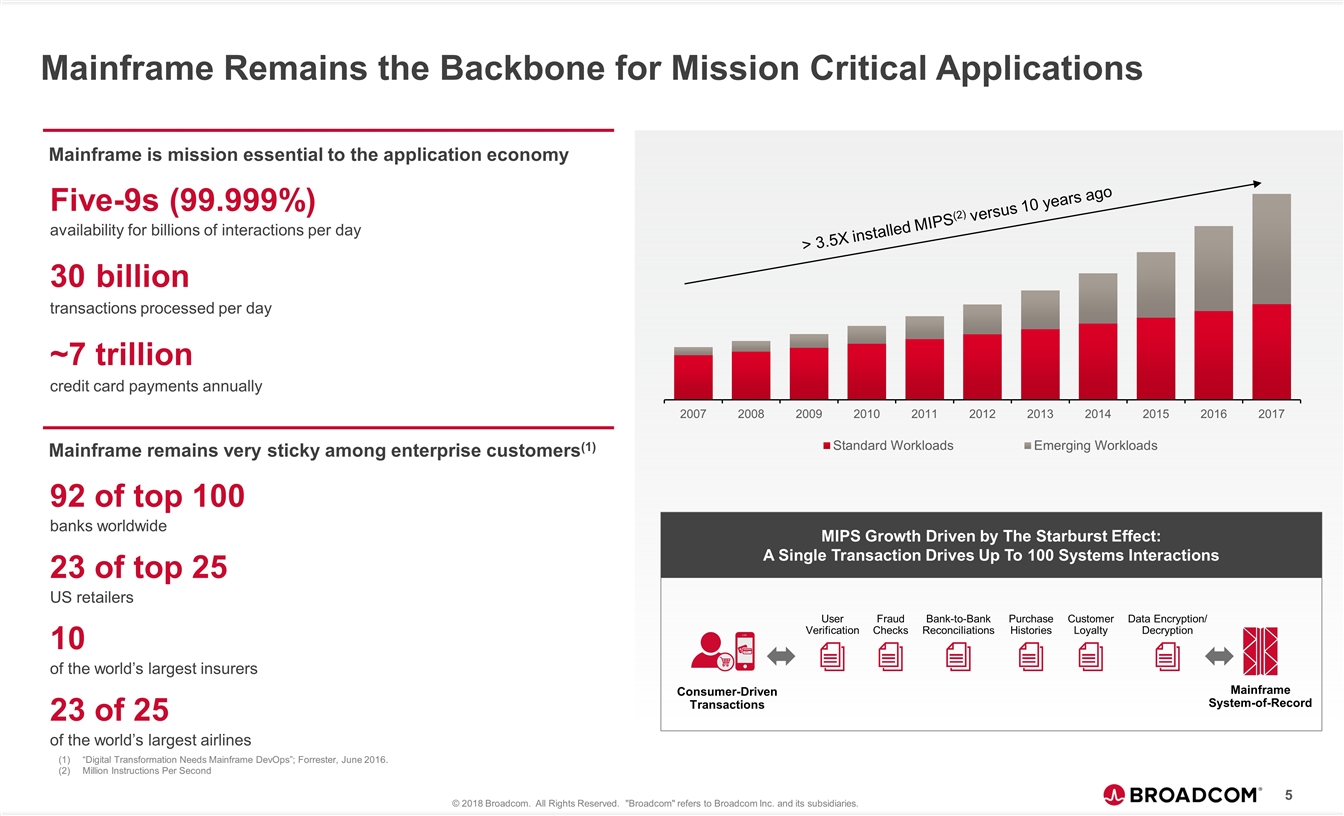
Mainframe is mission essential to the application economy Five-9s (99.999%) availability for billions of interactions per day 30 billion transactions processed per day ~7 trillion credit card payments annually Mainframe Remains the Backbone for Mission Critical Applications Mainframe remains very sticky among enterprise customers(1) 92 of top 100 banks worldwide 23 of top 25 US retailers 10 of the world’s largest insurers 23 of 25 of the world’s largest airlines Consumer-Driven Transactions User Verification Fraud Checks Bank-to-Bank Reconciliations Purchase Histories Customer Loyalty Mainframe System-of-Record Data Encryption/ Decryption > 3.5X installed MIPS(2) versus 10 years ago MIPS Growth Driven by The Starburst Effect: A Single Transaction Drives Up To 100 Systems Interactions “Digital Transformation Needs Mainframe DevOps”; Forrester, June 2016. Million Instructions Per Second
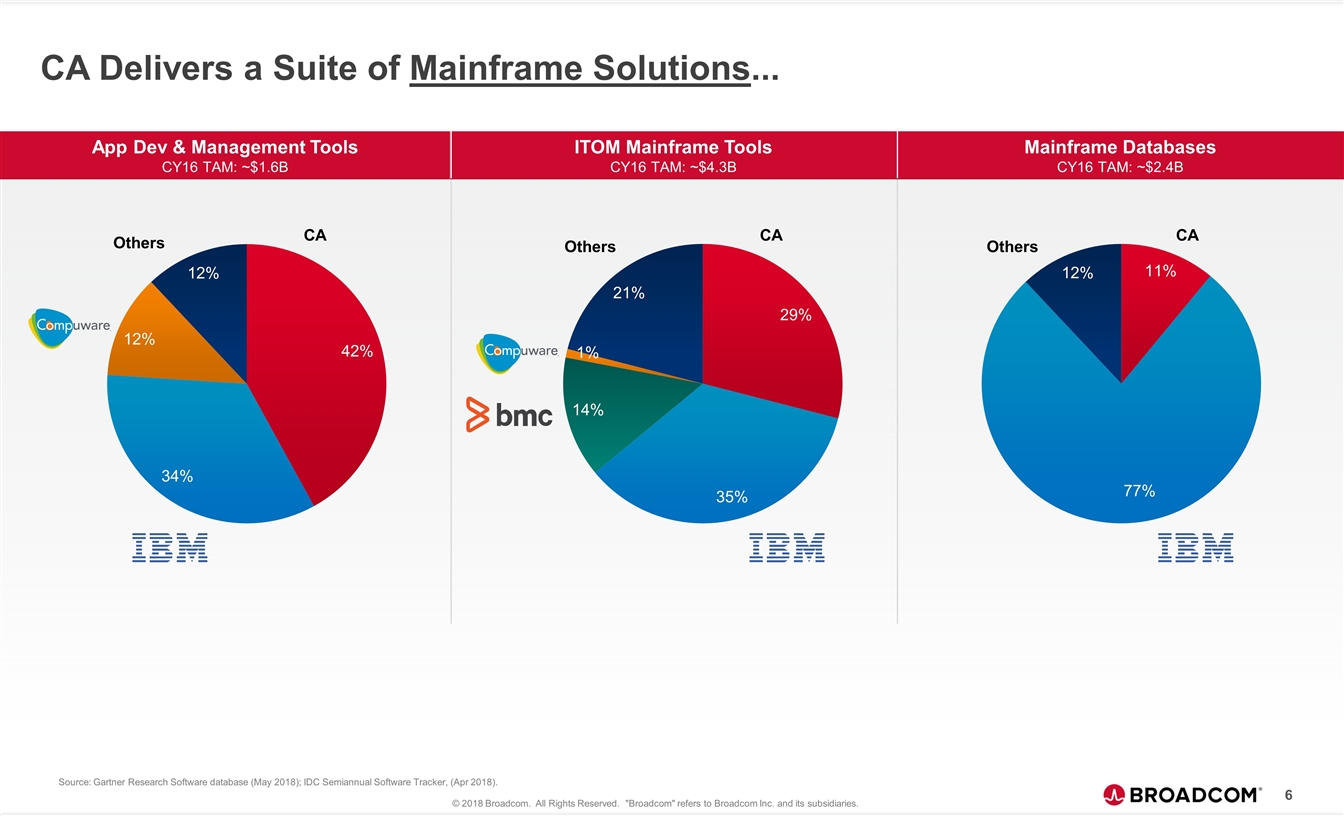
CA Delivers a Suite of Mainframe Solutions... CA CA CA Others Others Others Source: Gartner Research Software database (May 2018); IDC Semiannual Software Tracker, (Apr 2018). Mainframe Databases CY16 TAM: ~$2.4B ITOM Mainframe Tools CY16 TAM: ~$4.3B App Dev & Management Tools CY16 TAM: ~$1.6B
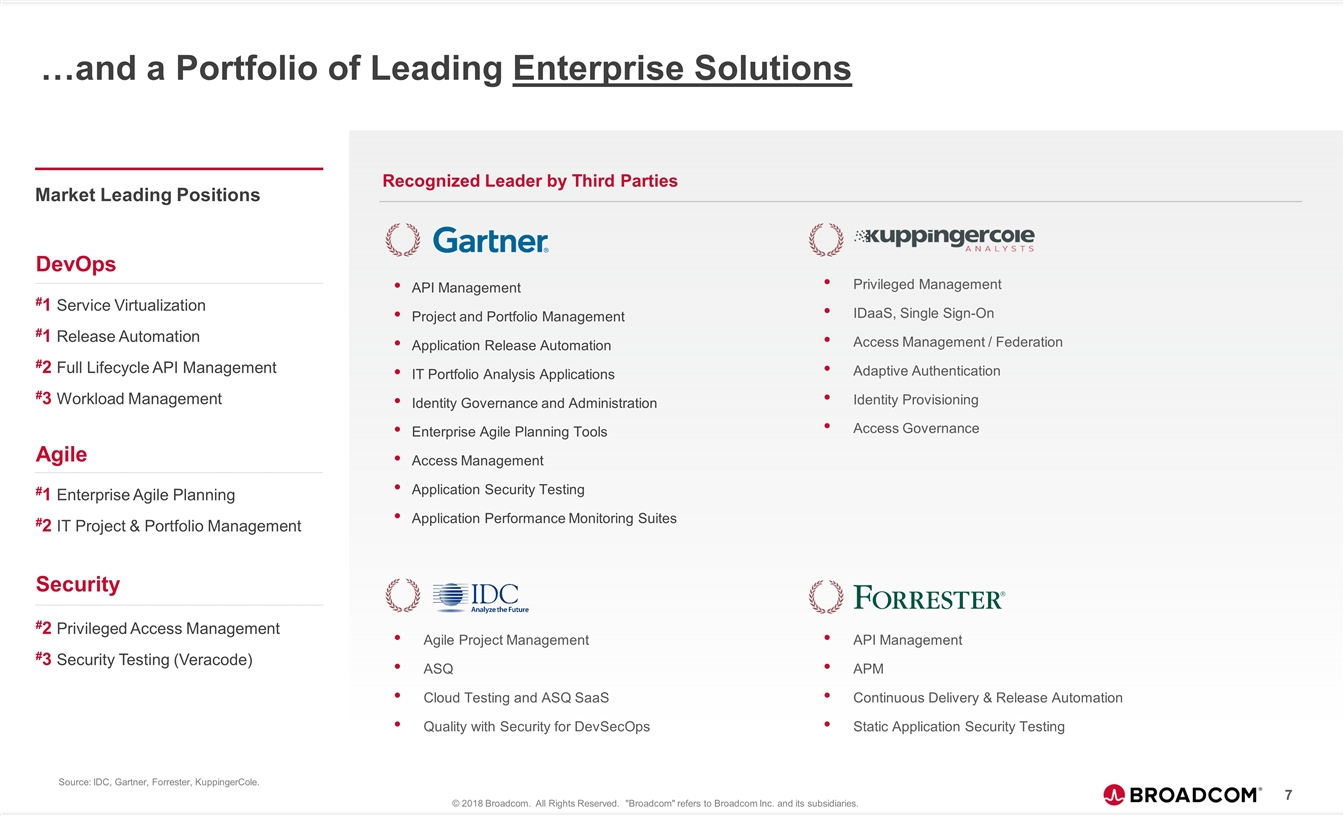
…and a Portfolio of Leading Enterprise Solutions DevOps API Management APM Continuous Delivery & Release Automation Static Application Security Testing Privileged Management IDaaS, Single Sign-On Access Management / Federation Adaptive Authentication Identity Provisioning Access Governance Agile Project Management ASQ Cloud Testing and ASQ SaaS Quality with Security for DevSecOps Market Leading Positions Agile Security #1 Service Virtualization #1 Release Automation #2 Full Lifecycle API Management #3 Workload Management #1 Enterprise Agile Planning #2 IT Project & Portfolio Management #2 Privileged Access Management #3 Security Testing (Veracode) API Management Project and Portfolio Management Application Release Automation IT Portfolio Analysis Applications Identity Governance and Administration Enterprise Agile Planning Tools Access Management Application Security Testing Application Performance Monitoring Suites Recognized Leader by Third Parties Source: IDC, Gartner, Forrester, KuppingerCole.
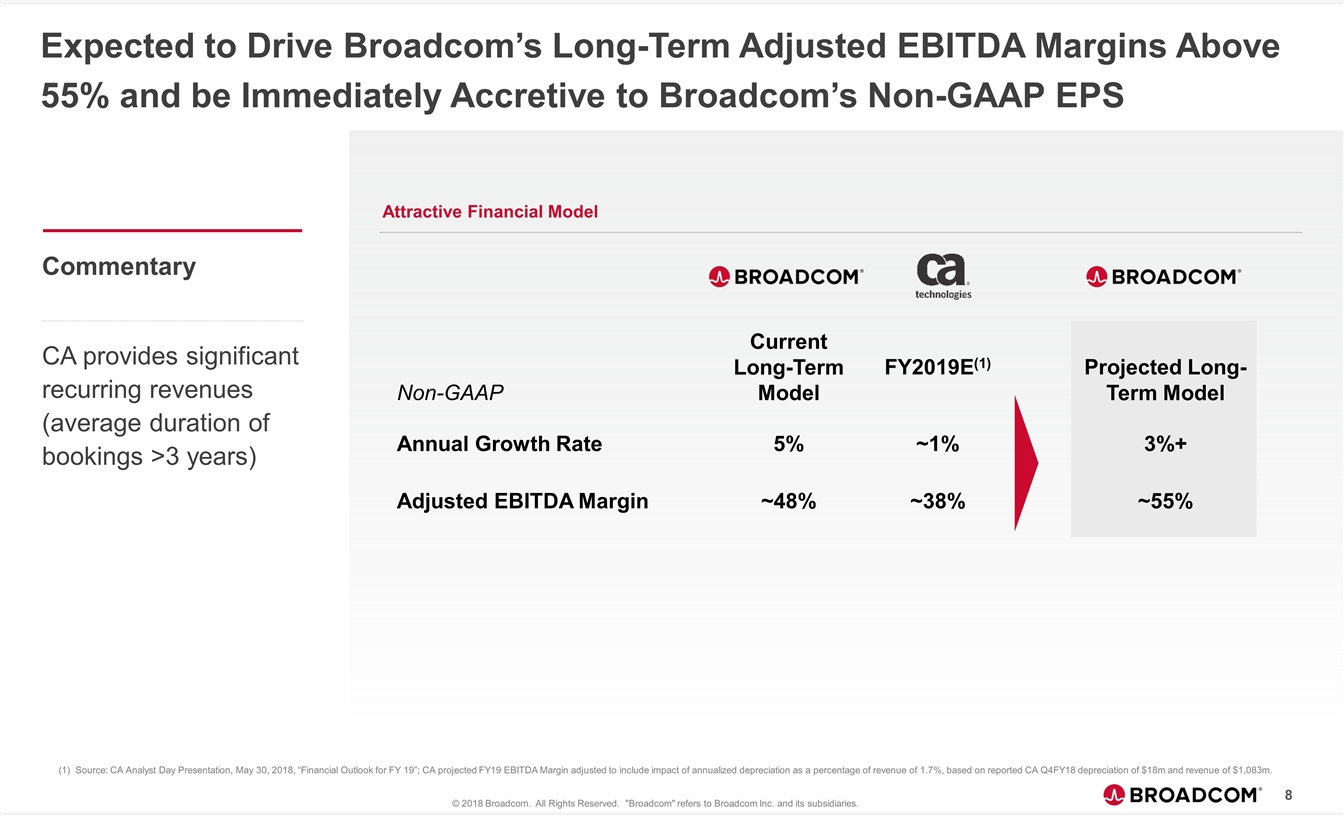
Non-GAAP Current Long-Term Model FY2019E(1) Projected Long-Term Model Annual Growth Rate 5% ~1% 3%+ Adjusted EBITDA Margin ~48% ~38% ~55% Expected to Drive Broadcom’s Long-Term Adjusted EBITDA Margins Above 55% and be Immediately Accretive to Broadcom’s Non-GAAP EPS 8 Attractive Financial Model Commentary CA provides significant recurring revenues (average duration of bookings >3 years) (1) Source: CA Analyst Day Presentation, May 30, 2018, “Financial Outlook for FY 19”; CA projected FY19 EBITDA Margin adjusted to include impact of annualized depreciation as a percentage of revenue of 1.7%, based on reported CA Q4FY18 depreciation of $18m and revenue of $1,083m.
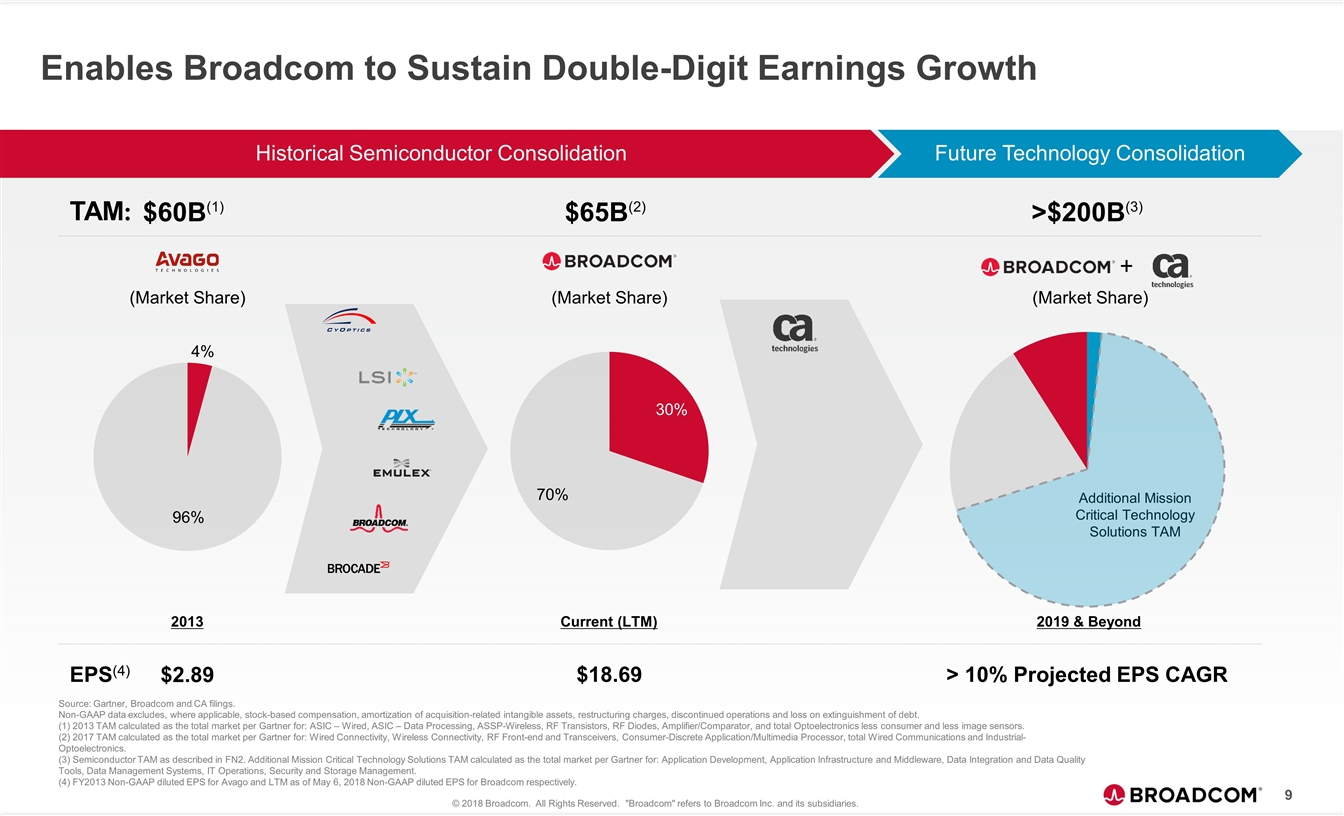
Enables Broadcom to Sustain Double-Digit Earnings Growth 9 Historical Semiconductor Consolidation Future Technology Consolidation $60B(1) $65B(2) >$200B(3) TAM: 2013 Current (LTM) Additional Mission Critical Technology Solutions TAM (Market Share) (Market Share) EPS(4) $2.89 $18.69 2019 & Beyond > 10% Projected EPS CAGR Source: Gartner, Broadcom and CA filings. Non-GAAP data excludes, where applicable, stock-based compensation, amortization of acquisition-related intangible assets, restructuring charges, discontinued operations and loss on extinguishment of debt. (1) 2013 TAM calculated as the total market per Gartner for: ASIC – Wired, ASIC – Data Processing, ASSP-Wireless, RF Transistors, RF Diodes, Amplifier/Comparator, and total Optoelectronics less consumer and less image sensors. (2) 2017 TAM calculated as the total market per Gartner for: Wired Connectivity, Wireless Connectivity, RF Front-end and Transceivers, Consumer-Discrete Application/Multimedia Processor, total Wired Communications and Industrial-Optoelectronics. (3) Semiconductor TAM as described in FN2. Additional Mission Critical Technology Solutions TAM calculated as the total market per Gartner for: Application Development, Application Infrastructure and Middleware, Data Integration and Data Quality Tools, Data Management Systems, IT Operations, Security and Storage Management. (4) FY2013 Non-GAAP diluted EPS for Avago and LTM as of May 6, 2018 Non-GAAP diluted EPS for Broadcom respectively. + (Market Share)
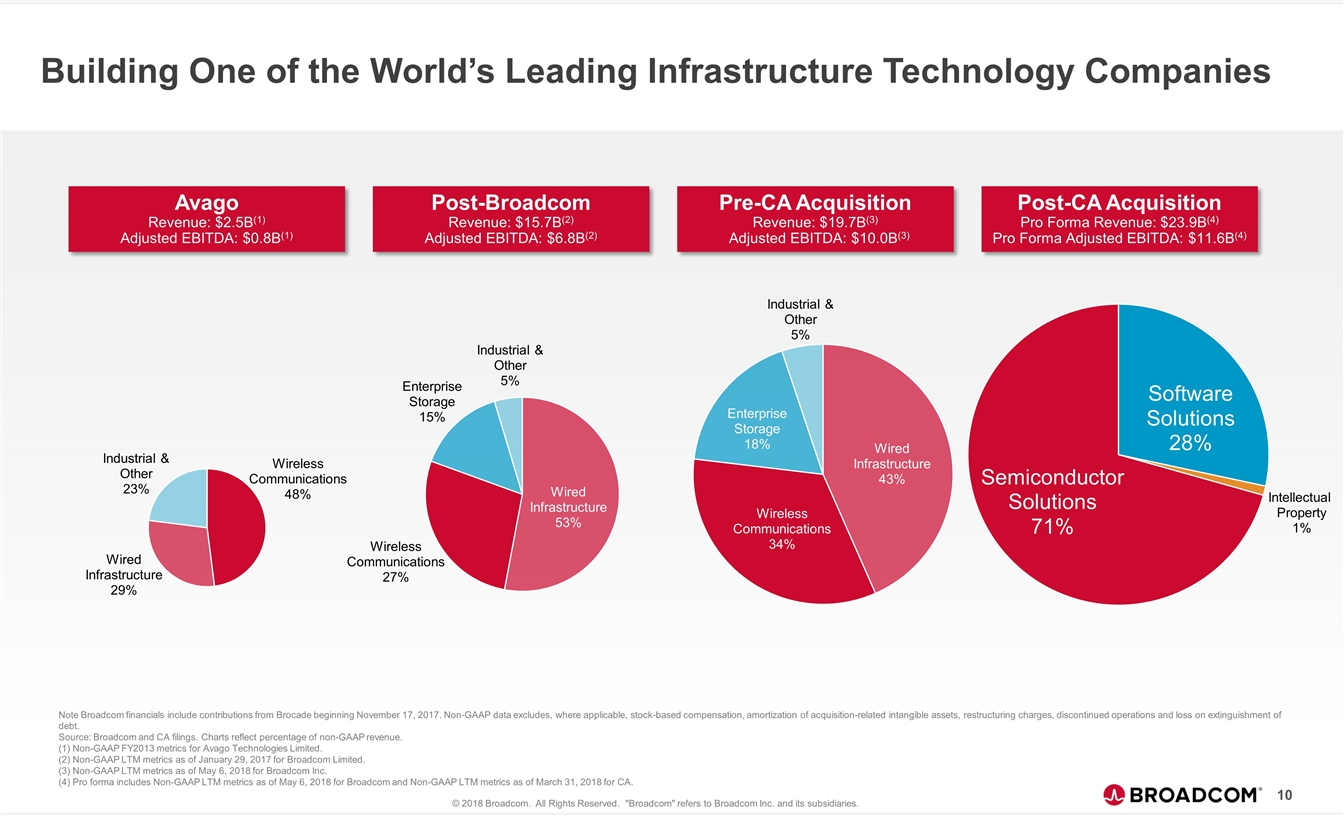
Building One of the World’s Leading Infrastructure Technology Companies 10 Note Broadcom financials include contributions from Brocade beginning November 17, 2017. Non-GAAP data excludes, where applicable, stock-based compensation, amortization of acquisition-related intangible assets, restructuring charges, discontinued operations and loss on extinguishment of debt. Source: Broadcom and CA filings. Charts reflect percentage of non-GAAP revenue. (1) Non-GAAP FY2013 metrics for Avago Technologies Limited. (2) Non-GAAP LTM metrics as of January 29, 2017 for Broadcom Limited. (3) Non-GAAP LTM metrics as of May 6, 2018 for Broadcom Inc. (4) Pro forma includes Non-GAAP LTM metrics as of May 6, 2018 for Broadcom and Non-GAAP LTM metrics as of March 31, 2018 for CA. Avago Revenue: $2.5B(1) Adjusted EBITDA: $0.8B(1) Post-CA Acquisition Pro Forma Revenue: $23.9B(4) Pro Forma Adjusted EBITDA: $11.6B(4) Pre-CA Acquisition Revenue: $19.7B(3) Adjusted EBITDA: $10.0B(3) Post-Broadcom Revenue: $15.7B(2) Adjusted EBITDA: $6.8B(2)

