Attached files
| file | filename |
|---|---|
| 8-K - 8-K - ModivCare Inc | form8-kxcjspresentation.htm |

PROVIDENCE OVERVIEW JULY 2018

FORWARD-LOOKING STATEMENTS AND NON-GAAP FINANCIAL INFORMATION Forward-looking Statements This presentation contains “forward-looking statements” within the meaning of the Private Securities Litigation Reform Act of 1995. Words such as “believe,” “demonstrate,” “expect,” “estimate,” “forecast,” “anticipate,” “should” and “likely” and similar expressions identify forward-looking statements. In addition, statements that are not historical should also be considered forward-looking statements. Readers are cautioned not to place undue reliance on those forward-looking statements, which speak only as of the date the statement was made. Such forward-looking statements are based on current expectations that involve a number of known and unknown risks, uncertainties and other factors which may cause actual events to be materially different from those expressed or implied by such forward-looking statements. These factors include, but are not limited to, our continuing relationship with government entities and our ability to procure business from them, our ability to manage growing and changing operations, the implementation of healthcare reform law, government budget changes and legislation related to the services that we provide, our ability to renew or replace existing contracts that have expired or are scheduled to expire with significant clients, and other risks detailed in Providence’s filings with the Securities and Exchange Commission, including its Annual Report on Form 10-K. Providence is under no obligation to (and expressly disclaims any such obligation to) update any of the information in this press release if any forward-looking statement later turns out to be inaccurate whether as a result of new information, future events or otherwise. Non-GAAP Financial Information In addition to the financial results prepared in accordance with U.S. generally accepted accounting principles (GAAP), this press release includes EBITDA, Adjusted EBITDA and Segment-level Adjusted EBITDA for the Company and its operating segments, and Adjusted Net Income and Adjusted EPS for the Company, which are performance measures that are not recognized under GAAP. EBITDA is defined as income (loss) from continuing operations, net of taxes, before: (1) interest expense, net, (2) provision (benefit) for income taxes and (3) depreciation and amortization. Adjusted EBITDA is calculated as EBITDA before certain items, including (as applicable): (1) restructuring and related charges including costs related to the corporate reorganization, (2) foreign currency transactions, (3) equity in net earnings or losses of investees, (4) certain litigation related expenses or settlement income, (5) gain or loss on sale of equity investments, (6) management fees and (7) transaction and related costs. Segment-level Adjusted EBITDA is calculated as Adjusted EBITDA for the company excluding the Adjusted EBITDA associated with corporate and holding company costs reported as our Corporate and Other Segment. Adjusted Net Income is defined as income (loss) from continuing operations, net of tax, before certain items, including (1) restructuring and related charges, (2) foreign currency transactions, (3) equity in net earnings or losses of investees, (4) certain litigation related expenses or settlement income, (5) intangible amortization expense, (6) gain or loss on sale of equity investments, (7) the impact of the Tax Cuts and Jobs Act, (8) excess tax charges associated with long term incentive plans, (9) the impact of adjustments on non-controlling interests, (10) certain transaction and related costs and (11) the income tax impact of such adjustments. Adjusted EPS is calculated as Adjusted Net Income less (as applicable): (1) dividends on convertible preferred stock, (2) accretion of convertible preferred stock discount, and (3) income allocated to participating stockholders, divided by the diluted weighted-average number of common shares outstanding. We utilize these non-GAAP performance measures, which exclude certain expenses and amounts, because we believe the timing of such expenses is unpredictable and not driven by our core operating results, and therefore render comparisons with prior periods as well as with other companies in our industry less meaningful. We believe such measures allow investors to gain a better understanding of the factors and trends affecting the ongoing operations of our business. We consider our core operations to be the ongoing activities to provide services from which we earn revenue, including direct operating costs and indirect costs to support these activities. In addition, our net earnings in equity investees are excluded from these measures, as we do not have the ability to manage these ventures, allocate resources within the ventures, or directly control their operations or performance. Our non-GAAP financial measures may not provide information that is directly comparable to that provided by other companies in our industry, as other companies in our industry may calculate non-GAAP financial results differently. In addition, there are limitations in using non-GAAP financial measures because they are not prepared in accordance with GAAP, may be different from non-GAAP financial measures used by other companies, and exclude expenses that may have a material impact on our reported financial results. The presentation of non-GAAP financial information is not meant to be considered in isolation from or as a substitute for the directly comparable financial measures prepared in accordance with GAAP. We urge you to review the reconciliations of our non-GAAP financial measures to the comparable GAAP financial measures included below, and not to rely on any single financial measure to evaluate our business. 2

A LEADING PROVIDER OF TECHNOLOGY ENABLED HEALTHCARE SERVICES PRSC ~$1Bn 1996 STAMFORD, CT TICKER MARKET CAP FOUNDED HEADQUARTERS LTM 3/31/2018 REVENUE NET SERVICES $1.33Bn WD SERVICES Primarily operates under the LogistiCare brand, the $299.6M largest manager of non- Mainly operates under the emergency medical Ingeus brand, helping transportation programs for $1.63Bn governments and state governments and employers design and managed care organizations deliver services to solve in the U.S. providing better the complex challenges access to care in the caused by social and community technological change, including employability services, legal offender rehabilitation services, MATRIX INVESTMENT youth community service programs and certain 43.6% non-controlling equity interest in Matrix Medical health related services. Network, a leading provider of home and mobile-based healthcare services for health plans in the U.S., including comprehensive health assessments, quality gap closure visits, “level of service” needs assessments, and post-acute and chronic care management. 3

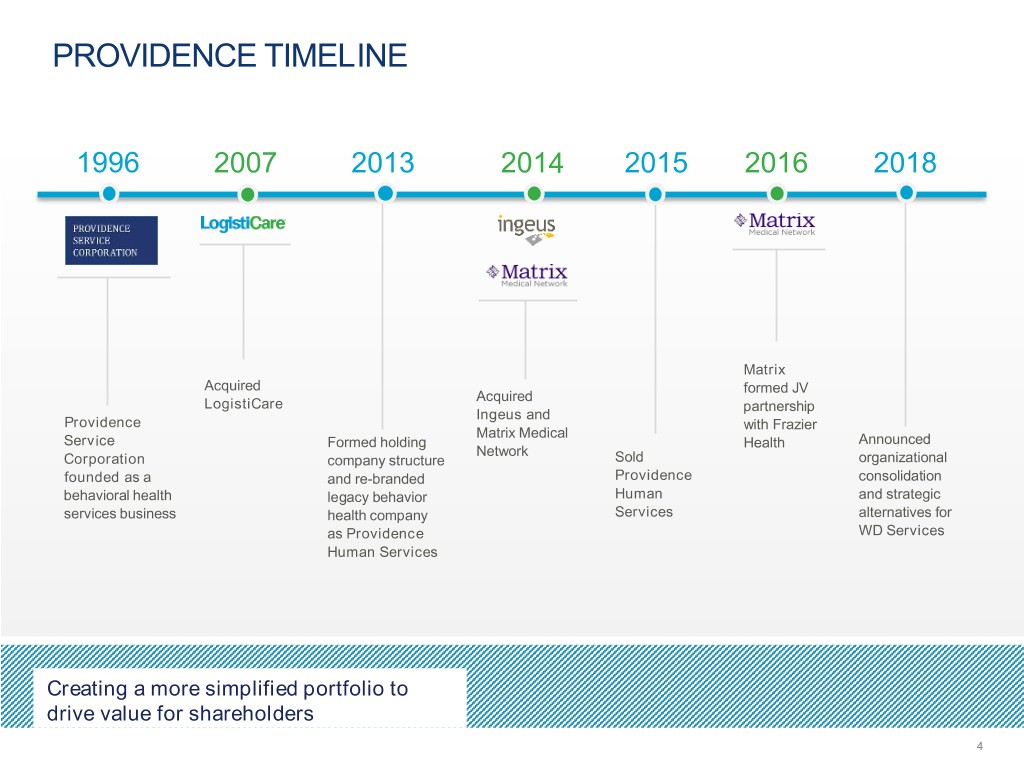
PROVIDENCE TIMELINE 1996 2007 2013 2014 2015 2016 2018 Matrix Acquired formed JV Acquired LogistiCare partnership Ingeus and Providence with Frazier Matrix Medical Service Formed holding Health Announced Network Corporation company structure Sold organizational founded as a and re-branded Providence consolidation behavioral health legacy behavior Human and strategic services business health company Services alternatives for as Providence WD Services Human Services Creating a more simplified portfolio to drive value for shareholders 4

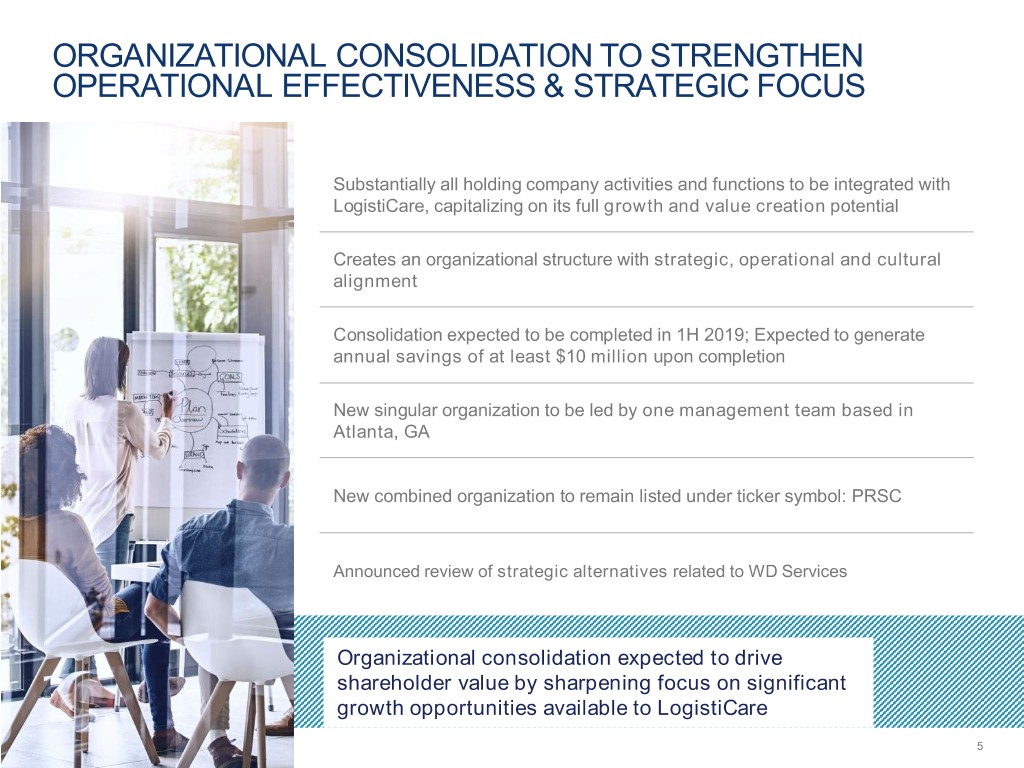
ORGANIZATIONAL CONSOLIDATION TO STRENGTHEN OPERATIONAL EFFECTIVENESS & STRATEGIC FOCUS Substantially all holding company activities and functions to be integrated with LogistiCare, capitalizing on its full growth and value creation potential Creates an organizational structure with strategic, operational and cultural alignment Consolidation expected to be completed in 1H 2019; Expected to generate annual savings of at least $10 million upon completion New singular organization to be led by one management team based in Atlanta, GA New combined organization to remain listed under ticker symbol: PRSC Announced review of strategic alternatives related to WD Services Organizational consolidation expected to drive shareholder value by sharpening focus on significant growth opportunities available to LogistiCare 5

COMPELLING INVESTMENT OPPORTUNITY EXPOSURE TO ATTRACTIVE INDUSTRY GROWTH DRIVERS EXPANSION of aging populations, home and community based care VALUE-BASED CARE driving focus on quality care, patient outcomes and reduced costs IMPACTFUL MARKET LEADING BRANDS MARKET LEADERSHIP covering over 24 million lives through LogistiCare FAVORABLE BRAND REPUTATIONS driven by proven ability to meet client needs ACCESS TO SCALE AND REACH NATIONWIDE PARTNER and client networks 67 MILLION RIDES managed annually across 38 states and D.C. SCALABLE IT PLATFORMS providing competitive advantages RECURRING REVENUE, TECHNOLOGY BASED, ASSET LITE MODELS MULTI YEAR client contracts and relationships FOCUSED ON INVESTMENTS IN IT PLATFORMS that provide operating leverage and superior service quality PROVEN TRACK RECORD PROVEN GROWTH and operational improvement strategies DISCIPLINED CAPITAL ALLOCATION with rigorous approach to creating intrinsic value per share Value-enhancing organizational consolidation underway to create a structure with strategic, operational and cultural alignment focused on LogistiCare 6

POSITIONED TO BENEFIT FROM ATTRACTIVE INDUSTRY GROWTH DRIVERS MEDICAID MEDICARE ADVANTAGE Lives in Millions Lives in Millions 77 78 75 76 ~25% 74 26 71 72 of MA enrollees in 2017 25 69 have NEMT benefits 23 22 66 21 18 19 17 59 16 14 2013 2014 2015 2016 2017 2018 2019 2020 2021 2022 2013 2014 2015 2016 2017 2018 2019 2020 2021 2022 MEDICAID ENROLLMENT MEDICARE ADVANTAGE (“MA”) ENROLLMENT projected to reach 78M by 2022 projected to reach 26M by 2022 • The Aged and Disabled populations represent 23% of • MA plans are becoming increasingly sophisticated the total Medicaid populations while accounting for ~80% to identify populations that could benefit from transport of the total Medicaid NEMT spend services to reduce overall cost of care in the long-term • The aging population in the U.S. is expected to drive • MA plans that have implemented transport services increased demand for NEMT services as age 65+ have seen an uptick in access to care members seek more community-based care (i.e. adult day care facilities) Sources: Medicaid membership from CMS, Medicare Advantage membership from KFF and Medicare Advantage members with NEMT benefits from Health Affairs. 7

NET SERVICES: LOGISTICARE THE LARGEST NON-EMERGENCY MEDICAL TRANSPORTATION MANAGER IN THE U.S. Powering critical services at scale with networks and technology SERVICES MEMBERS PAYORS and CLIENTS TECH ENABLED • Coordinating non- • Primarily Medicaid and • Contracted with State Medicaid • Uses technology to provide broad emergency medical some Medicare eligible Agencies, Managed Care interconnectivity among transportation members whose limited Organizations (MCOs), members, payors and network for services through its mobility or financial Accountable Care transportation providers extensive 5,000+ resources hinders their Organizations (ACOs), and • Flexible, highly scalable, capable credentialed ability to access necessary healthcare providers of supporting substantial growth transportation healthcare and social for existing and future clients provider network services • Investment in Circulation, an on- demand provider of NEMT services for healthcare systems 8

NET SERVICES: LOGISTICARE SERVING MEMBERS WITH COMPASSION AND EXCELLENCE LogistiCare by the Numbers Revenue Available in Management of and access to Lives covered Managed $1.33Bn 38 states 5,000+ ~24M 67M LTM 3/31/2018 + Washington, D.C. transportation providers and Annual leading on-demand networks trips NETWORK DEVELOPMENT AND MANAGEMENT Successfully built the largest transportation provider network in the industry consisting of more than 5,000 certified providers who take our members to their appointments each year. LogistiCare focuses on the member experience and includes, credentialing drivers, assigning trips, validating claims prior to payment, and partnering with public transit. Proven track record of reducing transportation costs per member for payors 9

NET SERVICES: LOGISTICARE CLEAR VALUE PROPOSITION AND STRATEGY FOR GROWTH Investing in Growth, Enhancing Value VALUE PROPOSITION MARGIN ENHANCEMENT INITIATIVES • Alleviation of transportation barriers improves • Reducing transportation costs outcomes and reduces healthcare costs for • Implementing new costing models Medicaid agencies and MCO’s • Leveraging new technology • Ability to provide capitated, multi-year contracts • Rolling out transportation contracting best practices allows both lower and more predictable costs • Reduction of fraud, waste, and abuse in a OPERATIONAL ENHANCEMENT INITIATIVES fragmented system • Cloud-based, next-generation LogistiCare technology platform • High barriers to entry - technology platforms, leading market share, strong brand reputation • Strengthened leadership team – new CTO, SVP of Growth, SVP of Strategy • Well positioned to take advantage of the shift to in-home/community based healthcare services FUTURE CAPITAL DEPLOYMENT • Focus on organic growth initiatives within NEMT and new adjacent markets and services • Targeted M&A strategy towards complementary businesses Reinvesting a part of the cost savings to support top-line growth, service quality improvements, enhancing competitive positioning 10

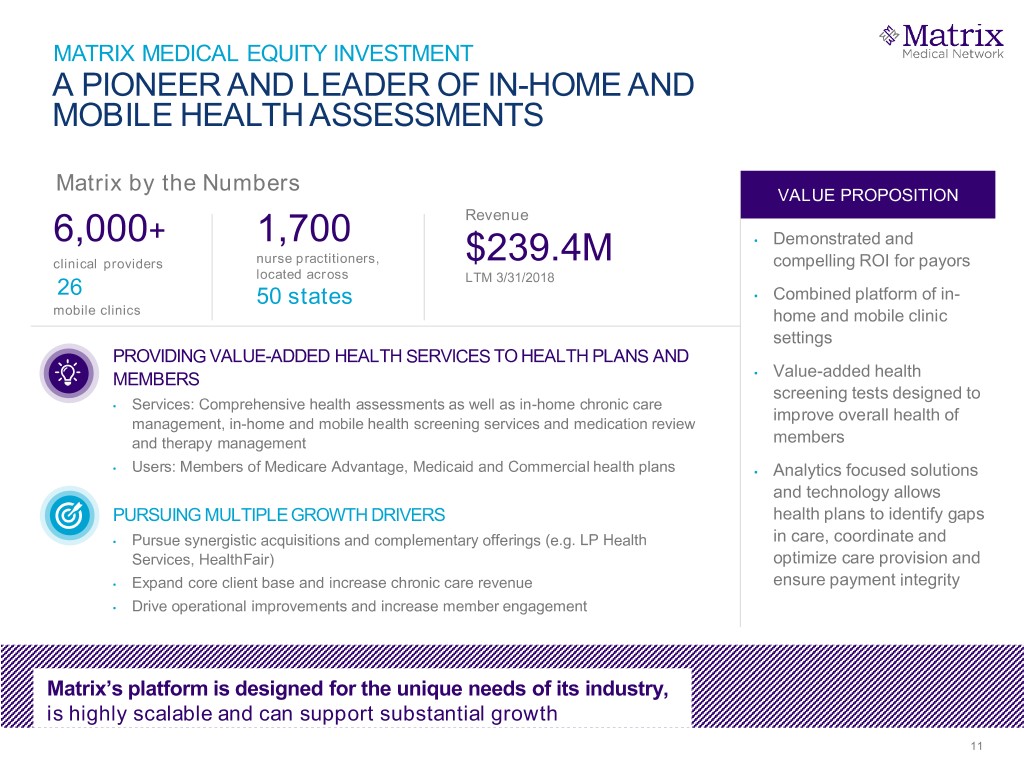
MATRIX MEDICAL EQUITY INVESTMENT A PIONEER AND LEADER OF IN-HOME AND MOBILE HEALTH ASSESSMENTS Matrix by the Numbers VALUE PROPOSITION Revenue 6,000+ 1,700 • Demonstrated and clinical providers nurse practitioners, $239.4M compelling ROI for payors located across 26 LTM 3/31/2018 50 states • Combined platform of in- mobile clinics home and mobile clinic settings PROVIDING VALUE-ADDED HEALTH SERVICES TO HEALTH PLANS AND MEMBERS • Value-added health screening tests designed to • Services: Comprehensive health assessments as well as in-home chronic care improve overall health of management, in-home and mobile health screening services and medication review and therapy management members • Users: Members of Medicare Advantage, Medicaid and Commercial health plans • Analytics focused solutions and technology allows PURSUING MULTIPLE GROWTH DRIVERS health plans to identify gaps • Pursue synergistic acquisitions and complementary offerings (e.g. LP Health in care, coordinate and Services, HealthFair) optimize care provision and • Expand core client base and increase chronic care revenue ensure payment integrity • Drive operational improvements and increase member engagement Matrix’s platform is designed for the unique needs of its industry, is highly scalable and can support substantial growth 11

WD SERVICES: INGEUS LEADING WORKFORCE DEVELOPMENT COMPANY VALUE ENHANCED STRATEGY • Reduced cost structure to reflect record SERVICES USERS GLOBAL REACH low unemployment levels in the UK, France and Australia Providing outsourced Includes the disabled, Operates in 11 employability recently and long-term countries including in • Contract wins under UK’s new Work and services, youth unemployed and the UK, France, Saudi Health Program services, health and individuals seeking new Arabia, South Korea, • Expanded services and expertise in a offender rehabilitation skills, as well as U.S., Canada, services to individuals that are Germany, Australia, disciplined manner across employability, governments coping with medical Switzerland and offender rehabilitation, vocational training, illnesses, are newly Singapore and health and wellbeing offerings graduated from educational institutions, • Exited unprofitable regional operations or are being released and business lines from incarceration • Generated value from selective sale of assets including Mission Providence Recently announced strategic alternatives to enhance shareholder value may result in sale of the business 12

2018 Operational Update The nature of our businesses can result in short-term volatility in financial performance, which generally corrects over time as contractual rates and operating infrastructures are adjusted to reflect customer behavior. Our NET Services business and Matrix Investment are currently experiencing some of these impacts and other headwinds which will lead to 2018 full year margins being below our previous outlook. However, our multiyear outlook and confidence in the long-term strength of NET Services and our Matrix Investment remains unchanged. NET Services • Although NET Services is still on track to achieve 3% - 5% revenue growth in 2018, margins are being unfavorably impacted by higher than expected transportation costs on a per trip basis. This increased “unit cost” is due to: • A shift in service mix from lower to higher cost modes of transportation • An increase in the average mileage per trip • A slower than anticipated realization of cost savings under our transportation and call center value enhancement initiatives. In addition the benefits of our transportation cost initiatives are being partially muted by the shifting service mix, thus requiring a retargeting of our efforts • These headwinds have resulted in the downward revision of our full year EBITDA margin expectations for NET Services from approximately 7% to the low 6% range. However, our long-term view of NET Services profitability potential remains unchanged Matrix Investment (equity investment not included in our consolidated numbers) • Matrix’s core in-home assessment business is currently performing ahead of plan in 2018 • However, while the acquisition thesis for HealthFair remains intact, revenue growth for the mobile assessment business is now expected to be lower than originally planned due to a slower ramp up of contracts, thus leading to volume delays • In addition to delayed volume, Adjusted EBITDA for the mobile assessment business is being impacted by higher than expected ramp up costs and a direct cost structure sized to meet the demand of higher volumes, which have not been realized to date • Matrix management is proactively reducing HealthFair’s cost structure in H2 while preserving the capacity for growth in 2019 and beyond • Despite these in-year challenges, our long-term growth and margin expectations remain unchanged WD Services • Operationally, WD Services continues to perform at or ahead of our original expectations for the year; however, the new revenue standard and contract renegotiations are introducing quarterly volatility • In addition to the unfavorable impact experienced in Q1 2018, the adoption of the new revenue standard continues to negatively impact margins • Further renegotiation of the offender rehabilitation contract is likely to result in a decrease in revenue and margins in 2018, but is beneficial to the multi-year profitability of the contract • Based upon these impacts, primarily from the new revenue standard, we expect Q2 margins to be close to break-even and full year margins to be close to 3%. Prior to the impact of the new revenue standard, we would expect margins to be approximately 5% for 2018 13

DELIVERING CONSISTENT, PROFITABLE GROWTH REVENUE ADJUSTED EBITDA 1 USD MILLIONS USD MILLIONS 1,630.4 1,578.2 1,623.9 1,478.0 12.9 305.7 299.6 5.5 344.4 16.3 395.1 10.3 76.2 72.2 72.4 66.3 92.4 93.0 1,233.7 1,318.2 1,330.9 85.3 1,083.0 80.7 2015 2016 2017 LTM Q1:2018 2015 2016 2017 LTM Q1:2018 ADJUSTED EBITDA LESS CAPEX 1 SHARE REPURCHASES USD MILLIONS USD MILLIONS 57.0 52.5 70.2 $170mm of share repurchases 41.5 40.2 since 2015 37.4 34.1 28.5 2 2015 2016 2017 LTM Q1:2018 2015 2016 2017 YTD 3 NET WD Total After HoldCo (1) See appendix for a reconciliation of non-GAAP financial measures. 1,578.2 1,623.9 1,630.4 (2) YTD through May 7, 2018. 1,478.0 14 (3) Represents Adj. EBITDA of NET plus WD less HoldCo. 305.7 299.6 57.0 344.4 52.5 57.0 52.5 395.1 41.5 41.5 40.2 40.2 1,233.7 1,318.2 1,330.9 1,083.0 20152015 20152016 201620172016 LTM2017 Q1:2018LTM Q1:20182017 LTM Q1:2018

VALUE ENHANCING CAPITAL ALLOCATION PLAN STRONG BALANCE SHEET No long-term debt 1 Actively investing in numerous organic growth and margin enhancement initiatives CAPITAL including Next Generational reservation system, route optimization software and automated- ALLOCATION vehicle locator PRIORITIES Anticipate that future M&A efforts will be focused on opportunities that are adjacent, complementary and synergistic to LogistiCare Increased share repurchase capacity by $78M in March 2018; $99.5M of remaining capacity as of May 7, 2018 Accretive M&A opportunities at Matrix Investment may require future capital contributions to increase the value of our equity investment (1) As of March 31, 2018. 15

APPENDIX

ADJUSTED EBITDA RECONCILIATION (SEGMENT-LEVEL) NET Services WD Services Segment-Level FYE FYE FYE LTM FYE FYE FYE LTM FYE FYE FYE LTM $Millions Q1:17 Q1:18 2015 2016 2017 Q1:18 Q1:17 Q1:18 2015 2016 2017 Q1:18 Q1:17 Q1:18 2015 2016 2017 Q1:18 Revenue 324.0 336.7 1,083.0 1,233.7 1,318.2 1,330.9 75.5 69.4 395.1 344.4 305.7 299.6 399.5 406.0 1,478.1 1,578.1 1,623.9 1,630.4 Income from Cont Ops after Income Taxes 7.2 14.5 44.0 47.4 41.7 49.0 (0.2) (1.6) (51.3) (46.2) 10.0 8.7 6.9 12.9 (7.3) 1.2 51.7 57.7 Interest Expense, Net 0.0 0.0 (0.0) (0.0) 0.1 0.1 0.3 0.4 (0.1) 0.8 1.3 1.4 0.3 0.4 (0.1) 0.8 1.4 1.5 Provision (Benefit) For Income Taxes 4.6 5.0 27.2 29.7 24.0 24.4 0.8 (0.1) (1.1) (1.2) 1.2 0.3 5.4 4.9 26.2 28.5 25.2 24.7 Depreciation and Amortization 3.2 3.5 9.4 12.4 13.3 13.6 3.0 3.2 13.8 13.8 12.9 13.0 6.2 6.7 23.2 26.2 26.1 26.6 EBITDA 15.0 23.1 80.7 89.5 79.0 87.1 3.9 1.8 (38.7) (32.8) 25.4 23.4 18.8 24.9 41.9 56.7 104.5 110.5 Asset Impairment - - - - - - - - - 19.6 - - - - - 19.6 - - Restructuring and Related Expense 0.2 - - 0.9 0.2 0.0 0.7 1.6 12.2 9.0 2.8 3.6 0.9 1.6 12.2 9.8 3.0 3.7 Value Enhancement Initiative Implementation 1.1 0.8 - 2.0 6.1 5.8 0.3 - - 2.6 0.8 0.5 1.4 0.8 - 4.6 6.9 6.3 Equity in Net Loss (Gain) of Investee - - - - - - 1.4 (0.0) 11.0 8.5 1.4 (0.0) 1.4 (0.0) 11.0 8.5 1.4 (0.0) (Gain) on Sale of Mission Providence - - - - - - - - - - (12.4) (12.4) - - - - (12.4) (12.4) Ingeus Acquisition Related Cost / Income - - - - - - - - 29.2 - (2.0) (2.0) - - 29.2 - (2.0) (2.0) Contingent Consideration Adjustment - - - - - - - - (2.5) - - - - - (2.5) - - - Foreign Currency (Gain) / Loss - - - - - - (0.1) (0.6) (0.9) (1.4) 0.3 (0.2) (0.1) (0.6) (0.9) (1.4) 0.3 (0.2) Litigation Expense - - - - - - - - - - - - - - - - - - Adjusted EBITDA 16.2 23.9 80.7 92.4 85.3 93.0 6.3 2.8 10.3 5.5 16.3 12.9 22.5 26.7 91.0 97.8 101.7 105.8 % Margin 5.0% 7.1% 7.4% 7.5% 6.5% 7.0% 8.3% 4.1% 2.6% 1.6% 5.3% 4.3% 5.6% 6.6% 6.2% 6.2% 6.3% 6.5% 17

ADJUSTED EBITDA RECONCILIATION (TOTAL CONTINUING OPERATIONS) (1) Matrix Investment Corporate and Other Total Continuing Operations FYE FYE FYE LTM FYE FYE FYE LTM FYE FYE FYE LTM $Millions Q1:17 Q1:18 2015 2016 2017 Q1:18 Q1:17 Q1:18 2015 2016 2017 Q1:18 Q1:17 Q1:18 2015 2016 2017 Q1:18 Revenue - - - - - - (0.0) - (0.1) 0.1 (0.0) - 399.5 406.0 1,478.0 1,578.2 1,623.9 1,630.4 Income from Cont Ops after Income Taxes (0.4) (1.8) - (1.1) 10.0 8.5 (4.6) (5.4) (17.4) (19.0) (1.9) (2.6) 1.9 5.7 (24.7) (18.9) 59.8 63.6 Interest Expense, Net - - - - - - 0.1 (0.1) 2.0 0.8 (0.1) (0.3) 0.4 0.3 1.9 1.6 1.3 1.2 Provision (Benefit) For Income Taxes (0.2) (0.5) - (0.7) 3.5 3.2 (2.7) (2.5) (11.6) (10.8) (24.3) (24.2) 2.5 1.8 14.6 17.0 4.4 3.7 Depreciation and Amortization - - - - - - 0.1 0.1 0.8 0.4 0.3 0.4 6.3 6.8 24.0 26.6 26.5 27.0 EBITDA (0.7) (2.3) - (1.8) 13.4 11.8 (7.1) (7.9) (26.2) (28.6) (26.0) (26.7) 11.1 14.7 15.8 26.3 92.0 95.6 Asset Impairment - - - - - - - - - 1.4 - - - - - 21.0 - - Restructuring and Related Expense - - - - - - - 0.4 0.7 - 1.7 2.2 0.9 2.1 12.9 9.8 4.7 5.8 Value Enhancement Initiative Implementation - - - - - - - - - - - - 1.4 0.8 - 4.6 6.9 6.3 Equity in Net Loss (Gain) of Investee 0.7 2.3 - 1.8 (13.4) (11.8) - - - - - - 2.1 2.3 11.0 10.3 (12.1) (11.8) (Gain) on Sale of Mission Providence - - - - - - - - - - - - - - - - (12.4) (12.4) Ingeus Acquisition Related Cost / Income - - - - - - - - - - - - - - 29.2 - (2.0) (2.0) Contingent Consideration Adjustment - - - - - - - - - - - - - - (2.5) - - - Foreign Currency (Gain) / Loss - - - - - - - - - - - - (0.1) (0.6) (0.9) (1.4) 0.3 (0.2) Litigation Expense - - - - - - 0.1 - 0.8 1.6 (5.0) (5.1) 0.1 - 0.8 1.6 (5.0) (5.1) Adjusted EBITDA - - - - - - (7.0) (7.4) (24.7) (25.6) (29.2) (29.7) 15.6 19.3 66.3 72.2 72.4 76.2 % Margin 3.9% 4.7% 4.5% 4.6% 4.5% 4.7% (2) Capex (5.7) (5.0) (24.8) (32.0) (19.9) (19.2) Adj. EBITDA Less Capex 9.8 14.3 41.5 40.2 52.5 57.0 (1) Total Continuing Operations represents Segment-Level results plus Matrix Investment and Corporate and Other. (2) Represents capex from continuing operations only. 18
