Attached files
| file | filename |
|---|---|
| EX-32 - EX-32 - Jefferies Group LLC | exhibit32053118.htm |
| EX-31.2 - EX-31.2 - Jefferies Group LLC | exhibit312053118.htm |
| EX-31.1 - EX-31.1 - Jefferies Group LLC | exhibit311053118.htm |
| EX-12 - EX-12 - Jefferies Group LLC | exhibit12053118.htm |
UNITED STATES
SECURITIES AND EXCHANGE COMMISSION
WASHINGTON, D.C. 20549
FORM 10-Q
☒ | QUARTERLY REPORT PURSUANT TO SECTION 13 OR 15(d) OF THE SECURITIES EXCHANGE ACT OF 1934 |
For the quarterly period ended May 31, 2018
OR
☐ | TRANSITION REPORT PURSUANT TO SECTION 13 OR 15(d) OF THE SECURITIES EXCHANGE ACT OF 1934 |
For the transition period from to
Commission file number 1-14947
JEFFERIES GROUP LLC
(Exact name of registrant as specified in its charter)
Delaware | 95-4719745 |
(State or other jurisdiction of incorporation or organization) | (I.R.S. Employer Identification No.) |
520 Madison Avenue, New York, New York | 10022 |
(Address of principal executive offices) | (Zip Code) |
Registrant’s telephone number, including area code: (212) 284-2550
Indicate by check mark whether the registrant (1) has filed all reports required to be filed by Section 13 or 15(d) of the Securities Exchange Act of 1934 during the preceding 12 months (or for such shorter period that the registrant was required to file such reports), and (2) has been subject to such filing requirements for the past 90 days. Yes ☒ No ☐
Indicate by check mark whether the registrant has submitted electronically and posted on its corporate Web site, if any, every Interactive Data File required to be submitted and posted pursuant to Rule 405 of Regulation S-T (§232.405 of this chapter) during the preceding 12 months (or for such shorter period that the registrant was required to submit and post such files). Yes ☒ No ☐
Indicate by check mark whether the registrant is a large accelerated filer, an accelerated filer, a non-accelerated filer, smaller reporting company, or an emerging growth company. See the definitions of “large accelerated filer,” “accelerated filer,” “smaller reporting company,” and “emerging growth company” in Rule 12b-2 of the Exchange Act.
Large accelerated filer ☐ | Accelerated filer ☐ |
Non-accelerated filer ☒ | Smaller reporting company ☐ |
Emerging growth company ☐ | |
If an emerging growth company, indicate by check mark if the registrant has elected not to use the extended transition period for complying with any new or revised financial accounting standards provided pursuant to Section 13(a) of the Exchange Act. ☐
Indicate by check mark whether the registrant is a shell company (as defined in Rule 12b-2 of the Exchange Act). Yes ☐ No ☒
The Registrant is a wholly-owned subsidiary of Jefferies Financial Group Inc. and meets the conditions set forth in General Instructions H(1)(a) and (b) of Form 10-Q and is therefore filing this Form 10-Q with a reduced disclosure format as permitted by Instruction H(2).
JEFFERIES GROUP LLC
INDEX TO QUARTERLY REPORT ON FORM 10-Q
May 31, 2018
Page | |
1
PART I. FINANCIAL INFORMATION
Item 1. Financial Statements.
JEFFERIES GROUP LLC AND SUBSIDIARIES
CONSOLIDATED STATEMENTS OF FINANCIAL CONDITION (UNAUDITED)
(In thousands)
May 31, 2018 | November 30, 2017 | ||||||
ASSETS | |||||||
Cash and cash equivalents ($5,172 and $7,514 at May 31, 2018 and November 30, 2017, respectively, related to consolidated VIEs) | $ | 4,579,931 | $ | 5,164,492 | |||
Cash and securities segregated and on deposit for regulatory purposes or deposited with clearing and depository organizations | 709,646 | 578,014 | |||||
Financial instruments owned, at fair value, (including securities pledged of $11,079,600 and $10,842,051 at May 31, 2018 and November 30, 2017, respectively; and $1,296 and $38,044 at May 31, 2018 and November 30, 2017, respectively, related to consolidated VIEs) | 15,705,657 | 14,193,352 | |||||
Loans to and investments in related parties | 740,804 | 682,790 | |||||
Securities borrowed | 7,599,043 | 7,721,803 | |||||
Securities purchased under agreements to resell | 3,822,232 | 3,689,559 | |||||
Securities received as collateral | — | 103 | |||||
Receivables: | |||||||
Brokers, dealers and clearing organizations | 2,488,632 | 2,514,838 | |||||
Customers | 1,977,251 | 1,563,758 | |||||
Fees, interest and other ($4 and $197 at May 31, 2018 and November 30, 2017, respectively, related to consolidated VIEs) | 365,285 | 381,231 | |||||
Premises and equipment | 304,859 | 297,750 | |||||
Goodwill | 1,645,541 | 1,647,089 | |||||
Other assets ($2 at both May 31, 2018 and November 30, 2017, related to consolidated VIEs) | 1,184,590 | 1,270,912 | |||||
Total assets | $ | 41,123,471 | $ | 39,705,691 | |||
LIABILITIES AND EQUITY | |||||||
Short-term borrowings (includes $68,818 and $23,324 at fair value at May 31, 2018 and November 30, 2017, respectively) | $ | 506,218 | $ | 436,215 | |||
Financial instruments sold, not yet purchased, at fair value | 8,914,893 | 8,171,929 | |||||
Collateralized financings: | |||||||
Securities loaned | 2,555,701 | 2,843,911 | |||||
Securities sold under agreements to repurchase | 8,773,506 | 8,660,511 | |||||
Other secured financings (includes $968,822 and $722,108 at May 31, 2018 and November 30, 2017, respectively, related to consolidated VIEs) | 968,822 | 722,108 | |||||
Obligation to return securities received as collateral | — | 103 | |||||
Payables: | |||||||
Brokers, dealers and clearing organizations | 2,729,207 | 2,226,768 | |||||
Customers | 3,153,047 | 2,664,023 | |||||
Accrued expenses and other liabilities ($757 and $1,391 at May 31, 2018 and November 30, 2017, respectively, related to consolidated VIEs) | 1,386,546 | 1,803,720 | |||||
Long-term debt (includes $708,256 and $606,956 at fair value at May 31, 2018 and November 30, 2017, respectively) | 6,591,900 | 6,416,844 | |||||
Total liabilities | 35,579,840 | 33,946,132 | |||||
EQUITY | |||||||
Member’s paid-in capital | 5,715,628 | 5,895,601 | |||||
Accumulated other comprehensive loss: | |||||||
Currency translation adjustments | (148,576 | ) | (98,909 | ) | |||
Changes in instrument specific credit risk | (19,984 | ) | (27,888 | ) | |||
Cash flow hedges | 361 | (936 | ) | ||||
Additional minimum pension liability | (4,548 | ) | (9,046 | ) | |||
Total accumulated other comprehensive loss | (172,747 | ) | (136,779 | ) | |||
Total Jefferies Group LLC member’s equity | 5,542,881 | 5,758,822 | |||||
Noncontrolling interests | 750 | 737 | |||||
Total equity | 5,543,631 | 5,759,559 | |||||
Total liabilities and equity | $ | 41,123,471 | $ | 39,705,691 | |||
See accompanying notes to consolidated financial statements.
2
JEFFERIES GROUP LLC AND SUBSIDIARIES
CONSOLIDATED STATEMENTS OF EARNINGS (UNAUDITED)
(In thousands)
Three Months Ended May 31, | Six Months Ended May 31, | ||||||||||||||
2018 | 2017 | 2018 | 2017 | ||||||||||||
Revenues: | |||||||||||||||
Commissions and other fees | $ | 158,104 | $ | 152,643 | $ | 306,006 | $ | 298,465 | |||||||
Principal transactions | 137,802 | 280,258 | 355,275 | 502,160 | |||||||||||
Investment banking | 500,297 | 351,863 | 940,288 | 759,884 | |||||||||||
Asset management fees | 6,016 | 4,115 | 10,946 | 12,096 | |||||||||||
Interest | 307,327 | 227,804 | 565,143 | 429,827 | |||||||||||
Other | 47,263 | 22,272 | 65,746 | 46,320 | |||||||||||
Total revenues | 1,156,809 | 1,038,955 | 2,243,404 | 2,048,752 | |||||||||||
Interest expense | 334,252 | 259,661 | 599,601 | 473,945 | |||||||||||
Net revenues | 822,557 | 779,294 | 1,643,803 | 1,574,807 | |||||||||||
Non-interest expenses: | |||||||||||||||
Compensation and benefits | 444,094 | 450,522 | 899,727 | 910,694 | |||||||||||
Non-compensation expenses: | |||||||||||||||
Floor brokerage and clearing fees | 46,244 | 47,494 | 90,063 | 93,352 | |||||||||||
Underwriting costs | 13,029 | — | 27,304 | — | |||||||||||
Technology and communications | 76,381 | 67,478 | 145,458 | 132,985 | |||||||||||
Occupancy and equipment rental | 24,993 | 23,594 | 49,584 | 49,409 | |||||||||||
Business development | 42,393 | 26,466 | 84,500 | 49,098 | |||||||||||
Professional services | 35,991 | 26,413 | 66,399 | 58,537 | |||||||||||
Other | 17,567 | 21,146 | 36,165 | 40,352 | |||||||||||
Total non-compensation expenses | 256,598 | 212,591 | 499,473 | 423,733 | |||||||||||
Total non-interest expenses | 700,692 | 663,113 | 1,399,200 | 1,334,427 | |||||||||||
Earnings before income taxes | 121,865 | 116,181 | 244,603 | 240,380 | |||||||||||
Income tax expense | 23,857 | 46,391 | 207,414 | 56,570 | |||||||||||
Net earnings | 98,008 | 69,790 | 37,189 | 183,810 | |||||||||||
Net earnings attributable to noncontrolling interests | 4 | 39 | 3 | 40 | |||||||||||
Net earnings attributable to Jefferies Group LLC | $ | 98,004 | $ | 69,751 | $ | 37,186 | $ | 183,770 | |||||||
See accompanying notes to consolidated financial statements.
3
JEFFERIES GROUP LLC AND SUBSIDIARIES
CONSOLIDATED STATEMENTS OF COMPREHENSIVE INCOME (UNAUDITED)
(In thousands)
Three Months Ended May 31, | Six Months Ended May 31, | ||||||||||||||
2018 | 2017 | 2018 | 2017 | ||||||||||||
Net earnings | $ | 98,008 | $ | 69,790 | $ | 37,189 | $ | 183,810 | |||||||
Other comprehensive income (loss), net of tax: | |||||||||||||||
Currency translation and other adjustments (1) | (61,188 | ) | 25,882 | (45,169 | ) | 23,352 | |||||||||
Changes in instrument specific credit risk (2) | 26,017 | (2,683 | ) | 7,904 | (12,378 | ) | |||||||||
Cash flow hedges (3) | 251 | — | 1,297 | — | |||||||||||
Total other comprehensive income (loss), net of tax (4) | (34,920 | ) | 23,199 | (35,968 | ) | 10,974 | |||||||||
Comprehensive income | 63,088 | 92,989 | 1,221 | 194,784 | |||||||||||
Net earnings attributable to noncontrolling interests | 4 | 39 | 3 | 40 | |||||||||||
Comprehensive income attributable to Jefferies Group LLC | $ | 63,084 | $ | 92,950 | $ | 1,218 | $ | 194,744 | |||||||
(1) | The amount during the six months ended May 31, 2018 includes $5.3 million related to the transfer of the German Pension Plan, which was reclassified to Compensation and benefits expenses within the Consolidated Statements of Earnings and ($0.8) million related to the Tax Cuts and Jobs Act (the “Tax Act”), which was reclassified to Member’s paid-in capital. Refer to Note 3, Accounting Developments for further information. The amounts during the three and six months ended May 31, 2018 include a gain of $20.5 million related to foreign currency gains, which was reclassified to Other income within the Consolidated Statements of Earnings. |
(2) | The amount includes income tax expense of approximately $8.8 million and $10.7 million for the three and six months ended May 31, 2018 and income tax benefit of approximately $1.1 million and $7.4 million for the three and six months ended May 31, 2017. The amounts during the three and six months ended May 31, 2018 also include a gain of $0.3 million related to changes in instrument specific credit risk, which was reclassified to Principal transaction revenues within the Consolidated Statements of Earnings. The amount during the six months ended May 31, 2018 includes ($6.5) million related to the Tax Act, which was reclassified to Member’s paid-in capital. Refer to Note 3, Accounting Developments for further information. |
(3) | The amount during the six months ended May 31, 2018 includes ($0.2) million related to the Tax Act, which was reclassified to Member’s paid-in capital. Refer to Note 3, Accounting Developments for further information. |
(4) | None of the components of other comprehensive income (loss) are attributable to noncontrolling interests. |
See accompanying notes to consolidated financial statements.
4
JEFFERIES GROUP LLC AND SUBSIDIARIES
CONSOLIDATED STATEMENTS OF CHANGES IN EQUITY (UNAUDITED)
(In thousands)
Six Months Ended May 31, 2018 | Year Ended November 30, 2017 | ||||||
Member’s paid-in capital: | |||||||
Balance, beginning of period | $ | 5,895,601 | $ | 5,538,103 | |||
Cumulative effect of the adoption of the new revenue standard, net of tax | (6,121 | ) | — | ||||
Net earnings attributable to Jefferies Group LLC | 37,186 | 357,498 | |||||
Distribution to Jefferies Financial Group Inc. | (218,593 | ) | — | ||||
Tax Cuts and Jobs Act adjustment | 7,555 | — | |||||
Balance, end of period | $ | 5,715,628 | $ | 5,895,601 | |||
Accumulated other comprehensive income (loss), net of tax (1) (2): | |||||||
Balance, beginning of period | $ | (136,779 | ) | $ | (168,157 | ) | |
Currency adjustments (3) | (49,667 | ) | 53,396 | ||||
Changes in instrument specific credit risk (4) | 7,904 | (21,394 | ) | ||||
Cash flow hedges (5) | 1,297 | (936 | ) | ||||
Pension adjustments (6) | 4,498 | 312 | |||||
Balance, end of period | $ | (172,747 | ) | $ | (136,779 | ) | |
Total Jefferies Group LLC member’s equity | $ | 5,542,881 | $ | 5,758,822 | |||
Noncontrolling interests: | |||||||
Balance, beginning of period | $ | 737 | $ | 651 | |||
Net earnings attributable to noncontrolling interests | 3 | 86 | |||||
Contributions | 10 | — | |||||
Balance, end of period | $ | 750 | $ | 737 | |||
Total equity | $ | 5,543,631 | $ | 5,759,559 | |||
(1) | The components of other comprehensive income (loss) are attributable to Jefferies Group LLC. None of the components of other comprehensive income (loss) are attributable to noncontrolling interests. |
(2) | There were no material reclassifications out of Accumulated other comprehensive income (loss) during the year ended November 30, 2017. |
(3) | The amount during the six months ended May 31, 2018 includes a gain of $20.5 million related to foreign currency gains, which was reclassified to earnings. |
(4) | The amount during the six months ended May 31, 2018 includes a gain of $0.3 million related to changes in instrument specific credit risk, which was reclassified to earnings, and ($6.5) million related to the Tax Act, which was reclassified to Member’s paid-in capital. Refer to Note 3, Accounting Developments for further information. |
(5) | The amount during the six months ended May 31, 2018 includes ($0.2) million related to the Tax Act, which was reclassified to Member’s paid-in capital. Refer to Note 3, Accounting Developments for further information. |
(6) | The amount during the six months ended May 31, 2018 includes $5.3 million related to the transfer of the German Pension Plan, which was reclassified to earnings, and ($0.8) million related to the Tax Act, which was reclassified to Member’s paid-in capital. Refer to Note 3, Accounting Developments for further information. |
See accompanying notes to consolidated financial statements.
5
JEFFERIES GROUP LLC AND SUBSIDIARIES
CONSOLIDATED STATEMENTS OF CASH FLOWS (UNAUDITED)
(In thousands)
Six Months Ended May 31, | |||||||
2018 | 2017 | ||||||
Cash flows from operating activities: | |||||||
Net earnings | $ | 37,189 | $ | 183,810 | |||
Adjustments to reconcile net earnings to net cash provided by (used in) operating activities: | |||||||
Depreciation and amortization | 5,743 | 752 | |||||
Income on loans to and investments in related parties | (24,834 | ) | (54,495 | ) | |||
Distributions received on investments in related parties | 1,910 | 6,189 | |||||
Other adjustments | (94,524 | ) | 40,160 | ||||
Net change in assets and liabilities: | |||||||
Securities deposited with clearing and depository organizations | 64,880 | 108 | |||||
Receivables: | |||||||
Brokers, dealers and clearing organizations | 10,499 | (832,729 | ) | ||||
Customers | (413,508 | ) | (372,368 | ) | |||
Fees, interest and other | 9,390 | (87,192 | ) | ||||
Securities borrowed | 97,924 | (143,554 | ) | ||||
Financial instruments owned | (1,594,717 | ) | (8,909 | ) | |||
Securities purchased under agreements to resell | (176,922 | ) | (452,154 | ) | |||
Other assets | 76,192 | (109,591 | ) | ||||
Payables: | |||||||
Brokers, dealers and clearing organizations | 520,766 | (969,230 | ) | ||||
Customers | 489,060 | 300,774 | |||||
Securities loaned | (266,028 | ) | 616,701 | ||||
Financial instruments sold, not yet purchased | 812,496 | 598,801 | |||||
Securities sold under agreements to repurchase | 139,287 | 1,818,042 | |||||
Accrued expenses and other liabilities | (422,224 | ) | 116,605 | ||||
Net cash provided by (used in) operating activities | (727,421 | ) | 651,720 | ||||
Cash flows from investing activities: | |||||||
Contributions to loans to and investments in related parties | (1,906,071 | ) | (2,642,607 | ) | |||
Distributions from loans to and investments in related parties | 1,873,000 | 2,579,746 | |||||
Net payments on premises and equipment | (36,061 | ) | (39,918 | ) | |||
Cash received from contingent consideration | — | 1,250 | |||||
Net cash used in investing activities | (69,132 | ) | (101,529 | ) | |||
Continued on next page.
6
JEFFERIES GROUP LLC AND SUBSIDIARIES
CONSOLIDATED STATEMENTS OF CASH FLOWS – CONTINUED (UNAUDITED)
(In thousands)
Six Months Ended May 31, | |||||||
2018 | 2017 | ||||||
Cash flows from financing activities: | |||||||
Proceeds from short-term borrowings | 372,481 | 133,928 | |||||
Payments on short-term borrowings | (297,708 | ) | (219,086 | ) | |||
Proceeds from issuance of long-term debt, net of issuance costs | 1,321,714 | 866,600 | |||||
Repayment of long-term debt | (1,022,615 | ) | (75,730 | ) | |||
Dividend distribution | (200,000 | ) | — | ||||
Net proceeds from (payments on) other secured financings | 246,714 | (369,626 | ) | ||||
Net change in bank overdrafts | (2,722 | ) | (1,544 | ) | |||
Proceeds from noncontrolling interests | 10 | — | |||||
Net cash provided by financing activities | 417,874 | 334,542 | |||||
Effect of exchange rate changes on cash, cash equivalents and restricted cash | (9,370 | ) | 4,773 | ||||
Net increase (decrease) in cash, cash equivalents and restricted cash | (388,049 | ) | 889,506 | ||||
Cash, cash equivalents and restricted cash at beginning of period | 5,642,776 | 4,286,513 | |||||
Cash, cash equivalents and restricted cash at end of period | $ | 5,254,727 | $ | 5,176,019 | |||
Supplemental disclosures of cash flow information: | |||||||
Cash paid during the period for | |||||||
Interest | $ | 608,178 | $ | 488,705 | |||
Income taxes, net | 115,748 | 3,576 | |||||
The following presents our cash, cash equivalents and restricted cash by category within the Consolidated Statements of Financial Condition (in thousands):
May 31, 2018 | November 30, 2017 | ||||||
Cash and cash equivalents | $ | 4,579,931 | $ | 5,164,492 | |||
Cash and securities segregated and on deposit for regulatory purposes with clearing and depository organizations | 674,796 | 478,284 | |||||
Total cash, cash equivalents and restricted cash | $ | 5,254,727 | $ | 5,642,776 | |||
See accompanying notes to consolidated financial statements.
7
JEFFERIES GROUP LLC AND SUBSIDIARIES
NOTES TO CONSOLIDATED FINANCIAL STATEMENTS
(Unaudited)
Index
Note | Page |
8
JEFFERIES GROUP LLC AND SUBSIDIARIES
NOTES TO CONSOLIDATED FINANCIAL STATEMENTS - CONTINUED
(Unaudited)
Note 1. Organization and Basis of Presentation
Organization
Jefferies Group LLC is the largest independent U.S-headquartered global full service, integrated securities and investment banking firm. The accompanying Consolidated Financial Statements represent the accounts of Jefferies Group LLC and all our subsidiaries (together “we” or “us”). The subsidiaries of Jefferies Group LLC include Jefferies LLC, Jefferies International Limited, Jefferies Hong Kong Limited, Jefferies Financial Services, Inc., Jefferies Funding LLC, Jefferies Leveraged Credit Products, LLC and all other entities in which we have a controlling financial interest or are the primary beneficiary.
Jefferies Group LLC is a direct wholly owned subsidiary of publicly traded Jefferies Financial Group Inc. (“Jefferies”), formerly known as Leucadia National Corporation. Jefferies does not guarantee any of our outstanding debt securities. Our 3.875% Convertible Senior Debentures due 2029 (principal amount of $345.0 million) (the “debentures”) were convertible into Jefferies common shares. At November 22, 2017, all of the remaining convertible debentures were called for optional redemption and were redeemed on January 5, 2018 (see Note 12, Long-Term Debt, for further details). Jefferies Group LLC is a Securities and Exchange Commission (“SEC”) reporting company, filing annual, quarterly and periodic financial reports. Richard Handler, our Chief Executive Officer and Chairman, is the Chief Executive Officer of Jefferies, as well as a Director of Jefferies. Brian P. Friedman, our Chairman of the Executive Committee, is Jefferies’ President and a Director of Jefferies.
In connection with the acquisition of Jefferies Bache from Prudential on July 1, 2011, we acquired a defined benefits pension plan located in Germany (the “German Pension Plan”) for the benefit of eligible employees of Jefferies Bache in that territory. On December 28, 2017, a Liquidation Insurance Contract was entered into with Generali Lebensversicherung AG (“Generali”) to transfer the defined benefit pension obligations and insurance contracts to Generali, for approximately €6.5 million, which was paid in January 2018 and released us from any and all obligations under the German Pension Plan. In addition, on December 28, 2017, we entered into an agreement with Prudential under which we received $3.25 million as consideration for the release of Prudential by us from their indemnity relating to the German Pension Plan defined benefit pension obligations.
We operate in two reportable business segments, Capital Markets and Asset Management. For further information on our reportable business segments, refer to Note 18, Segment Reporting.
Basis of Presentation
The accompanying consolidated financial statements have been prepared in accordance with U.S. generally accepted accounting principles (“U.S. GAAP”) and should be read in conjunction with our consolidated financial statements and notes thereto included in our Annual Report on Form 10-K for the year ended November 30, 2017. Certain footnote disclosures included in our Annual Report on Form 10-K for the year ended November 30, 2017 have been condensed or omitted from the consolidated financial statements as they are not required for interim reporting under U.S. GAAP. The Consolidated Financial Statements reflect all adjustments of a normal, recurring nature that are, in the opinion of management, necessary for the fair presentation of the results for the interim period. The results presented in the Consolidated Financial Statements for interim periods are not necessarily indicative of the results for the entire year.
We have made a number of estimates and assumptions relating to the reporting of assets and liabilities, the disclosure of contingent assets and liabilities and the reported amounts of revenues and expenses during the reporting period to prepare these consolidated financial statements in conformity with U.S. GAAP. The most important of these estimates and assumptions relate to fair value measurements, compensation and benefits, goodwill and intangible assets, the ability to realize certain deferred tax assets and the recognition and measurement of uncertain tax positions. Although these and other estimates and assumptions are based on the best available information, actual results could be materially different from these estimates.
Consolidation
Our policy is to consolidate all entities that we control by ownership of a majority of the outstanding voting stock. In addition, we consolidate entities that meet the definition of a variable interest entity (“VIE”) for which we are the primary beneficiary. The primary beneficiary is the party who has the power to direct the activities of a VIE that most significantly impact the entity’s economic performance and who has an obligation to absorb losses of the entity or a right to receive benefits from the entity that could potentially be significant to the entity. For consolidated entities that are less than wholly owned, the third-party’s holding of equity interest is presented as Noncontrolling interests in our Consolidated Statements of Financial Condition and Consolidated Statements of Changes in Equity. The portion of net earnings attributable to the noncontrolling interests is presented as Net earnings (loss) to noncontrolling interests in our Consolidated Statements of Earnings.
9
JEFFERIES GROUP LLC AND SUBSIDIARIES
NOTES TO CONSOLIDATED FINANCIAL STATEMENTS - CONTINUED
(Unaudited)
In situations in which we have significant influence, but not control, of an entity that does not qualify as a VIE, we apply either the equity method of accounting or fair value accounting pursuant to the fair value option election under U.S. GAAP, with our portion of net earnings or gains and losses recorded in Other revenues or Principal transaction revenues, respectively. We also have formed nonconsolidated investment vehicles with third-party investors that are typically organized as partnerships or limited liability companies and are carried at fair value. We act as general partner or managing member for these investment vehicles and have generally provided the third-party investors with termination or “kick-out” rights.
Intercompany accounts and transactions are eliminated in consolidation.
Changes to the Consolidated Statements of Operations
We have reorganized the presentation of our gains and losses generated from our capital invested in asset management funds managed by us and related parties in the first quarter of 2018. This was previously presented as Asset management: Investment income (loss) from investments in managed funds and is now presented within Principal transactions revenues.
Changes to the Consolidated Statements of Cash Flows
In the first quarter of 2018, we made certain changes to the presentation of our Consolidated Statements of Cash Flows in order to net certain Short-term borrowings, primarily related to revolving intraday credit advances. Refer to Note 11, Short-Term Borrowings, for further information. The changes had the impact of reducing Proceeds from short-term borrowings by $16,753.5 million and increasing Payments on short-term borrowings by $16,753.5 million for the six month periods ended May 31, 2017. There was no change to the total Net cash provided by financing activities. We do not believe these changes are material to our Consolidated Statements of Cash Flows.
Note 2. Summary of Significant Accounting Policies
For a detailed discussion about the Company’s significant accounting policies, see Note 2, Summary of Significant Accounting Policies, in our consolidated financial statements included in Part II, Item 8 of our Annual Report on Form 10-K for the year ended November 30, 2017.
During the six months ended May 31, 2018, other than the following, there were no significant changes made to the Company’s significant accounting policies. The accounting policy changes are attributable to the adoption of the Financial Accounting Standards Board (“FASB”) Accounting Standards Update (“ASU”) No. 2014-09, Revenue from Contracts with Customers (the “new revenue standard” or Accounting Standards Codification 606, (“ASC 606”)) on December 1, 2017. These revenue recognition policy updates are applied prospectively in our financial statements from December 1, 2017 forward. Reported financial information for the historical comparable period was not revised and continues to be reported under the accounting standards in effect during the historical periods.
Investment Banking Revenues:
• | Advisory fees from mergers and acquisitions engagements are recognized at a point in time when the related transaction is completed. |
• | Expenses associated with investment banking advisory engagements are deferred only to the extent they are explicitly reimbursable by the client and the related revenue is recognized at a point in time. All other investment banking advisory related expenses, including expenses incurred related to restructuring advisory engagements, are expensed as incurred. |
• | All investment banking expenses are recognized within their respective expense category on the Consolidated Statements of Earnings and any expenses reimbursed by clients are recognized as Investment banking revenues. |
Asset Management Fees:
• | Performance fee revenue is generally recognized only at the end of the performance period to the extent that the benchmark return has been met. |
Refer to Note 3, Accounting Developments, and Note 13, Revenues From Contracts With Customers, for further information.
10
JEFFERIES GROUP LLC AND SUBSIDIARIES
NOTES TO CONSOLIDATED FINANCIAL STATEMENTS - CONTINUED
(Unaudited)
Note 3. Accounting Developments
Accounting Standards to be Adopted in Future Periods
Derivatives and Hedging. In August 2017, the FASB issued ASU No. 2017-12, Derivatives and Hedging: Targeted Improvements to Accounting for Hedging Activities. The objective of the guidance is to improve the financial reporting of hedging relationships to better portray the economic results of an entity’s risk management activities in its financial statements. The guidance is effective in the first quarter of fiscal 2019. We do not believe the new guidance will have a material impact on our consolidated financial statements.
Stock Compensation. In May 2017, the FASB issued ASU No. 2017-09, Compensation—Stock Compensation: Scope of Modification Accounting. The guidance provides clarity and reduces diversity in practice and cost and complexity when accounting for a change to the terms or conditions of a share-based payment award. The guidance is effective in the first quarter of fiscal 2019 and early adoption is permitted. We do not believe the new guidance will have a material impact on our consolidated financial statements.
Goodwill. In January 2017, the FASB issued ASU No. 2017-04, Simplifying the Test for Goodwill Impairment, which simplifies goodwill impairment testing. The guidance is effective in the first quarter of fiscal 2021. We do not believe the new guidance will have a material impact on our consolidated financial statements.
Financial Instruments—Credit Losses. In June 2016, the FASB issued ASU No. 2016-13, Measurement of Credit Losses on Financial Instruments. The guidance provides for estimating credit losses on certain types of financial instruments by introducing an approach based on expected losses. The guidance is effective in the first quarter of fiscal 2021. We are currently evaluating the impact of the new guidance on our consolidated financial statements.
Leases. In February 2016, the FASB issued ASU No. 2016-02, Leases. The guidance affects the accounting for leases and provides for a lessee model that brings substantially all leases that are longer than one year onto the balance sheet, which will result in the recognition of a right of use asset and a corresponding lease liability. The right of use asset and lease liability will be measured initially using the present value of the remaining rental payments. This guidance change for leases where we are the lessee will require modifications to our current lease accounting systems and the determination of the present value of the remaining rental payments. A significant portion of the population of contracts that will be subject to recognition on our Consolidated Statements of Financial Condition have been identified; however, their initial measurement still remains under evaluation. We plan on adopting the guidance as of our first quarter of fiscal 2019 and are currently evaluating the impact of the new guidance on our consolidated financial statements.
Adopted Accounting Standards
Comprehensive Income. In February 2018, the FASB issued ASU No. 2018-02, Reclassification of Certain Tax Effects from Accumulated Other Comprehensive Income. The guidance allows companies the option to reclassify stranded taxes from Accumulated other comprehensive income to retained earnings due to the decrease in the Federal Statutory tax rate from 35% to 21% resulting from the Tax Act. The amount of the reclassification is the difference between the historical corporate income tax rate and the newly enacted corporate income tax rate. We early adopted this guidance as of February 28, 2018, resulting in a reclassification adjustment of $7.6 million related to unamortized pension liabilities, cash flow hedges and instrument specific credit risk in our consolidated financial statements.
Retirement Benefits. In March 2017, the FASB issued ASU No. 2017-07, Improving the Presentation of Net Periodic Pension Cost and Net Periodic Postretirement Benefit Cost. The guidance impacts the presentation of net periodic pension costs in the statement of income. We early adopted this guidance in the first quarter of fiscal 2018 and the adoption did not have a material impact on our Consolidated Statements of Earnings.
Statement of Cash Flows. In August 2016, the FASB issued ASU No. 2016-15, Classification of Certain Cash Receipts and Cash Payments (“ASU 2016-15”). The guidance adds or clarifies guidance on the classification of certain cash receipts and payments in the statement of cash flows. In November 2016, the FASB issued ASU No. 2016-18, Restricted Cash (“ASU 2016-18”), which requires that a statement of cash flows explain the change during the period in the total of cash, cash equivalents and amounts generally described as restricted cash or restricted cash equivalents. We adopted both ASUs in the first quarter of fiscal 2018. Prior periods were retrospectively adjusted to conform to the current period’s presentation. The adoption of ASU 2016-15 did not have a material impact on our Consolidated Statements of Cash Flows. Upon adoption of ASU 2016-18, we recorded an increase of $61.2 million in Net cash used for operating activities for the six months ended May 31, 2017 related to reclassifying the changes in our restricted cash balance from operating activities to the cash and cash equivalent balances within the Consolidated Statements of Cash Flows.
11
JEFFERIES GROUP LLC AND SUBSIDIARIES
NOTES TO CONSOLIDATED FINANCIAL STATEMENTS - CONTINUED
(Unaudited)
Financial Instruments. In January 2016, the FASB issued ASU No. 2016-01, Financial Instruments—Overall: Recognition and Measurement of Financial Assets and Financial Liabilities. The guidance affects the accounting for equity investments, financial liabilities under the fair value option and the presentation and disclosure requirements of financial instruments. We adopted the guidance on financial liabilities under the fair value option in the first quarter of fiscal 2016 and we adopted the remaining guidance in the first quarter of fiscal 2018. The adoption of this accounting guidance did not have a material effect on our consolidated financial statements.
Revenue Recognition. We adopted the new revenue standard on December 1, 2017 and recognized a reduction of $6.1 million after-tax to beginning Member’s paid-in capital as the cumulative effect of adoption of this accounting change. The impact of adoption is primarily related to investment banking expenses that were deferred as of November 30, 2017 under the previously existing accounting guidance, which would have been expensed in prior periods under the new revenue standard, and investment banking revenues that were previously recognized in prior periods, which would have been deferred as of November 30, 2017 under the new revenue standard. We elected to adopt the new guidance using a modified retrospective approach applied to contracts that were not completed as of December 1, 2017. Accordingly, the new revenue standard is applied prospectively in our financial statements from December 1, 2017 forward and reported financial information for historical comparable periods is not revised and continues to be reported under the accounting standards in effect during those historical periods.
The new revenue guidance does not apply to revenue associated with financial instruments, including loans and securities that are accounted for under other U.S. GAAP, and as a result, did not have an impact on the elements of our Consolidated Statements of Earnings most closely associated with financial instruments, including Principal transaction revenues, Interest income and Interest expense. The new revenue standard primarily impacts the following of our revenue recognition and presentation accounting policies:
• | Investment Banking Revenues. Advisory fees from mergers and acquisitions engagements are recognized at a point in time when the related transaction is completed, as the performance obligation is to successfully broker a specific transaction. |
• | Certain Capital Markets Revenues. Revenues associated with price stabilization activities as part of a securities underwriting were historically recognized as part of Investment banking revenues. Under the new revenue standard, revenue from these activities is recognized within Principal transaction revenues, as these revenues are not considered to be within the scope of the new standard. |
• | Investment Banking Advisory Expenses. Historically, expenses associated with investment banking advisory assignments were deferred until reimbursed by the client, the related fee revenue is recognized or the engagement is otherwise concluded. Under the new revenue standard, expenses are deferred only to the extent they are explicitly reimbursable by the client and the related revenue is recognized at a point in time. All other investment banking advisory related expenses, including expenses incurred related to restructuring assignments, are expensed as incurred. |
• | Investment Banking Underwriting and Advisory Expenses. Expenses have historically been recorded net of client reimbursements and/or netted against revenues. Under the new revenue standard, all investment banking expenses will be recognized within their respective expense category on the Consolidated Statements of Earnings and any expense reimbursements will be recognized as Investment banking revenues (i.e., expenses are no longer recorded net of client reimbursements and are not netted against revenues). |
• | Asset Management Fees. In certain asset management fee arrangements, we receive performance-based fees, which vary with performance or, in certain cases, are earned when the return on assets under management exceed certain benchmark returns or other performance targets. Historically, performance fees have been accrued (or reversed) quarterly based on measuring performance to date versus any relevant benchmark return hurdles stated in the investment management agreement. Under the new revenue standard, performance fees are considered variable as they are subject to fluctuation (e.g., based on market performance) and/or are contingent on a future event during the measurement period (e.g., exceeding a specified benchmark index) and are recognized only to the extent it is probable that a significant reversal in the amount of cumulative revenue recognized will not occur when the uncertainty is resolved. Accordingly, performance fee revenue will generally be recognized only at the end of the performance period to the extent that the benchmark return has been met. |
12
JEFFERIES GROUP LLC AND SUBSIDIARIES
NOTES TO CONSOLIDATED FINANCIAL STATEMENTS - CONTINUED
(Unaudited)
There was no significant impact as a result of applying the new revenue standard to our consolidated financial statements for the three and six months ended May 31, 2018, except as it relates to the presentation of investment banking expenses. The table below presents the impact to revenues and expenses as a result of the change in presentation of investment banking expenses (in thousands):
Three Months Ended May 31, 2018 | Six Months Ended May 31, 2018 | ||||||||||||||||||||||
As Reported | ASC 606 Impact | Adjusted (1) | As Reported | ASC 606 Impact | Adjusted (1) | ||||||||||||||||||
Revenues: | |||||||||||||||||||||||
Investment banking | $ | 500,297 | $ | 32,342 | $ | 467,955 | $ | 940,288 | $ | 64,827 | $ | 875,461 | |||||||||||
Total revenues | 1,156,809 | 32,342 | 1,124,467 | 2,243,404 | 64,827 | 2,178,577 | |||||||||||||||||
Net revenues | 822,557 | 32,342 | 790,215 | 1,643,803 | 64,827 | 1,578,976 | |||||||||||||||||
Non-interest expenses: | |||||||||||||||||||||||
Underwriting costs | 13,029 | 13,029 | — | 27,304 | 27,304 | — | |||||||||||||||||
Technology and communications | 76,381 | 111 | 76,270 | 145,458 | 214 | 145,244 | |||||||||||||||||
Business development | 42,393 | 17,998 | 24,395 | 84,500 | 35,241 | 49,259 | |||||||||||||||||
Professional services | 35,991 | 856 | 35,135 | 66,399 | 1,567 | 64,832 | |||||||||||||||||
Other expenses | 17,567 | 348 | 17,219 | 36,165 | 501 | 35,664 | |||||||||||||||||
Total non-compensation expenses | 256,598 | 32,342 | 224,256 | 499,473 | 64,827 | 434,646 | |||||||||||||||||
Total non-interest expenses | 700,692 | 32,342 | 668,350 | 1,399,200 | 64,827 | 1,334,373 | |||||||||||||||||
(1) | The amounts reflect each affected financial statement line item as they would have been reported under U.S. GAAP, prior to the adoption of the new revenue standard. |
13
JEFFERIES GROUP LLC AND SUBSIDIARIES
NOTES TO CONSOLIDATED FINANCIAL STATEMENTS - CONTINUED
(Unaudited)
Note 4. Fair Value Disclosures
The following is a summary of our financial assets and liabilities that are accounted for at fair value on a recurring basis, excluding Investments at fair value based on net asset value (“NAV”) of $333.2 million and $215.4 million at May 31, 2018 and November 30, 2017, respectively, by level within the fair value hierarchy (in thousands):
May 31, 2018 | |||||||||||||||||||
Level 1 | Level 2 | Level 3 | Counterparty and Cash Collateral Netting (1) | Total | |||||||||||||||
Assets: | |||||||||||||||||||
Financial instruments owned: | |||||||||||||||||||
Corporate equity securities | $ | 1,567,962 | $ | 70,011 | $ | 42,901 | $ | — | $ | 1,680,874 | |||||||||
Corporate debt securities | 821 | 2,710,178 | 28,066 | — | 2,739,065 | ||||||||||||||
Collateralized debt obligations and collateralized loan obligations | — | 82,399 | 30,603 | — | 113,002 | ||||||||||||||
U.S. government and federal agency securities | 1,971,180 | 40,450 | — | — | 2,011,630 | ||||||||||||||
Municipal securities | — | 827,478 | — | — | 827,478 | ||||||||||||||
Sovereign obligations | 1,332,770 | 1,129,682 | — | — | 2,462,452 | ||||||||||||||
Residential mortgage-backed securities | — | 2,037,431 | 3,655 | — | 2,041,086 | ||||||||||||||
Commercial mortgage-backed securities | — | 941,432 | 27,239 | — | 968,671 | ||||||||||||||
Other asset-backed securities | — | 281,821 | 55,535 | — | 337,356 | ||||||||||||||
Loans and other receivables | — | 1,771,853 | 64,036 | — | 1,835,889 | ||||||||||||||
Derivatives (2) | 10,298 | 3,354,899 | 5,743 | (3,095,476 | ) | 275,464 | |||||||||||||
Investments at fair value | — | — | 79,488 | — | 79,488 | ||||||||||||||
Total financial instruments owned, excluding Investments at fair value based on NAV | $ | 4,883,031 | $ | 13,247,634 | $ | 337,266 | $ | (3,095,476 | ) | $ | 15,372,455 | ||||||||
Liabilities: | |||||||||||||||||||
Financial instruments sold, not yet purchased: | |||||||||||||||||||
Corporate equity securities | $ | 1,412,707 | $ | 4,313 | $ | 87 | $ | — | $ | 1,417,107 | |||||||||
Corporate debt securities | — | 1,627,990 | 522 | — | 1,628,512 | ||||||||||||||
U.S. government and federal agency securities | 1,704,473 | — | — | — | 1,704,473 | ||||||||||||||
Sovereign obligations | 1,518,030 | 1,079,417 | — | — | 2,597,447 | ||||||||||||||
Loans | — | 1,106,907 | 12,881 | — | 1,119,788 | ||||||||||||||
Derivatives | 10,818 | 3,657,065 | 11,617 | (3,231,934 | ) | 447,566 | |||||||||||||
Total financial instruments sold, not yet purchased | $ | 4,646,028 | $ | 7,475,692 | $ | 25,107 | $ | (3,231,934 | ) | $ | 8,914,893 | ||||||||
Short-term borrowings | $ | — | $ | 68,818 | $ | — | $ | — | $ | 68,818 | |||||||||
Long-term debt | $ | — | $ | 547,630 | $ | 160,626 | $ | — | $ | 708,256 | |||||||||
(1) | Represents counterparty and cash collateral netting across the levels of the fair value hierarchy for positions with the same counterparty. |
(2) | During the six months ended May 31, 2018, we transferred from Level 1 to Level 2 $20.8 million of listed options included in Financial instruments owned—Derivatives, which are measured based on broker quotes or mid-market valuations. There were no other material transfers of our financial assets and liabilities between Level 1 and Level 2 for the three and six months ended May 31, 2018 and 2017. |
14
JEFFERIES GROUP LLC AND SUBSIDIARIES
NOTES TO CONSOLIDATED FINANCIAL STATEMENTS - CONTINUED
(Unaudited)
November 30, 2017 | |||||||||||||||||||
Level 1 | Level 2 | Level 3 | Counterparty and Cash Collateral Netting (1) | Total | |||||||||||||||
Assets: | |||||||||||||||||||
Financial instruments owned: | |||||||||||||||||||
Corporate equity securities | $ | 1,801,453 | $ | 57,091 | $ | 22,009 | $ | — | $ | 1,880,553 | |||||||||
Corporate debt securities | — | 3,261,300 | 26,036 | — | 3,287,336 | ||||||||||||||
Collateralized debt obligations and collateralized loan obligations | — | 139,166 | 30,004 | — | 169,170 | ||||||||||||||
U.S. government and federal agency securities | 1,269,230 | 39,443 | — | — | 1,308,673 | ||||||||||||||
Municipal securities | — | 710,513 | — | — | 710,513 | ||||||||||||||
Sovereign obligations | 1,381,552 | 1,035,907 | — | — | 2,417,459 | ||||||||||||||
Residential mortgage-backed securities | — | 1,453,294 | 26,077 | — | 1,479,371 | ||||||||||||||
Commercial mortgage-backed securities | — | 508,115 | 12,419 | — | 520,534 | ||||||||||||||
Other asset-backed securities | — | 217,111 | 61,129 | — | 278,240 | ||||||||||||||
Loans and other receivables | — | 1,620,581 | 47,304 | — | 1,667,885 | ||||||||||||||
Derivatives | 160,168 | 3,248,586 | 9,295 | (3,254,216 | ) | 163,833 | |||||||||||||
Investments at fair value | — | 946 | 93,454 | — | 94,400 | ||||||||||||||
Total financial instruments owned, excluding Investments at fair value based on NAV | $ | 4,612,403 | $ | 12,292,053 | $ | 327,727 | $ | (3,254,216 | ) | $ | 13,977,967 | ||||||||
Securities received as collateral | $ | 103 | $ | — | $ | — | $ | — | $ | 103 | |||||||||
Liabilities: | |||||||||||||||||||
Financial instruments sold, not yet purchased: | |||||||||||||||||||
Corporate equity securities | $ | 1,456,675 | $ | 32,122 | $ | 48 | $ | — | $ | 1,488,845 | |||||||||
Corporate debt securities | — | 1,688,825 | 522 | — | 1,689,347 | ||||||||||||||
U.S. government and federal agency securities | 1,430,737 | — | — | — | 1,430,737 | ||||||||||||||
Sovereign obligations | 1,216,643 | 956,992 | — | — | 2,173,635 | ||||||||||||||
Commercial mortgage-backed securities | — | — | 105 | — | 105 | ||||||||||||||
Loans | — | 1,148,824 | 3,486 | — | 1,152,310 | ||||||||||||||
Derivatives | 247,919 | 3,399,239 | 16,041 | (3,426,249 | ) | 236,950 | |||||||||||||
Total financial instruments sold, not yet purchased | $ | 4,351,974 | $ | 7,226,002 | $ | 20,202 | $ | (3,426,249 | ) | $ | 8,171,929 | ||||||||
Short-term borrowings | $ | — | $ | 23,324 | $ | — | $ | — | $ | 23,324 | |||||||||
Long-term debt | $ | — | $ | 606,956 | $ | — | $ | — | $ | 606,956 | |||||||||
Obligation to return securities received as collateral | $ | 103 | $ | — | $ | — | $ | — | $ | 103 | |||||||||
(1) | Represents counterparty and cash collateral netting across the levels of the fair value hierarchy for positions with the same counterparty. |
The following is a description of the valuation basis, including valuation techniques and inputs, used in measuring our financial assets and liabilities that are accounted for at fair value on a recurring basis:
Corporate Equity Securities
• | Exchange-Traded Equity Securities: Exchange-traded equity securities are measured based on quoted closing exchange prices, which are generally obtained from external pricing services, and are categorized within Level 1 of the fair value hierarchy, otherwise they are categorized within Level 2 of the fair value hierarchy. To the extent these securities are actively traded, valuation adjustments are not applied. |
15
JEFFERIES GROUP LLC AND SUBSIDIARIES
NOTES TO CONSOLIDATED FINANCIAL STATEMENTS - CONTINUED
(Unaudited)
• | Non-Exchange-Traded Equity Securities: Non-exchange-traded equity securities are measured primarily using broker quotations, pricing data from external pricing services and prices observed from recently executed market transactions and are categorized within Level 2 of the fair value hierarchy. Where such information is not available, non-exchange-traded equity securities are categorized within Level 3 of the fair value hierarchy and measured using valuation techniques involving quoted prices of or market data for comparable companies, similar company ratios and multiples (e.g., price/Earnings before interest, taxes, depreciation and amortization (“EBITDA”), price/book value), discounted cash flow analyses and transaction prices observed from subsequent financing or capital issuance by the company. When using pricing data of comparable companies, judgment must be applied to adjust the pricing data to account for differences between the measured security and the comparable security (e.g., issuer market capitalization, yield, dividend rate, geographical concentration). |
• | Equity Warrants: Non-exchange-traded equity warrants are measured primarily using pricing data from external pricing services, prices observed from recently executed market transactions and broker quotations are categorized within Level 2 of the fair value hierarchy. Where such information is not available, non-exchange-traded equity warrants are generally categorized within Level 3 of the fair value hierarchy and are measured using the Black-Scholes model with key inputs impacting the valuation including the underlying security price, implied volatility, dividend yield, interest rate curve, strike price and maturity date. |
Corporate Debt Securities
• | Corporate Bonds: Corporate bonds are measured primarily using pricing data from external pricing services and broker quotations, where available, prices observed from recently executed market transactions and bond spreads or credit default swap spreads of the issuer adjusted for basis differences between the swap curve and the bond curve. Corporate bonds measured using these valuation methods are categorized within Level 2 of the fair value hierarchy. If broker quotes, pricing data or spread data is not available, alternative valuation techniques are used including cash flow models incorporating interest rate curves, single name or index credit default swap curves for comparable issuers and recovery rate assumptions. Corporate bonds measured using alternative valuation techniques are categorized within Level 3 of the fair value hierarchy and are a limited portion of our corporate bonds. |
• | High Yield Corporate and Convertible Bonds: A significant portion of our high yield corporate and convertible bonds are categorized within Level 2 of the fair value hierarchy and are measured primarily using broker quotations and pricing data from external pricing services, where available, and prices observed from recently executed market transactions of institutional size. Where pricing data is less observable, valuations are categorized within Level 3 and are based on pending transactions involving the issuer or comparable issuers, prices implied from an issuer’s subsequent financing or recapitalization, models incorporating financial ratios and projected cash flows of the issuer and market prices for comparable issuers. |
Collateralized Debt Obligations and Collateralized Loan Obligations
Collateralized debt obligations (“CDOs”) and collateralized loan obligations (“CLOs”) are measured based on prices observed from recently executed market transactions of the same or similar security or based on valuations received from third party brokers or data providers and are categorized within Level 2 or Level 3 of the fair value hierarchy depending on the observability and significance of the pricing inputs. Valuation that is based on recently executed market transactions of similar securities incorporates additional review and analysis of pricing inputs and comparability criteria, including, but not limited to, collateral type, tranche type, rating, origination year, prepayment rates, default rates and loss severity.
U.S. Government and Federal Agency Securities
• | U.S. Treasury Securities: U.S. Treasury securities are measured based on quoted market prices and categorized within Level 1 of the fair value hierarchy. |
• | U.S. Agency Debt Securities: Callable and non-callable U.S. agency debt securities are measured primarily based on quoted market prices obtained from external pricing services and are generally categorized within Level 1 or Level 2 of the fair value hierarchy. |
Municipal Securities
Municipal securities are measured based on quoted prices obtained from external pricing services and are generally categorized within Level 2 of the fair value hierarchy.
16
JEFFERIES GROUP LLC AND SUBSIDIARIES
NOTES TO CONSOLIDATED FINANCIAL STATEMENTS - CONTINUED
(Unaudited)
Sovereign Obligations
Sovereign government obligations are measured based on quoted market prices obtained from external pricing services, where available, or recently executed independent transactions of comparable size. To the extent external price quotations are not available or recent transactions have not been observed, valuation techniques incorporating interest rate yield curves and country spreads for bonds of similar issuers, seniority and maturity are used to determine fair value of sovereign bonds or obligations. Sovereign government obligations are classified in Level 1 or Level 2 of the fair value hierarchy, primarily based on the country of issuance.
Residential Mortgage-Backed Securities
• | Agency Residential Mortgage-Backed Securities (“RMBS”): Agency RMBS include mortgage pass-through securities (fixed and adjustable rate), collateralized mortgage obligations and principal-only securities and are generally measured using market price quotations from external pricing services and categorized within Level 2 of the fair value hierarchy. |
• | Agency Residential Interest-Only and Inverse Interest-Only Securities: The fair value is estimated using expected future cash flow techniques that incorporate prepayment models and other prepayment assumptions to amortize the underlying mortgage loan collateral. We use prices observed from recently executed transactions to develop market-clearing spread and yield curve assumptions. Valuation inputs with regard to the underlying collateral incorporate weighted average coupon, loan-to-value, credit scores, geographic location, maximum and average loan size, originator, servicer and weighted average loan age. Agency Residential Interest-Only and Inverse Interest-Only Securities are categorized within Level 2 of the fair value hierarchy. We also use vendor data in developing our assumptions, as appropriate. |
• | Non-Agency RMBS: The fair value of non-agency RMBS is determined primarily using discounted cash flow methodologies and securities are categorized within Level 2 or Level 3 of the fair value hierarchy based on the observability and significance of the pricing inputs used. Performance attributes of the underlying mortgage loans are evaluated to estimate pricing inputs, such as prepayment rates, default rates and the severity of credit losses. Attributes of the underlying mortgage loans that affect the pricing inputs include, but are not limited to, weighted average coupon; average and maximum loan size; loan-to-value; credit scores; documentation type; geographic location; weighted average loan age; originator; servicer; historical prepayment, default and loss severity experience of the mortgage loan pool; and delinquency rate. Yield curves used in the discounted cash flow models are based on observed market prices for comparable securities and published interest rate data to estimate market yields. In addition, broker quotes, where available, are also referenced to compare prices primarily on interest-only securities. |
Commercial Mortgage-Backed Securities
• | Agency Commercial Mortgage-Backed Securities (“CMBS”): Government National Mortgage Association (“GNMA”) project loan bonds are measured based on inputs corroborated from and benchmarked to observed prices of recent securitization transactions of similar securities with adjustments incorporating an evaluation of various factors, including prepayment speeds, default rates and cash flow structures, as well as the likelihood of pricing levels in the current market environment. Federal National Mortgage Association (“FNMA”) Delegated Underwriting and Servicing (“DUS”) mortgage-backed securities are generally measured by using prices observed from recently executed market transactions to estimate market-clearing spread levels for purposes of estimating fair value. GNMA project loan bonds and FNMA DUS mortgage-backed securities are categorized within Level 2 of the fair value hierarchy. |
• | Non-Agency CMBS: Non-agency CMBS are measured using pricing data obtained from external pricing services and prices observed from recently executed market transactions and are categorized within Level 2 and Level 3 of the fair value hierarchy. |
Other Asset-Backed Securities
Other asset-backed securities (“ABS”) include, but are not limited to, securities backed by auto loans, credit card receivables, student loans and other consumer loans and are categorized within Level 2 and Level 3 of the fair value hierarchy. Valuations are primarily determined using pricing data obtained from external pricing services and broker quotes and prices observed from recently executed market transactions.
Loans and Other Receivables
• | Corporate Loans: Corporate loans categorized within Level 2 of the fair value hierarchy are measured based on market price quotations where market price quotations from external pricing services are supported by transaction data. Corporate loans categorized within Level 3 of the fair value hierarchy are measured based on price quotations that are considered to be less transparent, market prices for debt securities of the same creditor and estimates of future cash flow incorporating assumptions regarding creditor default and recovery rates and consideration of the issuer’s capital structure. |
17
JEFFERIES GROUP LLC AND SUBSIDIARIES
NOTES TO CONSOLIDATED FINANCIAL STATEMENTS - CONTINUED
(Unaudited)
• | Participation Certificates in Agency Residential Loans: Valuations of participation certificates in agency residential loans are based on observed market prices of recently executed purchases and sales of similar loans and data provider pricing. The loan participation certificates are categorized within Level 2 of the fair value hierarchy given the observability and volume of recently executed transactions and availability of data provider pricing. |
• | Project Loans and Participation Certificates in GNMA Project and Construction Loans: Valuations of participation certificates in GNMA project and construction loans are based on inputs corroborated from and benchmarked to observed prices of recent securitizations with similar underlying loan collateral to derive an implied spread. Securitization prices are adjusted to estimate the fair value of the loans to account for the arbitrage that is realized at the time of securitization. The measurements are categorized within Level 2 of the fair value hierarchy given the observability and volume of recently executed transactions. |
• | Consumer Loans and Funding Facilities: Consumer and small business whole loans and related funding facilities are valued based on observed market transactions and incorporating valuation inputs including, but not limited to, delinquency and default rates, prepayment rates, borrower characteristics, loan risk grades and loan age. These assets are categorized within Level 2 or Level 3 of the fair value hierarchy. |
• | Escrow and Trade Claim Receivables: Escrow and trade claim receivables are categorized within Level 3 of the fair value hierarchy where fair value is estimated based on reference to market prices and implied yields of debt securities of the same or similar issuers. Escrow and trade claim receivables are categorized within Level 2 of the fair value hierarchy where fair value is based on recent trade activity in the same receivable. |
Derivatives
• | Listed Derivative Contracts: Listed derivative contracts that are actively traded are measured based on quoted exchange prices, broker quotes or vanilla option valuation models, such as Black-Scholes, using observable valuation inputs from the principal market. Exchange quotes and/or valuation inputs are generally obtained from external vendors and pricing services. Broker quotes are validated directly through observable and tradeable quotes. Listed derivative contracts that use unadjusted exchange close prices are generally categorized within Level 1 of the fair value hierarchy. All other listed derivative contracts are generally categorized within Level 2 of the fair value hierarchy. |
• | Over-the-Counter (“OTC”) Derivative Contracts: OTC derivative contracts are generally valued using models, whose inputs reflect assumptions that we believe market participants would use in valuing the derivative in a current transaction. Inputs to valuation models are appropriately calibrated to market data. For many OTC derivative contracts, the valuation models do not involve material subjectivity as the methodologies do not entail significant judgment and the inputs to valuation models do not involve a high degree of subjectivity as the valuation model inputs are readily observable or can be derived from actively quoted markets. OTC derivative contracts are primarily categorized within Level 2 of the fair value hierarchy given the observability and significance of the inputs to the valuation models. Where significant inputs to the valuation are unobservable, derivative instruments are categorized within Level 3 of the fair value hierarchy. |
OTC options include OTC equity, foreign exchange, interest rate and commodity options measured using various valuation models, such as the Black-Scholes, with key inputs including the underlying security price, foreign exchange spot rate, commodity price, implied volatility, dividend yield, interest rate curve, strike price and maturity date. Discounted cash flow models are utilized to measure certain OTC derivative contracts including the valuations of our interest rate swaps, which incorporate observable inputs related to interest rate curves, valuations of our foreign exchange forwards and swaps, which incorporate observable inputs related to foreign currency spot rates and forward curves and valuations of our commodity swaps and forwards, which incorporate observable inputs related to commodity spot prices and forward curves. Discounted cash flow models are also utilized to measure certain variable funding note swaps, which are backed by CLOs and incorporates constant prepayment rate, constant default rate and loss severity assumptions. Credit default swaps include both index and single-name credit default swaps. External prices are available as inputs in measuring index credit default swaps and single-name credit default swaps. For commodity and equity total return swaps, market prices are generally observable for the underlying asset and used as the basis for measuring the fair value of the derivative contracts. Total return swaps executed on other underlyings are measured based on valuations received from external pricing services.
18
JEFFERIES GROUP LLC AND SUBSIDIARIES
NOTES TO CONSOLIDATED FINANCIAL STATEMENTS - CONTINUED
(Unaudited)
Investments at Fair Value
Investments at fair value based on NAV includes investments in hedge funds, fund of funds and private equity funds, which are measured at the NAV of the funds, provided by the fund managers and are excluded from the fair value hierarchy. Investments at fair value also include direct equity investments in private companies, which are measured at fair value using valuation techniques involving quoted prices of or market data for comparable companies, similar company ratios and multiples (e.g., price/EBITDA, price/book value), discounted cash flow analyses and transaction prices observed for subsequent financing or capital issuance by the company. Direct equity investments in private companies are categorized within Level 2 or Level 3 of the fair value hierarchy. Additionally, investments at fair value include investments in insurance contracts relating to our defined benefit plan in Germany. Fair value for the insurance contracts is determined using a third party and is categorized within Level 3 of the fair value hierarchy.
The following tables present information about our investments in entities that have the characteristics of an investment company (in thousands):
May 31, 2018 | |||||||||
Fair Value (1) | Unfunded Commitments | Redemption Frequency (if currently eligible) | |||||||
Equity Long/Short Hedge Funds (2) | $ | 35,559 | $ | — | Monthly, Quarterly | ||||
Fixed Income and High Yield Hedge Funds (3) | 342 | — | — | ||||||
Fund of Funds (4) | 176 | — | — | ||||||
Equity Funds (5) | 35,991 | 20,696 | — | ||||||
Multi-asset Funds (6) | 261,134 | — | — | ||||||
Total | $ | 333,202 | $ | 20,696 | |||||
November 30, 2017 | |||||||||
Fair Value (1) | Unfunded Commitments | Redemption Frequency (if currently eligible) | |||||||
Equity Long/Short Hedge Funds (2) | $ | 33,176 | $ | — | Monthly, Quarterly | ||||
Fixed Income and High Yield Hedge Funds (3) | 417 | — | — | ||||||
Fund of Funds (4) | 189 | — | — | ||||||
Equity Funds (5) | 26,798 | 19,084 | — | ||||||
Multi-asset Funds (6) | 154,805 | — | — | ||||||
Total | $ | 215,385 | $ | 19,084 | |||||
(1) | Where fair value is calculated based on NAV, fair value has been derived from each of the funds’ capital statements. |
(2) | This category includes investments in hedge funds that invest, long and short, primarily in equity securities in domestic and international markets in both the public and private sectors. At both May 31, 2018 and November 30, 2017, approximately 1% of the fair value of investments in this category are classified as being in liquidation. |
(3) | This category includes investments in funds that invest in loans secured by a first trust deed on property, domestic and international public high yield debt, private high yield investments, senior bank loans, public leveraged equities, distressed debt and private equity investments. There are no redemption provisions. |
(4) | This category includes investments in fund of funds that invest in various private equity funds. The investments in this category are managed by us and have no redemption provisions. These investments are gradually being liquidated or we have requested redemption, however, we are unable to estimate when these funds will be received. |
(5) | At May 31, 2018 and November 30, 2017, the investments in this category include investments in equity funds that invest in the equity of various U.S. and foreign private companies in the energy, technology, internet service and telecommunication service industries. These investments cannot be redeemed; instead, distributions are received through the liquidation of the underlying assets of the funds which are expected to be liquidated in one to ten years. |
(6) | This category includes investments in hedge funds that invest, long and short, primarily in multi-asset securities in domestic and international markets in both the public and private sectors. At May 31, 2018 and November 30, 2017, investments representing approximately 17% and 12%, respectively, of the fair value of investments in this category are redeemable with 30 days prior written notice. |
19
JEFFERIES GROUP LLC AND SUBSIDIARIES
NOTES TO CONSOLIDATED FINANCIAL STATEMENTS - CONTINUED
(Unaudited)
Other Secured Financings
Other secured financings that are accounted for at fair value include notes issued by consolidated VIEs, which are classified as Level 2 or Level 3 within the fair value hierarchy. Fair value is based on recent transaction prices for similar assets.
Short-term Borrowings / Long-term Debt
Short-term borrowings that are accounted for at fair value include equity-linked notes, which are generally categorized as Level 2 within the fair value hierarchy, as the fair value is based on the price of the underlying equity security. Long-term debt includes variable rate, fixed-to-floating rate, CMS (constant maturity swap), digital and Bermudan structured notes. These are valued using various valuation models that incorporate our own credit spread, market price quotations from external pricing sources referencing the appropriate interest rate curves, volatilities and other inputs as well as prices for transactions in a given note during the period. Long-term debt notes are generally categorized within Level 2 of the fair value hierarchy where market trades have been observed during the quarter, otherwise categorized as Level 3.
Level 3 Rollforwards
The following is a summary of changes in fair value of our financial assets and liabilities that have been categorized within Level 3 of the fair value hierarchy for the three months ended May 31, 2018 (in thousands):
Three Months Ended May 31, 2018 | |||||||||||||||||||||||||||||||||||
Balance at February 28, 2018 | Total gains/losses (realized and unrealized) (1) | Purchases | Sales | Settlements | Issuances | Net transfers into/ (out of) Level 3 | Balance at May 31, 2018 | Change in unrealized gains/ (losses) relating to instruments still held at May 31, 2018 (1) | |||||||||||||||||||||||||||
Assets: | |||||||||||||||||||||||||||||||||||
Financial instruments owned: | |||||||||||||||||||||||||||||||||||
Corporate equity securities | $ | 35,412 | $ | 1,322 | $ | 1,485 | $ | (75 | ) | $ | (110 | ) | $ | — | $ | 4,867 | $ | 42,901 | $ | 1,612 | |||||||||||||||
Corporate debt securities | 26,103 | 923 | 17,058 | (13,481 | ) | — | — | (2,537 | ) | 28,066 | 543 | ||||||||||||||||||||||||
CDOs and CLOs | 26,433 | (2,350 | ) | 251 | (1,905 | ) | (431 | ) | — | 8,605 | 30,603 | (2,422 | ) | ||||||||||||||||||||||
RMBS | 21,762 | (5,416 | ) | 112 | (13,113 | ) | (35 | ) | — | 345 | 3,655 | 423 | |||||||||||||||||||||||
CMBS | 15,103 | (2,213 | ) | — | — | (1,924 | ) | — | 16,273 | 27,239 | (2,706 | ) | |||||||||||||||||||||||
Other ABS | 51,288 | (4,001 | ) | 59,057 | (62,905 | ) | (3,846 | ) | — | 15,942 | 55,535 | (2,670 | ) | ||||||||||||||||||||||
Loans and other receivables | 62,043 | (6,051 | ) | 19,029 | (16,237 | ) | (1,940 | ) | — | 7,192 | 64,036 | (5,185 | ) | ||||||||||||||||||||||
Investments at fair value | 79,879 | (82 | ) | 2,001 | (2,310 | ) | — | — | — | 79,488 | (82 | ) | |||||||||||||||||||||||
Liabilities: | |||||||||||||||||||||||||||||||||||
Financial instruments sold, not yet purchased: | |||||||||||||||||||||||||||||||||||
Corporate equity securities | $ | 61 | $ | 26 | $ | — | $ | — | $ | — | $ | — | $ | — | $ | 87 | $ | (26 | ) | ||||||||||||||||
Corporate debt securities | 522 | — | — | — | — | — | — | 522 | — | ||||||||||||||||||||||||||
CMBS | 35 | (35 | ) | — | — | — | — | — | — | — | |||||||||||||||||||||||||
Loans | 10,323 | (3,416 | ) | (10,543 | ) | 8,685 | (29 | ) | — | 7,861 | 12,881 | 3,231 | |||||||||||||||||||||||
Net derivatives (2) | 6,882 | (1,580 | ) | — | — | 569 | — | 3 | 5,874 | (115 | ) | ||||||||||||||||||||||||
Long-term debt | — | (20,838 | ) | — | — | — | 23,362 | 158,102 | 160,626 | 20,838 | |||||||||||||||||||||||||
(1) | Realized and unrealized gains/losses are reported in Principal transaction revenues in our Consolidated Statements of Earnings. |
(2) | Net derivatives represent Financial instruments owned—Derivatives and Financial instruments sold, not yet purchased—Derivatives. |
20
JEFFERIES GROUP LLC AND SUBSIDIARIES
NOTES TO CONSOLIDATED FINANCIAL STATEMENTS - CONTINUED
(Unaudited)
Analysis of Level 3 Assets and Liabilities for the Three Months Ended May 31, 2018
During the three months ended May 31, 2018, transfers of assets of $78.7 million from Level 2 to Level 3 of the fair value hierarchy are primarily attributed to:
• | CDOs and CLOs of $20.3 million, CMBS of $17.1 million, loans and other receivables of $16.4 million and other ABS of $15.9 million due to reduced pricing transparency. |
During the three months ended May 31, 2018, transfers of assets of $28.0 million from Level 3 to Level 2 are primarily attributed to:
• | CDOs and CLOs of $11.7 million and loans and other receivables of $9.2 million due to greater pricing transparency supporting classification into Level 2. |
During the three months ended May 31, 2018, there were transfers of long-term debt of $158.1 million from Level 2 to Level 3 due to a decrease in market observability.
Net losses on Level 3 assets were $17.9 million and net gains on Level 3 liabilities were $25.8 million for the three months ended May 31, 2018. Net losses on Level 3 assets were primarily due to decreased market values across certain loans and other receivables, RMBS and other ABS. Net gains on Level 3 liabilities were primarily due to decreased valuations of certain long-term debt.
The following is a summary of changes in fair value of our financial assets and liabilities that have been categorized within Level 3 of the fair value hierarchy for the six months ended May 31, 2018 (in thousands):
Six Months Ended May 31, 2018 | |||||||||||||||||||||||||||||||||||
Balance at November 30, 2017 | Total gains/losses (realized and unrealized) (1) | Purchases | Sales | Settlements | Issuances | Net transfers into/ (out of) Level 3 | Balance at May 31, 2018 | Change in unrealized gains/ (losses) relating to instruments still held at May 31, 2018 (1) | |||||||||||||||||||||||||||
Assets: | |||||||||||||||||||||||||||||||||||
Financial instruments owned: | |||||||||||||||||||||||||||||||||||
Corporate equity securities | $ | 22,009 | $ | 13,343 | $ | 5,383 | $ | (520 | ) | $ | (1,779 | ) | $ | — | $ | 4,465 | $ | 42,901 | $ | 12,710 | |||||||||||||||
Corporate debt securities | 26,036 | 434 | 19,304 | (15,704 | ) | (2,049 | ) | — | 45 | 28,066 | (1,048 | ) | |||||||||||||||||||||||
CDOs and CLOs | 30,004 | (2,961 | ) | 568 | (2,374 | ) | (3,765 | ) | — | 9,131 | 30,603 | (5,375 | ) | ||||||||||||||||||||||
RMBS | 26,077 | (4,193 | ) | 112 | (10,959 | ) | (88 | ) | — | (7,294 | ) | 3,655 | 419 | ||||||||||||||||||||||
CMBS | 12,419 | (2,292 | ) | 1,208 | (487 | ) | (3,209 | ) | — | 19,600 | 27,239 | (3,176 | ) | ||||||||||||||||||||||
Other ABS | 61,129 | (5,476 | ) | 132,291 | (124,787 | ) | (7,622 | ) | — | — | 55,535 | (2,498 | ) | ||||||||||||||||||||||
Loans and other receivables | 47,304 | (201 | ) | 46,682 | (25,456 | ) | (11,648 | ) | — | 7,355 | 64,036 | (1,756 | ) | ||||||||||||||||||||||
Investments at fair value | 93,454 | 418 | 2,240 | (17,570 | ) | — | — | 946 | 79,488 | (176 | ) | ||||||||||||||||||||||||
Liabilities: | |||||||||||||||||||||||||||||||||||
Financial instruments sold, not yet purchased: | |||||||||||||||||||||||||||||||||||
Corporate equity securities | $ | 48 | $ | 39 | $ | — | $ | — | $ | — | $ | — | $ | — | $ | 87 | $ | (39 | ) | ||||||||||||||||
Corporate debt securities | 522 | — | — | — | — | — | — | 522 | — | ||||||||||||||||||||||||||
CMBS | 105 | (105 | ) | — | — | — | — | — | — | — | |||||||||||||||||||||||||
Loans | 3,486 | 1,226 | (5,100 | ) | 12,092 | — | — | 1,177 | 12,881 | 106 | |||||||||||||||||||||||||
Net derivatives (2) | 6,746 | (668 | ) | (6 | ) | — | (494 | ) | 296 | — | 5,874 | 535 | |||||||||||||||||||||||
Long-term debt | — | (28,082 | ) | — | — | — | 81,284 | 107,424 | 160,626 | 20,082 | |||||||||||||||||||||||||
(1) | Realized and unrealized gains/losses are reported in Principal transaction revenues in our Consolidated Statements of Earnings. |
(2) | Net derivatives represent Financial instruments owned—Derivatives and Financial instruments sold, not yet purchased—Derivatives. |
21
JEFFERIES GROUP LLC AND SUBSIDIARIES
NOTES TO CONSOLIDATED FINANCIAL STATEMENTS - CONTINUED
(Unaudited)
Analysis of Level 3 Assets and Liabilities for the Six Months Ended May 31, 2018
During the six months ended May 31, 2018, transfers of assets of $49.1 million from Level 2 to Level 3 of the fair value hierarchy are primarily attributed to:
• | CMBS of $19.7 million and CDOs and CLOs of $12.7 million due to reduced pricing transparency. |
During the six months ended May 31, 2018, transfers of assets of $14.9 million from Level 3 to Level 2 are primarily attributed to:
• | RMBS of $9.0 million due to greater pricing transparency supporting classification into Level 2. |
During the six months ended May 31, 2018, there were transfers of long-term debt of $107.4 million from Level 2 to Level 3 due to a decrease in market observability.
Net losses on Level 3 assets were $0.9 million and net gains on Level 3 liabilities were $27.6 million for the six months ended May 31, 2018. Net losses on Level 3 assets were primarily due to decreased market values across other ABS, RMBS, CDOs and CLOs and CMBS, partially offset by increased market values across corporate equity securities. Net gains on Level 3 liabilities were primarily due to decreased valuations of certain long-term debt.
The following is a summary of changes in fair value of our financial assets and liabilities that have been categorized within Level 3 of the fair value hierarchy for the three months ended May 31, 2017 (in thousands):
Three Months Ended May 31, 2017 | |||||||||||||||||||||||||||||||||||
Balance at February 28, 2017 | Total gains/losses (realized and unrealized) (1) | Purchases | Sales | Settlements | Issuances | Net transfers into/ (out of) Level 3 | Balance at May 31, 2017 | Change in unrealized gains/ (losses) relating to instruments still held at May 31, 2017 (1) | |||||||||||||||||||||||||||
Assets: | |||||||||||||||||||||||||||||||||||
Financial instruments owned: | |||||||||||||||||||||||||||||||||||
Corporate equity securities | $ | 20,580 | $ | (1,198 | ) | $ | 490 | $ | (1,263 | ) | $ | (281 | ) | $ | — | $ | 2,220 | $ | 20,548 | $ | (1,428 | ) | |||||||||||||
Corporate debt securities | 33,467 | (1,420 | ) | 8,789 | (9,181 | ) | (6,986 | ) | — | 58 | 24,727 | (1,983 | ) | ||||||||||||||||||||||
CDOs and CLOs | 45,354 | (2,721 | ) | 16,334 | (33,546 | ) | — | — | 1,834 | 27,255 | (131 | ) | |||||||||||||||||||||||
Municipal securities | 26,554 | (70 | ) | — | (26,484 | ) | — | — | — | — | — | ||||||||||||||||||||||||
RMBS | 39,259 | (2,188 | ) | 3,176 | (6,636 | ) | (4 | ) | — | (575 | ) | 33,032 | (1,024 | ) | |||||||||||||||||||||
CMBS | 20,653 | 98 | 534 | (4,111 | ) | (1 | ) | — | (910 | ) | 16,263 | (546 | ) | ||||||||||||||||||||||
Other ABS | 37,702 | (3,663 | ) | 13,476 | — | (2,241 | ) | — | (1,925 | ) | 43,349 | (3,642 | ) | ||||||||||||||||||||||
Loans and other receivables | 53,172 | 3,226 | 20,054 | (19,378 | ) | (7,181 | ) | — | (528 | ) | 49,365 | 1,687 | |||||||||||||||||||||||
Investments at fair value | 83,785 | 5,194 | 300 | — | (273 | ) | — | — | 89,006 | 5,194 | |||||||||||||||||||||||||
Liabilities: | |||||||||||||||||||||||||||||||||||
Financial instruments sold, not yet purchased: | |||||||||||||||||||||||||||||||||||
Corporate equity securities | $ | 324 | $ | 30 | $ | — | $ | — | $ | — | $ | — | $ | — | $ | 354 | $ | (30 | ) | ||||||||||||||||
Corporate debt securities | 523 | (1 | ) | — | — | — | — | — | 522 | 1 | |||||||||||||||||||||||||
CMBS | — | 70 | — | — | — | — | — | 70 | (70 | ) | |||||||||||||||||||||||||
Loans | 1,036 | 3,867 | — | — | — | — | 64 | 4,967 | (3,867 | ) | |||||||||||||||||||||||||
Net derivatives (2) | 6,413 | (3,617 | ) | — | — | (3 | ) | 218 | 11 | 3,022 | (147 | ) | |||||||||||||||||||||||
Other secured financings | 87 | (87 | ) | — | — | — | — | — | — | — | |||||||||||||||||||||||||
(1) | Realized and unrealized gains/losses are reported in Principal transaction revenues in our Consolidated Statements of Earnings. |
(2) | Net derivatives represent Financial instruments owned—Derivatives and Financial instruments sold, not yet purchased—Derivatives. |
22
JEFFERIES GROUP LLC AND SUBSIDIARIES
NOTES TO CONSOLIDATED FINANCIAL STATEMENTS - CONTINUED
(Unaudited)
Analysis of Level 3 Assets and Liabilities for the Three Months Ended May 31, 2017
During the three months ended May 31, 2017, transfers of assets of $23.9 million from Level 2 to Level 3 of the fair value hierarchy are primarily attributed to:
• | RMBS of $12.0 million due to a lack of observable market transactions. |
During the three months ended May 31, 2017, transfers of assets of $23.8 million from Level 3 to Level 2 are primarily attributed to:
• | RMBS of $12.6 million due to greater pricing transparency supporting classification into Level 2. |
Net losses on Level 3 assets were $2.7 million and net losses on Level 3 liabilities were $0.3 million for the three months ended May 31, 2017. Net losses on Level 3 assets were primarily due to decreased valuations of other ABS, RMBS, CDOs and CLOs and corporate debt and equity securities, partially offset by increased valuations of certain investments at fair value and loans and other receivables.
The following is a summary of changes in fair value of our financial assets and liabilities that have been categorized within Level 3 of the fair value hierarchy for the six months ended May 31, 2017 (in thousands):
Six Months Ended May 31, 2017 | |||||||||||||||||||||||||||||||||||
Balance at November 30, 2016 | Total gains/losses (realized and unrealized) (1) | Purchases | Sales | Settlements | Issuances | Net transfers into/ (out of) Level 3 | Balance at May 31, 2017 | Change in unrealized gains/ (losses) relating to instruments still held at May 31, 2017 (1) | |||||||||||||||||||||||||||
Assets: | |||||||||||||||||||||||||||||||||||
Financial instruments owned: | |||||||||||||||||||||||||||||||||||
Corporate equity securities | $ | 21,739 | $ | (489 | ) | $ | 1,056 | $ | (1,117 | ) | $ | (1,907 | ) | $ | — | $ | 1,266 | $ | 20,548 | $ | (1,215 | ) | |||||||||||||
Corporate debt securities | 25,005 | (3,300 | ) | 15,133 | (15,295 | ) | (1,693 | ) | — | 4,877 | 24,727 | (3,571 | ) | ||||||||||||||||||||||
CDOs and CLOs | 54,354 | (10,102 | ) | 24,741 | (44,725 | ) | — | — | 2,987 | 27,255 | (204 | ) | |||||||||||||||||||||||
Municipal securities | 27,257 | (1,547 | ) | — | (25,710 | ) | — | — | — | — | — | ||||||||||||||||||||||||
RMBS | 38,772 | (3,000 | ) | 5,886 | (11,750 | ) | (16 | ) | — | 3,140 | 33,032 | (1,667 | ) | ||||||||||||||||||||||
CMBS | 20,580 | (1,119 | ) | 534 | (4,523 | ) | (2 | ) | — | 793 | 16,263 | (907 | ) | ||||||||||||||||||||||
Other ABS | 40,911 | (5,489 | ) | 17,029 | (300 | ) | (5,576 | ) | — | (3,226 | ) | 43,349 | (5,461 | ) | |||||||||||||||||||||
Loans and other receivables | 81,872 | 10,062 | 63,616 | (61,423 | ) | (17,017 | ) | — | (27,745 | ) | 49,365 | 3,679 | |||||||||||||||||||||||
Investments at fair value | 96,369 | 2,995 | 300 | (10,119 | ) | (539 | ) | — | — | 89,006 | 5,019 | ||||||||||||||||||||||||
Liabilities: | |||||||||||||||||||||||||||||||||||
Financial instruments sold, not yet purchased: | |||||||||||||||||||||||||||||||||||
Corporate equity securities | $ | 313 | $ | 41 | $ | — | $ | — | $ | — | $ | — | $ | — | $ | 354 | $ | (41 | ) | ||||||||||||||||
Corporate debt securities | 523 | (1 | ) | — | — | — | — | — | 522 | 1 | |||||||||||||||||||||||||
CMBS | — | 70 | — | — | — | — | — | 70 | (70 | ) | |||||||||||||||||||||||||
Loans | 378 | 4,091 | (364 | ) | — | — | — | 862 | 4,967 | (4,091 | ) | ||||||||||||||||||||||||
Net derivatives (2) | 3,441 | (6,154 | ) | — | — | 1,534 | 404 | 3,797 | 3,022 | (614 | ) | ||||||||||||||||||||||||
Other secured financings | 418 | (418 | ) | — | — | — | — | — | — | — | |||||||||||||||||||||||||
(1) | Realized and unrealized gains/losses are reported in Principal transaction revenues in our Consolidated Statements of Earnings. |
(2) | Net derivatives represent Financial instruments owned—Derivatives and Financial instruments sold, not yet purchased—Derivatives. |
23
JEFFERIES GROUP LLC AND SUBSIDIARIES
NOTES TO CONSOLIDATED FINANCIAL STATEMENTS - CONTINUED
(Unaudited)
Analysis of Level 3 Assets and Liabilities for the Six Months Ended May 31, 2017
During the six months ended May 31, 2017, transfers of assets of $36.6 million from Level 2 to Level 3 of the fair value hierarchy are primarily attributed to:
• | CDOs and CLOs of $12.4 million and RMBS of $11.5 million due to a lack of observable market transactions. |
During the six months ended May 31, 2017, transfers of assets of $54.5 million from Level 3 to Level 2 are primarily attributed to:
• | Loans and other receivables of $30.8 million due to greater pricing transparency supporting classification into Level 2. |
Net losses on Level 3 assets were $12.0 million and net gains on Level 3 liabilities were $2.4 million for the six months ended May 31, 2017. Net losses on Level 3 assets were primarily due to decreased valuations of other ABS, RMBS, CDOs and CLOs, municipal securities and corporate debt securities, partially offset by increased valuations certain loans and other receivables and investments at fair value. Net gains on Level 3 liabilities were primarily due to increased valuations of certain net derivatives, partially offset by decreased valuations of certain loans.
Quantitative Information about Significant Unobservable Inputs used in Level 3 Fair Value Measurements at May 31, 2018 and November 30, 2017
The tables below present information on the valuation techniques, significant unobservable inputs and their ranges for our financial assets and liabilities, subject to threshold levels related to the market value of the positions held, measured at fair value on a recurring basis with a significant Level 3 balance. The range of unobservable inputs could differ significantly across different firms given the range of products across different firms in the financial services sector. The inputs are not representative of the inputs that could have been used in the valuation of any one financial instrument (i.e., the input used for valuing one financial instrument within a particular class of financial instruments may not be appropriate for valuing other financial instruments within that given class). Additionally, the ranges of inputs presented below should not be construed to represent uncertainty regarding the fair values of our financial instruments; rather, the range of inputs is reflective of the differences in the underlying characteristics of the financial instruments in each category.
For certain categories, we have provided a weighted average of the inputs allocated based on the fair values of the financial instruments comprising the category. We do not believe that the range or weighted average of the inputs is indicative of the reasonableness of uncertainty of our Level 3 fair values. The range and weighted average are driven by the individual financial instruments within each category and their relative distribution in the population. The disclosed inputs when compared with the inputs as disclosed in other periods should not be expected to necessarily be indicative of changes in our estimates of unobservable inputs for a particular financial instrument as the population of financial instruments comprising the category will vary from period to period based on purchases and sales of financial instruments during the period as well as transfers into and out of Level 3 each period.
24
JEFFERIES GROUP LLC AND SUBSIDIARIES
NOTES TO CONSOLIDATED FINANCIAL STATEMENTS - CONTINUED
(Unaudited)
May 31, 2018 | ||||||||||||||
Financial Instruments Owned: | Fair Value (in thousands) | Valuation Technique | Significant Unobservable Input(s) | Input / Range | Weighted Average | |||||||||
Corporate equity securities | $ | 38,212 | ||||||||||||
Non-exchange-traded securities | Market approach | Price | $0-$75 | $ | 18 | |||||||||
Underlying stock price | $3-$11 | $ | 9 | |||||||||||
Comparable pricing | Comparable asset price | $9 | — | |||||||||||
Corporate debt securities | $ | 24,869 | Market approach | Discount rate/yield | 4% | — | ||||||||
Estimated recovery percentage | 40% | — | ||||||||||||
Price | $10-$89 | $ | 78 | |||||||||||
CDOs and CLOs | $ | 30,603 | Discounted cash flows | Constant prepayment rate | 20% | — | ||||||||
Constant default rate | 1%-2% | 2 | % | |||||||||||
Loss severity | 25%-30% | 26 | % | |||||||||||
Discount rate/yield | 11%-37% | 18 | % | |||||||||||
Scenario analysis | Estimated recovery percentage | 6%-40% | 23 | % | ||||||||||
RMBS | $ | 3,655 | Discounted cash flows | Cumulative loss rate | 46% | — | ||||||||
Duration (years) | 8 | — | ||||||||||||
Discount rate/yield | 4% | — | ||||||||||||
CMBS | $ | 27,239 | Discounted cash flows | Cumulative loss rate | 7%-81% | 39 | % | |||||||
Duration (years) | 1-3 | 1 | ||||||||||||
Discount rate/yield | 4%-15% | 9 | % | |||||||||||
Scenario analysis | Estimated recovery percentage | 26% | — | |||||||||||
Price | $49 | — | ||||||||||||
Other ABS | $ | 55,535 | Discounted cash flows | Cumulative loss rate | 0%-28% | 21 | % | |||||||
Duration (years) | 1-6 | 2 | ||||||||||||
Discount rate/yield | 5%-12% | 8 | % | |||||||||||
Market approach | Price | $100 | — | |||||||||||
Loans and other receivables | $ | 64,036 | Market approach | Estimated recovery percentage | 0% | — | ||||||||
Price | $13-$101 | $ | 84 | |||||||||||
Scenario analysis | Estimated recovery percentage | 57%-107% | 88 | % | ||||||||||
Derivatives | $ | 5,743 | ||||||||||||
Credit default swaps | Market approach | Credit spread | 225 bps | — | ||||||||||
Total return swaps | Market approach | Price | $101-$103 | $ | 102 | |||||||||
Investments at fair value | $ | 79,488 | ||||||||||||
Private equity securities | Market approach | Price | $3-$250 | $ | 172 | |||||||||
Transaction level | $7 | — | ||||||||||||
Financial Instruments Sold, Not Yet Purchased: | ||||||||||||||
Loans | $ | 12,881 | Market approach | Estimated recovery percentage | 0% | — | ||||||||
Price | $13-$101 | $ | 62 | |||||||||||
Derivatives | $ | 11,617 | ||||||||||||
Equity options | Option model/default rate | Default probability | 0% | — | ||||||||||
Unfunded commitments | Market approach | Price | $98 | — | ||||||||||
Total return swaps | Market approach | Price | $101-$103 | $ | 102 | |||||||||
Variable funding note swaps | Discounted cash flows | Constant prepayment rate | 20% | — | ||||||||||
Constant default rate | 2% | — | ||||||||||||
Loss severity | 25% | — | ||||||||||||
Discount rate/yield | 37% | — | ||||||||||||
Long-term debt | ||||||||||||||
Structured notes | $ | 160,626 | Market approach | Price | $71-$99 | $ | 80 | |||||||
Price | €79-€110 | € 96 | ||||||||||||
25
JEFFERIES GROUP LLC AND SUBSIDIARIES
NOTES TO CONSOLIDATED FINANCIAL STATEMENTS - CONTINUED
(Unaudited)
November 30, 2017 | ||||||||||||||
Financial Instruments Owned: | Fair Value (in thousands) | Valuation Technique | Significant Unobservable Input(s) | Input / Range | Weighted Average | |||||||||
Corporate equity securities | $ | 18,109 | ||||||||||||
Non-exchange-traded securities | Market approach | Price | $3-$75 | $ | 33 | |||||||||
Underlying stock price | $6 | — | ||||||||||||
Comparable pricing | Comparable asset price | $7 | — | |||||||||||
Corporate debt securities | $ | 26,036 | Convertible bond model | Discount rate/yield | 8% | — | ||||||||
Volatility | 40% | — | ||||||||||||
Market approach | Estimated recovery percentage | 17% | — | |||||||||||
Price | $10 | — | ||||||||||||
CDOs and CLOs | $ | 30,004 | Discounted cash flows | Constant prepayment rate | 20% | — | ||||||||
Constant default rate | 2% | — | ||||||||||||
Loss severity | 25%-30% | 26 | % | |||||||||||
Discount rate/yield | 3%-26% | 12 | % | |||||||||||
Scenario analysis | Estimated recovery percentage | 8%-40% | 22 | % | ||||||||||
RMBS | $ | 26,077 | Discounted cash flows | Cumulative loss rate | 3%-19% | 10 | % | |||||||
Duration (years) | 2-4 | 3 | ||||||||||||
Discount rate/yield | 6%-10% | 8 | % | |||||||||||
CMBS | $ | 12,419 | Discounted cash flows | Cumulative loss rate | 8%-65% | 44 | % | |||||||
Duration (years) | 1-3 | 2 | ||||||||||||
Discount rate/yield | 2%-26% | 12 | % | |||||||||||
Scenario analysis | Estimated recovery percentage | 26%-32% | 28 | % | ||||||||||
Price | $52-$56 | $ | 54 | |||||||||||
Other ABS | $ | 61,129 | Discounted cash flows | Cumulative loss rate | 0%-33% | 23 | % | |||||||
Duration (years) | 1-6 | 2 | ||||||||||||
Discount rate/yield | 5%-39% | 9 | % | |||||||||||
Market approach | Price | $100 | — | |||||||||||
Scenario analysis | Estimated recovery percentage | 14% | — | |||||||||||
Loans and other receivables | $ | 46,121 | Market approach | Estimated recovery percentage | 76% | — | ||||||||
Price | $54-$100 | $ | 95 | |||||||||||
Scenario analysis | Estimated recovery percentage | 13%-107% | 78 | % | ||||||||||
Derivatives | $ | 9,295 | ||||||||||||
Total return swaps | Market approach | Price | $101-$106 | $ | 103 | |||||||||
Interest rate swaps | Market approach | Credit spread | 800 bps | — | ||||||||||
Investments at fair value | $ | 77,423 | ||||||||||||
Private equity securities | Market approach | Transaction level | $3-$250 | $ | 172 | |||||||||
Price | $7 | — | ||||||||||||
Financial Instruments Sold, Not Yet Purchased: | ||||||||||||||
Derivatives | $ | 16,041 | ||||||||||||
Equity options | Option model/default rate | Default probability | 0% | — | ||||||||||
Unfunded commitments | Market approach | Price | $99 | — | ||||||||||
Total return swaps | Market approach | Price | $101-$106 | $ | 103 | |||||||||
Variable funding note swaps | Discounted cash flows | Constant prepayment rate | 20% | — | ||||||||||
Constant default rate | 2% | — | ||||||||||||
Loss severity | 25% | — | ||||||||||||
Discount rate/yield | 26% | — | ||||||||||||
The fair values of certain Level 3 assets and liabilities that were determined based on third-party pricing information, unadjusted past transaction prices, reported NAV or a percentage of the reported enterprise fair value are excluded from the above tables. At May 31, 2018 and November 30, 2017, asset exclusions consisted of $7.9 million and $21.1 million, respectively, primarily comprised of private equity securities, non-exchange-traded securities, corporate debt securities and loans and other receivables. At May 31, 2018 and November 30, 2017, liability exclusions consisted of $0.6 million and $4.2 million, respectively, of loans, CMBS, and corporate debt and equity securities.
26
JEFFERIES GROUP LLC AND SUBSIDIARIES
NOTES TO CONSOLIDATED FINANCIAL STATEMENTS - CONTINUED
(Unaudited)
Sensitivity of Fair Values to Changes in Significant Unobservable Inputs
For recurring fair value measurements categorized within Level 3 of the fair value hierarchy, the sensitivity of the fair value measurement to changes in significant unobservable inputs and interrelationships between those unobservable inputs (if any) are described below:
• | Non-exchange-traded securities using comparable pricing valuation techniques. A significant increase (decrease) in the comparable asset price in isolation would result in a significantly higher (lower) fair value measurement. |
• | Corporate debt securities using a convertible bond model. A significant increase (decrease) in the bond discount rate/yield would result in a significantly lower (higher) fair value measurement. A significant increase (decrease) in volatility would result in a significantly higher (lower) fair value measurement. |
• | Non-exchange-traded securities, corporate debt securities, loans and other receivables, unfunded commitments, interest rate swaps, total return swaps, credit default swaps, other ABS, private equity securities and structured notes using a market approach valuation technique. A significant increase (decrease) in the transaction level of a private equity security would result in a significantly higher (lower) fair value measurement. A significant increase (decrease) in the underlying stock price of the non-exchange-traded securities would result in a significantly higher (lower) fair value measurement. A significant increase (decrease) in the credit spread of certain derivatives would result in a significantly lower (higher) fair value measurement. A significant increase (decrease) in the price of the private equity securities, non-exchange-traded securities, corporate debt securities, unfunded commitments, total return swaps, other ABS, loans and other receivables or structured notes would result in a significantly higher (lower) fair value measurement. A significant increase (decrease) in the estimated recovery rates of the cash flow outcomes underlying the corporate debt securities or loans and other receivables would result in a significantly higher (lower) fair value measurement. A significant increase (decrease) in the bond discount rate/yield would result in a significantly lower (higher) fair value measurement. |
• | Loans and other receivables, CDOs and CLOs, CMBS and other ABS using scenario analysis. A significant increase (decrease) in the possible recovery rates of the cash flow outcomes underlying the investment would result in a significantly higher (lower) fair value measurement for the financial instrument. A significant increase (decrease) in the price of the CMBS would result in a significantly higher (lower) fair value measurement. |
• | CDOs and CLOs, RMBS and CMBS and other ABS and variable funding note swaps using a discounted cash flow valuation technique. A significant increase (decrease) in isolation in the constant default rate, loss severity or cumulative loss rate would result in a significantly lower (higher) fair value measurement. The impact of changes in the constant prepayment rate and duration would have differing impacts depending on the capital structure and type of security. A significant increase (decrease) in the discount rate/security yield would result in a significantly lower (higher) fair value measurement. |
• | Derivative equity options using an option/default rate model. A significant increase (decrease) in default probability would result in a significantly lower (higher) fair value measurement. |
27
JEFFERIES GROUP LLC AND SUBSIDIARIES
NOTES TO CONSOLIDATED FINANCIAL STATEMENTS - CONTINUED
(Unaudited)
Fair Value Option Election
We have elected the fair value option for all loans and loan commitments made by our capital markets businesses. These loans and loan commitments include loans entered into by our investment banking division in connection with client bridge financing and loan syndications, loans purchased by our leveraged credit trading desk as part of its bank loan trading activities and mortgage and consumer loan commitments, purchases and fundings in connection with mortgage- and other asset-backed securitization activities. Loans and loan commitments originated or purchased by our leveraged credit and mortgage-backed businesses are managed on a fair value basis. Loans are included in Financial instruments owned and loan commitments are included in Financial instruments owned and Financial instruments sold, not yet purchased in our Consolidated Statements of Financial Condition. The fair value option election is not applied to loans made to affiliate entities as such loans are entered into as part of ongoing, strategic business ventures. Loans to affiliate entities are included in Loans to and investments in related parties in our Consolidated Statements of Financial Condition and are accounted for on an amortized cost basis. We have also elected the fair value option for certain of our structured notes, which are managed by our capital markets business and are included in Long-term debt and Short-term borrowings in our Consolidated Statements of Financial Condition. We have elected the fair value option for certain financial instruments held by subsidiaries as the investments are risk managed by us on a fair value basis. The fair value option has also been elected for certain secured financings that arise in connection with our securitization activities and other structured financings. Other secured financings, Receivables – Brokers, dealers and clearing organizations, Receivables – Customers, Receivables – Fees, interest and other, Payables – Brokers, dealers and clearing organizations and Payables – Customers, are accounted for at cost plus accrued interest rather than at fair value; however, the recorded amounts approximate fair value due to their liquid or short-term nature.
The following is a summary of gains (losses) due to changes in instrument specific credit risk on loans, other receivables and debt instruments and gains (losses) due to other changes in fair value on Long-term debt and Short-term borrowings measured at fair value under the fair value option (in thousands):
Three Months Ended May 31, | Six Months Ended May 31, | ||||||||||||||
2018 | 2017 | 2018 | 2017 | ||||||||||||
Financial instruments owned: | |||||||||||||||
Loans and other receivables | $ | (8,754 | ) | $ | (4,282 | ) | $ | (6,428 | ) | $ | (11,094 | ) | |||
Financial instruments sold: | |||||||||||||||
Loans | $ | 1 | $ | (1,734 | ) | $ | 260 | $ | (1,761 | ) | |||||
Loan commitments | 26 | 3,332 | (103 | ) | 4,203 | ||||||||||
Long-term debt: | |||||||||||||||
Changes in instrument specific credit risk (1) | $ | 34,787 | $ | (3,757 | ) | $ | 18,585 | $ | (19,797 | ) | |||||
Other changes in fair value (2) | (175 | ) | 1,516 | 40,979 | 4,933 | ||||||||||
Short-term borrowings: | |||||||||||||||
Changes in instrument specific credit risk (1) | $ | 27 | $ | — | $ | 27 | $ | — | |||||||
Other changes in fair value (2) | 1,636 | — | 1,636 | — | |||||||||||
(1) | Changes in instrument-specific credit risk related to structured notes are included in our Consolidated Statements of Comprehensive Income, net of tax. |
(2) | Other changes in fair value are included in Principal transactions revenues in our Consolidated Statements of Earnings. |
28
JEFFERIES GROUP LLC AND SUBSIDIARIES
NOTES TO CONSOLIDATED FINANCIAL STATEMENTS - CONTINUED
(Unaudited)
The following is a summary of the amount by which contractual principal exceeds fair value for loans and other receivables, long-term debt and short-term borrowings measured at fair value under the fair value option (in thousands):
May 31, 2018 | November 30, 2017 | ||||||
Financial instruments owned: | |||||||
Loans and other receivables (1) | $ | 992,124 | $ | 752,076 | |||
Loans and other receivables on nonaccrual status and/or 90 days or greater past due (1) (2) | 193,097 | 159,462 | |||||
Long-term debt and short-term borrowings | 96,576 | 32,839 | |||||
(1) | Interest income is recognized separately from other changes in fair value and is included in Interest revenues in our Consolidated Statements of Earnings. |
(2) | Amounts include loans and other receivables 90 days or greater past due by which contractual principal exceeds fair value of $33.6 million and $38.7 million at May 31, 2018 and November 30, 2017, respectively. |
The aggregate fair value of loans and other receivables on nonaccrual status and/or 90 days or greater past due was $90.1 million and $55.1 million at May 31, 2018 and November 30, 2017, respectively, which includes loans and other receivables 90 days or greater past due of $25.2 million and $37.4 million at May 31, 2018 and November 30, 2017, respectively.
Financial Instruments Not Measured at Fair Value
Certain of our financial instruments are not carried at fair value but are recorded at amounts that approximate fair value due to their liquid or short-term nature and generally negligible credit risk. These financial assets include Cash and cash equivalents and Cash and securities segregated and on deposit for regulatory purposes or deposited with clearing and depository organizations and would generally be presented in Level 1 of the fair value hierarchy. Cash and securities segregated and on deposit for regulatory purposes or deposited with clearing and depository organizations includes U.S. Treasury securities with a fair value of $34.9 million and $99.7 million at May 31, 2018 and November 30, 2017, respectively.
Note 5. Derivative Financial Instruments
Derivative Financial Instruments
Our derivative activities are recorded at fair value in our Consolidated Statements of Financial Condition in Financial instruments owned and Financial instruments sold, not yet purchased, net of cash paid or received under credit support agreements and on a net counterparty basis when a legally enforceable right to offset exists under a master netting agreement. We enter into derivative transactions to satisfy the needs of our clients and to manage our own exposure to market and credit risks resulting from our trading activities. In addition, we apply hedge accounting to an interest rate swap that has been designated as a fair value hedge of the changes in fair value due to the benchmark interest rate for certain fixed rate senior long-term debt.
See Note 4, Fair Value Disclosures, and Note 16, Commitments, Contingencies and Guarantees, for additional disclosures about derivative financial instruments.
Derivatives are subject to various risks similar to other financial instruments, including market, credit and operational risk. The risks of derivatives should not be viewed in isolation, but rather should be considered on an aggregate basis along with our other trading-related activities. We manage the risks associated with derivatives on an aggregate basis along with the risks associated with proprietary trading as part of our firm wide risk management policies.
In connection with our derivative activities, we may enter into International Swaps and Derivatives Association, Inc. (“ISDA”) master netting agreements or similar agreements with counterparties. See Note 2, Summary of Significant Accounting Policies, in our consolidated financial statements included in Part II, Item 8 of our Annual Report on Form 10-K for the year ended November 30, 2017 for additional information regarding the offsetting of derivative contracts.
29
JEFFERIES GROUP LLC AND SUBSIDIARIES
NOTES TO CONSOLIDATED FINANCIAL STATEMENTS - CONTINUED
(Unaudited)
The following tables present the fair value and related number of derivative contracts at May 31, 2018 and November 30, 2017 categorized by type of derivative contract and the platform on which these derivatives are transacted. The fair value of assets/liabilities represents our receivable/payable for derivative financial instruments, gross of counterparty netting and cash collateral received and pledged. The following tables also provide information regarding 1) the extent to which, under enforceable master netting arrangements, such balances are presented net in our Consolidated Statements of Financial Condition as appropriate under U.S. GAAP and 2) the extent to which other rights of setoff associated with these arrangements exist and could have an effect on our financial position (in thousands, except contract amounts).
May 31, 2018 (1) | |||||||||||||
Assets | Liabilities | ||||||||||||
Fair Value | Number of Contracts (2) | Fair Value | Number of Contracts (2) | ||||||||||
Derivatives designated as accounting hedges: | |||||||||||||
Interest rate contracts: | |||||||||||||
Cleared OTC | $ | — | — | $ | 25,668 | 1 | |||||||
Total derivatives designated as accounting hedges | — | 25,668 | |||||||||||
Derivatives not designated as accounting hedges: | |||||||||||||
Interest rate contracts: | |||||||||||||
Exchange-traded | 877 | 52,817 | 70 | 17,923 | |||||||||
Cleared OTC | 423,300 | 2,102 | 429,762 | 2,481 | |||||||||
Bilateral OTC | 383,485 | 1,598 | 523,431 | 795 | |||||||||
Foreign exchange contracts: | |||||||||||||
Exchange-traded | — | 1,311 | — | 376 | |||||||||
Bilateral OTC | 289,720 | 5,190 | 282,478 | 5,221 | |||||||||
Equity contracts: | |||||||||||||
Exchange-traded | 2,121,965 | 2,136,503 | 2,083,622 | 1,865,988 | |||||||||
Bilateral OTC | 99,785 | 1,960 | 297,566 | 2,418 | |||||||||
Commodity contracts: | |||||||||||||
Exchange-traded | 105 | 4,154 | 27 | 4,680 | |||||||||
Credit contracts: | |||||||||||||
Cleared OTC | 42,968 | 74 | 25,053 | 67 | |||||||||
Bilateral OTC | 8,735 | 77 | 11,823 | 39 | |||||||||
Total derivatives not designated as accounting hedges | 3,370,940 | 3,653,832 | |||||||||||
Total gross derivative assets/ liabilities: | |||||||||||||
Exchange-traded | 2,122,947 | 2,083,719 | |||||||||||
Cleared OTC | 466,268 | 480,483 | |||||||||||
Bilateral OTC | 781,725 | 1,115,298 | |||||||||||
Amounts offset in our Consolidated Statements of Financial Condition (3): | |||||||||||||
Exchange-traded | (1,957,490 | ) | (1,957,490 | ) | |||||||||
Cleared OTC | (439,765 | ) | (448,493 | ) | |||||||||
Bilateral OTC | (698,221 | ) | (825,951 | ) | |||||||||
Net amounts per Consolidated Statements of Financial Condition (4) | $ | 275,464 | $ | 447,566 | |||||||||
(1) | Exchange-traded derivatives include derivatives executed on an organized exchange. Cleared OTC derivatives include derivatives executed bilaterally and subsequently novated to and cleared through central clearing counterparties. Bilateral OTC derivatives include derivatives executed and settled bilaterally without the use of an organized exchange or central clearing counterparty. |
(2) | Number of exchange traded contracts may include open futures contracts. The unsettled fair value of these futures contracts is included in Receivables from/Payables to brokers, dealers and clearing organizations in our Consolidated Statements of Financial Condition. |
30
JEFFERIES GROUP LLC AND SUBSIDIARIES
NOTES TO CONSOLIDATED FINANCIAL STATEMENTS - CONTINUED
(Unaudited)
(3) | Amounts netted include both netting by counterparty and for cash collateral paid or received. |
(4) | We have not received or pledged additional collateral under master netting agreements and/or other credit support agreements that is eligible to be offset beyond what has been offset in our Consolidated Statements of Financial Condition. |
November 30, 2017 (1) | |||||||||||||
Assets | Liabilities | ||||||||||||
Fair Value | Number of Contracts (2) | Fair Value | Number of Contracts (2) | ||||||||||
Derivatives designated as accounting hedges: | |||||||||||||
Interest rate contracts: | |||||||||||||
Cleared OTC (3) | $ | — | — | $ | 2,420 | 1 | |||||||
Total derivatives designated as accounting hedges | — | 2,420 | |||||||||||
Derivatives not designated as accounting hedges: | |||||||||||||
Interest rate contracts: | |||||||||||||
Exchange-traded | 1,957 | 33,972 | 66 | 8,515 | |||||||||
Cleared OTC (3) | 1,334,878 | 2,711 | 1,263,994 | 2,948 | |||||||||
Bilateral OTC | 380,223 | 1,804 | 444,716 | 1,346 | |||||||||
Foreign exchange contracts: | |||||||||||||
Exchange-traded | 157 | 2,045 | 20 | 101 | |||||||||
Bilateral OTC | 303,091 | 4,338 | 286,582 | 4,361 | |||||||||
Equity contracts: | |||||||||||||
Exchange-traded | 1,288,295 | 2,654,555 | 1,375,832 | 2,090,935 | |||||||||
Bilateral OTC | 78,812 | 1,847 | 247,750 | 1,722 | |||||||||
Commodity contracts: | |||||||||||||
Exchange-traded | 209 | 3,723 | 18 | 3,819 | |||||||||
Credit contracts: | |||||||||||||
Cleared OTC | 5,506 | 18 | 8,613 | 27 | |||||||||
Bilateral OTC | 24,921 | 110 | 33,188 | 164 | |||||||||
Total derivatives not designated as accounting hedges | 3,418,049 | 3,660,779 | |||||||||||
Total gross derivative assets/liabilities: | |||||||||||||
Exchange-traded | 1,290,618 | 1,375,936 | |||||||||||
Cleared OTC | 1,340,384 | 1,275,027 | |||||||||||
Bilateral OTC | 787,047 | 1,012,236 | |||||||||||
Amounts offset in our Consolidated Statements of Financial Condition (4): | |||||||||||||
Exchange-traded | (1,268,043 | ) | (1,268,043 | ) | |||||||||
Cleared OTC (3) | (1,319,895 | ) | (1,274,900 | ) | |||||||||
Bilateral OTC | (666,278 | ) | (883,306 | ) | |||||||||
Net amounts per Consolidated Statements of Financial Condition (5) | $ | 163,833 | $ | 236,950 | |||||||||
(1) | Exchange-traded derivatives include derivatives executed on an organized exchange. Cleared OTC derivatives include derivatives executed bilaterally and subsequently novated to and cleared through central clearing counterparties. Bilateral OTC derivatives include derivatives executed and settled bilaterally without the use of an organized exchange or central clearing counterparty. |
(2) | Number of exchange traded contracts may include open futures contracts. The unsettled fair value of these futures contracts is included in Receivables from/Payables to brokers, dealers and clearing organizations in our Consolidated Statements of Financial Condition. |
31
JEFFERIES GROUP LLC AND SUBSIDIARIES
NOTES TO CONSOLIDATED FINANCIAL STATEMENTS - CONTINUED
(Unaudited)
(3) | Pursuant to a rule change by the London Clearing House in the first fiscal quarter of 2018, variation margin exchanged each day with this clearing organization on certain interest rate derivatives is characterized as settlement payments as opposed to cash posted as collateral. The impact of this rule change would have been a reduction in gross interest rate derivative assets and liabilities as of November 30, 2017 of approximately $800 million, and a corresponding decrease in counterparty and cash collateral netting, with no impact to our Consolidated Statement of Financial Condition. |
(4) | Amounts netted include both netting by counterparty and for cash collateral paid or received. |
(5) | We have not received or pledged additional collateral under master netting agreements and/or other credit support agreements that is eligible to be offset beyond what has been offset in our Consolidated Statements of Financial Condition. |
The following table provides information related to gains (losses) recognized in Interest expense in our Consolidated Statements of Earnings on a fair value hedge (in thousands):
Three Months Ended May 31, | Six Months Ended May 31, | ||||||||||||||
Gains (Losses) | 2018 | 2017 | 2018 | 2017 | |||||||||||
Interest rate swaps | $ | 19 | $ | 12,352 | $ | (21,202 | ) | $ | 7,743 | ||||||
Long-term debt | 120 | (10,295 | ) | 22,835 | (4,890 | ) | |||||||||
Total | $ | 139 | $ | 2,057 | $ | 1,633 | $ | 2,853 | |||||||
The following table presents unrealized and realized gains (losses) on derivative contracts recognized in Principal transactions revenue in our Consolidated Statements of Earnings, which are utilized in connection with our client activities and our economic risk management activities (in thousands):
Three Months Ended May 31, | Six Months Ended May 31, | ||||||||||||||
Gains (Losses) | 2018 | 2017 | 2018 | 2017 | |||||||||||
Interest rate contracts | $ | (4,860 | ) | $ | (960 | ) | $ | 22,102 | $ | 9,037 | |||||
Foreign exchange contracts | 6,365 | 1,099 | 10,628 | 3,107 | |||||||||||
Equity contracts | (53,598 | ) | 417 | (217,039 | ) | (168,699 | ) | ||||||||
Commodity contracts | 2,921 | (6,395 | ) | 2,744 | (6,906 | ) | |||||||||
Credit contracts | 2,024 | (1,134 | ) | 2,406 | 10,907 | ||||||||||
Total | $ | (47,148 | ) | $ | (6,973 | ) | $ | (179,159 | ) | $ | (152,554 | ) | |||
The net gains (losses) on derivative contracts in the table above are one of a number of activities comprising our business activities and are before consideration of economic hedging transactions, which generally offset the net gains (losses) included above. We substantially mitigate our exposure to market risk on our cash instruments through derivative contracts, which generally provide offsetting revenues, and we manage the risk associated with these contracts in the context of our overall risk management framework.
32
JEFFERIES GROUP LLC AND SUBSIDIARIES
NOTES TO CONSOLIDATED FINANCIAL STATEMENTS - CONTINUED
(Unaudited)
OTC Derivatives. The following tables set forth by remaining contract maturity the fair value of OTC derivative assets and liabilities at May 31, 2018 (in thousands):
OTC Derivative Assets (1) (2) (3) | |||||||||||||||||||
0 – 12 Months | 1 – 5 Years | Greater Than 5 Years | Cross-Maturity Netting (4) | Total | |||||||||||||||
Equity swaps and options | $ | 940 | $ | 4,178 | $ | — | $ | (214 | ) | $ | 4,904 | ||||||||
Credit default swaps | 26 | 20,045 | 2,790 | (779 | ) | 22,082 | |||||||||||||
Total return swaps | 49,176 | 3,233 | — | (756 | ) | 51,653 | |||||||||||||
Foreign currency forwards, swaps and options | 58,321 | 17,215 | — | (3,355 | ) | 72,181 | |||||||||||||
Fixed income forwards | 477 | — | — | — | 477 | ||||||||||||||
Interest rate swaps, options and forwards | 21,599 | 104,120 | 88,827 | (86,399 | ) | 128,147 | |||||||||||||
Total | $ | 130,539 | $ | 148,791 | $ | 91,617 | $ | (91,503 | ) | 279,444 | |||||||||
Cross product counterparty netting | (34,466 | ) | |||||||||||||||||
Total OTC derivative assets included in Financial instruments owned | $ | 244,978 | |||||||||||||||||
(1) | At May 31, 2018, we held exchange-traded derivative assets and other credit agreements with a fair value of $166.0 million, which are not included in this table. |
(2) | OTC derivative assets in the table above are gross of collateral received. OTC derivative assets are recorded net of collateral received in our Consolidated Statements of Financial Condition. At May 31, 2018, cash collateral received was $135.6 million. |
(3) | Derivative fair values include counterparty netting within product category. |
(4) | Amounts represent the netting of receivable balances with payable balances for the same counterparty within product category across maturity categories. |
OTC Derivative Liabilities (1) (2) (3) | |||||||||||||||||||
0 – 12 Months | 1 – 5 Years | Greater Than 5 Years | Cross-Maturity Netting (4) | Total | |||||||||||||||
Equity swaps and options | $ | 13,752 | $ | 69,159 | $ | 3,141 | $ | (214 | ) | $ | 85,838 | ||||||||
Credit default swaps | 64 | 7,405 | 6 | (779 | ) | 6,696 | |||||||||||||
Total return swaps | 64,750 | 101,271 | — | (756 | ) | 165,265 | |||||||||||||
Foreign currency forwards, swaps and options | 55,185 | 13,123 | — | (3,355 | ) | 64,953 | |||||||||||||
Fixed income forwards | 3,879 | — | — | — | 3,879 | ||||||||||||||
Interest rate swaps, options and forwards | 35,661 | 135,417 | 215,891 | (86,399 | ) | 300,570 | |||||||||||||
Total | $ | 173,291 | $ | 326,375 | $ | 219,038 | $ | (91,503 | ) | 627,201 | |||||||||
Cross product counterparty netting | (34,466 | ) | |||||||||||||||||
Total OTC derivative liabilities included in Financial instruments sold, not yet purchased | $ | 592,735 | |||||||||||||||||
(1) | At May 31, 2018, we held exchange-traded derivative liabilities and other credit agreements with a fair value of $126.9 million, which are not included in this table. |
(2) | OTC derivative liabilities in the table above are gross of collateral pledged. OTC derivative liabilities are recorded net of collateral pledged in our Consolidated Statements of Financial Condition. At May 31, 2018, cash collateral pledged was $272.0 million. |
(3) | Derivative fair values include counterparty netting within product category. |
(4) | Amounts represent the netting of receivable balances with payable balances for the same counterparty within product category across maturity categories. |
33
JEFFERIES GROUP LLC AND SUBSIDIARIES
NOTES TO CONSOLIDATED FINANCIAL STATEMENTS - CONTINUED
(Unaudited)
The following table presents the counterparty credit quality with respect to the fair value of our OTC derivative assets at May 31, 2018 (in thousands):
Counterparty credit quality (1): | |||
A- or higher | $ | 173,732 | |
BBB- to BBB+ | 3,835 | ||
BB+ or lower | 52,437 | ||
Unrated | 14,974 | ||
Total | $ | 244,978 | |
(1) | We utilize internal credit ratings determined by our Risk Management department. Credit ratings determined by Risk Management use methodologies that produce ratings generally consistent with those produced by external rating agencies. |
Credit Related Derivative Contracts
The external credit ratings of the underlyings or referenced assets for our written credit related derivative contracts (in millions):
May 31, 2018 | |||||||||||
External Credit Rating | |||||||||||
Investment Grade | Non-investment Grade | Total Notional | |||||||||
Credit protection sold: | |||||||||||
Index credit default swaps | $ | 203.0 | $ | 280.0 | $ | 483.0 | |||||
Single name credit default swaps | 44.3 | 27.8 | 72.1 | ||||||||
November 30, 2017 | |||||||||||
External Credit Rating | |||||||||||
Investment Grade | Non-investment Grade | Total Notional | |||||||||
Credit protection sold: | |||||||||||
Index credit default swaps | $ | 3.0 | $ | 46.0 | $ | 49.0 | |||||
Single name credit default swaps | 129.1 | 89.1 | 218.2 | ||||||||
Contingent Features
Certain of our derivative instruments contain provisions that require our debt to maintain an investment grade credit rating from each of the major credit rating agencies. If our debt were to fall below investment grade, it would be in violation of these provisions and the counterparties to the derivative instruments could request immediate payment or demand immediate and ongoing full overnight collateralization on our derivative instruments in liability positions. The following table presents the aggregate fair value of all derivative instruments with such credit-risk-related contingent features that are in a liability position, the collateral amounts we have posted or received in the normal course of business and the potential collateral we would have been required to return and/or post additionally to our counterparties if the credit-risk-related contingent features underlying these agreements were triggered (in millions):
May 31, 2018 | November 30, 2017 | ||||||
Derivative instrument liabilities with credit-risk-related contingent features | $ | 186.1 | $ | 95.1 | |||
Collateral posted | (56.1 | ) | (86.4 | ) | |||
Collateral received | 119.5 | 5.6 | |||||
Return of and additional collateral required in the event of a credit rating downgrade below investment grade (1) | 249.5 | 14.3 | |||||
(1) | These outflows include initial margin received from counterparties at the execution of the derivative contract. The initial margin will be returned if counterparties elect to terminate the contract after a downgrade. |
34
JEFFERIES GROUP LLC AND SUBSIDIARIES
NOTES TO CONSOLIDATED FINANCIAL STATEMENTS - CONTINUED
(Unaudited)
Note 6. Collateralized Transactions
We enter into secured borrowing and lending arrangements to obtain collateral necessary to effect settlement, finance inventory positions, meet customer needs or re-lend as part of our dealer operations. We monitor the fair value of the securities loaned and borrowed on a daily basis as compared with the related payable or receivable, and request additional collateral or return of excess collateral, as appropriate. We pledge financial instruments as collateral under repurchase agreements, securities lending agreements and other secured arrangements, including clearing arrangements. Our agreements with counterparties generally contain contractual provisions allowing the counterparty the right to sell or repledge the collateral. Pledged securities owned that can be sold or repledged by the counterparty are included in Financial instruments owned and noted parenthetically as Securities pledged in our Consolidated Statements of Financial Condition.
In instances where we receive securities as collateral in connection with securities-for-securities transactions in which we are the lender of securities and are permitted to sell or repledge the securities received as collateral, we report the fair value of the collateral received and the related obligation to return the collateral in the Consolidated Statements of Financial Condition. At May 31, 2018 and November 30, 2017, $0 and $103,000, respectively, were reported as Securities received as collateral and as Obligation to return securities received as collateral.
The following tables set forth the carrying value of securities lending arrangements, repurchase agreements and obligation to return securities received as collateral by class of collateral pledged (in thousands):
May 31, 2018 | |||||||||||
Securities Lending Arrangements | Repurchase Agreements | Total | |||||||||
Collateral Pledged: | |||||||||||
Corporate equity securities | $ | 2,210,311 | $ | 430,084 | $ | 2,640,395 | |||||
Corporate debt securities | 343,068 | 1,999,524 | 2,342,592 | ||||||||
Mortgage- and asset-backed securities | — | 3,179,689 | 3,179,689 | ||||||||
U.S. government and federal agency securities | 2,322 | 7,938,208 | 7,940,530 | ||||||||
Municipal securities | — | 550,030 | 550,030 | ||||||||
Sovereign obligations | — | 2,419,766 | 2,419,766 | ||||||||
Loans and other receivables | — | 539,940 | 539,940 | ||||||||
Total | $ | 2,555,701 | $ | 17,057,241 | $ | 19,612,942 | |||||
November 30, 2017 | |||||||||||||||
Securities Lending Arrangements | Repurchase Agreements | Obligation To Return Securities Received As Collateral | Total | ||||||||||||
Collateral Pledged: | |||||||||||||||
Corporate equity securities | $ | 2,353,798 | $ | 214,413 | $ | — | $ | 2,568,211 | |||||||
Corporate debt securities | 470,908 | 2,336,702 | — | 2,807,610 | |||||||||||
Mortgage- and asset-backed securities | — | 2,562,268 | — | 2,562,268 | |||||||||||
U.S. government and federal agency securities | 19,205 | 11,792,534 | — | 11,811,739 | |||||||||||
Municipal securities | — | 444,861 | — | 444,861 | |||||||||||
Sovereign obligations | — | 2,023,530 | 103 | 2,023,633 | |||||||||||
Loans and other receivables | — | 454,941 | — | 454,941 | |||||||||||
Total | $ | 2,843,911 | $ | 19,829,249 | $ | 103 | $ | 22,673,263 | |||||||
35
JEFFERIES GROUP LLC AND SUBSIDIARIES
NOTES TO CONSOLIDATED FINANCIAL STATEMENTS - CONTINUED
(Unaudited)
The following tables set forth the carrying value of securities lending arrangements, repurchase agreements and obligation to return securities received as collateral by remaining contractual maturity (in thousands):
May 31, 2018 | |||||||||||||||||||
Overnight and Continuous | Up to 30 Days | 31-90 Days | Greater than 90 Days | Total | |||||||||||||||
Securities lending arrangements | $ | 1,369,012 | $ | — | $ | 856,607 | $ | 330,082 | $ | 2,555,701 | |||||||||
Repurchase agreements | 8,515,963 | 2,261,426 | 3,998,685 | 2,281,167 | 17,057,241 | ||||||||||||||
Total | $ | 9,884,975 | $ | 2,261,426 | $ | 4,855,292 | $ | 2,611,249 | $ | 19,612,942 | |||||||||
November 30, 2017 | |||||||||||||||||||
Overnight and Continuous | Up to 30 Days | 31-90 Days | Greater than 90 Days | Total | |||||||||||||||
Securities lending arrangements | $ | 1,676,940 | $ | — | $ | 741,971 | $ | 425,000 | $ | 2,843,911 | |||||||||
Repurchase agreements | 10,780,474 | 4,058,228 | 3,211,464 | 1,779,083 | 19,829,249 | ||||||||||||||
Obligation to return securities received as collateral | 103 | — | — | — | 103 | ||||||||||||||
Total | $ | 12,457,517 | $ | 4,058,228 | $ | 3,953,435 | $ | 2,204,083 | $ | 22,673,263 | |||||||||
We receive securities as collateral under resale agreements, securities borrowing transactions and customer margin loans. We also receive securities as collateral in connection with securities-for-securities transactions in which we are the lender of securities. In many instances, we are permitted by contract to rehypothecate the securities received as collateral. These securities may be used to secure repurchase agreements, enter into securities lending transactions, satisfy margin requirements on derivative transactions or cover short positions. At May 31, 2018 and November 30, 2017, the approximate fair value of securities received as collateral by us that may be sold or repledged was $25.3 billion and $27.1 billion, respectively. At May 31, 2018 and November 30, 2017, a substantial portion of the securities received by us had been sold or repledged.
Offsetting of Securities Financing Agreements
To manage our exposure to credit risk associated with securities financing transactions, we may enter into master netting agreements and collateral arrangements with counterparties. Generally, transactions are executed under standard industry agreements, including, but not limited to, master securities lending agreements (securities lending transactions) and master repurchase agreements (repurchase transactions). See Note 2, Summary of Significant Accounting Policies, in our consolidated financial statements included in Part II, Item 8 of our Annual Report on Form 10-K for the year ended November 30, 2017 for additional information regarding the offsetting of securities financing agreements.
The following tables provide information regarding repurchase agreements, securities borrowing and lending arrangements and securities received as collateral and obligation to return securities received as collateral that are recognized in our Consolidated Statements of Financial Condition and 1) the extent to which, under enforceable master netting arrangements, such balances are presented net in our Consolidated Statements of Financial Condition as appropriate under U.S. GAAP and 2) the extent to which other rights of setoff associated with these arrangements exist and could have an effect on our financial position (in thousands).
May 31, 2018 | |||||||||||||||||||||||
Gross Amounts | Netting in Consolidated Statement of Financial Condition | Net Amounts in Consolidated Statement of Financial Condition | Additional Amounts Available for Setoff (1) | Available Collateral (2) | Net Amount (3) | ||||||||||||||||||
Assets: | |||||||||||||||||||||||
Securities borrowing arrangements | $ | 7,599,043 | $ | — | $ | 7,599,043 | $ | (434,474 | ) | $ | (966,570 | ) | $ | 6,197,999 | |||||||||
Reverse repurchase agreements | 12,105,967 | (8,283,735 | ) | 3,822,232 | (286,116 | ) | (3,508,358 | ) | 27,758 | ||||||||||||||
Liabilities: | |||||||||||||||||||||||
Securities lending arrangements | $ | 2,555,701 | $ | — | $ | 2,555,701 | $ | (434,474 | ) | $ | (2,056,484 | ) | $ | 64,743 | |||||||||
Repurchase agreements | 17,057,241 | (8,283,735 | ) | 8,773,506 | (286,116 | ) | (7,269,369 | ) | 1,218,021 | ||||||||||||||
36
JEFFERIES GROUP LLC AND SUBSIDIARIES
NOTES TO CONSOLIDATED FINANCIAL STATEMENTS - CONTINUED
(Unaudited)
November 30, 2017 | |||||||||||||||||||||||
Gross Amounts | Netting in Consolidated Statement of Financial Condition | Net Amounts in Consolidated Statement of Financial Condition | Additional Amounts Available for Setoff (1) | Available Collateral (2) | Net Amount (4) | ||||||||||||||||||
Assets: | |||||||||||||||||||||||
Securities borrowing arrangements | $ | 7,721,803 | $ | — | $ | 7,721,803 | $ | (966,712 | ) | $ | (1,032,629 | ) | $ | 5,722,462 | |||||||||
Reverse repurchase agreements | 14,858,297 | (11,168,738 | ) | 3,689,559 | (463,973 | ) | (3,207,147 | ) | 18,439 | ||||||||||||||
Securities received as collateral | 103 | — | 103 | — | (103 | ) | — | ||||||||||||||||
Liabilities: | |||||||||||||||||||||||
Securities lending arrangements | $ | 2,843,911 | $ | — | $ | 2,843,911 | $ | (966,712 | ) | $ | (1,795,408 | ) | $ | 81,791 | |||||||||
Repurchase agreements | 19,829,249 | (11,168,738 | ) | 8,660,511 | (463,973 | ) | (7,067,512 | ) | 1,129,026 | ||||||||||||||
Obligation to return securities received as collateral | 103 | — | 103 | — | (103 | ) | — | ||||||||||||||||
(1) | Under master netting agreements with our counterparties, we have the legal right of offset with a counterparty, which incorporates all of the counterparty’s outstanding rights and obligations under the arrangement. These balances reflect additional credit risk mitigation that is available by counterparty in the event of a counterparty’s default, but which are not netted in the balance sheet because other netting provisions of U.S. GAAP are not met. |
(2) | Includes securities received or paid under collateral arrangements with counterparties that could be liquidated in the event of a counterparty default and thus offset against a counterparty’s rights and obligations under the respective repurchase agreements or securities borrowing or lending arrangements. |
(3) | Amounts include $6,148.2 million of securities borrowing arrangements, for which we have received securities collateral of $5,972.9 million, and $1,205.5 million of repurchase agreements, for which we have pledged securities collateral of $1,244.0 million, which are subject to master netting agreements but we have not determined the agreements to be legally enforceable. |
(4) | Amounts include $5,678.6 million of securities borrowing arrangements, for which we have received securities collateral of $5,516.7 million, and $1,084.4 million of repurchase agreements, for which we have pledged securities collateral of $1,115.9 million, which are subject to master netting agreements but we have not determined the agreements to be legally enforceable. |
Cash and Securities Segregated and on Deposit for Regulatory Purposes or Deposited with Clearing and Depository Organizations
Cash and securities deposited with clearing and depository organizations and segregated in accordance with regulatory regulations totaled $709.6 million and $578.0 million at May 31, 2018 and November 30, 2017, respectively. Segregated cash and securities consist of deposits in accordance with Rule 15c3-3 of the Securities Exchange Act of 1934, which subjects Jefferies LLC as a broker-dealer carrying customer accounts to requirements related to maintaining cash or qualified securities in segregated special reserve bank accounts for the exclusive benefit of its customers.
Note 7. Securitization Activities
We engage in securitization activities related to corporate loans, commercial mortgage loans, consumer loans and mortgage-backed and other asset-backed securities. In our securitization transactions, we transfer these assets to special purpose entities (“SPEs”) and act as the placement or structuring agent for the beneficial interests sold to investors by the SPE. A significant portion of our securitization transactions are the securitization of assets issued or guaranteed by U.S. government agencies. These SPEs generally meet the criteria of VIEs; however, we generally do not consolidate the SPEs as we are not considered the primary beneficiary for these SPEs. See Note 8, Variable Interest Entities, for further discussion on VIEs and our determination of the primary beneficiary.
37
JEFFERIES GROUP LLC AND SUBSIDIARIES
NOTES TO CONSOLIDATED FINANCIAL STATEMENTS - CONTINUED
(Unaudited)
We account for our securitization transactions as sales, provided we have relinquished control over the transferred assets. Transferred assets are carried at fair value with unrealized gains and losses reflected in Principal transactions revenues in our Consolidated Statements of Earnings prior to the identification and isolation for securitization. Subsequently, revenues recognized upon securitization are reflected as net underwriting revenues. We generally receive cash proceeds in connection with the transfer of assets to an SPE. We may, however, have continuing involvement with the transferred assets, which is limited to retaining one or more tranches of the securitization (primarily senior and subordinated debt securities in the form of mortgage- and other-asset backed securities or CLOs), which are included in Financial instruments owned and are generally initially categorized as Level 2 within the fair value hierarchy. We apply fair value accounting to the securities. For further information on fair value measurements and the fair value hierarchy, refer to Note 4, Fair Value Disclosures, herein, and Note 2, Summary of Significant Accounting Policies, in our consolidated financial statements included in Part II, Item 8 of our Annual Report on Form 10-K for the year ended November 30, 2017.
The following table presents activity related to our securitizations that were accounted for as sales in which we had continuing involvement (in millions):
Three Months Ended May 31, | Six Months Ended May 31, | ||||||||||||||
2018 | 2017 | 2018 | 2017 | ||||||||||||
Transferred assets | $ | 1,042.6 | $ | 715.1 | $ | 3,800.3 | $ | 1,668.6 | |||||||
Proceeds on new securitizations | 1,043.4 | 723.6 | 3,802.3 | 1,686.1 | |||||||||||
Cash flows received on retained interests | 7.8 | 8.2 | 23.8 | 14.6 | |||||||||||
We have no explicit or implicit arrangements to provide additional financial support to these SPEs, have no liabilities related to these SPEs and do not have any outstanding derivative contracts executed in connection with these securitization activities at May 31, 2018 and November 30, 2017.
The following tables summarize our retained interests in SPEs where we transferred assets and have continuing involvement and received sale accounting treatment (in millions):
May 31, 2018 | November 30, 2017 | ||||||||||||||
Securitization Type | Total Assets | Retained Interests | Total Assets | Retained Interests | |||||||||||
U.S. government agency RMBS | $ | 10,472.8 | $ | 376.2 | $ | 6,383.5 | $ | 28.2 | |||||||
U.S. government agency CMBS | 1,350.1 | 123.3 | 2,075.7 | 81.4 | |||||||||||
CLOs | 2,804.0 | 10.4 | 3,957.8 | 20.3 | |||||||||||
Consumer and other loans | 331.0 | 44.4 | 247.6 | 47.8 | |||||||||||
Total assets represent the unpaid principal amount of assets in the SPEs in which we have continuing involvement and are presented solely to provide information regarding the size of the transactions and the size of the underlying assets supporting our retained interests, and are not considered representative of the risk of potential loss. Assets retained in connection with a securitization transaction represent the fair value of the securities of one or more tranches issued by an SPE, including senior and subordinated tranches. Our risk of loss is limited to this fair value amount which is included in total Financial instruments owned in our Consolidated Statements of Financial Condition.
Although not obligated, in connection with secondary market-making activities we may make a market in the securities issued by these SPEs. In these market-making transactions, we buy these securities from and sell these securities to investors. Securities purchased through these market-making activities are not considered to be continuing involvement in these SPEs. To the extent we purchased securities through these market-making activities and we are not deemed to be the primary beneficiary of the VIE, these securities are included in agency and non-agency mortgage- and asset-backed securitizations in the nonconsolidated VIEs section presented in Note 8, Variable Interest Entities.
38
JEFFERIES GROUP LLC AND SUBSIDIARIES
NOTES TO CONSOLIDATED FINANCIAL STATEMENTS - CONTINUED
(Unaudited)
Note 8. Variable Interest Entities
VIEs are entities in which equity investors lack the characteristics of a controlling financial interest. VIEs are consolidated by the primary beneficiary. The primary beneficiary is the party who has both (1) the power to direct the activities of a VIE that most significantly impact the entity’s economic performance and (2) an obligation to absorb losses of the entity or a right to receive benefits from the entity that could potentially be significant to the entity.
Our variable interests in VIEs include debt and equity interests, commitments, guarantees and certain fees. Our involvement with VIEs arises primarily from:
• | Purchases of securities in connection with our trading and secondary market making activities; |
• | Retained interests held as a result of securitization activities, including the resecuritization of mortgage- and other asset-backed securities and the securitization of commercial mortgage, corporate and consumer loans; |
• | Acting as placement agent and/or underwriter in connection with client-sponsored securitizations; |
• | Financing of agency and non-agency mortgage- and other asset-backed securities; |
• | Warehouse funding arrangements for client-sponsored consumer loan vehicles and CLOs through participation certificates, forward sale agreements and revolving loan and note commitments; and |
• | Loans to, investments in and fees from various investment vehicles. |
We determine whether we are the primary beneficiary of a VIE upon our initial involvement with the VIE and we reassess whether we are the primary beneficiary of a VIE on an ongoing basis. Our determination of whether we are the primary beneficiary of a VIE is based upon the facts and circumstances for each VIE and requires significant judgment. Our considerations in determining the VIE’s most significant activities and whether we have power to direct those activities include, but are not limited to, the VIE’s purpose and design and the risks passed through to investors, the voting interests of the VIE, management, service and/or other agreements of the VIE, involvement in the VIE’s initial design and the existence of explicit or implicit financial guarantees. In situations where we have determined that the power over the VIE’s significant activities is shared, we assess whether we are the party with the power over the most significant activities. If we are the party with the power over the most significant activities, we meet the “power” criteria of the primary beneficiary. If we do not have the power over the most significant activities or we determine that decisions require consent of each sharing party, we do not meet the “power” criteria of the primary beneficiary.
We assess our variable interests in a VIE both individually and in aggregate to determine whether we have an obligation to absorb losses of or a right to receive benefits from the VIE that could potentially be significant to the VIE. The determination of whether our variable interest is significant to the VIE requires significant judgment. In determining the significance of our variable interest, we consider the terms, characteristics and size of the variable interests, the design and characteristics of the VIE, our involvement in the VIE and our market-making activities related to the variable interests.
Consolidated VIEs
The following table presents information about our consolidated VIEs at May 31, 2018 and November 30, 2017 (in millions). The assets and liabilities in the tables below are presented prior to consolidation and thus a portion of these assets and liabilities are eliminated in consolidation.
May 31, 2018 | November 30, 2017 | ||||||||||||||
Securitization Vehicles | Other | Securitization Vehicles | Other | ||||||||||||
Cash | $ | 4.1 | $ | 1.1 | $ | 6.5 | $ | 1.1 | |||||||
Financial instruments owned | 0.9 | 0.4 | 37.6 | 0.4 | |||||||||||
Securities purchased under agreements to resell (1) | 1,022.0 | — | 729.3 | — | |||||||||||
Fees, interest and other receivables | — | — | 0.2 | — | |||||||||||
Total assets | $ | 1,027.0 | $ | 1.5 | $ | 773.6 | $ | 1.5 | |||||||
Other secured financings (2) | $ | 1,022.9 | $ | — | $ | 766.2 | $ | — | |||||||
Other liabilities | 3.4 | 0.2 | 5.9 | 0.2 | |||||||||||
Total liabilities | $ | 1,026.3 | $ | 0.2 | $ | 772.1 | $ | 0.2 | |||||||
39
JEFFERIES GROUP LLC AND SUBSIDIARIES
NOTES TO CONSOLIDATED FINANCIAL STATEMENTS - CONTINUED
(Unaudited)
(1) | Securities purchased under agreements to resell represent amounts due under collateralized transactions on related consolidated entities, which are eliminated in consolidation. |
(2) | Approximately $54.0 million and $44.1 million of the secured financing represents an amount held by us in inventory and is eliminated in consolidation at May 31, 2018 and November 30, 2017, respectively. |
Securitization Vehicles. We are the primary beneficiary of asset-backed financing vehicles to which we sell agency and non-agency residential and commercial mortgage loans, mortgage-backed securities and consumer loans pursuant to the terms of a master repurchase agreement. We manage the assets within these vehicles. Our variable interests in these vehicles consist of our collateral margin maintenance obligations under the master repurchase agreement and retained interests in securities issued. The assets of these VIEs consist of reverse repurchase agreements, which are available for the benefit of the vehicle’s debt holders. The creditors of these VIEs do not have recourse to our general credit and each such VIE’s assets are not available to satisfy any other debt.
We are also the primary beneficiary of a securitization vehicle associated with our financing of small business loans. In the creation of the securitization vehicle, we were involved in the decisions made during the establishment and design of the entity and hold variable interests consisting of the securities retained that could potentially be significant. The assets of the VIE consist of small business loans, which are available for the benefit of the vehicles’ beneficial interest holders. The creditors of the VIE do not have recourse to our general credit and the assets of the VIE are not available to satisfy any other debt.
Other. We are the primary beneficiary of certain investment vehicles set up for the benefit of our employees. We manage and invest alongside our employees in these vehicles. The assets of these VIEs consist of private equity securities, and are available for the benefit of the entities’ equity holders. Our variable interests in these vehicles consist of equity securities. The creditors of these VIEs do not have recourse to our general credit and each such VIE’s assets are not available to satisfy any other debt.
Nonconsolidated VIEs
The following tables present information about our variable interests in nonconsolidated VIEs (in millions):
May 31, 2018 | |||||||||||||||
Carrying Amount | Maximum Exposure to Loss | VIE Assets | |||||||||||||
Assets | Liabilities | ||||||||||||||
CLOs | $ | 301.1 | $ | 3.9 | $ | 1,701.9 | $ | 4,151.1 | |||||||
Consumer loan vehicles | 315.6 | — | 627.2 | 2,856.2 | |||||||||||
Related party private equity vehicles | 33.8 | — | 52.0 | 106.7 | |||||||||||
Other private investment vehicles | 49.0 | — | 52.3 | 3,203.5 | |||||||||||
Total | $ | 699.5 | $ | 3.9 | $ | 2,433.4 | $ | 10,317.5 | |||||||
November 30, 2017 | |||||||||||||||
Carrying Amount | Maximum Exposure to Loss | VIE Assets | |||||||||||||
Assets | Liabilities | ||||||||||||||
CLOs | $ | 163.5 | $ | 8.9 | $ | 1,020.5 | $ | 5,210.4 | |||||||
Consumer loan vehicles | 254.8 | — | 759.8 | 2,322.7 | |||||||||||
Related party private equity vehicles | 23.7 | — | 45.4 | 75.0 | |||||||||||
Other private investment vehicles | 48.0 | — | 48.7 | 2,938.4 | |||||||||||
Total | $ | 490.0 | $ | 8.9 | $ | 1,874.4 | $ | 10,546.5 | |||||||
Our maximum exposure to loss often differs from the carrying value of the variable interests. The maximum exposure to loss is dependent on the nature of our variable interests in the VIEs and is limited to the notional amounts of certain loan and equity commitments and guarantees. Our maximum exposure to loss does not include the offsetting benefit of any financial instruments that may be utilized to hedge the risks associated with our variable interests and is not reduced by the amount of collateral held as part of a transaction with a VIE.
40
JEFFERIES GROUP LLC AND SUBSIDIARIES
NOTES TO CONSOLIDATED FINANCIAL STATEMENTS - CONTINUED
(Unaudited)
Collateralized Loan Obligations. Assets collateralizing the CLOs include bank loans, participation interests and sub-investment grade and senior secured U.S. loans. We underwrite securities issued in CLO transactions on behalf of sponsors and provide advisory services to the sponsors. We may also sell corporate loans to the CLOs. Our variable interests in connection with CLOs where we have been involved in providing underwriting and/or advisory services consist of the following:
• | Forward sale agreements whereby we commit to sell, at a fixed price, corporate loans and ownership interests in an entity holding such corporate loans to CLOs; |
• | Warehouse funding arrangements in the form of participation interests in corporate loans held by CLOs and commitments to fund such participation interests; |
• | Trading positions in securities issued in a CLO transaction; and |
• | Investments in variable funding notes issued by CLOs. |
Consumer Loan Vehicles. We provide financing and lending related services to certain client-sponsored VIEs in the form of revolving funding note agreements, revolving credit facilities and forward purchase agreements. The underlying assets, which are collateralizing the vehicles, are primarily composed of unsecured consumer and small business loans. In addition, we may provide structuring and advisory services and act as an underwriter or placement agent for securities issued by the vehicles. We do not control the activities of these entities.
Related Party Private Equity Vehicles. We committed to invest equity in private equity funds (the “JCP Funds”) managed by Jefferies Capital Partners, LLC (the “JCP Manager”). Additionally, we committed to invest equity in the general partners of the JCP Funds (the “JCP General Partners”) and the JCP Manager. Our variable interests in the JCP Funds, JCP General Partners and JCP Manager (collectively, the “JCP Entities”) consist of equity interests that, in total, provide us with limited and general partner investment returns of the JCP Funds, a portion of the carried interest earned by the JCP General Partners and a portion of the management fees earned by the JCP Manager. At May 31, 2018 and November 30, 2017, our total equity commitment in the JCP Entities was $144.7 million and $148.1 million, respectively, of which $126.5 million and $126.3 million had been funded, respectively. The carrying value of our equity investments in the JCP Entities was $33.8 million and $23.7 million at May 31, 2018 and November 30, 2017, respectively. Our exposure to loss is limited to the total of our carrying value and unfunded equity commitment. The assets of the JCP Entities primarily consist of private equity and equity related investments.
Other Private Investment Vehicles. At May 31, 2018 and November 30, 2017, we had equity commitments to invest $64.8 million and $61.8 million, respectively, in various other private investment vehicles, of which $61.5 million and $61.0 million was funded, respectively. The carrying value of our equity investments was $49.0 million and $48.0 million at May 31, 2018 and November 30, 2017, respectively. Our exposure to loss is limited to the total of our carrying value and unfunded equity commitment. These private investment vehicles have assets primarily consisting of private and public equity investments, debt instruments and various oil and gas assets.
Mortgage- and Other Asset-Backed Securitization Vehicles. In connection with our secondary trading and market making activities, we buy and sell agency and non-agency mortgage-backed securities and other asset-backed securities, which are issued by third party securitization SPEs and are generally considered variable interests in VIEs. Securities issued by securitization SPEs are backed by residential mortgage loans, U.S. agency collateralized mortgage obligations, commercial mortgage loans, CDOs and CLOs and other consumer loans, such as installment receivables, auto loans and student loans. These securities are accounted for at fair value and included in Financial instruments owned in our Consolidated Statements of Financial Condition. We have no other involvement with the related SPEs and therefore do not consolidate these entities.
We also engage in underwriting, placement and structuring activities for third-party-sponsored securitization trusts generally through agency (FNMA (“Fannie Mae”), Federal Home Loan Mortgage Corporation (“Freddie Mac”) or GNMA (“Ginnie Mae”)) or non-agency-sponsored SPEs and may purchase loans or mortgage-backed securities from third parties that are subsequently transferred into the securitization trusts. The securitizations are backed by residential and commercial mortgage, home equity and auto loans. We do not consolidate agency-sponsored securitizations as we do not have the power to direct the activities of the SPEs that most significantly impact their economic performance. Further, we are not the servicer of non-agency-sponsored securitizations and therefore do not have power to direct the most significant activities of the SPEs and accordingly, do not consolidate these entities. We may retain unsold senior and/or subordinated interests at the time of securitization in the form of securities issued by the SPEs.
41
JEFFERIES GROUP LLC AND SUBSIDIARIES
NOTES TO CONSOLIDATED FINANCIAL STATEMENTS - CONTINUED
(Unaudited)
We transfer existing securities, typically mortgage-backed securities, into resecuritization vehicles. These transactions in which debt securities are transferred to a VIE in exchange for new beneficial interests occur in connection with both agency and non-agency-sponsored VIEs. Our consolidation analysis is largely dependent on our role and interest in the resecuritization trusts. Most resecuritizations in which we are involved are in connection with investors seeking securities with specific risk and return characteristics. As such, we have concluded that the decision-making power is shared between us and the investor(s), considering the joint efforts involved in structuring the trust and selecting the underlying assets as well as the level of security interests the investor(s) hold in the SPE; therefore, we do not consolidate the resecuritization VIEs.
At May 31, 2018 and November 30, 2017, we held $2,898.7 million and $1,829.6 million of agency mortgage-backed securities, respectively, and $189.6 million and $253.2 million of non-agency mortgage and other asset-backed securities, respectively, as a result of our secondary trading and market making activities, underwriting, placement and structuring activities and resecuritization activities. Our maximum exposure to loss on these securities is limited to the carrying value of our investments in these securities. These mortgage- and other asset-backed securitization vehicles discussed are not included in the above table containing information about our variable interests in nonconsolidated VIEs.
Note 9. Investments
We have investments in Jefferies Finance LLC (“Jefferies Finance”) and Epic Gas Ltd. (“Epic Gas”). Our investments in Jefferies Finance and Epic Gas have been accounted for under the equity method and have been included in Loans to and investments in related parties in our Consolidated Statements of Financial Condition with our share of the investees’ earnings recognized in Other revenues in our Consolidated Statements of Earnings. We have limited partnership interests of 11% and 50% in Jefferies Capital Partners V L.P. and the SBI USA Fund L.P. (together, “JCP Fund V”), respectively, which are private equity funds managed by a team led by Brian P. Friedman, one of our directors and our Chairman of the Executive Committee. In addition, we had investments in KCG Holdings, Inc. (“KCG”) and Jefferies LoanCore LLC (“Jefferies LoanCore”), which were sold on July 20, 2017 and October 31, 2017, respectively. Our investment in KCG was accounted for at fair value by electing the fair value option available under U.S. GAAP with changes in fair value recognized in Principal transaction revenues in our Consolidated Statements of Earnings. Our investment in Jefferies LoanCore was accounted for under the equity method with our share of the investees’ earnings recognized in Other revenues in our Consolidated Statements of Earnings.
Jefferies Finance
Jefferies Finance, a joint venture entity pursuant to an agreement with Massachusetts Mutual Life Insurance Company (“MassMutual”), is a commercial finance company whose primary focus is the origination and syndication of senior secured debt to middle market and growth companies in the form of term and revolving loans. Loans are originated primarily through the investment banking efforts of Jefferies LLC. Jefferies Finance may also originate other debt products such as second lien term, bridge and mezzanine loans, as well as related equity co-investments. Jefferies Finance also purchases syndicated loans in the secondary market and acts as an investment advisor for various loan funds.
At May 31, 2018, we and MassMutual each had equity commitments to Jefferies Finance of $750.0 million, for a combined total commitment of $1.5 billion. At May 31, 2018, we had funded $687.5 million of our $750.0 million commitment, leaving $62.5 million unfunded. The investment commitment is scheduled to expire on March 1, 2019 with automatic one year extensions absent a 60 day termination notice by either party.
Jefferies Finance has executed a Secured Revolving Credit Facility with us and MassMutual, to be funded equally, to support loan underwritings by Jefferies Finance, which bears interest based on the interest rates of the related Jefferies Finance underwritten loans and is secured by the underlying loans funded by the proceeds of the facility. The total Secured Revolving Credit Facility is a committed amount of $500.0 million at May 31, 2018. Advances are shared equally between us and MassMutual. The facility is scheduled to mature on March 1, 2019 with automatic one year extensions absent a 60 day termination notice by either party. At May 31, 2018, we had funded $0.0 million of our $250.0 million commitment. The following summarizes the activity included in our Consolidated Statements of Earnings related to the facility (in millions):
Three Months Ended May 31, | Six Months Ended May 31, | ||||||||||||||
2018 | 2017 | 2018 | 2017 | ||||||||||||
Interest income | $ | 0.4 | $ | 1.2 | $ | 1.2 | $ | 2.3 | |||||||
Unfunded commitment fees | 0.3 | 0.2 | 0.5 | 0.5 | |||||||||||
42
JEFFERIES GROUP LLC AND SUBSIDIARIES
NOTES TO CONSOLIDATED FINANCIAL STATEMENTS - CONTINUED
(Unaudited)
The following is a summary of selected financial information for Jefferies Finance (in millions):
May 31, 2018 | November 30, 2017 | ||||||
Our total equity balance | $ | 687.5 | $ | 636.2 | |||
Three Months Ended May 31, | Six Months Ended May 31, | ||||||||||||||
2018 | 2017 | 2018 | 2017 | ||||||||||||
Net earnings | $ | 60.2 | $ | 50.7 | $ | 102.7 | $ | 92.7 | |||||||
The following summarizes activity related to our other transactions with Jefferies Finance (in millions):
Three Months Ended May 31, | Six Months Ended May 31, | ||||||||||||||
2018 | 2017 | 2018 | 2017 | ||||||||||||
Origination and syndication fee revenues (1) | $ | 109.6 | $ | 73.1 | $ | 211.0 | $ | 139.3 | |||||||
Origination fee expenses (1) | 14.9 | 0.4 | 33.4 | 2.5 | |||||||||||
CLO placement fee revenues (2) | 2.4 | 1.2 | 2.7 | 3.9 | |||||||||||
Derivative losses (3) | (0.3 | ) | (0.3 | ) | (0.6 | ) | (0.4 | ) | |||||||
Underwriting fees (4) | — | — | 0.3 | — | |||||||||||
Service fees (5) | 8.9 | 9.3 | 35.0 | 29.5 | |||||||||||
(1) | We engage in debt capital markets transactions with Jefferies Finance related to the originations and syndications of loans by Jefferies Finance. In connection with such services, we earned fees, which are recognized in Investment banking revenues in our Consolidated Statements of Earnings. In addition, we paid fees to Jefferies Finance in respect of certain loans originated by Jefferies Finance, which are recognized as Business development expenses in our Consolidated Statements of Earnings. |
(2) | We act as a placement agent for CLOs managed by Jefferies Finance, for which we recognized fees, which are included in Investment banking revenues in our Consolidated Statements of Earnings. At May 31, 2018 and November 30, 2017, we held securities issued by CLOs managed by Jefferies Finance, which are included in Financial instruments owned. At November 30, 2016, we provided a guarantee whereby we were required to make certain payments to a CLO in the event that Jefferies Finance was unable to meet its obligations to the CLO, which was terminated in October 2017. |
(3) | We have entered into participation agreements and derivative contracts with Jefferies Finance based upon certain securities issued by the CLO and we have recognized gains (losses) relating to the derivative contracts. |
(4) | We acted as underwriter in connection with term loans issued by Jefferies Finance. |
(5) | Under a service agreement, we charge Jefferies Finance for services provided. |
Receivables from Jefferies Finance, included in Other assets in our Consolidated Statements of Financial Condition, were $49.9 million and $20.5 million at May 31, 2018 and November 30, 2017, respectively. Payables from Jefferies Finance, related to cash deposited with us and included in Accrued expenses and other liabilities in our Consolidated Statements of Financial Condition, were $14.1 million at May 31, 2018.
We enter into OTC foreign exchange contracts with Jefferies Finance. In connection with these contracts we had $0.2 million recorded in Receivables—brokers, dealers and clearing organizations and $1.5 million recorded in Financial instruments owned, at fair value in our Consolidated Statements of Financial Condition at May 31, 2018 and November 30, 2017, respectively.
JCP Fund V
The amount of our investments in JCP Fund V included in Financial instruments owned, at fair value in our Consolidated Statements of Financial Condition was $29.5 million and $19.6 million at May 31, 2018 and November 30, 2017, respectively. We account for these investments at fair value based on the NAV of the funds provided by the fund managers (see Note 2, Summary of Significant Accounting Policies in our consolidated financial statements included in Part II, Item 8 of our Annual Report on Form 10-K for the year ended November 30, 2017). The following summarizes the results from these investments which are included in Principal transactions revenues in our Consolidated Statements of Earnings (in millions):
43
JEFFERIES GROUP LLC AND SUBSIDIARIES
NOTES TO CONSOLIDATED FINANCIAL STATEMENTS - CONTINUED
(Unaudited)
Three Months Ended May 31, | Six Months Ended May 31, | ||||||||||||||
2018 | 2017 | 2018 | 2017 | ||||||||||||
Net gains (losses) from our investments in JCP Fund V | $ | 3.0 | $ | (7.2 | ) | $ | 9.8 | $ | (7.9 | ) | |||||
At May 31, 2018 and November 30, 2017, we were committed to invest equity of up to $85.0 million in JCP Fund V. At May 31, 2018 and November 30, 2017, our unfunded commitment relating to JCP Fund V was $10.0 million and $10.1 million, respectively.
The following is a summary of the Net increase (decrease) in net assets resulting from operations for 100.0% of JCP Fund V, in which we own effectively 35.2% of the combined equity interests (in thousands):
Three Months Ended | |||||||||||||||
March 31, 2018 (1) | December 31, 2017 (1) | March 31, 2017 (1) | December 31, 2016 (1) | ||||||||||||
Net increase (decrease) in net assets resulting from operations | $ | 8,463 | $ | 19,712 | $ | (19,552 | ) | $ | (2,294 | ) | |||||
(1) | Financial information for JCP Fund V within our results of operations for the three and six months ended May 31, 2018 and 2017 is included based on the presented periods. |
Epic Gas
On July 14, 2015, Jefferies LLC purchased common shares of Epic Gas. In addition, one of our directors serves on the Board of Directors of Epic Gas and owns common shares of Epic Gas. At May 31, 2018 and November 30, 2017, we owned approximately 21.1% of the outstanding common stock of Epic Gas.
The following is a summary of selected financial information for Epic Gas (in millions):
May 31, 2018 | November 30, 2017 | ||||||
Our investment in Epic Gas (1) | $ | 21.1 | $ | 22.2 | |||
Three Months Ended | |||||||||||||||
March 31, 2018 (2) | December 31, 2017 (2) | March 31, 2017 (2) | December 31, 2016 (2) | ||||||||||||
Net losses | $ | (2.7 | ) | $ | (16.4 | ) | $ | (3.4 | ) | $ | (15.9 | ) | |||
(1) | Included in Loans to and investments in related parties in our Consolidated Statements of Financial Condition. |
(2) | Financial information for Epic Gas in our results of operations for the three and six months ended May 31, 2018 and 2017 is included based on the presented periods. |
Jefferies LoanCore
Jefferies LoanCore, a commercial real estate finance company and a joint venture with the Government of Singapore Investment Corporation, the Canada Pension Plan Investment Board and LoanCore, LLC, originates and purchases commercial real estate loans throughout the U.S. and Europe. On October 31, 2017, we sold all of our membership interests (which constituted a 48.5% voting interest) in Jefferies LoanCore for approximately $173.1 million, the estimated book value at October 31, 2017. In addition, we may be entitled to additional cash consideration over the next five years in the event Jefferies LoanCore’s yearly return on equity exceeds certain thresholds.
The net earnings of Jefferies LoanCore were $2.4 million and $8.6 million for the three and six months ended May 31, 2017, respectively, and were recognized in Other revenues in our Consolidated Statements of Earnings.
44
JEFFERIES GROUP LLC AND SUBSIDIARIES
NOTES TO CONSOLIDATED FINANCIAL STATEMENTS - CONTINUED
(Unaudited)
KCG
Our investment in KCG was sold on July 20, 2017. The change in the fair value of our investment in KCG was a net gain of $95.8 million and $91.2 million for the three and six months ended May 31, 2017, respectively, and was included in Principal transaction revenues in our Consolidated Statements of Earnings. We had elected to record our investment in KCG at fair value under the fair value option, as the investment was acquired as part of our capital markets activities. The valuation of our investment was based on the closing exchange price of KCG and included in Level 1 of the fair value hierarchy. For the three months ended March 31, 2017 and December 31, 2016, KCG reported net earnings of $3.2 million and $196.2 million, respectively.
Note 10. Goodwill and Intangible Assets
Goodwill
Goodwill attributed to our reportable business segments are as follows (in thousands):
May 31, 2018 | November 30, 2017 | ||||||
Capital Markets | $ | 1,642,541 | $ | 1,644,089 | |||
Asset Management | 3,000 | 3,000 | |||||
Total goodwill | $ | 1,645,541 | $ | 1,647,089 | |||
The following table is a summary of the changes to goodwill for the six months ended May 31, 2018 (in thousands):
Balance at November 30, 2017 | $ | 1,647,089 | |
Translation adjustments | (1,548 | ) | |
Balance at May 31, 2018 | $ | 1,645,541 | |
Intangible Assets
Intangible assets are included in Other assets in our Consolidated Statements of Financial Condition. The following tables present the gross carrying amount, changes in carrying amount, net carrying amount and weighted average amortization period of identifiable intangible assets at May 31, 2018 and November 30, 2017 (dollars in thousands):
May 31, 2018 | Weighted average remaining lives (years) | ||||||||||||
Gross cost | Accumulated amortization | Net carrying amount | |||||||||||
Customer relationships | $ | 126,170 | $ | (55,033 | ) | $ | 71,137 | 10.9 | |||||
Trade name | 129,052 | (19,358 | ) | 109,694 | 29.8 | ||||||||
Exchange and clearing organization membership interests and registrations | 8,550 | — | 8,550 | N/A | |||||||||
Total | $ | 263,772 | $ | (74,391 | ) | $ | 189,381 | ||||||
November 30, 2017 | Weighted average remaining lives (years) | ||||||||||||
Gross cost | Accumulated amortization | Net carrying amount | |||||||||||
Customer relationships | $ | 126,412 | $ | (50,983 | ) | $ | 75,429 | 11.3 | |||||
Trade name | 129,370 | (17,557 | ) | 111,813 | 30.3 | ||||||||
Exchange and clearing organization membership interests and registrations | 8,551 | — | 8,551 | N/A | |||||||||
Total | $ | 264,333 | $ | (68,540 | ) | $ | 195,793 | ||||||
Amortization Expense
For finite life intangible assets, aggregate amortization expense amounted to $3.0 million and $6.0 million for both the three and six months ended May 31, 2018 and 2017, respectively. These expenses are included in Other expenses in our Consolidated Statements of Earnings.
45
JEFFERIES GROUP LLC AND SUBSIDIARIES
NOTES TO CONSOLIDATED FINANCIAL STATEMENTS - CONTINUED
(Unaudited)
The estimated future amortization expense for the five succeeding fiscal years is as follows (in thousands):
Remainder of fiscal 2018 | $ | 6,099 | |
Year ending November 30, 2019 | 12,198 | ||
Year ending November 30, 2020 | 12,198 | ||
Year ending November 30, 2021 | 12,198 | ||
Year ending November 30, 2022 | 12,198 | ||
Note 11. Short-Term Borrowings
Short-term borrowings at May 31, 2018 and November 30, 2017 include the following and mature in one year or less (in thousands):
May 31, 2018 | November 30, 2017 | ||||||
Bank loans (1) | $ | 378,930 | $ | 304,651 | |||
Floating rate puttable notes | 58,470 | 108,240 | |||||
Equity-linked notes | 68,818 | 23,324 | |||||
Total short-term borrowings | $ | 506,218 | $ | 436,215 | |||
(1) | Bank loans include loans entered into, pursuant to a Master Loan Agreement, between the Bank of New York Mellon and us. |
At May 31, 2018, the weighted average interest rate on short-term borrowings outstanding is 3.99% per annum. Average daily short-term borrowings outstanding were $584.7 million and $536.9 million for the three and six months ended May 31, 2018, respectively, $537.3 million and $493.2 million for the three and six months ended May 31, 2017, respectively.
During the six months ended May 31, 2018, we issued equity-linked notes due July 12, 2018 with a principal amount of $70.5 million. In addition, during the six months ended May 31, 2018, our floating rate puttable notes with principal amounts of €30.0 million and €11.0 million matured on April 8, 2018 and May 3, 2018, respectively and our equity-linked notes with a principal amount of $23.3 million matured on December 7, 2017. See Note 4, Fair Value Disclosures, for further information.
The Bank of New York Mellon has agreed to make revolving intraday credit advances (“Intraday Credit Facility”) for an aggregate committed amount of $150.0 million. The Intraday Credit Facility contains financial covenants, which includes a minimum regulatory net capital requirement for Jefferies LLC. Interest is based on the higher of the Federal funds effective rate plus 0.5% or the prime rate. During the six months ended May 31, 2018, we were in compliance with debt covenants under the Intraday Credit Facility.
46
JEFFERIES GROUP LLC AND SUBSIDIARIES
NOTES TO CONSOLIDATED FINANCIAL STATEMENTS - CONTINUED
(Unaudited)
Note 12. Long-Term Debt
The following summarizes our long-term debt carrying values (including unamortized discounts and premiums, valuation adjustments and debt issuance costs, where applicable) (in thousands):
Maturity | Effective Interest Rate | May 31, 2018 | November 30, 2017 | ||||||||
Unsecured long-term debt | |||||||||||
5.125% Senior Notes | April 13, 2018 | 2.93% | $ | — | $ | 682,338 | |||||
8.500% Senior Notes | July 15, 2019 | 3.99% | 714,411 | 728,872 | |||||||
2.375% Euro Medium Term Notes | May 20, 2020 | 2.42% | 583,602 | 593,334 | |||||||
6.875% Senior Notes | April 15, 2021 | 4.40% | 800,075 | 808,157 | |||||||
2.250% Euro Medium Term Notes | July 13, 2022 | 4.08% | 4,351 | 4,389 | |||||||
5.125% Senior Notes | January 20, 2023 | 4.55% | 614,331 | 615,703 | |||||||
4.850% Senior Notes (1) | January 15, 2027 | 4.93% | 713,764 | 736,357 | |||||||
6.450% Senior Debentures | June 8, 2027 | 5.46% | 374,746 | 375,794 | |||||||
3.875% Convertible Senior Debentures (2) | November 1, 2029 | —% | — | 324,779 | |||||||
4.150% Senior Notes | January 23, 2030 | 4.26% | 987,365 | — | |||||||
6.250% Senior Debentures | January 15, 2036 | 6.03% | 511,854 | 512,040 | |||||||
6.500% Senior Notes | January 20, 2043 | 6.09% | 420,810 | 420,990 | |||||||
Structured notes (3) | Various | Various | 708,256 | 614,091 | |||||||
Total unsecured long-term debt | 6,433,565 | 6,416,844 | |||||||||
Secured long-term debt | |||||||||||
Revolving Credit Facility | 158,335 | — | |||||||||
Total long-term debt | $ | 6,591,900 | $ | 6,416,844 | |||||||
(1) | These senior notes with a principal amount of $750.0 million were issued on January 17, 2017. The carrying value includes an increase of $22.8 million and a decrease of $4.9 million in the six months ended May 31, 2018 and 2017, respectively, associated with an interest rate swap based on its designation as a fair value hedge. See Note 5, Derivative Financial Instruments, for further information. |
(2) | The change in fair value of the conversion feature embedded in the debentures, which is included in Principal transaction revenues in our Consolidated Statements of Earnings, was not material for the three and six months ended May 31, 2017. |
(3) | The carrying value includes $708.3 million and $607.0 million of notes carried at fair value at May 31, 2018 and November 30, 2017, respectively. These structured notes contain various interest rate payment terms and are accounted for at fair value, with changes in fair value resulting from a change in the instrument-specific credit risk presented in other comprehensive income and changes in fair value resulting from non-credit components recognized in Principal transaction revenues. A weighted average coupon rate is not meaningful, as substantially all of the structured notes are carried at fair value. |
During the six months ended May 31, 2018, we issued 4.150% senior notes with a total principal amount of $1.0 billion, due 2030. Additionally, structured notes with a total principal amount of approximately $165.6 million, net of retirements, were issued during the period. During the six months ended May 31, 2017, we issued senior notes with a total principal amount of $678.5 million, net of retirements, and structured notes with a total principal amount of approximately $125.6 million.
On November 22, 2017, all of our remaining convertible debentures ($324.8 million at November 30, 2017) were called for optional redemption, with a redemption date of January 5, 2018, at a redemption price equal to 100% of the principal amount of the convertible debentures redeemed, plus accrued and unpaid interest to, but excluding, the redemption date. All of these remaining convertible debentures were redeemed on January 5, 2018. In addition, our 5.125% senior notes with a principal of $668.3 million were redeemed in April 2018.
47
JEFFERIES GROUP LLC AND SUBSIDIARIES
NOTES TO CONSOLIDATED FINANCIAL STATEMENTS - CONTINUED
(Unaudited)
On May 16, 2018, we entered into a senior secured revolving credit facility (“Revolving Credit Facility”) with a group of commercial banks for an aggregate principal amount of $160.0 million. The borrower under the Revolving Credit Facility is Jefferies Leveraged Credit Products, LLC, with a guarantee from Jefferies Group LLC. The Revolving Credit Facility contains certain financial covenants, including, but not limited to, restrictions on future indebtedness of Jefferies Leveraged Credit Products, LLC and its’ minimum tangible net worth, liquidity requirements and minimum capital requirements. Interest is based on an annual alternative base rate or an adjusted London Interbank Offered Rate, as defined in the Revolving Credit Facility agreement. The obligations of Jefferies Leveraged Credit Products, LLC under the Revolving Credit Facility are secured by substantially all its assets. At May 31, 2018, we were in compliance with debt covenants under the Revolving Credit Facility.
Note 13. Revenues from Contracts with Customers
The following table presents our total revenues separated for our revenues from contracts with customers and our other sources of revenues (in thousands):
Three Months Ended May 31, 2018 | Six Months Ended May 31, 2018 | ||||||
Revenues from contracts with customers: | |||||||
Commissions and other fees | $ | 158,104 | $ | 306,006 | |||
Investment banking | 500,297 | 940,288 | |||||
Asset management fees | 6,016 | 10,946 | |||||
Other | 6,802 | 13,488 | |||||
Total revenue from contracts with customers | 671,219 | 1,270,728 | |||||
Other sources of revenue: | |||||||
Principal transactions | 137,802 | 355,275 | |||||
Interest | 307,327 | 565,143 | |||||
Other | 40,461 | 52,258 | |||||
Total revenues | $ | 1,156,809 | $ | 2,243,404 | |||
Revenue from contracts with customers is recognized when, or as, we satisfy our performance obligations by transferring the promised goods or services to the customers. A good or service is transferred to a customer when, or as, the customer obtains control of that good or service. A performance obligation may be satisfied over time or at a point in time. Revenue from a performance obligation satisfied over time is recognized by measuring our progress in satisfying the performance obligation in a manner that depicts the transfer of the goods or services to the customer. Revenue from a performance obligation satisfied at a point in time is recognized at the point in time that we determine the customer obtains control over the promised good or service. The amount of revenue recognized reflects the consideration we expect to be entitled to in exchange for those promised goods or services (i.e., the “transaction price”). In determining the transaction price, we consider multiple factors, including the effects of variable consideration. Variable consideration is included in the transaction price only to the extent it is probable that a significant reversal in the amount of cumulative revenue recognized will not occur when the uncertainties with respect to the amount are resolved. In determining when to include variable consideration in the transaction price, we consider the range of possible outcomes, the predictive value of our past experiences, the time period of when uncertainties expect to be resolved and the amount of consideration that is susceptible to factors outside of our influence, such as market volatility or the judgment and actions of third parties.
The following provides detailed information on the recognition of our revenues from contracts with customers:
Commissions and Other Fees. We earn commission revenue by executing, settling and clearing transactions for clients primarily in equity, equity-related and futures products. Trade execution and clearing services, when provided together, represent a single performance obligation as the services are not separately identifiable in the context of the contract. Commission revenues associated with combined trade execution and clearing services, as well as trade execution services on a standalone basis, are recognized at a point in time on trade-date. Commissions revenues are generally paid on settlement date and we record a receivable between trade-date and payment on settlement date. We permit institutional customers to allocate a portion of their gross commissions to pay for research products and other services provided by third parties. The amounts allocated for those purposes are commonly referred to as soft dollar arrangements. We act as an agent in the soft dollar arrangements as the customer controls the use of the soft dollars and directs our payments to third party service providers on its behalf. Accordingly, amounts allocated to soft dollar arrangements are netted against commission revenues in our Consolidated Statements of Earnings.
48
JEFFERIES GROUP LLC AND SUBSIDIARIES
NOTES TO CONSOLIDATED FINANCIAL STATEMENTS - CONTINUED
(Unaudited)
We earn account advisory and distribution fees in connection with wealth management services. Account advisory fees are recognized over time using the time-elapsed method as we determined that the customer simultaneously receives and consumes the benefits of investment advisory services as they are provided. Account advisory fees may be paid in advance of a specified service period or in arrears at the end of the specified service period (e.g., quarterly). Account advisory fees paid in advance are initially deferred within Other liabilities on the Consolidated Statements of Financial Condition. Distribution fees are variable and recognized when the uncertainties with respect to the amounts are resolved.
Investment Banking. We provide our clients with a full range of capital markets and financial advisory services. Capital markets services include underwriting and placement agent services in both the equity and debt capital markets, including private equity placements, initial public offerings, follow-on offerings and equity-linked convertible securities transactions and structuring, underwriting and distributing public and private debt, including investment grade debt, high yield bonds, leveraged loans, municipal bonds and mortgage- and asset-backed securities. Underwriting and placement agent revenues are recognized at a point in time on trade-date, as the client obtains the control and benefit of the capital markets offering at that point. Costs associated with capital markets transactions are deferred until the related revenue is recognized or the engagement is otherwise concluded, and are recorded on a gross basis within Underwriting costs in the Consolidated Statements of Earnings as we are acting as a principal in the arrangement. Any expenses reimbursed by our clients are recognized as Investment banking revenues.
Revenues from financial advisory services primarily consist of fees generated in connection with merger, acquisition and restructuring transactions. Advisory fees from mergers and acquisitions engagements are recognized at a point in time when the related transaction is completed, as the performance obligation is to successfully broker a specific transaction. Fees received prior to the completion of the transaction are deferred within Other liabilities on the Consolidated Statements of Financial Condition. Advisory fees from restructuring engagements are recognized over time using a time elapsed measure of progress as our clients simultaneously receive and consume the benefits of those services as they are provided. A significant portion of the fees we receive for our advisory services are considered variable as they are contingent upon a future event (e.g., completion of a transaction or third party emergence from bankruptcy) and are excluded from the transaction price until the uncertainty associated with the variable consideration is subsequently resolved, which is expected to occur upon achievement of the specified milestone. Payment for advisory services are generally due promptly upon completion of a specified milestone or, for retainer fees, periodically over the course of the engagement. We recognize a receivable between the date of completion of the milestone and payment by the customer. Expenses associated with investment banking advisory engagements are deferred only to the extent they are explicitly reimbursable by the client and the related revenue is recognized at a point in time. All other investment banking advisory related expenses, including expenses incurred related to restructuring assignments, are expensed as incurred. All investment banking advisory expenses are recognized within their respective expense category on the Consolidated Statements of Earnings and any expenses reimbursed by our clients are recognized as Investment banking revenues.
Asset Management Fees. We earn management and performance fees in connection with investment advisory services provided to various funds and accounts, which are satisfied over time and measured using a time elapsed measure of progress as the customer receives the benefits of the services evenly throughout the term of the contract. Management and performance fees are considered variable as they are subject to fluctuation (e.g., changes in assets under management, market performance) and/ or are contingent on a future event during the measurement period (e.g., meeting a specified benchmark) and are recognized only to the extent it is probable that a significant reversal in the amount of cumulative revenue recognized will not occur when the uncertainty is resolved. Management fees are generally based on month-end assets under management or an agreed upon notional amount and are included in the transaction price at the end of each month when the assets under management or notional amount is known. Performance fees are received when the return on assets under management for a specified performance period exceed certain benchmark returns, “high-water marks” or other performance targets. The performance period related to our performance fees is annual or semi-annual. Accordingly, performance fee revenue will generally be recognized only at the end of the performance period to the extent that the benchmark return has been met.
49
JEFFERIES GROUP LLC AND SUBSIDIARIES
NOTES TO CONSOLIDATED FINANCIAL STATEMENTS - CONTINUED
(Unaudited)
Disaggregation of Revenue
The following presents our revenues from contracts with customers disaggregated by major business activity and primary geographic regions for the three and six months ended May 31, 2018 (in thousands):
Reportable Segment | |||||||||||||||||||||||
Three Months Ended May 31, 2018 | Six Months Ended May 31, 2018 | ||||||||||||||||||||||
Capital Markets | Asset Management | Total | Capital Markets | Asset Management | Total | ||||||||||||||||||
Major Business Activity: | |||||||||||||||||||||||
Equities (1) | $ | 160,360 | $ | — | $ | 160,360 | $ | 311,990 | $ | — | $ | 311,990 | |||||||||||
Fixed Income (1) | 4,546 | — | 4,546 | 7,504 | — | 7,504 | |||||||||||||||||
Investment Banking - Capital Markets | 283,315 | — | 283,315 | 532,149 | — | 532,149 | |||||||||||||||||
Investment Banking - Advisory | 216,982 | — | 216,982 | 408,139 | — | 408,139 | |||||||||||||||||
Asset Management | — | 6,016 | 6,016 | — | 10,946 | 10,946 | |||||||||||||||||
Total | $ | 665,203 | $ | 6,016 | $ | 671,219 | $ | 1,259,782 | $ | 10,946 | $ | 1,270,728 | |||||||||||
Primary Geographic Region: | |||||||||||||||||||||||
Americas | $ | 566,360 | $ | 6,016 | $ | 572,376 | $ | 1,082,284 | $ | 10,946 | $ | 1,093,230 | |||||||||||
Europe | 78,861 | — | 78,861 | 140,189 | — | 140,189 | |||||||||||||||||
Asia | 19,982 | — | 19,982 | 37,309 | — | 37,309 | |||||||||||||||||
Total | $ | 665,203 | $ | 6,016 | $ | 671,219 | $ | 1,259,782 | $ | 10,946 | $ | 1,270,728 | |||||||||||
(1) | Revenues from contracts with customers associated with the equities and fixed income businesses primarily represent commissions and other fee revenue. |
Refer to Note 18, Segment Reporting, for a further discussion on the allocation of revenues to geographic regions.
Information on Remaining Performance Obligations and Revenue Recognized from Past Performance
We do not disclose information about remaining performance obligations pertaining to contracts that have an original expected duration of one year or less. The transaction price allocated to remaining unsatisfied or partially unsatisfied performance obligations with an original expected duration exceeding one year was not material at May 31, 2018. Investment banking advisory fees that are contingent upon completion of a specific milestone and fees associated with certain distribution services are also excluded as the fees are considered variable and not included in the transaction price at May 31, 2018.
During the three and six months ended May 31, 2018, we recognized $15.0 million and $17.1 million, respectively, of revenue related to performance obligations satisfied (or partially satisfied) in previous periods, mainly due to resolving uncertainties in variable consideration that was constrained in prior periods. In addition, we recognized $4.3 million and $8.9 million, respectively, of revenues primarily associated with distribution services during the three and six months ended May 31, 2018, a portion of which relates to prior periods.
Contract Balances
The timing of our revenue recognition may differ from the timing of payment by our customers. We record a receivable when revenue is recognized prior to payment and we have an unconditional right to payment. Alternatively, when payment precedes the provision of the related services, we record deferred revenue until the performance obligations are satisfied.
We had receivables related to revenues from contracts with customers of $175.3 million and $246.0 million at May 31, 2018 and December 1, 2017, respectively. We had no significant impairments related to these receivables during the three and six months ended May 31, 2018.
Our deferred revenue primarily relates to retainer and milestone fees received in investment banking advisory engagements where the performance obligation has not yet been satisfied. Deferred revenue at May 31, 2018 and December 1, 2017 was $10.0 million and $8.8 million, respectively. During the three and six months ended May 31, 2018, we recognized revenue of $5.3 million and $4.4 million, respectively, that was recorded as deferred revenue at the beginning of the periods.
50
JEFFERIES GROUP LLC AND SUBSIDIARIES
NOTES TO CONSOLIDATED FINANCIAL STATEMENTS - CONTINUED
(Unaudited)
Contract Costs
We capitalize costs to fulfill contracts associated with investment banking advisory engagements where the revenue is recognized at a point in time and the costs are determined to be recoverable. Capitalized cost to fulfill a contract are recognized at the point in time that the related revenue is recognized.
At May 31, 2018 capitalized costs to fulfill a contract were $3.3 million, which are recorded in Receivables: Fees, interest and other on the Consolidated Statement of Financial Condition. For the three and six months ended May 31, 2018, we recognized expenses of $1.2 million and $1.3 million, respectively, related capitalized costs to fulfill a contract. There were no significant impairment charges recognized in relation to these capitalized costs during the three and six months ended May 31, 2018.
Note 14. Compensation Plans
Jefferies sponsors our following share-based compensation plans: Incentive Compensation Plan, Employee Stock Purchase Plan (“ESPP”) and the Deferred Compensation Plan. The outstanding and future share-based awards relating to these plans relate to Jefferies common shares. The fair value of share-based awards is estimated on the date of grant based on the market price of the underlying common stock less the impact of market conditions and selling restrictions subsequent to vesting, if any, and is amortized as compensation expense over the related requisite service periods. We are allocated costs associated with awards granted to our employees under such plans.
In addition, we sponsor non-share-based compensation plans. Non-share-based compensation plans sponsored by us include a profit sharing plan and other forms of restricted cash awards.
The components of total compensation cost associated with certain of our compensation plans are as follows (in millions):
Three Months Ended May 31, | Six Months Ended May 31, | ||||||||||||||
2018 | 2017 | 2018 | 2017 | ||||||||||||
Components of compensation cost: | |||||||||||||||
Restricted cash awards | $ | 55.2 | $ | 61.6 | $ | 123.6 | $ | 123.3 | |||||||
Restricted stock and RSUs (1) | 6.7 | 5.7 | 14.0 | 11.5 | |||||||||||
Profit sharing plan | 1.3 | 1.1 | 4.5 | 4.0 | |||||||||||
Total compensation cost | $ | 63.2 | $ | 68.4 | $ | 142.1 | $ | 138.8 | |||||||
(1) | Total compensation cost associated with restricted stock and restricted stock units (“RSUs”) includes the amortization of sign-on, retention and senior executive awards, less forfeitures and clawbacks. |
Remaining unamortized amounts related to certain compensation plans at May 31, 2018 are as follows (dollars in millions):
Remaining Unamortized Amounts | Weighted Average Vesting Period (in Years) | ||||
Non-vested share-based awards | $ | 78.8 | 3 | ||
Restricted cash awards | 490.9 | 3 | |||
Total | $ | 569.7 | |||
The following are descriptions of the compensation plans:
Incentive Compensation Plan. The Incentive Compensation Plan (“Incentive Plan”) allows for awards in the form of incentive stock options (within the meaning of Section 422 of the Internal Revenue Code), nonqualified stock options, stock appreciation rights, restricted stock, unrestricted stock, performance awards, restricted stock units, dividend equivalents or other share-based awards. RSUs give a participant the right to receive fully vested common shares at the end of a specified deferral period, allowing a participant to hold an interest tied to common stock on a tax deferred basis. Prior to settlement, RSUs carry no voting or dividend rights associated with the stock ownership, but dividend equivalents are accrued to the extent there are dividends declared on the underlying common shares as cash amounts or as deemed reinvestments in additional RSUs. Awards issued and outstanding related to the Incentive Plan relate to shares of Jefferies.
51
JEFFERIES GROUP LLC AND SUBSIDIARIES
NOTES TO CONSOLIDATED FINANCIAL STATEMENTS - CONTINUED
(Unaudited)
Restricted stock and RSUs may be granted to new employees as sign-on awards, to existing employees as “retention” awards and to certain executive officers as awards for multiple years. Sign-on and retention awards are generally subject to annual ratable vesting over a four-year service period and are amortized as compensation expense on a straight line basis over the related four years. Restricted stock and RSUs are granted to certain senior executives with market, performance and service conditions. Market conditions are incorporated into the grant-date fair value of senior executive awards using a Monte Carlo valuation model. Compensation expense for awards with market conditions is recognized over the service period and is not reversed if the market condition is not met. Awards with performance conditions are amortized over the service period if we determine that it is probable that the performance condition will be achieved.
Employee Stock Purchase Plan. There is also an ESPP which we consider noncompensatory effective January 1, 2007. The ESPP permits all regular full-time employees and employees who work part time over 20 hours per week to purchase, at a discount, Jefferies common shares. Annual employee contributions are limited to $21,250, are voluntary and made through payroll deduction. The stock purchase price is equal to 95% of the closing price of common stock on the last day of the applicable session (monthly).
Deferred Compensation Plan. There is also a Deferred Compensation Plan (“Deferred Compensation Plan”), which was established in 2001. Eligible employees are able to defer compensation on a pre-tax basis, with deferred amounts deemed invested at a discount in Jefferies common shares, or by allocating among any combination of other investment funds available under the Deferred Compensation Plan. We often invest directly, as a principal, in investments corresponding to the other investment funds, relating to our obligations to perform under the Deferred Compensation Plan. The compensation deferred by our employees is expensed in the period earned. The change in fair value of our investments in assets corresponding to the specified other investment funds are recognized in Principal transaction revenues and changes in the corresponding deferred compensation liability are reflected as Compensation and benefits expense in our Consolidated Statements of Earnings.
Profit Sharing Plan. We have a profit sharing plan, covering substantially all employees, which includes a salary reduction feature designed to qualify under Section 401(k) of the Internal Revenue Code.
Restricted Cash Awards. We provide compensation to new and existing employees in the form of loans and/or other cash awards which are subject to ratable vesting terms with service requirements. We amortize these awards to compensation expense over the relevant service period, which is generally considered to start at the beginning of the annual compensation year.
Note 15. Income Taxes
At May 31, 2018 and November 30, 2017, we had approximately $129.3 million and $129.5 million, respectively, of total gross unrecognized tax benefits. The total amount of unrecognized benefits that, if recognized, would favorably affect the effective tax rate was $102.4 million and $86.1 million (net of Federal benefit) at May 31, 2018 and November 30, 2017, respectively.
We recognize interest accrued related to unrecognized tax benefits in Interest expense. Penalties, if any, are recognized in Other expenses in our Consolidated Statements of Earnings. At May 31, 2018 and November 30, 2017, we had interest accrued of approximately $50.0 million and $48.3 million, respectively, included in Accrued expenses and other liabilities. No penalties were accrued for the six months ended May 31, 2018 and the year ended November 30, 2017.
During the six months ended May 31, 2018, we closed Federal tax exams related to years 2007 - 2012 with the Internal Revenue Service. In the United Kingdom, we also closed an exam related to 2014, while the statute for the 2015 tax year has expired. The resolution of these examinations did not have a material effect on our consolidated financial position. We are also currently under examination in other major tax jurisdictions. Though we do not expect that the resolution of these examinations will have a material effect on our consolidated financial position, they may have a material impact on our consolidated results of operations for the period in which the resolution occurs.
52
JEFFERIES GROUP LLC AND SUBSIDIARIES
NOTES TO CONSOLIDATED FINANCIAL STATEMENTS - CONTINUED
(Unaudited)
The table below summarizes the earliest tax years that remain subject to examination in the major tax jurisdictions in which we operate:
Jurisdiction | Tax Year |
United States | 2013 |
California | 2007 |
New Jersey | 2010 |
New York State | 2001 |
New York City | 2003 |
United Kingdom | 2016 |
Hong Kong | 2012 |
India | 2010 |
Italy | 2012 |
On December 22, 2017, the U.S. government enacted comprehensive tax legislation commonly referred to as the Tax Act. The Tax Act makes broad and complex changes to the U.S. tax code that will impact many areas of taxation, including, but not limited to, (1) reduction of the U.S. federal corporate tax rate from 35% to 21%; (2) elimination of the corporate alternative minimum tax; (3) the introduction of the base erosion anti-abuse tax, a new minimum tax; (4) a general elimination of U.S. federal income taxes on dividends from foreign subsidiaries; (5) a new provision designed to tax global intangible low-taxed income; (6) a new limitation on deductible interest expense; (7) limitations on the deductibility of certain executive compensation; (8) limitations on the use of foreign tax credits to reduce U.S. income tax liability; (9) limitations on net operating losses generated after December 31, 2017, to 80% of taxable income; (10) requiring a one-time transition tax on certain unrepatriated earnings of foreign subsidiaries that is payable over eight years; and (11) bonus depreciation that will allow for full expensing of qualified property.
Also on December 22, 2017, the SEC staff issued Staff Accounting Bulletin No. 118 (“SAB 118”), which provides guidance on accounting for the tax effects of the Tax Act. SAB 118 provides a measurement period that should not extend beyond one year from the Tax Act enactment date for companies to complete the accounting under Accounting Standards Codification 740, Income Taxes (“ASC 740”). While the initial estimated impact of the Tax Act was calculated using all available information, we anticipate modifications based on the procedures set forth under SAB 118. This process is applied at each reporting period to account for and qualitatively disclose: (1) the effects of the change in tax law for which the accounting is complete; (2) provisional amounts (or adjustments to provisional amounts) for the effects of the tax law where the accounting is not complete, but a reasonable estimate has been determined; and (3) where a reasonable estimate cannot yet be made, taxes are reflected in accordance with the law prior to the enactment of the Tax Act.
Due to the complex nature of the Tax Act and the unavailability of certain information, we have not completed our accounting for the income tax effects of certain elements of the Tax Act. If we were able to make reasonable estimates of the effects of certain elements for which our analysis is not yet complete, we recorded a provisional estimate in our consolidated financial statements. If we were not yet able to make reasonable estimates of the impact of certain elements, we have not recorded any adjustments related to those elements and have continued accounting for them in accordance with ASC 740 on the basis of the tax laws in effect before the Tax Act. The ultimate impact of the Tax Act may differ from this estimate, possibly materially, due to refinement of our calculations based on updated information, changes in the interpretations and assumptions, guidance that may be issued and actions we may take in response to the Tax Act.
We consider the accounting for the deferred tax asset remeasurements, the transition tax and other items to be incomplete. In connection with our initial analysis, we have recorded a discrete tax expense of $163.7 million in the three months ended February 28, 2018, as a result of the enactment of the Tax Act, as a provisional estimate of the impact of the Tax Act. This provisional estimate was revised in the second quarter of 2018 by a reduction of $3.2 million, which resulted in a total provisional tax charge of $160.5 million during the six months ended May 31, 2018. This provisional estimate primarily consists of a $108.5 million expense related to the revaluation of our deferred tax asset and a $52.0 million expense related to the deemed repatriation of foreign earnings.
53
JEFFERIES GROUP LLC AND SUBSIDIARIES
NOTES TO CONSOLIDATED FINANCIAL STATEMENTS - CONTINUED
(Unaudited)
Note 16. Commitments, Contingencies and Guarantees
Commitments
The following table summarizes our commitments at May 31, 2018 (in millions):
Expected Maturity Date (fiscal years) | |||||||||||||||||||||||
2018 | 2019 | 2020 and 2021 | 2022 and 2023 | 2024 and Later | Maximum Payout | ||||||||||||||||||
Equity commitments (1) | $ | — | $ | 62.7 | $ | 18.7 | $ | — | $ | 3.0 | $ | 84.4 | |||||||||||
Loan commitments (1) | 2.5 | 250.0 | 54.4 | 29.2 | — | 336.1 | |||||||||||||||||
Mortgage-related and other purchase commitments | — | 177.7 | — | — | — | 177.7 | |||||||||||||||||
Underwriting commitments | 65.0 | — | — | — | — | 65.0 | |||||||||||||||||
Forward starting reverse repos (2) | 3,634.7 | — | — | — | — | 3,634.7 | |||||||||||||||||
Forward starting repos (2) | 3,040.7 | — | — | — | — | 3,040.7 | |||||||||||||||||
Other unfunded commitments (1) | 145.3 | 116.8 | 19.2 | 110.5 | 5.1 | 396.9 | |||||||||||||||||
Total commitments | $ | 6,888.2 | $ | 607.2 | $ | 92.3 | $ | 139.7 | $ | 8.1 | $ | 7,735.5 | |||||||||||
(1) | Equity, loan and other unfunded commitments are presented by contractual maturity date. The amounts, however, are available on demand. |
(2) | At May 31, 2018, $3,628.6 million within forward starting securities purchased under agreements to resell and all of the securities sold under agreements to repurchase settled within three business days. |
Equity Commitments. Includes commitment to invest in our joint venture, Jefferies Finance, and commitments to invest in private equity funds and in Jefferies Capital Partners, LLC, the manager of the private equity funds, which consists of a team led by Brian P. Friedman, one of our directors and Chairman of the Executive Committee. At May 31, 2018, our outstanding commitments relating to Jefferies Capital Partners, LLC and its private equity funds was $18.4 million.
See Note 9, Investments, for additional information regarding our investments in Jefferies Finance.
Additionally, at May 31, 2018, we had other outstanding equity commitments to invest up to $3.6 million in various other investments.
Loan Commitments. From time to time we make commitments to extend credit to investment banking and other clients in loan syndication, acquisition finance and securities transactions and to SPE sponsors in connection with the funding of CLO and other asset-backed transactions. These commitments and any related drawdowns of these facilities typically have fixed maturity dates and are contingent on certain representations, warranties and contractual conditions applicable to the borrower. At May 31, 2018, we had $86.1 million of outstanding loan commitments to clients.
Loan commitments outstanding at May 31, 2018 also include our portion of the outstanding secured revolving credit facility provided to Jefferies Finance to support loan underwritings by Jefferies Finance. See Note 9, Investments, for additional information.
Mortgage-Related and Other Purchase Commitments. We enter into forward contracts to purchase mortgage participation certificates, mortgage-backed securities and consumer loans. The mortgage participation certificates evidence interests in mortgage loans insured by the Federal Housing Administration and the mortgage-backed securities are insured or guaranteed by Fannie Mae, Freddie Mac or Ginnie Mae. We frequently securitize the mortgage participation certificates and mortgage-backed securities. The fair value of mortgage-related and other purchase commitments recorded in our Consolidated Statements of Financial Condition was $0.9 million at May 31, 2018.
Underwriting Commitments. In connection with investment banking activities, we may from time to time provide underwriting commitments to our clients in connection with capital raising transactions.
Forward Starting Reverse Repos and Repos. We enter into commitments to take possession of securities with agreements to resell on a forward starting basis and to sell securities with agreements to repurchase on a forward starting basis that are primarily secured by U.S. government and agency securities.
Other Unfunded Commitments. Other unfunded commitments include obligations in the form of revolving notes to provide financing to asset-backed and CLO vehicles. Upon advancing funds, drawn amounts are collateralized by the assets of an entity.
54
JEFFERIES GROUP LLC AND SUBSIDIARIES
NOTES TO CONSOLIDATED FINANCIAL STATEMENTS - CONTINUED
(Unaudited)
Guarantees
Derivative Contracts. As a dealer, we make markets and trade in a variety of derivative instruments. Certain derivative contracts that we have entered into meet the accounting definition of a guarantee under U.S. GAAP, including credit default swaps, written foreign currency options and written equity put options. On certain of these contracts, such as written interest rate caps and foreign currency options, the maximum payout cannot be quantified since the increase in interest or foreign exchange rates are not contractually limited by the terms of the contract. As such, we have disclosed notional values as a measure of our maximum potential payout under these contracts.
The following table summarizes the notional amounts associated with our derivative contracts meeting the definition of a guarantee under U.S. GAAP at May 31, 2018 (in millions):
Expected Maturity Date (fiscal years) | |||||||||||||||||||||||
2018 | 2019 | 2020 and 2021 | 2022 and 2023 | 2024 and Later | Notional/ Maximum Payout | ||||||||||||||||||
Guarantee Type: | |||||||||||||||||||||||
Derivative contracts—non-credit related | $ | 15,858.9 | $ | 3,454.3 | $ | 2,486.5 | $ | 494.1 | $ | 458.2 | $ | 22,752.0 | |||||||||||
Written derivative contracts—credit related | — | — | 48.2 | 23.9 | — | 72.1 | |||||||||||||||||
Total derivative contracts | $ | 15,858.9 | $ | 3,454.3 | $ | 2,534.7 | $ | 518.0 | $ | 458.2 | $ | 22,824.1 | |||||||||||
The derivative contracts deemed to meet the definition of a guarantee under U.S. GAAP are before consideration of hedging transactions and only reflect a partial or “one-sided” component of any risk exposure. Written equity options and written credit default swaps are often executed in a strategy that is in tandem with long cash instruments (e.g., equity and debt securities). We substantially mitigate our exposure to market risk on these contracts through hedges, such as other derivative contracts and/or cash instruments, and we manage the risk associated with these contracts in the context of our overall risk management framework. We believe notional amounts overstate our expected payout and that fair value of these contracts is a more relevant measure of our obligations. At May 31, 2018, the fair value of derivative contracts meeting the definition of a guarantee is approximately $299.5 million.
Standby Letters of Credit. At May 31, 2018, we provided guarantees to certain counterparties in the form of standby letters of credit in the amount of $51.8 million, which expire within one year. Standby letters of credit commit us to make payment to the beneficiary if the guaranteed party fails to fulfill its obligation under a contractual arrangement with that beneficiary. Since commitments associated with these collateral instruments may expire unused, the amount shown does not necessarily reflect the actual future cash funding requirement.
Other Guarantees. We are members of various exchanges and clearing houses. In the normal course of business we provide guarantees to securities clearing houses and exchanges. These guarantees generally are required under the standard membership agreements, such that members are required to guarantee the performance of other members. Additionally, if a member becomes unable to satisfy its obligations to the clearing house, other members would be required to meet these shortfalls. To mitigate these performance risks, the exchanges and clearing houses often require members to post collateral. Our obligations under such guarantees could exceed the collateral amounts posted. Our maximum potential liability under these arrangements cannot be quantified; however, the potential for us to be required to make payments under such guarantees is deemed remote. Accordingly, no liability has been recognized for these arrangements.
Note 17. Net Capital Requirements
As a broker-dealer registered with the SEC and member firms of the Financial Industry Regulatory Authority (“FINRA”), Jefferies LLC is subject to the SEC Uniform Net Capital Rule (“Rule 15c3-1”), which requires the maintenance of minimum net capital, and has elected to calculate minimum capital requirements using the alternative method permitted by Rule 15c3-1 in calculating net capital. Jefferies LLC, as a dually-registered U.S broker-dealer and futures commission merchant (“FCM”), is also subject to Rule 1.17 of the Commodity Futures Trading Commission (“CFTC”), which sets forth minimum financial requirements. The minimum net capital requirement in determining excess net capital for a dually-registered U.S. broker-dealer and FCM is equal to the greater of the requirement under Rule 15c3-1 or CFTC Rule 1.17.
55
JEFFERIES GROUP LLC AND SUBSIDIARIES
NOTES TO CONSOLIDATED FINANCIAL STATEMENTS - CONTINUED
(Unaudited)
At May 31, 2018, Jefferies LLC’s net capital and excess net capital were as follows (in thousands):
Net Capital | Excess Net Capital | ||||||
Jefferies LLC | $ | 1,666,879 | $ | 1,560,669 | |||
FINRA is the designated examining authority for our U.S. broker-dealer and the National Futures Association is the designated self-regulatory organization for Jefferies LLC as an FCM.
Certain other U.S. and non-U.S. subsidiaries are subject to capital adequacy requirements as prescribed by the regulatory authorities in their respective jurisdictions, including Jefferies International Limited, which is authorized and regulated by the Financial Conduct Authority in the U.K.
The regulatory capital requirements referred to above may restrict our ability to withdraw capital from our regulated subsidiaries.
Note 18. Segment Reporting
We operate in two reportable business segments – Capital Markets and Asset Management. The Capital Markets reportable business segment includes our securities, commodities, futures and foreign exchange trading activities and investment banking, which is composed of underwriting and financial advisory activities. The Capital Markets reportable business segment provides the sales, trading, origination and advisory effort for various fixed income, equity and advisory products and services. The Asset Management reportable business segment provides investment management services to investors in the U.S. and overseas.
Our reportable business segment information is prepared using the following methodologies:
• | Net revenues and non-interest expenses directly associated with each reportable business segment are included in determining earnings (loss) before income taxes. |
• | Net revenues and non-interest expenses not directly associated with specific reportable business segments are allocated based on the most relevant measures applicable, including each reportable business segment’s net revenues, headcount and other factors. |
• | Reportable business segment assets include an allocation of indirect corporate assets that have been fully allocated to our reportable business segments, generally based on each reportable business segment’s capital utilization. |
Our net revenues, non-interest expenses and earnings (loss) before income taxes by reportable business segment are summarized below (in millions):
Three Months Ended May 31, | Six Months Ended May 31, | ||||||||||||||
2018 | 2017 | 2018 | 2017 | ||||||||||||
Capital Markets: | |||||||||||||||
Net revenues | $ | 805.3 | $ | 778.6 | $ | 1,617.7 | $ | 1,561.2 | |||||||
Non-interest expenses | 688.3 | 651.7 | 1,371.6 | 1,308.4 | |||||||||||
Earnings before income taxes | $ | 117.0 | $ | 126.9 | $ | 246.1 | $ | 252.8 | |||||||
Asset Management: | |||||||||||||||
Net revenues | $ | 17.3 | $ | 0.7 | $ | 26.1 | $ | 13.6 | |||||||
Non-interest expenses | 12.4 | 11.4 | 27.6 | 26.0 | |||||||||||
Earnings (loss) before income taxes | $ | 4.9 | $ | (10.7 | ) | $ | (1.5 | ) | $ | (12.4 | ) | ||||
Total: | |||||||||||||||
Net revenues | $ | 822.6 | $ | 779.3 | $ | 1,643.8 | $ | 1,574.8 | |||||||
Non-interest expenses | 700.7 | 663.1 | 1,399.2 | 1,334.4 | |||||||||||
Earnings before income taxes | $ | 121.9 | $ | 116.2 | $ | 244.6 | $ | 240.4 | |||||||
56
JEFFERIES GROUP LLC AND SUBSIDIARIES
NOTES TO CONSOLIDATED FINANCIAL STATEMENTS - CONTINUED
(Unaudited)
The following table summarizes our total assets by reportable business segment (in millions):
May 31, 2018 | November 30, 2017 | ||||||
Total Assets by Reportable Business Segment: | |||||||
Capital Markets | $ | 39,993.5 | $ | 38,620.4 | |||
Asset Management | 1,130.0 | 1,085.3 | |||||
Total assets | $ | 41,123.5 | $ | 39,705.7 | |||
Net Revenues by Geographic Region
Net revenues for the Capital Market reportable business segment are recorded in the geographic region in which the position was risk-managed or, in the case of investment banking, in which the senior coverage banker is located. For the Asset Management reportable business segment, net revenues are allocated according to the location of the investment advisor. Net revenues by geographic region were as follows (in millions):
Three Months Ended May 31, | Six Months Ended May 31, | ||||||||||||||
2018 | 2017 | 2018 | 2017 | ||||||||||||
Americas (1) | $ | 720.7 | $ | 637.4 | $ | 1,402.8 | $ | 1,247.2 | |||||||
Europe (2) | 79.2 | 123.0 | 197.4 | 279.3 | |||||||||||
Asia | 22.7 | 18.9 | 43.6 | 48.3 | |||||||||||
Net revenues | $ | 822.6 | $ | 779.3 | $ | 1,643.8 | $ | 1,574.8 | |||||||
(1) | Substantially all relates to U.S. results. |
(2) | Substantially all relates to U.K. results. |
Note 19. Related Party Transactions
Jefferies Capital Partners Related Funds. We have equity investments in the JCP Manager and in private equity funds, which are managed by a team led by Brian P. Friedman, one of our directors and our Chairman of the Executive Committee (“Private Equity Related Funds”). At May 31, 2018 and November 30, 2017, our equity investments in Private Equity Related Funds were in aggregate $33.9 million and $23.7 million, respectively. We also charge the JCP Manager for certain services under a service agreement. The following table presents revenues and service charges related to our investment in Private Equity Related Funds (in thousands):
Six Months Ended May 31, | Six Months Ended May 31, | ||||||||||||||
2018 | 2017 | 2018 | 2017 | ||||||||||||
Other revenues and investment income (loss) | $ | 2,981 | $ | (8,122 | ) | $ | 10,003 | $ | (9,420 | ) | |||||
Service charges | 67 | 198 | 120 | 323 | |||||||||||
For further information regarding our commitments and funded amounts to the Private Equity Related Funds, see Note 16, Commitments, Contingencies and Guarantees.
Berkadia Commercial Mortgage, LLC. At May 31, 2018 and November 30, 2017, we had commitments to purchase $795.2 million and $864.1 million, respectively, in agency CMBS from Berkadia Commercial Mortgage, LLC, which is partially owned by Jefferies.
Officers, Directors and Employees. The following sets forth information regarding related party transactions with our officers, directors and employees:
• | At May 31, 2018 and November 30, 2017, we had $42.9 million and $45.6 million, respectively, of loans outstanding to certain of our officers and employees (none of whom are executive officers or directors) that are included in Other assets in our Consolidated Statements of Financial Condition. |
57
JEFFERIES GROUP LLC AND SUBSIDIARIES
NOTES TO CONSOLIDATED FINANCIAL STATEMENTS - CONTINUED
(Unaudited)
• | Receivables from and payables to customers include balances arising from officers’, directors’ and employees’ individual security transactions. These transactions are subject to the same regulations as all customer transactions and are provided on substantially the same terms. |
• | One of our directors has investments in a hedge fund managed by us of approximately $4.8 million and $4.9 million at May 31, 2018 and November 30, 2017, respectively. |
See Note 8, Variable Interest Entities, and Note 16, Commitments, Contingencies and Guarantees, for further information regarding related party transactions with our officers, directors and employees.
Jefferies. The following is a description of related party transactions with Jefferies and its affiliates:
• | We provide services to and receive services from Jefferies under service agreements. We also receive revenues from Jefferies under a revenue sharing agreement (in millions): |
Three Months Ended May 31, | Six Months Ended May 31, | ||||||||||||||
2018 | 2017 | 2018 | 2017 | ||||||||||||
Charges to Jefferies for services provided | $ | 14.1 | $ | 11.5 | $ | 30.3 | $ | 21.6 | |||||||
Charges from Jefferies for services received | 2.3 | 4.7 | 4.7 | 8.6 | |||||||||||
• | We provide capital markets and asset management services to Jefferies and its affiliates. The following table presents the revenues earned by type of services provided (in millions): |
Three Months Ended May 31, | Six Months Ended May 31, | ||||||||||||||
2018 | 2017 | 2018 | 2017 | ||||||||||||
Commissions and other fees | $ | 0.4 | $ | — | $ | 0.4 | $ | — | |||||||
Principal transactions | — | — | 0.1 | — | |||||||||||
Other revenues | 0.2 | — | 0.4 | — | |||||||||||
• | Receivables from and payables to Jefferies, included in Other assets and Accrued expenses and other liabilities, respectively, in our Consolidated Statements of Financial Condition (in millions): |
May 31, 2018 | November 30, 2017 | ||||||
Receivable from Jefferies | $ | 3.4 | $ | 2.5 | |||
Payable to Jefferies | 0.8 | 3.1 | |||||
• | On January 11, 2018 our Board of Directors approved a distribution to our sole limited liability company member, Jefferies, in the amount of $200.0 million, which was paid on January 31, 2018. In addition, our Board of Directors approved a quarterly distribution policy authorizing us to pay a quarterly distribution to our limited liability company members following the end of each of our fiscal quarters. Beginning at the end of our fiscal quarter ending February 28, 2018 and on a quarterly basis thereafter, we will pay our limited liability company members a quarterly dividend equal to 50% of our positive net earnings attributable to us (as adjusted for preceding loss quarters, if any). Our results at May 31, 2018 include a dividend payable in the amount of $18.6 million. |
• | Pursuant to a tax sharing agreement entered into between us and Jefferies, payments are made between us and Jefferies to settle current tax receivables and payables. At May 31, 2018 and November 30, 2017, a net current tax payable to Jefferies of $56.9 million and $91.5 million, respectively, is included in Accrued expenses and other liabilities in our Consolidated Statements of Financial Condition. On April 3, 2018 and June 15, 2018, we made payments of $115.0 million and $36.0 million, respectively, to Jefferies, which reduced the cumulative net current tax payable balance. |
58
JEFFERIES GROUP LLC AND SUBSIDIARIES
NOTES TO CONSOLIDATED FINANCIAL STATEMENTS - CONTINUED
(Unaudited)
• | We entered into a foreign exchange prime brokerage agreement with an affiliate of Jefferies in 2017. The following table presents the balances relating to these foreign exchange contracts, which are included in our Consolidated Statements of Financial Condition (in millions). |
May 31, 2018 | November 30, 2017 | ||||||
Payables-brokers, dealers and clearing organizations | $ | 13.7 | $ | 17.0 | |||
Financial instruments sold, not yet purchased | 0.4 | — | |||||
• | Two of our directors have investments totaling $2.7 million and $3.6 million at May 31, 2018 and November 30, 2017, respectively, in a hedge fund managed by Jefferies. |
• | We have investments in hedge funds managed by Jefferies of $217.6 million and $136.1 million at May 31, 2018 and November 30, 2017, respectively, included in Financial instruments owned in our Consolidated Statements of Financial Condition. Net gains on our investments in these hedge funds, which are included in Principal transactions in our Consolidated Statements of Earnings (in millions): |
Three Months Ended May 31, | Six Months Ended May 31, | ||||||||||||||
2018 | 2017 | 2018 | 2017 | ||||||||||||
Net gains on our investments | $ | 0.8 | $ | 1.4 | $ | 4.5 | $ | 3.2 | |||||||
• | As a result of a public offering by Landcadia Holdings Inc., an affiliate of Jefferies, we own 638,561 public units (each unit consisting of one share of Class A common stock and one public warrant) at May 31, 2018 and November 30, 2017, with a fair value of $7.0 million and $6.8 million, respectively, included in Financial instruments owned in our Consolidated Statements of Financial Condition. |
• | A subsidiary of Jefferies had an investment in a hedge fund managed by us of $27.3 million at November 30, 2017. This investment was transferred to Jefferies LLC effective December 31, 2017, and we paid $26.7 million, the investment’s NAV, to Jefferies in January 2018. |
• | In April 2017, we sold securities to Jefferies at a fair value of $21.9 million for cash, in connection with the transfer of certain trading activity to Jefferies. In February 2017, we sold securities to Jefferies at a fair value of $25.6 million for cash. There were no gains or losses on these transactions. |
• | In connection with our sales and trading activities, from time to time we make a market in long-term debt securities of Jefferies (i.e., we buy and sell debt securities issued by Jefferies). At May 31, 2018 and November 30, 2017, approximately $1.0 million and $0.2 million, respectively, is included in Financial instruments owned in our Consolidated Statements of Financial Condition. |
For information on transactions with our equity method investees, see Note 9, Investments.
59
JEFFERIES GROUP LLC AND SUBSIDIARIES
Item 2. Management’s Discussion and Analysis of Financial Condition and Results of Operations.
This report contains or incorporates by reference “forward looking statements” within the meaning of the safe harbor provisions of Section 27A of the Securities Act of 1933 and Section 21E of the Securities Exchange Act of 1934. Forward looking statements include statements about our future and statements that are not historical facts. These forward looking statements are usually preceded by the words “believe,” “intend,” “may,” “will,” or similar expressions. Forward looking statements may contain expectations regarding revenues, earnings, operations and other results, and may include statements of future performance, plans and objectives. Forward looking statements also include statements pertaining to our strategies for future development of our business and products. Forward looking statements represent only our belief regarding future events, many of which by their nature are inherently uncertain. It is possible that the actual results may differ, possibly materially, from the anticipated results indicated in these forward-looking statements. Information regarding important factors that could cause actual results to differ, perhaps materially, from those in our forward looking statements is contained in this report and other documents we file. You should read and interpret any forward looking statement together with these documents, including the following:
• | the description of our business and risk factors contained in our Annual Report on Form 10-K for the year ended November 30, 2017 and filed with the Securities and Exchange Commission (“SEC”) on January 26, 2018; |
• | the discussion of our analysis of financial condition and results of operations contained in this report under the caption “Management’s Discussion and Analysis of Financial Condition and Results of Operations” herein; |
• | the discussion of our risk management policies, procedures and methodologies contained in this report under the caption “Management’s Discussion and Analysis of Financial Condition and Results of Operations – Risk Management” herein; |
• | the notes to the consolidated financial statements contained in this report; and |
• | cautionary statements we make in our public documents, reports and announcements. |
Any forward looking statement speaks only as of the date on which that statement is made. We will not update any forward looking statement to reflect events or circumstances that occur after the date on which the statement is made, except as required by applicable law.
Our business, by its nature, does not produce predictable or necessarily recurring earnings. Our results in any given period can be materially affected by conditions in global financial markets, economic conditions generally and our own activities and positions. For a further discussion of the factors that may affect our future operating results, see “Risk Factors” in Part I, Item IA of our Annual Report on Form 10-K for the year ended November 30, 2017.
60
JEFFERIES GROUP LLC AND SUBSIDIARIES
Consolidated Results of Operations
On December 22, 2017, the Tax Cuts and Jobs Act (the “Tax Act”) was enacted. We incurred a provisional tax charge of $163.7 million in the three months ended February 28, 2018, as a result of the enactment of the Tax Act. This provisional estimate was slightly adjusted in the second quarter of 2018, which resulted in a total provisional tax charge of $160.5 million during the six months ended May 31, 2018. Of this amount, $108.5 million relates to the write down of our deferred tax asset, reflecting the impact of a lower federal tax rate of 21% on our deferred tax items. The remaining part of the provisional charge relates to a toll charge on the deemed repatriation of unremitted foreign earnings. Refer to our discussion of Income Taxes below for more information.
The following table provides an overview of our consolidated results of operations (dollars in thousands):
Three Months Ended May 31, | % Change | Six Months Ended May 31, | % Change | ||||||||||||||||||
2018 | 2017 | 2018 | 2017 | ||||||||||||||||||
Net revenues | $ | 822,557 | $ | 779,294 | 5.6 | % | $ | 1,643,803 | $ | 1,574,807 | 4.4 | % | |||||||||
Non-interest expenses | 700,692 | 663,113 | 5.7 | % | 1,399,200 | 1,334,427 | 4.9 | % | |||||||||||||
Earnings before income taxes | 121,865 | 116,181 | 4.9 | % | 244,603 | 240,380 | 1.8 | % | |||||||||||||
Income tax expense | 23,857 | 46,391 | (48.6 | )% | 207,414 | 56,570 | 266.7 | % | |||||||||||||
Net earnings | 98,008 | 69,790 | 40.4 | % | 37,189 | 183,810 | (79.8 | )% | |||||||||||||
Net earnings attributable to noncontrolling interests | 4 | 39 | (89.7 | )% | 3 | 40 | (92.5 | )% | |||||||||||||
Net earnings attributable to Jefferies Group LLC | 98,004 | 69,751 | 40.5 | % | 37,186 | 183,770 | (79.8 | )% | |||||||||||||
Effective tax rate | 19.6 | % | 39.9 | % | (50.9 | )% | 84.8 | % | 23.5 | % | 260.9 | % | |||||||||
Impact of Adopting Revenue Recognition Guidance
On December 1, 2017, we adopted Accounting Standards Update No. 2014-9, Revenue from Contracts with Customers (the “new revenue standard”), which provides accounting guidance on the recognition of revenues from contracts with customers and impacts the presentation of certain revenues and expenses in our Consolidated Statements of Earnings. The new revenue standard is applied prospectively from December 1, 2017 and reported financial information for historical comparable periods have not been revised. The adoption of the new revenue standard resulted in a reduction of beginning Member’s paid in capital of $6.1 million after-tax as a cumulative effect of adoption of an accounting change. The impact of adoption is primarily related to investment banking expenses that were deferred at November 30, 2017 under the previously existing accounting guidance, which would have been expensed in prior periods under the new revenue standard, and investment banking revenues that were previously recognized in prior periods, which would have been deferred at November 30, 2017 under the new revenue standard.
The new revenue guidance does not apply to revenue associated with financial instruments, including loans and securities, and as a result, did not have an impact on the elements of our Consolidated Statements of Earnings most closely associated with financial instruments, including Principal transaction revenues, Interest income and Interest expense.
There is no significant impact as a result of applying the new revenue standard to our results of operations for the three and six months ended May 31, 2018, except as it relates to the presentation of certain investment banking expenses. Investment banking revenues have historically been recorded net of related out-of-pocket deal expenses directly related to investment banking engagements. Under the new revenue standard, all investment banking expenses are recognized within their respective expense category in our Consolidated Statement of Earnings and any expense reimbursements are recognized as Investment banking revenues (i.e., revenues are no longer presented net of the related out-of-pocket deal expenses). Expenses directly associated with underwriting activities are recorded to a new non-compensation expense line item: "Underwriting costs". The impact of this change in presentation on the three and six months ended May 31, 2018 results was an increase in both Investment banking revenues and Total non-compensation expenses of $32.3 million and $64.8 million, respectively. This change in presentation has no impact on Net earnings.
Refer to Note 2, Summary of Significant Accounting Policies, and Note 3, Accounting Developments, in our consolidated financial statements included in this Quarterly Report on Form 10-Q, for further information.
61
JEFFERIES GROUP LLC AND SUBSIDIARIES
Executive Summary
Three Months Ended May 31, 2018
Consolidated Results
• | Net revenues for the three months ended May 31, 2018 were $822.6 million, compared with $779.3 million for the three months ended May 31, 2017, an increase of $43.3 million, or 5.6%. The increase reflects a $150.9 million increase in investment banking revenues, which includes an increase of $32.3 million in investment banking net revenues as a result of the new revenue standard. Refer to “Impact of Adopting Revenue Recognition Guidance” herein and Note 2, Summary of Significant Accounting Policies and Note 3, Accounting Developments in our consolidated financial statements included in this Quarterly Report on Form 10-Q, for further details on the new revenue standard. This increase was offset by a decline in our fixed income net revenues. |
• | We continued to maintain strong leverage ratios and liquidity and a strong capital base during the three months ended May 31, 2018. See the “Liquidity, Financial Condition and Capital Resources” section herein for further information. |
Business Results
• | The increase in net revenues for the three months ended May 31, 2018, as compared to the three months ended May 31, 2017, reflects higher net revenues in investment banking and equities, partially offset by lower fixed income net revenues. |
• | Higher investment banking revenues during the three months ended May 31, 2018 reflect increased capital markets and advisory revenues, led by strong growth in our mergers and acquisition, leveraged finance and equity capital markets businesses. As a result of the new revenue standard, investment banking revenues for the three months ended May 31, 2018 reflect changes to the presentation of investment banking expenses and reimbursements thereof. Prior to these changes, certain investment banking expenses have been presented net against investment banking revenues. This change in presentation added $32.3 million to investment banking net revenues during the three months ended May 31, 2018. Refer to “Impact of Adopting Revenue Recognition Guidance” herein and Note 2, Summary of Significant Accounting Policies, and Note 3, Accounting Developments, in our consolidated financial statements included in this Quarterly Report on Form 10-Q, for further details on the new revenue standard. |
• | Our equities net revenues improved across certain of our core global equities sales and trading business, partially offset by losses in certain block positions. |
• | Our fixed income net revenues were lower than those of the prior year quarter, as the uncertainty surrounding the direction of central bank policy and global interest rates reduced market activity and trading volumes, principally in the month of March. |
• | Net revenues from our other business category in the three months ended May 31, 2018 were $3.8 million, compared with $92.7 million in the prior year quarter. The results in the prior year quarter included net gains of $95.8 million from our investment in KCG Holdings, Inc. (“KCG”), which was sold in July 2017. |
• | Net revenues in the three months ended May 31, 2018 also included asset management revenues of $17.3 million, compared with $0.7 million in the prior year quarter. |
Expenses
• | Non-interest expenses for the three months ended May 31, 2018 increased $37.6 million, or 5.7%, to $700.7 million, compared with $663.1 million for the three months ended May 31, 2017, primarily due to an increase of $32.3 million across Business development expenses and Underwriting costs, as a result of applying the new revenue standard to our results of operations for the three months ended May 31, 2018. Refer to “Impact of Adopting Revenue Recognition Guidance” herein and Note 2, Summary of Significant Accounting Policies, and Note 3, Accounting Developments, in our consolidated financial statements included in this Quarterly Report on Form 10-Q, for further details on the new revenue standard. |
• | Compensation and benefits expense for the three months ended May 31, 2018 was $444.1 million, a decrease of $6.4 million, or 1.4%, from the comparable prior year quarter. Compensation and benefits expense as a percentage of Net revenues was 54.0% for the three months ended May 31, 2018, compared with 57.8% in the prior year quarter. |
• | Non-compensation expenses for the three months ended May 31, 2018 were $256.6 million, an increase of $44.0 million, or 20.7%, from the comparable prior year quarter. |
62
JEFFERIES GROUP LLC AND SUBSIDIARIES
Six Months Ended May 31, 2018
Consolidated Results
• | Net revenues for the six months ended May 31, 2018 were $1,643.8 million, compared with $1,574.8 million for the six months ended May 31, 2017, an increase of $69.0 million, or 4.4%, which includes an increase of $64.8 million in investment banking net revenues as a result of the new revenue standard. Refer to “Impact of Adopting Revenue Recognition Guidance” herein and Note 2, Summary of Significant Accounting Policies and Note 3, Accounting Developments in our consolidated financial statements included in this Quarterly Report on Form 10-Q, for further details on the new revenue standard. |
• | Our results in the six months ended May 31, 2018 reflect continued strong investment banking revenues and solid performance in equities net revenues, partially offset by a decline in fixed income net revenues. |
Business Results
• | The increase in net revenues for the six months ended May 31, 2018, as compared to the six months ended May 31, 2017, reflects higher net revenues in investment banking and equities, partially offset by lower fixed income net revenues. |
• | Higher investment banking revenues during the six months ended May 31, 2018 reflect higher advisory and capital markets revenues, resulting from continued strength in our mergers and acquisitions business and strong equity issuance in our life science business. As a result of the new revenue standard, investment banking revenues for the six months ended May 31, 2018 reflect changes to the presentation of investment banking expenses and reimbursements thereof. Prior to these changes, certain investment banking expenses have been presented net against investment banking revenues. This change in presentation added $64.8 million to investment banking net revenues during the six months ended May 31, 2018. Refer to “Impact of Adopting Revenue Recognition Guidance” herein and Note 2, Summary of Significant Accounting Policies, and Note 3, Accounting Developments, in our consolidated financial statements included in this Quarterly Report on Form 10-Q, for further details on the new revenue standard. |
• | Our equities net revenues improved across certain of our core global equities sales and trading business, partially offset by losses in certain block positions. |
• | Our fixed income net revenues were below those of the prior year period, primarily due to soft market conditions in the month of March 2018. Further, as noted in our first quarter 2018 results, performance in the first quarter of 2017 was bolstered by robust trading activity following the 2016 U.S. Presidential election. |
• | Net revenues from our other business category in the six months ended May 31, 2018 were $13.6 million, compared with $86.5 million in the prior year period. The prior year period included net gains of $91.2 million from our investment in KCG, which was sold in July 2017. |
• | Net revenues in the six months ended May 31, 2018 also included asset management revenues of $26.1 million, compared with $13.6 million in the prior year period. |
Expenses
• | Non-interest expenses for the six months ended May 31, 2018 increased $64.8 million, or 4.9%, to $1,399.2 million, compared with $1,334.4 million for the six months ended May 31, 2017, primarily due to an increase of $64.8 million across Business development expenses and Underwriting costs, as a result of applying the new revenue standard to our results of operations for the six months ended May 31, 2018. Refer to “Impact of Adopting Revenue Recognition Guidance” herein and Note 2, Summary of Significant Accounting Policies and Note 3, Accounting Developments in our consolidated financial statements included in this Quarterly Report on Form 10-Q, for further details on the new revenue standard. |
• | Compensation and benefits expense for the six months ended May 31, 2018 was $899.7 million, a decrease of $11.0 million, or 1.2%, from the comparable prior year period. Compensation and benefits expense as a percentage of Net revenues was 54.7% for the six months ended May 31, 2018, compared with 57.8% in the prior year period. |
• | Non-compensation expenses for the six months ended May 31, 2018 were $499.5 million, an increase of $75.8 million, or 17.9%, from the comparable prior year period. |
Headcount
• | At May 31, 2018, we had 3,438 employees globally, an increase of 114 employees from our headcount of 3,324 at May 31, 2017. Our headcount increased, primarily as a result of continued hiring in investment banking, as well as additions in asset management and corporate services. |
63
JEFFERIES GROUP LLC AND SUBSIDIARIES
Revenues by Source
For presentation purposes, the remainder of “Results of Operations” is presented on a detailed product and expense basis, rather than on a business segment basis. Net revenues presented for our equities and fixed income businesses include allocations of interest income and interest expense as we assess the profitability of these businesses inclusive of the net interest revenue or expense associated with the respective activities, which is a function of the mix of each business’s associated assets and liabilities and the related funding costs.
In connection with the adoption of the new revenue standard in the first quarter of 2018, we have made changes to the presentation of our “Revenues by Source” to better align the manner in which we describe and present the results of our performance with the manner in which we manage our business activities and serve our clients. We believe that the reorganization of our revenue reporting will enable us to describe our business mix more clearly and provide greater transparency in the communication of our results.
The “Results of our Operations” has historically been presented on a product basis. Prior to the first quarter of 2018, we presented “Revenues by Source” as follows: equities, fixed income, investment banking and asset management. As of the first quarter of 2018, we are reporting our “Revenues by Source” along the following business lines: equities, fixed income, investment banking, asset management and other. Additionally, the results of the investment banking business now includes a new subcategory “Other investment banking”, which contains our share of net earnings from our corporate lending joint venture, Jefferies Finance LLC (“Jefferies Finance”), as well as any gains and losses from any securities or loans received or acquired in connection with our investment banking efforts. Previously reported results are presented on a comparable basis in the tables below.
The following is a description of the changes that have been made:
• | Equities revenues now represent the activities of our core equities sales and trading, securities finance, prime brokerage and wealth management businesses. Revenues from other activities previously presented within the Equities business have been disaggregated as follows: |
◦ | Our share of net earnings from our Jefferies Finance joint venture, as well as any revenues from securities and loans received or acquired in connection with our investment banking efforts, are now presented as part of our investment banking business. |
◦ | Our share of net earnings from our historic Jefferies LoanCore LLC (“Jefferies LoanCore”) joint venture is presented as part of our fixed income business through its sale in October 2017. |
◦ | Revenues related to our principal investments in certain private equity funds and hedge funds managed by third parties or related parties, investments in strategic ventures (including KCG through its sale in July 2017), certain other securities owned, and investments held as part of obligations under employee benefit plans, including deferred compensation arrangements, are now presented as part of our other business. |
◦ | Revenue related to our capital invested in asset management funds that are managed by us is now presented within our asset management business. |
• | Revenues from our legacy futures business and revenues associated with structured notes issued by us are now presented as part of our other business. Additionally, revenues derived from securities or loans received or acquired in connection with our investment banking efforts are now presented as part of our investment banking revenues. |
• | Revenues from principal investments in certain private equity and asset management funds managed by related parties, which were previously presented within our asset management revenue, are now presented as part of our other business. |
The changes to the manner in which we describe and disclose the performance of our business activities has no effect on our historical consolidated results of operation. This reorganization does not impact our reportable segments and we will continue to report our activities in two business segments: Capital Markets and Asset Management.
64
JEFFERIES GROUP LLC AND SUBSIDIARIES
The composition of our net revenues has varied over time as financial markets and the scope of our operations have changed. The composition of net revenues can also vary from period to period due to fluctuations in economic and market conditions, and our own performance. The following provides a summary of “Net Revenues by Source” (dollars in thousands):
Three Months Ended May 31, | Six Months Ended May 31, | ||||||||||||||||||||||||||||||||
2018 | 2017 | 2018 | 2017 | ||||||||||||||||||||||||||||||
Amount | % of Net Revenues | Amount | % of Net Revenues | % Change | Amount | % of Net Revenues | Amount | % of Net Revenues | % Change | ||||||||||||||||||||||||
Equities | $ | 175,083 | 21.3 | % | $ | 174,363 | 22.4 | % | 0.4 | % | $ | 330,860 | 20.1 | % | $ | 330,360 | 21.0 | % | 0.2 | % | |||||||||||||
Fixed income | 119,987 | 14.6 | 156,018 | 20.0 | (23.1 | )% | 333,040 | 20.3 | 377,052 | 23.9 | (11.7 | )% | |||||||||||||||||||||
Total sales and trading | 295,070 | 35.9 | 330,381 | 42.4 | (10.7 | )% | 663,900 | 40.4 | 707,412 | 44.9 | (6.2 | )% | |||||||||||||||||||||
Equity (1) | 107,553 | 13.1 | 74,902 | 9.6 | 43.6 | % | 187,393 | 11.4 | 136,468 | 8.7 | 37.3 | % | |||||||||||||||||||||
Debt (1) | 175,762 | 21.3 | 125,847 | 16.1 | 39.7 | % | 344,756 | 21.0 | 288,475 | 18.3 | 19.5 | % | |||||||||||||||||||||
Capital markets | 283,315 | 34.4 | 200,749 | 25.7 | 41.1 | % | 532,149 | 32.4 | 424,943 | 27.0 | 25.2 | % | |||||||||||||||||||||
Advisory (1) | 216,982 | 26.4 | 151,114 | 19.4 | 43.6 | % | 408,139 | 24.8 | 334,941 | 21.3 | 21.9 | % | |||||||||||||||||||||
Other investment banking | 6,065 | 0.7 | 3,636 | 0.5 | 66.8 | % | (153 | ) | — | 7,435 | 0.4 | N/M | |||||||||||||||||||||
Total investment banking | 506,362 | 61.5 | 355,499 | 45.6 | % | 42.4 | % | 940,135 | 57.2 | 767,319 | 48.7 | 22.5 | % | ||||||||||||||||||||
Other | 3,830 | 0.5 | 92,719 | 11.9 | (95.9 | )% | 13,628 | 0.8 | 86,519 | 5.5 | (84.2 | )% | |||||||||||||||||||||
Total Capital Markets | 805,262 | 97.9 | 778,599 | 99.9 | % | 3.4 | % | 1,617,663 | 98.4 | 1,561,250 | 99.1 | 3.6 | % | ||||||||||||||||||||
Asset management fees | 6,016 | 0.7 | 4,115 | 0.5 | 46.2 | % | 10,946 | 0.7 | 10,922 | 0.7 | 0.2 | % | |||||||||||||||||||||
Investment return | 11,279 | 1.4 | (3,420 | ) | (0.4 | ) | N/M | 15,194 | 0.9 | 2,635 | 0.2 | 476.6 | % | ||||||||||||||||||||
Total Asset Management | 17,295 | 2.1 | 695 | 0.1 | N/M | 26,140 | 1.6 | 13,557 | 0.9 | 92.8 | % | ||||||||||||||||||||||
Net revenues | $ | 822,557 | 100.0 | % | $ | 779,294 | 100.0 | % | 5.6 | % | $ | 1,643,803 | 100.0 | % | $ | 1,574,807 | 100.0 | % | 4.4 | % | |||||||||||||
N/M — Not Meaningful
(1) | As a result of the new revenue standard, investment banking revenues for the three and six months ended May 31, 2018 reflect changes to the presentation of investment banking expenses and reimbursements thereof. Prior to the first quarter of 2018, certain investment banking expenses have been presented net against investment banking revenues. This change in presentation resulted in an increase of $32.3 million and $64.8 million in investment banking net revenues during the three and six months ended May 31, 2018, respectively, as compared to the three and six months ended May 31, 2017. Refer to “Impact of Adopting Revenue Recognition Guidance” herein and Note 2, Summary of Significant Accounting Policies and Note 3, Accounting Developments in our consolidated financial statements included in this Quarterly Report on Form 10-Q, for further details on the new revenue standard. |
Equities Net Revenues
Equities is comprised of net revenues from:
• | services provided to our clients from which we earn commissions or spread revenue by executing, settling and clearing transactions for clients; |
• | financing, securities lending and other prime brokerage services offered to clients; and |
• | wealth management services, which includes providing clients access to all of our institutional execution capabilities. |
Three Months Ended May 31, 2018
• | Total equities net revenues were $175.1 million for the three months ended May 31, 2018, compared with $174.4 million for the three months ended May 31, 2017. |
• | The results in equities net revenues during the three months ended May 31, 2018 improved across certain of our core global equities sales and trading business, offset by losses in certain block positions. The increase in our core global equities sales and trading business was primarily driven by higher revenues in our equity derivatives, electronic trading and convertibles businesses, primarily due to higher equity volatility, overall improved market trading volumes and an increase in our commissions. This was partially offset by a decrease in our U.S. and European cash equities businesses, primarily due to lower customer activity. The securities finance business saw a decline as compared to the prior year quarter, driven by decreased trading revenues. |
• | Equities posted record quarterly revenues across the overall sales and trading business, as well as across several core businesses, including our equity derivatives, global electronic trading, European securities finance, and prime brokerage businesses. |
65
JEFFERIES GROUP LLC AND SUBSIDIARIES
Six Months Ended May 31, 2018
• | In April 2018, our core U.S. sales and trading business received top ranks from Greenwich Associates for our 2017 performance. This includes ranking #1 in electronic trading service and product quality, #1 in small and mid-cap equities trading, #3 in healthcare research and #4 in sales capability. |
• | Total equities net revenues were $330.9 million for the six months ended May 31, 2018, compared with $330.4 million for the six months ended May 31, 2017. |
• | The results in equities net revenues during the six months ended May 31, 2018 improved across our core global equities sales and trading business, offset by losses in certain block positions. The increase in our core global equities sales and trading business was primarily driven by higher revenues in our equity derivatives, electronic trading, convertibles, and Asian cash equities businesses, primarily due to higher equity volatility, overall improved market trading volumes and an increase in our commissions. This was partially offset by a decrease in our U.S. and European cash equities businesses, primarily due to lower customer activity. European revenues were also lower as a result of the delay in advisory payments and the impact of unbundling due to the Market in Financial Instruments Directive (“MiFID II”) regulation. The securities finance business saw a decline as compared with the prior year period, driven by decreased trading revenues. |
• | Equities posted record six months results in the current year period across the overall sales and trading business, as well as across several core businesses, including our equity derivatives, global electronic trading, European securities finance, and prime brokerage businesses. |
Fixed Income Net Revenues
Fixed income is comprised of net revenues from:
• | executing transactions for clients and making markets in in securitized products, investment grade, high-yield, emerging markets, municipal and sovereign securities and bank loans; |
• | foreign exchange execution on behalf of clients; and |
• | interest rate derivatives and credit derivatives (used primarily for hedging activities). |
Three Months Ended May 31, 2018
• | Fixed income net revenues totaled $120.0 million for the three months ended May 31, 2018, a decrease of $36.0 million compared with net revenues of $156.0 million in the three months ended May 31, 2017, as the uncertainty surrounding the direction of central bank policy and global interest rates reduced market activity and trading volumes, principally in the month of March. The following highlights the main components of the results: |
◦ | Revenues in our global investment grade corporates businesses declined due to lower volatility and reduced supply resulting in lower trading activity, particularly during the month of March. |
◦ | Revenues in our municipals businesses were down on lower secondary trading activity consistent with lower new issuance activity and an overhang of excess dealer inventory at the beginning of the period, which dampened the market. |
◦ | Results in our securitized markets groups were down as results from CLO secondary trading activity were lower as the business focused on primary issuance, which increased as compared to the prior year quarter and is reflected in our investment banking results, while most of our other securitized markets businesses improved on increased activity and market share. |
◦ | The performance of our leveraged credit business continued to improve as we further repositioned our secondary trading businesses. |
◦ | Results improved in our global emerging markets sales and trading business as we have continued to expand our European franchise resulting in increased market share. |
◦ | The prior year quarter also included revenues from our share of Jefferies LoanCore, which was sold in October 2017, as well as revenues from non-core fixed income products that have now been deemphasized. |
Six Months Ended May 31, 2018
• | Fixed income net revenues totaled $333.0 million for the six months ended May 31, 2018, a decrease of $44.1 million compared with net revenues of $377.1 million in the six months ended May 31, 2017, primarily due to soft market conditions in the month of March 2018. This is compared to performance in the first quarter of 2017, which was bolstered by robust trading activity following the 2016 U.S. Presidential election. The following highlights the main components of the decline in the results: |
66
JEFFERIES GROUP LLC AND SUBSIDIARIES
◦ | Global rates revenues in the six months ended May 31, 2018 declined as the opportunities from volatility from the U.S. Presidential Election and European election cycles, primarily in the first quarter of 2017, were not replicated in the current year period. |
◦ | Revenues declined in our global investment grade corporates business due to decreased trading activity and increased competition as market participants crowded into limited trading opportunities. |
◦ | Revenues in our municipal securities business were lower as activity declined meaningfully after changes in tax legislation, as compared to favorable performance in the first half of 2017. |
◦ | Revenues in our U.S. securitized markets group were significantly improved, primarily as we were more profitable in our agency products as more favorable trading conditions prevailed. Additionally, increased securitization activity contributed to the period’s results. |
◦ | Revenues in our leveraged credit business were strong, as we increased our market share in high yield, leveraged loan and distressed products. |
◦ | The prior year six month period also included revenues from our share of Jefferies LoanCore, which was sold in October 2017, as well as revenues from non-core fixed income products that have now been deemphasized. |
Investment Banking Revenues
Investment banking is comprised of revenues from:
• | capital markets services, which include underwriting and placement services related to corporate debt, municipal bonds, mortgage-and asset-backed securities and equity and equity-linked securities and loan syndication; |
• | advisory services with respect to mergers and acquisitions and restructurings and recapitalizations; |
• | our share of net earnings from our corporate lending joint venture Jefferies Finance; and |
• | securities and loans received or acquired in connection with our investment banking activities. |
The following table sets forth our investment banking revenues (dollars in thousands):
Three Months Ended May 31, | % Change | Six Months Ended May 31, | % Change | ||||||||||||||||||
2018 | 2017 | 2018 | 2017 | ||||||||||||||||||
Equity (1) | $ | 107,553 | $ | 74,902 | 43.6 | % | $ | 187,393 | $ | 136,468 | 37.3 | % | |||||||||
Debt (1) | 175,762 | 125,847 | 39.7 | % | 344,756 | 288,475 | 19.5 | % | |||||||||||||
Capital markets | 283,315 | 200,749 | 41.1 | % | 532,149 | 424,943 | 25.2 | % | |||||||||||||
Advisory (1) | 216,982 | 151,114 | 43.6 | % | 408,139 | 334,941 | 21.9 | % | |||||||||||||
Other investment banking | 6,065 | 3,636 | 66.8 | % | (153 | ) | 7,435 | N/M | |||||||||||||
Total investment banking | $ | 506,362 | $ | 355,499 | 42.4 | % | $ | 940,135 | $ | 767,319 | 22.5 | % | |||||||||
N/M — Not Meaningful
(1) | As a result of the new revenue standard, investment banking revenues for the three and six months ended May 31, 2018 reflect changes to the presentation of investment banking expenses and reimbursements thereof. Prior to the first quarter of 2018, certain investment banking expenses have been presented net against investment banking revenues. This change in presentation resulted in an increase of $32.3 million and $64.8 million in investment banking net revenues during the three and six months ended May 31, 2018, respectively, as compared to the three and six months ended May 31, 2017. Refer to “Impact of Adopting Revenue Recognition Guidance” herein and Note 2, Summary of Significant Accounting Policies and Note 3, Accounting Developments in our consolidated financial statements included in this Quarterly Report on Form 10-Q, for further details on the new revenue standard. |
67
JEFFERIES GROUP LLC AND SUBSIDIARIES
The following table sets forth our investment banking activities (dollars in billions):
Deals Completed | Aggregate Value | ||||||||||||||||||||||||||
Three Months Ended May 31, | Six Months Ended May 31, | Three Months Ended May 31, | Six Months Ended May 31, | ||||||||||||||||||||||||
2018 | 2017 | 2018 | 2017 | 2018 | 2017 | 2018 | 2017 | ||||||||||||||||||||
Public and private debt financings | 218 | 238 | 463 | 436 | $ | 68.6 | $ | 66.9 | $ | 136.6 | $ | 118.9 | |||||||||||||||
Public and private equity and convertible offerings (1) | 48 | 51 | 85 | 91 | 13.5 | 13.9 | 20.3 | 34.4 | |||||||||||||||||||
Advisory transactions (2) | 49 | 35 | 90 | 77 | 31.0 | 36.9 | 93.8 | 77.1 | |||||||||||||||||||
(1) | We acted as sole or joint bookrunner on 46 and 82 offerings during the three and six months ended May 31, 2018, respectively, and 48 and 85 offerings during the three and six months ended May 31, 2017, respectively. |
(2) | The number of advisory deals completed includes three and nine restructuring and recapitalization transactions during the three and six months ended May 31, 2018, respectively, and two and six restructuring and recapitalization transactions during the three and six months ended May 31, 2017, respectively. |
Three Months Ended May 31, 2018
• | Total investment banking revenues were $506.4 million for the three months ended May 31, 2018, 42.4% higher than the three months ended May 31, 2017 led by strong growth in our mergers and acquisition, leveraged finance and equity capital markets businesses. The results in the quarter also include an increase of $32.3 million in investment banking net revenues as a result of the new revenue standard. Refer to “Impact of Adopting Revenue Recognition Guidance” herein and Note 2, Summary of Significant Accounting Policies and Note 3, Accounting Developments in our consolidated financial statements included in this Quarterly Report on Form 10-Q, for further details on the new revenue standard. |
• | Capital markets revenues in the three months ended May 31, 2018 increased 41.1% from the prior year quarter. Advisory revenues for the three months ended May 31, 2018 increased 43.6% compared to the prior year quarter. |
• | From equity and debt capital raising activities, we generated $107.6 million and $175.8 million in revenues, respectively, for the three months ended May 31, 2018, compared with $74.9 million and $125.8 million in revenues, respectively, in the prior year quarter. |
Six Months Ended May 31, 2018
• | Total investment banking revenues were $940.1 million for the six months ended May 31, 2018, 22.5% higher than the six months ended May 31, 2017, due to higher advisory and capital markets revenues, resulting from continued strength in our mergers and acquisitions business and strong equity issuance in our life science business. Results also include an increase of $64.8 million in investment banking net revenues as a result of the new revenue standard and strong equity and debt issuance activity in the healthcare and energy sectors and continued strength in our mergers and acquisitions business. Refer to “Impact of Adopting Revenue Recognition Guidance” herein and Note 2, Summary of Significant Accounting Policies and Note 3, Accounting Developments in our consolidated financial statements included in this Quarterly Report on Form 10-Q, for further details on the new revenue standard. |
• | Capital markets revenues in the six months ended May 31, 2018 increased 25.2% from the prior year period. Advisory revenues for the six months ended May 31, 2018 increased 21.9% compared to the prior year period. |
• | From equity and debt capital raising activities, we generated $187.4 million and $344.8 million in revenues, respectively, for the six months ended May 31, 2018, compared with $136.5 million and $288.5 million in revenues, respectively, in the prior year period. |
Other
Other is comprised of revenues from:
• | principal investments in private equity and hedge funds managed by third parties or related parties; |
• | strategic investments other than Jefferies Finance (such as KCG through its sale in July 2017); |
• | investments held as part of employee benefit plans, including deferred compensation plans; |
• | structured note activities on behalf of the firm; and |
• | our legacy Futures business. |
68
JEFFERIES GROUP LLC AND SUBSIDIARIES
Three Months Ended May 31, 2018
• | Net revenues from our other business category totaled $3.8 million for the three months ended May 31, 2018, a decrease of $88.9 million compared with net income of $92.7 million for the three months ended May 31, 2017, as results in the prior year quarter included a net gain of $95.8 million from our investment in KCG, which was sold in July 2017, partially offset by foreign currency gains. |
Six Months Ended May 31, 2018
• | Net revenues from our other business category totaled $13.6 million for the six months ended May 31, 2018, a decrease of $72.9 million compared with net income of $86.5 million for the six months ended May 31, 2017, as results in the prior year period included a net gain of $91.2 million from our investment in KCG, which was sold in July 2017, partially offset by foreign currency gains. |
Asset Management
Asset management revenue includes the following:
• | management and performance fees from funds and accounts managed by us; and |
• | investment income from capital invested in and managed by our asset management business. |
The key components of asset management revenues are the level of assets under management and the performance return, whether on an absolute basis or relative to a benchmark or hurdle. These components can be affected by financial markets, profits and losses in the applicable investment portfolios and client capital activity. Further, asset management fees vary with the nature of investment management services. The terms under which clients may terminate our investment management authority, and the requisite notice period for such termination, varies depending on the nature of the investment vehicle and the liquidity of the portfolio assets.
The following summarizes the results of our Asset Management businesses by asset class (dollars in thousands):
Three Months Ended May 31, | % Change | Six Months Ended May 31, | % Change | ||||||||||||||||||
2018 | 2017 | 2018 | 2017 | ||||||||||||||||||
Asset management fees: | |||||||||||||||||||||
Equities | $ | 334 | $ | 1,282 | (73.9 | )% | $ | 1,323 | $ | 2,462 | (46.3 | )% | |||||||||
Multi-asset | 5,682 | 2,833 | 100.6 | % | 9,623 | 8,460 | 13.7 | % | |||||||||||||
Total asset management fees | 6,016 | 4,115 | 46.2 | % | 10,946 | 10,922 | 0.2 | % | |||||||||||||
Investment return | 11,279 | (3,420 | ) | N/M | 15,194 | 2,635 | 476.6 | % | |||||||||||||
Total Asset Management | $ | 17,295 | $ | 695 | N/M | $ | 26,140 | $ | 13,557 | 92.8 | % | ||||||||||
N/M — Not Meaningful
Assets under Management
Period end assets under management by predominant asset class were as follows (in millions):
May 31, 2018 | November 30, 2017 | ||||||
Assets under management (1): | |||||||
Equities | $ | 134 | $ | 218 | |||
Multi-asset | 1,367 | 1,271 | |||||
Total | $ | 1,501 | $ | 1,489 | |||
(1) | Assets under management include assets actively managed by us, including hedge funds and certain managed accounts. Assets under management do not include the assets of funds that are consolidated due to the level or nature of our investment in such funds. |
69
JEFFERIES GROUP LLC AND SUBSIDIARIES
Non-interest Expenses
• | The increase in non-compensation expenses was essentially due to an increase in Business development expenses and Underwriting costs, as a result of applying the new revenue standard to our results of operations for the three and six months ended May 31, 2018. Refer to “Impact of Adopting Revenue Recognition Guidance” herein and Note 2, Summary of Significant Accounting Policies, and Note 3, Accounting Developments, in our consolidated financial statements included in this Quarterly Report on Form 10-Q, for further details on the new revenue standard. |
Non-interest expenses were as follows (dollars in thousands):
Three Months Ended May 31, | % Change | Six Months Ended May 31, | % Change | ||||||||||||||||||
2018 | 2017 | 2018 | 2017 | ||||||||||||||||||
Compensation and benefits | $ | 444,094 | $ | 450,522 | (1.4 | )% | $ | 899,727 | $ | 910,694 | (1.2 | )% | |||||||||
Non-compensation expenses: | |||||||||||||||||||||
Floor brokerage and clearing fees | 46,244 | 47,494 | (2.6 | )% | 90,063 | 93,352 | (3.5 | )% | |||||||||||||
Underwriting costs | 13,029 | — | N/M | 27,304 | — | N/M | |||||||||||||||
Technology and communications | 76,381 | 67,478 | 13.2 | % | 145,458 | 132,985 | 9.4 | % | |||||||||||||
Occupancy and equipment rental | 24,993 | 23,594 | 5.9 | % | 49,584 | 49,409 | 0.4 | % | |||||||||||||
Business development | 42,393 | 26,466 | 60.2 | % | 84,500 | 49,098 | 72.1 | % | |||||||||||||
Professional services | 35,991 | 26,413 | 36.3 | % | 66,399 | 58,537 | 13.4 | % | |||||||||||||
Other | 17,567 | 21,146 | (16.9 | )% | 36,165 | 40,352 | (10.4 | )% | |||||||||||||
Total non-compensation expenses | 256,598 | 212,591 | 20.7 | % | 499,473 | 423,733 | 17.9 | % | |||||||||||||
Total non-interest expenses | $ | 700,692 | $ | 663,113 | 5.7 | % | $ | 1,399,200 | $ | 1,334,427 | 4.9 | % | |||||||||
N/M — Not Meaningful
Compensation and Benefits
• | Compensation and benefits expense consists of salaries, benefits, cash bonuses, commissions, annual cash compensation awards and the amortization of share-based and cash compensation awards to employees. |
• | Cash and historical share-based awards and a portion of cash awards granted to employees as part of year end compensation generally contain provisions such that employees who terminate their employment or are terminated without cause may continue to vest in their awards, so long as those awards are not forfeited as a result of other forfeiture provisions (primarily non-compete clauses) of those awards. Accordingly, the compensation expense for a portion of awards granted at year end as part of annual compensation is recorded in the year of the award. |
• | Included in Compensation and benefits expense are share-based amortization expense for senior executive awards granted in February 2016, January 2017 and January 2018, cash-based amortization expense for senior executive awards granted in January 2018, non-annual share-based and cash-based awards to other employees and certain year end awards that contain future service requirements for vesting, all of which are being amortized over their respective future service periods. In addition, the senior executive awards contain market and performance conditions. |
• | Compensation and benefits expense was $444.1 million and $899.7 million and for the three and six months ended May 31, 2018, respectively, compared with $450.5 million and $910.7 million for the three and six months ended May 31, 2017, respectively. |
• | Compensation and benefits expense as a percentage of Net revenues was 54.0% and 54.7% for the three and six months ended May 31, 2018, respectively, compared with 57.8% for both the three and six months ended May 31, 2017. |
• | Compensation expense related to the amortization of share- and cash-based awards amounted to $61.9 million and $137.6 million for the three and six months ended May 31, 2018, respectively, compared with $67.3 million and $134.8 million for three and six months ended May 31, 2017, respectively. |
• | Employee headcount was 3,438 at May 31, 2018 and 3,324 at May 31, 2017. Since May 31, 2017, our headcount increased, primarily as a result of continued hiring in investment banking, as well as additions in asset management and corporate services. |
70
JEFFERIES GROUP LLC AND SUBSIDIARIES
• | Refer to Note 14, Compensation Plans in our consolidated financial statements included in this Quarterly Report on Form 10-Q, for further details on compensation and benefits. |
Non-Compensation Expenses
• | The increase in non-compensation expenses was essentially due to an increase in Business development expenses and Underwriting costs, as a result of applying the new revenue standard to our results of operations for the three and six months ended May 31, 2018. Refer to “Impact of Adopting Revenue Recognition Guidance” herein and Note 2, Summary of Significant Accounting Policies and Note 3, Accounting Developments in our consolidated financial statements included in this Quarterly Report on Form 10-Q, for further details on the new revenue standard. |
Three Months Ended May 31, 2018
• | Non-compensation expenses were $256.6 million for the three months ended May 31, 2018, an increase of $44.0 million, or 20.7%, compared with $212.6 million in the three months ended May 31, 2017. The increase in non-compensation expenses was primarily due to a $31.0 million increase in Business development expenses and Underwriting costs, as a result of applying the new revenue standard to our results of operations for the three months ended May 31, 2018. Refer to “Impact of Adopting Revenue Recognition Guidance” herein and Note 2, Summary of Significant Accounting Policies, and Note 3, Accounting Developments, in our consolidated financial statements included in this Quarterly Report on Form 10-Q, for further details on the new revenue standard. |
• | Non-compensation expenses as a percentage of Net revenues was 31.2% and 27.3% for three months ended May 31, 2018 and 2017, respectively. |
Six Months Ended May 31, 2018
• | Non-compensation expenses were $499.5 million for the six months ended May 31, 2018, an increase of $75.8 million, or 17.9%, compared with $423.7 million in the six months ended May 31, 2017. The increase in non-compensation expenses was primarily due to a $62.5 million increase in Business development expenses and Underwriting costs, as a result of applying the new revenue standard to our results of operations for the six months ended May 31, 2018. Refer to “Impact of Adopting Revenue Recognition Guidance” herein and Note 2, Summary of Significant Accounting Policies, and Note 3, Accounting Developments, in our consolidated financial statements included in this Quarterly Report on Form 10-Q, for further details on the new revenue standard. |
• | Non-compensation expenses as a percentage of Net revenues was 30.4% and 26.9% for the six months ended May 31, 2018 and 2017, respectively. |
Income Taxes
On December 22, 2017, the Tax Cuts and Jobs Act (the "Tax Act") was enacted. The Tax Act is one of the most comprehensive changes in the U.S. corporate income tax since 1986 and certain provisions are complex in their application. In addition, on December 22, 2017, the SEC staff issued Staff Accounting Bulletin No. 118 (“SAB 118”), which provides guidance on accounting for the tax effects of the Tax Act. Refer to Note 15, Income Taxes, in our consolidated financial statements included in this Quarterly Report on Form 10-Q, for further details on the Tax Act and SAB 118.
The following provides a discussion of our provision for income taxes:
• | For the three and six months ended May 31, 2018, the provision for income taxes was $23.9 million and $207.4 million, respectively, equating to an effective tax rate of 19.6% and 84.8%, respectively. For the three and six months ended May 31, 2017, the provision for income taxes was $46.4 million and $56.6 million, respectively, equating to an effective tax rate of 39.9% and 23.5%, respectively. |
• | The decrease in the effective tax rate for the three months ended May 31, 2018, as compared with the prior year quarter is primarily due to a lower tax rate due to the decrease in the Federal statutory tax rate from 35% to 21%. The increase in the effective tax rate during the six months ended May 31, 2018, as compared with the prior year period is primarily due to the $160.5 million provisional tax charge related to the enactment of the Tax Act recorded in the six months ended May 31, 2018, as well as net tax benefits arising from the repatriation of foreign earnings and their associated foreign tax credits from foreign subsidiaries, which occurred during last year’s first quarter. Excluding this charge, plus an unrelated net tax benefit of $10.8 million during the current six month period, which primarily resulted from the expiration of certain federal and state statutes of limitation, our adjusted annual effective tax rate would have been approximately 24.2%. |
• | Refer to Note 15, Income Taxes, in our consolidated financial statements included in this Quarterly Report on Form 10-Q, for further details on income taxes. |
71
JEFFERIES GROUP LLC AND SUBSIDIARIES
Accounting Developments
For a discussion of recently issued accounting developments and their impact on our consolidated financial statements, see Note 3, Accounting Developments, in our consolidated financial statements included in this Quarterly Report on Form 10-Q.
Critical Accounting Policies
Our consolidated financial statements are prepared in conformity with U.S. GAAP, which requires management to make estimates and assumptions that affect the amounts reported in our consolidated financial statements and related notes. Actual results can and may differ from estimates. These differences could be material to our consolidated financial statements.
We believe our application of U.S. GAAP and the associated estimates are reasonable. Our accounting estimates are reevaluated, and adjustments are made when facts and circumstances dictate a change. Historically, we have found our application of accounting policies to be appropriate, and actual results have not differed materially from those determined using necessary estimates.
We believe our critical accounting policies (policies that are both material to the financial condition and results of operations and require our most subjective or complex judgments) are our valuation of certain financial instruments and assessment of goodwill.
For further discussions of the following significant accounting policies and other significant accounting policies, see Note 2, Summary of Significant Accounting Policies, in our consolidated financial statements included in Part II, Item 8 of our Annual Report on Form 10-K for the year ended November 30, 2017 and Note 2, Summary of Significant Accounting Policies, in our consolidated financial statements included in this Quarterly Report on Form 10-Q.
Valuation of Financial Instruments
Financial instruments owned and Financial instruments sold, not yet purchased are recorded at fair value. The fair value of a financial instrument is the amount that would be received to sell an asset or paid to transfer a liability in an orderly transaction between market participants at the measurement date (the exit price). Unrealized gains or losses are generally recognized in Principal transaction revenues in our Consolidated Statements of Earnings.
For information on the composition of our financial instruments owned and financial instruments sold, not yet purchased recorded at fair value, see Note 4, Fair Value Disclosures, in our consolidated financial statements included in this Quarterly Report on Form 10-Q.
Fair Value Hierarchy – In determining fair value, we maximize the use of observable inputs and minimize the use of unobservable inputs by requiring that observable inputs be used when available. Observable inputs are inputs that market participants would use in pricing the asset or liability based on market data obtained from independent sources. Unobservable inputs reflect our assumptions that market participants would use in pricing the asset or liability developed based on the best information available in the circumstances. We apply a hierarchy to categorize our fair value measurements broken down into three levels based on the transparency of inputs, where Level 1 uses observable prices in active markets and Level 3 uses valuation techniques that incorporate significant unobservable inputs. Greater use of management judgment is required in determining fair value when inputs are less observable or unobservable in the marketplace, such as when the volume or level of trading activity for a financial instrument has decreased and when certain factors suggest that observed transactions may not be reflective of orderly market transactions. Judgment must be applied in determining the appropriateness of available prices, particularly in assessing whether available data reflects current prices and/or reflects the results of recent market transactions. Prices or quotes are weighed when estimating fair value with greater reliability placed on information from transactions that are considered to be representative of orderly market transactions.
Fair value is a market based measure; therefore, when market observable inputs are not available, our judgment is applied to reflect those judgments that a market participant would use in valuing the same asset or liability. The availability of observable inputs can vary for different products. We use prices and inputs that are current as of the measurement date even in periods of market disruption or illiquidity. The valuation of financial instruments classified in Level 3 of the fair value hierarchy involves the greatest extent of management judgment. (See Note 2, Summary of Significant Accounting Policies, in our consolidated financial statements included in Part II, Item 8 of our Annual Report on Form 10-K for the year ended November 30, 2017 and Note 4, Fair Value Disclosures, in our consolidated financial statements included in this Quarterly Report on Form 10-Q for further information on the definitions of fair value, Level 1, Level 2 and Level 3 and related valuation techniques.)
Level 3 Assets and Liabilities – For information on the composition and activity of our Level 3 assets and Level 3 liabilities, see Note 4, Fair Value Disclosures, in our consolidated financial statements included in this Quarterly Report on Form 10-Q.
72
JEFFERIES GROUP LLC AND SUBSIDIARIES
Controls Over the Valuation Process for Financial Instruments – Our Independent Price Verification Group, independent of the trading function, plays an important role in determining that our financial instruments are appropriately valued and that fair value measurements are reliable. This is particularly important where prices or valuations that require inputs are less observable. In the event that observable inputs are not available, the control processes are designed to assure that the valuation approach utilized is appropriate and consistently applied and that the assumptions are reasonable. Where a pricing model is used to determine fair value, these control processes include reviews of the pricing model’s theoretical soundness and appropriateness by risk management personnel with relevant expertise who are independent from the trading desks. In addition, recently executed comparable transactions and other observable market data are considered for purposes of validating assumptions underlying the model.
Goodwill
At May 31, 2018, goodwill recorded in our Consolidated Statement of Financial Condition is $1,645.5 million (4.0% of total assets). The nature and accounting for goodwill is discussed in Note 2, Summary of Significant Accounting Policies, in our consolidated financial statements included in Part II, Item 8 of our Annual Report on Form 10-K for the year ended November 30, 2017 and Note 10, Goodwill and Intangible Assets, in our consolidated financial statements included in this Quarterly Report on Form 10-Q. Goodwill must be allocated to reporting units and tested for impairment at least annually, or when circumstances or events make it more likely than not that an impairment occurred. Goodwill is tested by comparing the estimated fair value of each reporting unit with its carrying value. Our annual goodwill impairment testing date is August 1, which did not indicate any goodwill impairment in any of our reporting units at August 1, 2017.
We use allocated tangible equity plus allocated goodwill and intangible assets for the carrying amount of each reporting unit. The amount of tangible equity allocated to a reporting unit is based on our cash capital model deployed in managing our businesses, which seeks to approximate the capital a business would require if it were operating independently. For further information on our Cash Capital Policy, refer to the Liquidity, Financial Condition and Capital Resources section herein. Intangible assets are allocated to a reporting unit based on either specifically identifying a particular intangible asset as pertaining to a reporting unit or, if shared among reporting units, based on an assessment of the reporting unit’s benefit from the intangible asset in order to generate results.
Estimating the fair value of a reporting unit requires management judgment and often involves the use of estimates and assumptions that could have a significant effect on whether or not an impairment charge is recorded and the magnitude of such a charge. Estimated fair values for our reporting units utilize market valuation methods that incorporate price-to-earnings and price-to-book multiples of comparable public companies. Under the market approach, the key assumptions are the selected multiples and our internally developed forecasts of future profitability, growth and return on equity for each reporting unit. The weight assigned to the multiples requires judgment in qualitatively and quantitatively evaluating the size, profitability and the nature of the business activities of the reporting units as compared to the comparable publicly-traded companies. In addition, as the fair values determined under the market approach represent a noncontrolling interest, we apply a control premium to arrive at the estimate fair value of each reporting unit on a controlling basis.
The carrying values of goodwill by reporting unit at May 31, 2018 are as follows: $564.9 million in Investment Banking, $160.4 million in Equities and Wealth Management, $917.2 million in Fixed Income and $3.0 million in Strategic Investments.
The results of our assessment on August 1, 2017 indicated that all our reporting units had a fair value in excess of their carrying amounts based on current projections. The valuation methodology for our reporting units are sensitive to management’s forecasts of future profitability, which comes with a level of uncertainty regarding trading volumes and capital market transaction levels. Reductions in trading volumes and/or declines from our expected level of performance in certain product areas assumed in our forecasts could cause a decline in the estimated fair value of our Equities reporting unit and a resulting impairment of a portion of our goodwill.
Refer to Note 10, Goodwill and Intangible Assets, in our consolidated financial statements included in this Quarterly Report on Form 10-Q, for further details on goodwill.
73
JEFFERIES GROUP LLC AND SUBSIDIARIES
Liquidity, Financial Condition and Capital Resources
Our Chief Financial Officer and Global Treasurer are responsible for developing and implementing our liquidity, funding and capital management strategies. These policies are determined by the nature and needs of our day to day business operations, business opportunities, regulatory obligations, and liquidity requirements.
Our actual levels of capital, total assets and financial leverage are a function of a number of factors, including asset composition, business initiatives and opportunities, regulatory requirements and cost and availability of both long term and short term funding. We have historically maintained a balance sheet consisting of a large portion of our total assets in cash and liquid marketable securities, arising principally from traditional securities brokerage and trading activity. The liquid nature of these assets provides us with flexibility in financing and managing our business.
Our Balance Sheet
A business unit level balance sheet and cash capital analysis is prepared and reviewed with senior management on a weekly basis. As a part of this balance sheet review process, capital is allocated to all assets and gross balance sheet limits are adjusted, as necessary. This process ensures that the allocation of capital and costs of capital are incorporated into business decisions. The goals of this process are to protect the firm’s platform, enable our businesses to remain competitive, maintain the ability to manage capital proactively and hold businesses accountable for both balance sheet and capital usage.
We actively monitor and evaluate our financial condition and the composition of our assets and liabilities. We continually monitor our overall securities inventory, including the inventory turnover rate, which confirms the liquidity of our overall assets. Substantially all of our financial instruments are valued on a daily basis and we monitor and employ balance sheet limits for our various businesses.
The following table provides detail on key balance sheet asset and liability line items (dollars in millions):
May 31, 2018 | November 30, 2017 | % Change | ||||||||
Total assets | $ | 41,123.5 | $ | 39,705.7 | 3.6 | % | ||||
Cash and cash equivalents | 4,579.9 | 5,164.5 | (11.3 | )% | ||||||
Cash and securities segregated and on deposit for regulatory purposes or deposited with clearing and depository organizations | 709.6 | 578.0 | 22.8 | % | ||||||
Financial instruments owned | 15,705.7 | 14,193.4 | 10.7 | % | ||||||
Financial instruments sold, not yet purchased | 8,914.9 | 8,171.9 | 9.1 | % | ||||||
Total Level 3 assets | 337.3 | 327.7 | 2.9 | % | ||||||
Securities borrowed | $ | 7,599.0 | $ | 7,721.8 | (1.6 | )% | ||||
Securities purchased under agreements to resell | 3,822.2 | 3,689.6 | 3.6 | % | ||||||
Total securities borrowed and securities purchased under agreements to resell | $ | 11,421.2 | $ | 11,411.4 | 0.1 | % | ||||
Securities loaned | $ | 2,555.7 | $ | 2,843.9 | (10.1 | )% | ||||
Securities sold under agreements to repurchase | 8,773.5 | 8,660.5 | 1.3 | % | ||||||
Total securities loaned and securities sold under agreements to repurchase | $ | 11,329.2 | $ | 11,504.4 | (1.5 | )% | ||||
Total assets at May 31, 2018 and November 30, 2017 were $41.1 billion and $39.7 billion, respectively, an increase of 3.6%. During the three and six months ended May 31, 2018, average total assets were approximately 20.4% and 19.9% higher, respectively, than total assets at May 31, 2018.
Our total Financial instruments owned inventory at May 31, 2018 was $15.7 billion, an increase of 10.7% from inventory of $14.2 billion at November 30, 2017, primarily due to increases in mortgage- and asset-backed securities and government and federal agency obligations, partially offset by a decrease in corporate debt securities. Financial instruments sold, not yet purchased inventory was $8.9 billion and $8.2 billion at May 31, 2018 and November 30, 2017, respectively, with the increase primarily driven by sovereign obligations, government and federal agency obligations and derivative contracts inventory. Our overall net inventory position was $6.8 billion and $6.0 billion at May 31, 2018 and November 30, 2017, respectively. Our Level 3 financial instruments owned as a percentage of total financial instruments owned declined to 2.1% at May 31, 2018 from 2.3% at November 30, 2017.
74
JEFFERIES GROUP LLC AND SUBSIDIARIES
Securities financing assets and liabilities include financing for our financial instruments trading activity, matched book transactions and mortgage finance transactions. Matched book transactions accommodate customers, as well as obtain securities for the settlement and financing of inventory positions. The aggregate outstanding balance of our securities borrowed and securities purchased under agreements to resell remained flat from November 30, 2017 to May 31, 2018, primarily due to an increase in firm financing of our short inventory and a decrease in the netting benefit for our collateralized financing transactions, partially offset by a decrease in our matched book activity. The outstanding balance of our securities loaned and securities sold under agreement to repurchase decreased by 1.5% from November 30, 2017 to May 31, 2018, primarily due to a decrease in our matched book activity, partially offset by a decrease in the netting benefit for our collateralized financing transactions. Our average month end balances of total reverse repos and stock borrows during the three and six months ended May 31, 2018 were 32.8% and 31.2% higher, respectively, than the May 31, 2018 balances. Our average month end balances of total repos and stock loans during the three and six months ended May 31, 2018 were 36.8% and 37.5% higher, respectively, than the May 31, 2018 balances.
The following table presents our period end balance, average balance and maximum balance at any month end within the periods presented for Securities purchased under agreements to resell and Securities sold under agreements to repurchase (dollars in millions):
Six Months Ended May 31, 2018 | Year Ended November 30, 2017 | ||||||
Securities Purchased Under Agreements to Resell: | |||||||
Period end | $ | 3,822 | $ | 3,690 | |||
Month end average | 5,470 | 6,195 | |||||
Maximum month end | 7,593 | 7,814 | |||||
Securities Sold Under Agreements to Repurchase: | |||||||
Period end | $ | 8,774 | $ | 8,661 | |||
Month end average | 12,735 | 11,273 | |||||
Maximum month end | 15,579 | 13,679 | |||||
Fluctuations in the balance of our repurchase agreements from period to period and intraperiod are dependent on business activity in those periods. Additionally, the fluctuations in the balances of our securities purchased under agreements to resell over the periods presented are influenced in any given period by our clients’ balances and our clients’ desires to execute collateralized financing arrangements via the repurchase market or via other financing products. Average balances and period end balances will fluctuate based on market and liquidity conditions and we consider the fluctuations intraperiod to be typical for the repurchase market.
Leverage Ratios
The following table presents total assets, total equity, total Jefferies Group LLC member’s equity and tangible Jefferies Group LLC member’s equity with the resulting leverage ratios (dollars in thousands):
May 31, 2018 | November 30, 2017 | |||||||
Total assets | $ | 41,123,471 | $ | 39,705,691 | ||||
Total equity | $ | 5,543,631 | $ | 5,759,559 | ||||
Total Jefferies Group LLC member’s equity | $ | 5,542,881 | $ | 5,758,822 | ||||
Deduct: | Goodwill and intangible assets | (1,834,922 | ) | (1,842,882 | ) | |||
Tangible Jefferies Group LLC member’s equity | $ | 3,707,959 | $ | 3,915,940 | ||||
Leverage ratio (1) | 7.4 | 6.9 | ||||||
Tangible gross leverage ratio (2) | 10.6 | 9.7 | ||||||
(1) | Leverage ratio equals total assets divided by total equity. |
(2) | Tangible gross leverage ratio (a non-GAAP financial measure) equals total assets less goodwill and identifiable intangible assets divided by tangible Jefferies Group LLC member’s equity. The tangible gross leverage ratio is used by rating agencies in assessing our leverage ratio. |
75
JEFFERIES GROUP LLC AND SUBSIDIARIES
Liquidity Management
The key objectives of the liquidity management framework are to support the successful execution of our business strategies while ensuring sufficient liquidity through the business cycle and during periods of financial distress. Our liquidity management policies are designed to mitigate the potential risk that we may be unable to access adequate financing to service our financial obligations without material franchise or business impact.
The principal elements of our liquidity management framework are our Contingency Funding Plan, our Cash Capital Policy and our assessment of Maximum Liquidity Outflow.
Contingency Funding Plan. Our Contingency Funding Plan is based on a model of a potential liquidity contraction over a one year time period. This incorporates potential cash outflows during a liquidity stress event, including, but not limited to, the following:
• | Repayment of all unsecured debt maturing within one year and no incremental unsecured debt issuance; |
• | Maturity rolloff of outstanding letters of credit with no further issuance and replacement with cash collateral; |
• | Higher margin requirements than currently exist on assets on securities financing activity, including repurchase agreements; |
• | Liquidity outflows related to possible credit downgrade; |
• | Lower availability of secured funding; |
• | Client cash withdrawals; |
• | The anticipated funding of outstanding investment and loan commitments; and |
• | Certain accrued expenses and other liabilities and fixed costs. |
Cash Capital Policy. We maintain a cash capital model that measures long-term funding sources against requirements. Sources of cash capital include our equity and the noncurrent portion of long-term borrowings. Uses of cash capital include the following:
• | Illiquid assets such as equipment, goodwill, net intangible assets, exchange memberships, deferred tax assets and certain investments; |
• | A portion of securities inventory that is not expected to be financed on a secured basis in a credit stressed environment (i.e., margin requirements); and |
• | Drawdowns of unfunded commitments. |
To ensure that we do not need to liquidate inventory in the event of a funding crisis, we seek to maintain surplus cash capital, which is reflected in the leverage ratios we maintain. Our total long-term capital of $12.0 billion at May 31, 2018 exceeded our cash capital requirements.
Maximum Liquidity Outflow. Our businesses are diverse, and our liquidity needs are determined by many factors, including market movements, collateral requirements and client commitments, all of which can change dramatically in a difficult funding environment. During a liquidity crisis, credit-sensitive funding, including unsecured debt and some types of secured financing agreements, may be unavailable, and the terms (e.g., interest rates, collateral provisions and tenor) or availability of other types of secured financing may change. As a result of our policy to ensure we have sufficient funds to cover what we estimate may be needed in a liquidity crisis, we hold more cash and unencumbered securities and have greater long-term debt balances than our businesses would otherwise require. As part of this estimation process, we calculate a Maximum Liquidity Outflow that could be experienced in a liquidity crisis. Maximum Liquidity Outflow is based on a scenario that includes both a market-wide stress and firm-specific stress, characterized by some or all of the following elements:
• | Global recession, default by a medium-sized sovereign, low consumer and corporate confidence, and general financial instability. |
• | Severely challenged market environment with material declines in equity markets and widening of credit spreads. |
• | Damaging follow-on impacts to financial institutions leading to the failure of a large bank. |
• | A firm-specific crisis potentially triggered by material losses, reputational damage, litigation, executive departure, and/or a ratings downgrade. |
The following are the critical modeling parameters of the Maximum Liquidity Outflow:
• | Liquidity needs over a 30-day scenario. |
• | A two-notch downgrade of our long-term senior unsecured credit ratings. |
76
JEFFERIES GROUP LLC AND SUBSIDIARIES
• | No support from government funding facilities. |
• | A combination of contractual outflows, such as upcoming maturities of unsecured debt, and contingent outflows (e.g., actions though not contractually required, we may deem necessary in a crisis). We assume that most contingent outflows will occur within the initial days and weeks of a crisis. |
• | No diversification benefit across liquidity risks. We assume that liquidity risks are additive. |
The calculation of our Maximum Liquidity Outflow under the above stresses and modeling parameters considers the following potential contractual and contingent cash and collateral outflows:
• | All upcoming maturities of unsecured long-term debt, commercial paper, promissory notes and other unsecured funding products assuming we will be unable to issue new unsecured debt or rollover any maturing debt. |
• | Repurchases of our outstanding long-term debt in the ordinary course of business as a market maker. |
• | A portion of upcoming contractual maturities of secured funding trades due to either the inability to refinance or the ability to refinance only at wider haircuts (i.e., on terms which require us to post additional collateral). Our assumptions reflect, among other factors, the quality of the underlying collateral and counterparty concentration. |
• | Collateral postings to counterparties due to adverse changes in the value of our over-the-counter (“OTC”) derivatives and other outflows due to trade terminations, collateral substitutions, collateral disputes, collateral calls or termination payments required by a two-notch downgrade in our credit ratings. |
• | Variation margin postings required due to adverse changes in the value of our outstanding exchange-traded derivatives and any increase in initial margin and guarantee fund requirements by derivative clearing houses. |
• | Liquidity outflows associated with our prime services business, including withdrawals of customer credit balances, and a reduction in customer short positions. |
• | Liquidity outflows to clearing banks to ensure timely settlements of cash and securities transactions. |
• | Draws on our unfunded commitments considering, among other things, the type of commitment and counterparty. |
• | Other upcoming large cash outflows, such as tax payments. |
Based on the sources and uses of liquidity calculated under the Maximum Liquidity Outflow scenarios, we determine, based on a calculated surplus or deficit, additional long-term funding that may be needed versus funding through the repurchase financing market and consider any adjustments that may be necessary to our inventory balances and cash holdings. At May 31, 2018, we had sufficient excess liquidity to meet all contingent cash outflows detailed in the Maximum Liquidity Outflow. We regularly refine our model to reflect changes in market or economic conditions and our business mix.
As a result of the Tax Cuts and Jobs Act enacted in December 2017, we incurred a one-time charge which was paid on April 30, 2018 to Jefferies under our tax sharing agreement of approximately $52.0 million due to the tax on the deemed repatriation of undistributed foreign earnings.
77
JEFFERIES GROUP LLC AND SUBSIDIARIES
Sources of Liquidity
The following are financial instruments that are cash and cash equivalents or are deemed by management to be generally readily convertible into cash, marginable or accessible for liquidity purposes within a relatively short period of time (dollars in thousands):
May 31, 2018 | Average Balance Quarter ended May 31, 2018 (1) | November 30, 2017 | |||||||||
Cash and cash equivalents: | |||||||||||
Cash in banks | $ | 2,191,141 | $ | 2,362,348 | $ | 2,244,207 | |||||
Money market investments | 2,388,790 | 1,473,341 | 2,920,285 | ||||||||
Total cash and cash equivalents | 4,579,931 | 3,835,689 | 5,164,492 | ||||||||
Other sources of liquidity: | |||||||||||
Debt securities owned and securities purchased under agreements to resell (2) | 940,374 | 914,819 | 1,031,252 | ||||||||
Other (3) | 360,842 | 492,922 | 513,293 | ||||||||
Total other sources | 1,301,216 | 1,407,741 | 1,544,545 | ||||||||
Total cash and cash equivalents and other liquidity sources | $ | 5,881,147 | $ | 5,243,430 | $ | 6,709,037 | |||||
Total cash and cash equivalents and other liquidity sources as % of Total assets | 14.3 | % | 16.9 | % | |||||||
Total cash and cash equivalents and other liquidity sources as % of Total assets less goodwill and intangible assets | 15.0 | % | 17.7 | % | |||||||
(1) | Average balances are calculated based on weekly balances. |
(2) | Consists of high quality sovereign government securities and reverse repurchase agreements collateralized by U.S. government securities and other high quality sovereign government securities; deposits with a central bank within the European Economic Area, Canada, Australia, Japan, Switzerland or the USA; and securities issued by a designated multilateral development bank and reverse repurchase agreements with underlying collateral comprised of these securities. |
(3) | Other includes unencumbered inventory representing an estimate of the amount of additional secured financing that could be reasonably expected to be obtained from our financial instruments owned that are currently not pledged after considering reasonable financing haircuts. |
In addition to the cash balances and liquidity pool presented above, the majority of financial instruments (both long and short) in our trading accounts are actively traded and readily marketable. At May 31, 2018, we had the ability to readily obtain repurchase financing for 79.9% of our inventory at haircuts of 10% or less, which reflects the liquidity of our inventory. In addition, as a matter of our policy, all of these assets have internal capital assessed, which is in addition to the funding haircuts provided in the securities finance markets. Additionally, certain of our Financial instruments owned primarily consisting of bank loans, consumer loans and investments are predominantly funded by long term capital. Under our cash capital policy, we model capital allocation levels that are more stringent than the haircuts used in the market for secured funding; and we maintain surplus capital at these more stringent levels. We continually assess the liquidity of our inventory based on the level at which we could obtain financing in the market place for a given asset. Assets are considered to be liquid if financing can be obtained in the repurchase market or the securities lending market at collateral haircut levels of 10% or less. The following summarizes our financial instruments by asset class that we consider to be of a liquid nature and the amount of such assets that have not been pledged as collateral at May 31, 2018 and November 30, 2017 (in thousands):
78
JEFFERIES GROUP LLC AND SUBSIDIARIES
May 31, 2018 | November 30, 2017 | ||||||||||||||
Liquid Financial Instruments | Unencumbered Liquid Financial Instruments (2) | Liquid Financial Instruments | Unencumbered Liquid Financial Instruments (2) | ||||||||||||
Corporate equity securities | $ | 1,644,030 | $ | 218,548 | $ | 1,718,617 | $ | 272,380 | |||||||
Corporate debt securities | 2,643,298 | 127,353 | 2,475,291 | 57,290 | |||||||||||
U.S. government, agency and municipal securities | 2,752,626 | 150,705 | 1,954,697 | 185,481 | |||||||||||
Other sovereign obligations | 2,326,809 | 804,334 | 2,050,942 | 996,421 | |||||||||||
Agency mortgage-backed securities (1) | 2,921,338 | — | 1,742,977 | — | |||||||||||
Loans and other receivables | 261,127 | — | 243,664 | — | |||||||||||
Total | $ | 12,549,228 | $ | 1,300,940 | $ | 10,186,188 | $ | 1,511,572 | |||||||
(1) | Consists solely of agency mortgage-backed securities issued by Freddie Mac, Fannie Mae and Ginnie Mae. These securities include pass-through securities, securities backed by adjustable rate mortgages (“ARMs”), collateralized mortgage obligations, commercial mortgage-backed securities and interest- and principal-only securities. |
(2) | Unencumbered liquid balances represent assets that can be sold or used as collateral for a loan, but have not been. |
Average liquid financial instruments were $14.2 billion and $14.3 billion for the three and six months ended May 31, 2018, respectively, and $11.8 billion and $11.9 billion for the three and twelve months ended November 30, 2017, respectively. Average unencumbered liquid financial instruments were $1.4 billion and $1.5 billion for the three and six months ended May 31, 2018, respectively, and $1.5 billion and $1.6 billion for the three and twelve months ended November 30, 2017, respectively.
In addition to being able to be readily financed at modest haircut levels, we estimate that each of the individual securities within each asset class above could be sold into the market and converted into cash within three business days under normal market conditions, assuming that the entire portfolio of a given asset class was not simultaneously liquidated. There are no restrictions on the unencumbered liquid securities, nor have they been pledged as collateral.
Sources of Funding and Capital Resources
Our assets are funded by equity capital, senior debt, convertible debt, securities loaned, securities sold under agreements to repurchase, customer free credit balances, bank loans and other payables.
Secured Financing
We rely principally on readily available secured funding to finance our inventory of financial instruments. Our ability to support increases in total assets is largely a function of our ability to obtain short and intermediate-term secured funding, primarily through securities financing transactions. We finance a portion of our long inventory and cover some of our short inventory by pledging and borrowing securities in the form of repurchase or reverse repurchase agreements (collectively “repos”), respectively. Approximately 66.4% of our cash and non-cash repurchase financing activities use collateral that is considered eligible collateral by central clearing corporations. Central clearing corporations are situated between participating members who borrow cash and lend securities (or vice versa); accordingly repo participants contract with the central clearing corporation and not one another individually. Therefore, counterparty credit risk is borne by the central clearing corporation which mitigates the risk through initial margin demands and variation margin calls from repo participants. The comparatively large proportion of our total repo activity that is eligible for central clearing reflects the high quality and liquid composition of the inventory we carry in our trading books. For those asset classes not eligible for central clearing house financing, we seek to execute our bi-lateral financings on an extended term basis and the tenor of our repurchase and reverse repurchase agreements generally exceeds the expected holding period of the assets we are financing. The weighted average maturity of cash and non-cash repurchase agreements for non-clearing corporation eligible funded inventory is approximately four months at May 31, 2018.
Our ability to finance our inventory via central clearinghouses and bi-lateral arrangements is augmented by our ability to draw bank loans on an uncommitted basis under our various banking arrangements. At May 31, 2018, short-term borrowings, which must be repaid within one year or less and include bank loans and overdrafts, borrowings under revolving credit facilities and structured notes totaled $506.2 million. Interest under the bank lines is generally at a spread over the federal funds rate. Letters of credit are used in the normal course of business mostly to satisfy various collateral requirements in favor of exchanges in lieu of depositing cash or securities. Average daily short-term borrowings outstanding were $584.7 million and $536.9 million for the three and six months ended May 31, 2018.
79
JEFFERIES GROUP LLC AND SUBSIDIARIES
Our short-term borrowings include the following facility:
• | Intraday Credit Facility. The Bank of New York Mellon has agreed to make revolving intraday credit advances (“Intraday Credit Facility”) for an aggregate committed amount of $150.0 million. The Intraday Credit Facility contains financial covenants, which includes a minimum regulatory net capital requirement for our U.S. broker-dealer, Jefferies LLC. Interest is based on the higher of the Federal funds effective rate plus 0.5% or the prime rate. During the six months ended May 31, 2018, we were in compliance with all debt covenants under the Intraday Credit Facility. |
For additional details on our short-term borrowings, refer to Note 11, Short-Term Borrowings, in our consolidated financial statements included in this Quarterly Report on Form 10-Q.
In addition to the above financing arrangements, we issue notes backed by eligible collateral under a master repurchase agreement, which provides an additional financing source for our inventory (our “repurchase agreement financing program”). The notes issued under the program are presented within Other secured financings in our Consolidated Statements of Financial Condition. At May 31, 2018, the outstanding notes were $968.8 million and are as follows:
Series | Issued | Principal | Maturity | |||
2015-2 (1) (2) | May 12, 2015 | $152.5 million | July 15, 2019 | |||
2017-2 (1) (3) | July 27, 2017 | $101.3 million | July 24, 2018 | |||
2017-3 (1) | August 15, 2017 | $75.0 million | July 24, 2018 | |||
2017-4 (1) (3) | September 7, 2017 | $75.0 million | August 24, 2018 | |||
2017-5 (1) (3) | September 15, 2017 | $50.0 million | August 24, 2018 | |||
2017-6 (1) (4) | October 13, 2017 | $60.0 million | November 26, 2018 | |||
2017-7 (1) (4) | October 20, 2017 | $100.0 million | November 26, 2018 | |||
2018-1 (1) (4) | February 12, 2018 | $80.0 million | April 24, 2019 | |||
2018-2 (1) | March 29, 2018 | $150.0 million | March 24, 2019 | |||
2018-3 (1) | May 11, 2018 | $75.0 million | July 24, 2019 | |||
2018-CL1 (1) | May 29, 2018 | $50.0 million | July 15, 2019 | |||
(1) | These notes bear interest at a spread over the one month London Interbank Offered Rate (“LIBOR”). |
(2) | This note is redeemable at the option of the noteholders. |
(3) | These notes are redeemable at our option and at the option of the noteholders. |
(4) | These notes are redeemable at our option. |
For additional details on our repurchase agreement financing program, refer to Note 8, Variable Interest Entities, in our consolidated financial statements included in this Quarterly Report on Form 10-Q.
Total Long-Term Capital
At May 31, 2018 and November 30, 2017, we had total long-term capital of $12.0 billion and $11.2 billion, respectively, resulting in a long-term debt to equity capital ratio of 1.16:1 and 0.94:1, respectively. Our total long-term capital base at May 31, 2018 and November 30, 2017 was as follows (in thousands):
May 31, 2018 | November 30, 2017 | ||||||
Long-Term Debt (1) | $ | 6,427,688 | $ | 5,402,590 | |||
Total Equity | 5,543,631 | 5,759,559 | |||||
Total Long-Term Capital | $ | 11,971,319 | $ | 11,162,149 | |||
(1) | Long-term debt at May 31, 2018 excludes $5.9 million of our structured notes, as these notes mature on February 26, 2019 and $158.3 million of our outstanding borrowings under our senior secured revolving credit facility. Long-term debt at November 30, 2017 excludes $7.1 million of our structured notes, as these notes matured on May 4, 2018, $324.8 million of our 3.875% convertible debentures due 2029 (principal amount of $345.0 million) (the “debentures”), as these debentures were redeemable beginning on November 1, 2017, and $682.3 million of our 5.125% senior notes, as these notes matured on April 13, 2018. The $324.8 million of our convertible debentures were redeemed on January 5, 2018. Refer to Note 12, Long-Term Debt, in our consolidated financial statements included in this Quarterly Report on Form 10-Q for further details on these notes. |
80
JEFFERIES GROUP LLC AND SUBSIDIARIES
On January 11, 2018, our Board of Directors approved a distribution to our sole limited liability company member, Jefferies Financial Group Inc. (“Jefferies”), in the amount of $200.0 million, which was paid on January 31, 2018, and reduced our total equity. In addition, our Board of Directors approved a quarterly distribution policy authorizing us to pay a quarterly distribution to our limited liability company members following the end of each of our fiscal quarters. Beginning at the end of our fiscal quarter ending February 28, 2018 and on a quarterly basis thereafter, we will pay our limited liability company members a quarterly dividend equal to 50% of our positive Net earnings attributable to Jefferies Group LLC (as adjusted for preceding loss quarters, if any). Our results at May 31, 2018, include a dividend payable in the amount of $18.6 million.
Long-Term Debt
During the six months ended May 31, 2018, long-term debt increased $175.1 million. This amount includes the issuance of 4.150% senior notes with a total principal amount of $1.0 billion, due 2030 on January 23, 2018. Additionally, structured notes with a total principal amount of approximately $165.6 million, net of retirements were issued during the period. Certain of our structured notes contain various interest rate payment terms and are accounted for at fair value, with changes in fair value resulting from a change in the instrument-specific credit risk presented in other comprehensive income and changes in fair value resulting from non-credit components recognized in Principal transaction revenues. The fair value of all of our structured notes accounted for at fair value at May 31, 2018 was $708.3 million. For further information, see Note 12, Long-Term Debt, in our consolidated financial statements included in this Quarterly Report on Form 10-Q.
On November 22, 2017, all of our remaining convertible debentures ($324.8 million at November 30, 2017) were called for optional redemption, with a redemption date of January 5, 2018, at a redemption price equal to 100% of the principal amount of the convertible debentures redeemed, plus accrued and unpaid interest to, but excluding, the redemption date. All of these remaining convertible debentures were redeemed on January 5, 2018. In addition, our 5.125% senior notes with a principal of $668.3 million were redeemed in April 2018 with cash on hand. For further information, see Note 12, Long-Term Debt, and Note 19, Related Party Transactions, in our consolidated financial statements included in this Quarterly Report on Form 10-Q.
On May 16, 2018, we entered into a senior secured revolving credit facility (“Revolving Credit Facility”) with a group of commercial banks for an aggregate principal amount of at $160.0 million. The borrower under the Revolving Credit Facility is Jefferies Leveraged Credit Products, LLC, with a guarantee from Jefferies Group LLC. At May 31, 2018, borrowings under the Revolving Credit Facility amounted to $158.3 million. Interest is based on an annual alternative base rate or an adjusted LIBOR, as defined in the Revolving Credit Facility agreement. The Credit Facility contains certain covenants that, among other things, imposes restrictions on the future indebtedness of Jefferies Leveraged Credit Products, LLC, requires Jefferies Group LLC to maintain specified level of tangible net worth and liquidity amounts, and requires certain of our subsidiaries to maintain specified levels of regulated capital. Throughout the period and at May 31, 2018, no instances of noncompliance with the Revolving Credit Facility covenants occurred and we expect to remain in compliance given our current liquidity, and anticipated funding requirements given our business plan and profitability expectations. For further information, see Note 12, Long-Term Debt, in our consolidated financial statements included in this Quarterly Report on Form 10-Q.
At May 31, 2018, our long-term debt has a weighted average maturity of approximately 9.0 years.
Our long-term debt ratings at May 31, 2018 are as follows:
Rating | Outlook | ||
Moody’s Investors Service (1) | Baa3 | Stable | |
Standard and Poor’s | BBB- | Stable | |
Fitch Ratings (2) | BBB | Stable | |
(1) | On March 20, 2018, Moody’s Investors Services reaffirmed our long-term debt rating of Baa3 and our rating outlook of stable. |
(2) | On February 13, 2018, Fitch Ratings upgraded our long-term debt rating from BBB- to BBB and reaffirmed our rating outlook of stable. |
At May 31, 2018, the long-term ratings on our principal operating broker-dealers, Jefferies LLC and Jefferies International Limited (a U.K. broker-dealer) are as follows:
Jefferies LLC | Jefferies International Limited | ||||||
Rating | Outlook | Rating | Outlook | ||||
Moody’s Investors Service (1) | Baa2 | Stable | Baa2 | Stable | |||
Standard and Poor’s | BBB | Stable | BBB | Stable | |||
81
JEFFERIES GROUP LLC AND SUBSIDIARIES
(1) | On January 10, 2018, Moody’s Investors Services reaffirmed our long-term debt rating of Baa2 and our rating outlook of stable. |
Access to external financing to finance our day to day operations, as well as the cost of that financing, is dependent upon various factors, including our debt ratings. Our current debt ratings are dependent upon many factors, including industry dynamics, operating and economic environment, operating results, operating margins, earnings trend and volatility, balance sheet composition, liquidity and liquidity management, our capital structure, our overall risk management, business diversification and our market share and competitive position in the markets in which we operate. Deteriorations in any of these factors could impact our credit ratings. While certain aspects of a credit rating downgrade are quantifiable pursuant to contractual provisions, the impact on our business and trading results in future periods is inherently uncertain and depends on a number of factors, including the magnitude of the downgrade, the behavior of individual clients and future mitigating action taken by us.
In connection with certain over-the-counter derivative contract arrangements and certain other trading arrangements, we may be required to provide additional collateral to counterparties, exchanges and clearing organizations in the event of a credit rating downgrade. At May 31, 2018, the amount of additional collateral that could be called by counterparties, exchanges and clearing organizations under the terms of such agreements in the event of a downgrade of our long-term credit rating below investment grade was $58.6 million. For certain foreign clearing organizations, credit rating is only one of several factors employed in determining collateral that could be called. The above represents management’s best estimate for additional collateral to be called in the event of credit rating downgrade. The impact of additional collateral requirements is considered in our Contingency Funding Plan and calculation of Maximum Liquidity Outflow, as described above.
Equity Capital
As compared to November 30, 2017, the decrease to total Jefferies Group LLC member’s equity at May 31, 2018 is primarily attributed to dividend distributions to Jefferies and foreign currency translation adjustments, partially offset by net earnings during the six months ended May 31, 2018.
Net Capital
As a broker-dealer registered with the SEC and member firms of the Financial Industry Regulatory Authority (“FINRA”), Jefferies LLC is subject to the Securities and Exchange Commission Uniform Net Capital Rule (“Rule 15c3-1”), which requires the maintenance of minimum net capital, and has elected to calculate minimum capital requirements using the alternative method permitted by Rule 15c3-1 in calculating net capital. Jefferies LLC, as a dually-registered U.S. broker-dealer and futures commission merchant (“FCM”), is also subject to Rule 1.17 of the Commodity Futures Trading Commission (“CFTC”), which sets forth minimum financial requirements. The minimum net capital requirement in determining excess net capital for a dually-registered U.S. broker-dealer and FCM is equal to the greater of the requirement under Rule 15c3-1 or CFTC Rule 1.17.
At May 31, 2018, Jefferies LLC’s net capital and excess net capital were as follows (in thousands):
Net Capital | Excess Net Capital | ||||||
Jefferies LLC | $ | 1,666,879 | $ | 1,560,669 | |||
FINRA is the designated examining authority for our U.S. broker-dealer and the National Futures Association is the designated self-regulatory organization for Jefferies LLC as an FCM.
Certain other U.S. and non-U.S. subsidiaries are subject to capital adequacy requirements as prescribed by the regulatory authorities in their respective jurisdictions, including Jefferies International Limited which is subject to the regulatory supervision and requirements of the Financial Conduct Authority in the United Kingdom. The Dodd-Frank Wall Street Reform and Consumer Protection Act (the “Dodd-Frank Act”) was signed into law on July 21, 2010. The Dodd-Frank Act contains provisions that require the registration of all swap dealers, major swap participants, security-based swap dealers, and/or major security-based swap participants. While entities that register under these provisions will be subject to regulatory capital requirements, these regulatory capital requirements have not yet been finalized. We expect that these provisions will result in modifications to the regulatory capital requirements of some of our entities, and will result in some of our other entities becoming subject to regulatory capital requirements for the first time, including Jefferies Financial Services, Inc., which registered as a swap dealer with the CFTC during January 2013 and Jefferies Financial Products LLC, which registered during August 2014.
The regulatory capital requirements referred to above may restrict our ability to withdraw capital from our regulated subsidiaries.
82
JEFFERIES GROUP LLC AND SUBSIDIARIES
Off-Balance Sheet Arrangements and Contractual Obligations
Off-Balance Sheet Arrangements
We have contractual commitments arising in the ordinary course of business for securities loaned or purchased under agreements to resell, repurchase agreements, future purchases and sales of foreign currencies, securities transactions on a when-issued basis and underwriting. Each of these financial instruments and activities contains varying degrees of off-balance sheet risk whereby the fair values of the securities underlying the financial instruments may be in excess of, or less than, the contract amount. The settlement of these transactions is not expected to have a material effect upon our consolidated financial statements.
In the normal course of business we engage in other off balance sheet arrangements, including derivative contracts. Neither derivatives’ notional amounts nor underlying instrument values are reflected as assets or liabilities in our Consolidated Statements of Financial Condition. Rather, the fair values of derivative contracts are reported in our Consolidated Statements of Financial Condition as Financial instruments owned or Financial instruments sold, not yet purchased as applicable. Derivative contracts are reflected net of cash paid or received pursuant to credit support agreements and are reported on a net by counterparty basis when a legal right of offset exists under an enforceable master netting agreement. For additional information about our accounting policies and our derivative activities, see Note 2, Summary of Significant Accounting Policies; Note 4, Fair Value Disclosures; and Note 5, Derivative Financial Instruments, in our consolidated financial statements included in this Quarterly Report on Form 10-Q.
We are routinely involved with variable interest entities (“VIEs”) in the normal course of business. At May 31, 2018, we did not have any commitments to purchase assets from these VIEs. For additional information regarding our involvement with VIEs, see Note 7, Securitization Activities, and Note 8, Variable Interest Entities, in our consolidated financial statements included in this Quarterly Report on Form 10-Q.
Due to the uncertainty regarding the timing and amounts that will ultimately be paid, our liability for unrecognized tax benefits has been excluded from the below contractual obligations table. See Note 15, Income Taxes, in our consolidated financial statements included in this Quarterly Report on Form 10-Q for further information for further information.
For information on our commitments and guarantees, see Note 16, Commitments, Contingencies and Guarantees, in our consolidated financial statements included in this Quarterly Report on Form 10-Q.
Contractual Obligations
The table below provides information about our contractual obligations at May 31, 2018. The table presents principal cash flows with expected maturity dates (in millions):
Expected Maturity Date | |||||||||||||||||||||||
2018 | 2019 | 2020 and 2021 | 2022 and 2023 | 2024 and Later | Total | ||||||||||||||||||
Debt obligations: | |||||||||||||||||||||||
Unsecured long-term debt (contractual principal payments net of unamortized discounts and premiums) (1) | $ | — | $ | 720.3 | $ | 1,383.7 | $ | 643.3 | $ | 3,686.3 | $ | 6,433.6 | |||||||||||
Interest payment obligations on long-term debt (2) | 175.7 | 325.4 | 529.6 | 406.0 | 1,574.7 | 3,011.4 | |||||||||||||||||
Total | $ | 175.7 | $ | 1,045.7 | $ | 1,913.3 | $ | 1,049.3 | $ | 5,261.0 | $ | 9,445.0 | |||||||||||
(1) | For additional information on long-term debt, see Note 12, Long-Term Debt, in our consolidated financial statements included in this Quarterly Report on Form 10-Q. |
(2) | Amounts based on applicable interest rates at May 31, 2018. |
83
JEFFERIES GROUP LLC AND SUBSIDIARIES
Risk Management
Overview
Risk is an inherent part of our business and activities. The extent to which we properly and effectively identify, assess, monitor and manage each of the various types of risk involved in our activities is critical to our financial soundness, viability and profitability. Accordingly, we have a comprehensive risk management approach, with a formal governance structure and processes to identify, assess, monitor and manage risk. Principal risks involved in our business activities include market, credit, liquidity and capital, operational, legal and compliance, new business and reputational risk.
Risk management is a multifaceted process that requires communication, judgment and knowledge of financial products and markets. Accordingly, our risk management process encompasses the active involvement of executive and senior management, and also many departments independent of the revenue-producing business units, including the Risk Management, Operations, Compliance, Legal and Finance Departments. Our risk management policies, procedures and methodologies are fluid in nature and are subject to ongoing review and modification.
For discussion of liquidity and capital risk management, refer to the “Liquidity, Financial Condition and Capital Resources” section herein.
Governance and Risk Management Structure
For a discussion of our governance and risk management structure, see “Management’s Discussion and Analysis of Financial Condition and Results of Operations—Risk Management” in Part II, Item 7 of our Annual Report on Form 10-K for the year ended November 30, 2017.
Risk Management Key Metrics
We apply a comprehensive framework of limits on a variety of key metrics to constrain the risk profile of our business activities. The size of the limit reflects our risk tolerance for a certain activity under normal business conditions. Key metrics included in our framework include inventory position and exposure limits on a gross and net basis, scenario analysis and stress tests, Value-at-Risk, sensitivities (greeks), exposure concentrations, aged inventory, amount of Level 3 assets, counterparty exposure, leverage, cash capital and performance analysis metrics.
Market Risk
The potential for changes in the value of financial instruments is referred to as market risk. Our market risk generally represents the risk of loss that may result from a change in the value of a financial instrument as a result of fluctuations in interest rates, credit spreads, equity prices, commodity prices and foreign exchange rates, along with the level of volatility. Interest rate risks result primarily from exposure to changes in the yield curve, the volatility of interest rates and credit spreads. Equity price risks result from exposure to changes in prices and volatilities of individual equities, equity baskets and equity indices. Commodity price risks result from exposure to the changes in prices and volatilities of individual commodities, commodity baskets and commodity indices. Market risk arises from market making, proprietary trading, underwriting, specialist and investing activities. We seek to manage our exposure to market risk by diversifying exposures, controlling position sizes and establishing economic hedges in related securities or derivatives. Due to imperfections in correlations, gains and losses can occur even for positions that are hedged. Position limits in trading and inventory accounts are established and monitored on an ongoing basis. Each day, consolidated position and exposure reports are prepared and distributed to various levels of management, which enable management to monitor inventory levels and results of the trading groups.
Value-at-Risk
We estimate Value-at-Risk (“VaR”) using a model that simulates revenue and loss distributions on our trading portfolios by applying historical market changes to the current portfolio. Using the results of this simulation, VaR measures the potential loss in value of our financial instruments due to adverse market movements over a specified time horizon at a given confidence level. We calculate a one-day VaR using a one year look-back period measured at a 95% confidence level.
As with all measures of VaR, our estimate has inherent limitations due to the assumption that historical changes in market conditions are representative of the future. Furthermore, the VaR model measures the risk of a current static position over a one-day horizon and might not capture the market risk of positions that cannot be liquidated or offset with hedges in a one-day period. Published VaR results reflect past trading positions while future risk depends on future positions.
While we believe the assumptions and inputs in our risk model are reasonable, we could incur losses greater than the reported VaR because the historical market prices and rates changes may not be an accurate measure of future market events and conditions. Consequently, this VaR estimate is only one of a number of tools we use in our daily risk management activities.
84
JEFFERIES GROUP LLC AND SUBSIDIARIES
When comparing our VaR numbers to those of other firms, it is important to remember that different methodologies and assumptions could produce significantly different results.
Our average daily VaR increased to $6.78 million for the three months ended May 31, 2018 from $6.30 million for the three months ended February 28, 2018, primarily driven by higher market volatility causing an increase in equity price risk. This increase was partially offset by a decrease in interest rate risk and a lower diversification benefit.
The following table illustrates each separate component of VaR for each component of market risk by interest rate, equity, currency and commodity products, as well as for our overall trading positions using the past 365 days of historical data (in millions):
Daily VaR (1) Value-at-Risk in Trading Portfolios | |||||||||||||||||||||||||||||||
VaR at May 31, 2018 | VaR at February 28, 2018 | ||||||||||||||||||||||||||||||
Daily VaR for the Three Months Ended May 31, 2018 | Daily VaR for the Three Months Ended February 28, 2018 | ||||||||||||||||||||||||||||||
Risk Categories | Average | High | Low | Average | High | Low | |||||||||||||||||||||||||
Interest Rates | $ | 4.24 | $ | 4.64 | $ | 5.76 | $ | 3.56 | $ | 4.36 | $ | 4.97 | $ | 6.82 | $ | 3.24 | |||||||||||||||
Equity Prices | 3.31 | 4.82 | 8.05 | 3.25 | 4.70 | 4.23 | 6.23 | 3.08 | |||||||||||||||||||||||
Currency Rates | 0.13 | 0.11 | 0.17 | 0.04 | 0.07 | 0.14 | 0.24 | 0.02 | |||||||||||||||||||||||
Commodity Prices | 0.86 | 0.50 | 0.73 | 0.29 | 0.36 | 0.41 | 0.95 | 0.26 | |||||||||||||||||||||||
Diversification Effect (2) | (3.33 | ) | (3.29 | ) | N/A | N/A | (3.27 | ) | (3.45 | ) | N/A | N/A | |||||||||||||||||||
Firmwide | $ | 5.21 | $ | 6.78 | $ | 10.32 | $ | 5.21 | $ | 6.22 | $ | 6.30 | $ | 7.58 | $ | 4.76 | |||||||||||||||
(1) | For the VaR numbers reported above, a one-day time horizon, with a one year look-back period, and a 95% confidence level were used. |
(2) | The diversification effect is not applicable for the maximum and minimum VaR values as the firmwide VaR and the VaR values for the four risk categories might have occurred on different days during the period. |
The aggregated VaR presented here is less than the sum of the individual components (i.e., interest rate risk, foreign exchange rate risk, equity risk and commodity price risk) due to the benefit of diversification among the four risk categories. Diversification benefit equals the difference between aggregated VaR and the sum of VaRs for the four risk categories and arises because the market risk categories are not perfectly correlated.
The chart below reflects our daily VaR over the last four quarters:
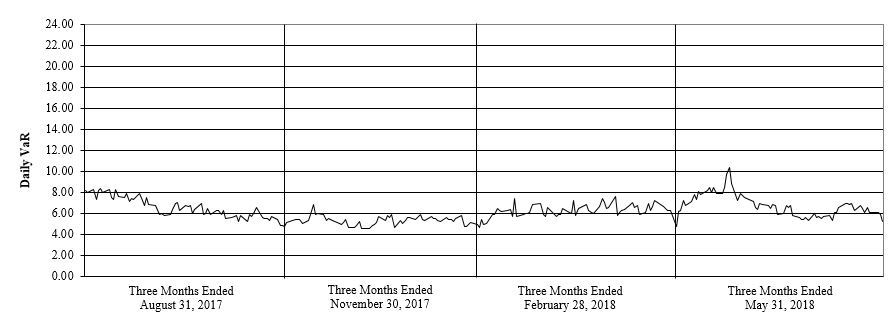
85
JEFFERIES GROUP LLC AND SUBSIDIARIES
The primary method used to test the efficacy of the VaR model is to compare our actual daily net revenue for those positions included in our VaR calculation with the daily VaR estimate. This evaluation is performed at various levels of the trading portfolio, from the holding company level down to specific business lines. For the VaR model, trading related revenue is defined as principal transaction revenue, trading related commissions, revenue from securitization activities and net interest income. For a 95% confidence one day VaR model (i.e., no intra-day trading), assuming current changes in market value are consistent with the historical changes used in the calculation, net trading losses would not be expected to exceed the VaR estimates more than twelve times on an annual basis (i.e., once in every 20 days). During the three months ended May 31, 2018, results of the evaluation at the aggregate level demonstrated one day when the net trading loss exceeded the 95% one day VaR.
Certain positions within financial instruments are not included in the VaR model because VaR is not the most appropriate measure of risk. Accordingly, Risk Management has additional procedures in place to assure that the level of potential loss that would arise from market movements are within acceptable levels. Such procedures include performing stress tests, monitoring concentration risk and tracking price target/stop loss levels. The table below presents the potential reduction in net income associated with a 10% stress of the fair value of the positions that are not included in the VaR model at May 31, 2018 (in thousands):
10% Sensitivity | |||
Private investments | $ | 16,372 | |
Corporate debt securities in default | 16,388 | ||
Trade claims | 3,165 | ||
VaR also excludes the impact of changes in our own credit spreads on our structured notes for which the fair value option was elected. The estimated credit spread risk sensitivity for each one basis point widening in our own credit spreads on financial liabilities for which the fair value option was elected was an increase in value of approximately $1.0 million at May 31, 2018, which is included in other comprehensive income.
Daily Net Trading Revenue
There were nine days with trading losses out of a total of 64 trading days in the three months ended May 31, 2018. The histogram below presents the distribution of our actual daily net trading revenue for substantially all of our trading activities for the three months ended May 31, 2018 (in millions).
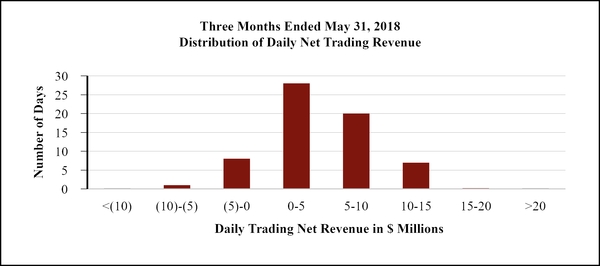
86
JEFFERIES GROUP LLC AND SUBSIDIARIES
Scenario Analysis and Stress Tests
While VaR measures potential losses due to adverse changes in historical market prices and rates, we use stress testing to analyze the potential impact of specific events or moderate or extreme market moves on our current portfolio both firm wide and within business segments. Stress scenarios comprise both historical market price and rate changes and hypothetical market environments, and generally involve simultaneous changes of many risk factors. Indicative market changes in our scenarios include, but are not limited to, a large widening of credit spreads, a substantial decline in equities markets, significant moves in selected emerging markets, large moves in interest rates, changes in the shape of the yield curve and large moves in European markets. In addition, we also perform ad hoc stress tests and add new scenarios as market conditions dictate. Because our stress scenarios are meant to reflect market moves that occur over a period of time, our estimates of potential loss assume some level of position reduction for liquid positions. Unlike our VaR, which measures potential losses within a given confidence interval, stress scenarios do not have an associated implied probability; rather, stress testing is used to estimate the potential loss from market moves that tend to be larger than those embedded in the VaR calculation.
Stress testing is performed and reported regularly as part of the risk management process. Stress testing is used to assess our aggregate risk position as well as for limit setting and risk/reward analysis.
Counterparty Credit Risk and Issuer Country Exposure
Counterparty Credit Risk
Credit risk is the risk of loss due to adverse changes in a counterparty’s credit worthiness or its ability or willingness to meet its financial obligations in accordance with the terms and conditions of a financial contract. We are exposed to credit risk as a trading counterparty to other broker-dealers and customers, as a direct lender and through extending loan commitments, as a holder of securities and as a member of exchanges and clearing organizations.
It is critical to our financial soundness and profitability that we properly and effectively identify, assess, monitor, and manage the various credit and counterparty risks inherent in our businesses. Credit is extended to counterparties in a controlled manner in order to generate acceptable returns, whether such credit is granted directly or is incidental to a transaction. All extensions of credit are monitored and managed on an enterprise level in order to limit exposure to loss related to credit risk.
Our Credit Risk Framework is responsible for identifying credit risks throughout the operating businesses, establishing counterparty limits and managing and monitoring those credit limits. Our framework includes:
• | Defining credit limit guidelines and credit limit approval processes; |
• | Providing a consistent and integrated credit risk framework across the enterprise; |
• | Approving counterparties and counterparty limits with parameters set by the Risk Management Committee; |
• | Negotiating, approving and monitoring credit terms in legal and master documentation; |
• | Delivering credit limits to all relevant sales and trading desks; |
• | Maintaining credit reviews for all active and new counterparties; |
• | Operating a control function for exposure analytics and exception management and reporting; |
• | Determining the analytical standards and risk parameters for on-going management and monitoring of global credit risk books; |
• | Actively managing daily exposure, exceptions, and breaches; |
• | Monitoring daily margin call activity and counterparty performance (in concert with the Margin Department); and |
• | Setting the minimum global requirements for systems, reports, and technology. |
Credit Exposures
Credit exposure exists across a wide-range of products including cash and cash equivalents, loans, securities finance transactions and over-the-counter derivative contracts.
• | Loans and lending, arising in connection with our capital markets activities and forward settling traded loans; |
• | Securities and margin finance, which represents securities financing transactions (reverse repurchase agreements, repurchase agreements and securities lending agreements); |
87
JEFFERIES GROUP LLC AND SUBSIDIARIES
• | OTC derivatives, which are reported net by counterparty when a legal right of setoff exists under an enforceable master netting agreement, and includes forward settling trades; and |
• | Cash and cash equivalents, which includes both interest-bearing and non-interest bearing deposits at banks. |
Current counterparty credit exposures at May 31, 2018 and November 30, 2017 are summarized in the tables below and provided by credit quality, region and industry (in millions). Credit exposures presented take netting and collateral into consideration by counterparty and master agreement. Collateral taken into consideration includes both collateral received as cash as well as collateral received in the form of securities or other arrangements. Current exposure is the loss that would be incurred on a particular set of positions in the event of default by the counterparty, assuming no recovery. Current exposure equals the fair value of the positions less collateral. Issuer risk is the credit risk arising from inventory positions (for example, corporate debt securities and secondary bank loans). Issuer risk is included in our country risk exposure tables below. Of our counterparty credit exposure at May 31, 2018, excluding cash and cash equivalents, the percentage of investment grade counterparties decreased to 91% from 92% when compared to November 30, 2017, with a majority concentrated in North America.
When comparing our credit exposure at May 31, 2018 with credit exposure at November 30, 2017, excluding cash and cash equivalents, current exposure decreased to approximately $1,303 million from $1,353 million. Counterparty credit exposure from securities and margin finance decreased by 6%, primarily driven by investment grade European banks and broker-dealers, and exposure from loans and lending decreased by 9%, while exposure from OTC derivatives increased by 6% during the period.
88
JEFFERIES GROUP LLC AND SUBSIDIARIES
Counterparty Credit Exposure by Credit Rating | |||||||||||||||||||||||||||||||||||||||||||||||
Loans and Lending | Securities and Margin Finance | OTC Derivatives | Total | Cash and Cash Equivalents | Total with Cash and Cash Equivalents | ||||||||||||||||||||||||||||||||||||||||||
At | At | At | At | At | At | ||||||||||||||||||||||||||||||||||||||||||
May 31, 2018 | November 30, 2017 | May 31, 2018 | November 30, 2017 | May 31, 2018 | November 30, 2017 | May 31, 2018 | November 30, 2017 | May 31, 2018 | November 30, 2017 | May 31, 2018 | November 30, 2017 | ||||||||||||||||||||||||||||||||||||
AAA Range | $ | — | $ | — | $ | 3.5 | $ | 6.4 | $ | — | $ | — | $ | 3.5 | $ | 6.4 | $ | 2,391.0 | $ | 2,924.2 | $ | 2,394.5 | $ | 2,930.6 | |||||||||||||||||||||||
AA Range | 45.0 | 47.7 | 50.6 | 61.3 | 2.5 | 3.8 | 98.1 | 112.8 | 122.1 | 158.6 | 220.2 | 271.4 | |||||||||||||||||||||||||||||||||||
A Range | 1.0 | 1.2 | 621.3 | 603.0 | 257.3 | 260.6 | 879.6 | 864.8 | 1,861.6 | 1,751.9 | 2,741.2 | 2,616.7 | |||||||||||||||||||||||||||||||||||
BBB Range | 0.3 | 0.5 | 160.7 | 232.5 | 48.2 | 28.5 | 209.2 | 261.5 | 26.6 | 152.3 | 235.8 | 413.8 | |||||||||||||||||||||||||||||||||||
BB or Lower | 9.3 | 12.5 | 17.3 | 8.1 | 21.3 | 16.7 | 47.9 | 37.3 | 101.4 | 100.6 | 149.3 | 137.9 | |||||||||||||||||||||||||||||||||||
Unrated | 64.6 | 70.1 | — | — | — | — | 64.6 | 70.1 | 77.2 | 76.9 | 141.8 | 147.0 | |||||||||||||||||||||||||||||||||||
Total | $ | 120.2 | $ | 132.0 | $ | 853.4 | $ | 911.3 | $ | 329.3 | $ | 309.6 | $ | 1,302.9 | $ | 1,352.9 | $ | 4,579.9 | $ | 5,164.5 | $ | 5,882.8 | $ | 6,517.4 | |||||||||||||||||||||||
Counterparty Credit Exposure by Region | |||||||||||||||||||||||||||||||||||||||||||||||
Loans and Lending | Securities and Margin Finance | OTC Derivatives | Total | Cash and Cash Equivalents | Total with Cash and Cash Equivalents | ||||||||||||||||||||||||||||||||||||||||||
At | At | At | At | At | At | ||||||||||||||||||||||||||||||||||||||||||
May 31, 2018 | November 30, 2017 | May 31, 2018 | November 30, 2017 | May 31, 2018 | November 30, 2017 | May 31, 2018 | November 30, 2017 | May 31, 2018 | November 30, 2017 | May 31, 2018 | November 30, 2017 | ||||||||||||||||||||||||||||||||||||
Asia/Latin America/Other | $ | — | $ | 3.0 | $ | 40.5 | $ | 45.8 | $ | 0.2 | $ | 0.3 | $ | 40.7 | $ | 49.1 | $ | 242.2 | $ | 280.7 | $ | 282.9 | $ | 329.8 | |||||||||||||||||||||||
Europe | 0.5 | 1.0 | 361.5 | 403.5 | 56.9 | 54.0 | 418.9 | 458.5 | 290.8 | 540.0 | 709.7 | 998.5 | |||||||||||||||||||||||||||||||||||
North America | 119.7 | 128.0 | 451.4 | 462.0 | 272.2 | 255.3 | 843.3 | 845.3 | 4,046.9 | 4,343.8 | 4,890.2 | 5,189.1 | |||||||||||||||||||||||||||||||||||
Total | $ | 120.2 | $ | 132.0 | $ | 853.4 | $ | 911.3 | $ | 329.3 | $ | 309.6 | $ | 1,302.9 | $ | 1,352.9 | $ | 4,579.9 | $ | 5,164.5 | $ | 5,882.8 | $ | 6,517.4 | |||||||||||||||||||||||
Counterparty Credit Exposure by Industry | |||||||||||||||||||||||||||||||||||||||||||||||
Loans and Lending | Securities and Margin Finance | OTC Derivatives | Total | Cash and Cash Equivalents | Total with Cash and Cash Equivalents | ||||||||||||||||||||||||||||||||||||||||||
At | At | At | At | At | At | ||||||||||||||||||||||||||||||||||||||||||
May 31, 2018 | November 30, 2017 | May 31, 2018 | November 30, 2017 | May 31, 2018 | November 30, 2017 | May 31, 2018 | November 30, 2017 | May 31, 2018 | November 30, 2017 | May 31, 2018 | November 30, 2017 | ||||||||||||||||||||||||||||||||||||
Asset Managers | $ | — | $ | — | $ | 6.7 | $ | 15.9 | $ | 0.3 | $ | 7.1 | $ | 7.0 | $ | 23.0 | $ | 2,438.8 | $ | 2,920.3 | $ | 2,445.8 | $ | 2,943.3 | |||||||||||||||||||||||
Banks, Broker-dealers | 0.8 | 1.7 | 565.4 | 620.8 | 307.3 | 282.6 | 873.5 | 905.1 | 2,141.1 | 2,244.2 | 3,014.6 | 3,149.3 | |||||||||||||||||||||||||||||||||||
Corporates | 99.8 | 87.5 | — | — | 12.8 | 14.7 | 112.6 | 102.2 | — | — | 112.6 | 102.2 | |||||||||||||||||||||||||||||||||||
Other | 19.6 | 42.8 | 281.3 | 274.6 | 8.9 | 5.2 | 309.8 | 322.6 | — | — | 309.8 | 322.6 | |||||||||||||||||||||||||||||||||||
Total | $ | 120.2 | $ | 132.0 | $ | 853.4 | $ | 911.3 | $ | 329.3 | $ | 309.6 | $ | 1,302.9 | $ | 1,352.9 | $ | 4,579.9 | $ | 5,164.5 | $ | 5,882.8 | $ | 6,517.4 | |||||||||||||||||||||||
For additional information regarding credit exposure to OTC derivative contracts, refer to Note 5, Derivative Financial Instruments, in our consolidated financial statements included in this Quarterly Report on Form 10-Q.
89
JEFFERIES GROUP LLC AND SUBSIDIARIES
Country Risk Exposure
Country risk is the risk that events or developments that occur in the general environment of a country or countries due to economic, political, social, regulatory, legal or other factors, will affect the ability of obligors of the country to honor their obligations. We define the country of risk as the country of jurisdiction or domicile of the obligor. The following tables reflect our top exposure at May 31, 2018 and November 30, 2017 to the sovereign governments, corporations and financial institutions in those non- U.S. countries in which we have a net long issuer and counterparty exposure (in millions):
May 31, 2018 | |||||||||||||||||||||||||||||||||||
Issuer Risk | Counterparty Risk | Issuer and Counterparty Risk | |||||||||||||||||||||||||||||||||
Fair Value of Long Debt Securities | Fair Value of Short Debt Securities | Net Derivative Notional Exposure | Loans and Lending | Securities and Margin Finance | OTC Derivatives | Cash and Cash Equivalents | Excluding Cash and Cash Equivalents | Including Cash and Cash Equivalents | |||||||||||||||||||||||||||
Germany | $ | 173.1 | $ | (469.7 | ) | $ | 656.4 | $ | — | $ | 84.1 | $ | 2.2 | $ | 89.3 | $ | 446.1 | $ | 535.4 | ||||||||||||||||
United Kingdom | 444.6 | (246.6 | ) | (37.9 | ) | 0.5 | 67.8 | 50.1 | 49.2 | 278.5 | 327.7 | ||||||||||||||||||||||||
Canada | 109.1 | (61.1 | ) | (80.9 | ) | — | 2.4 | 229.2 | 7.9 | 198.7 | 206.6 | ||||||||||||||||||||||||
Japan | 53.2 | (32.4 | ) | — | — | 20.1 | — | 126.1 | 40.9 | 167.0 | |||||||||||||||||||||||||
Belgium | 130.3 | (101.3 | ) | — | — | — | — | 104.0 | 29.0 | 133.0 | |||||||||||||||||||||||||
Italy | 1,167.5 | (998.8 | ) | (36.8 | ) | — | — | 0.5 | — | 132.4 | 132.4 | ||||||||||||||||||||||||
Austria | 175.5 | (54.7 | ) | — | — | — | — | — | 120.8 | 120.8 | |||||||||||||||||||||||||
Switzerland | 101.8 | (29.7 | ) | — | — | 25.6 | 2.7 | 3.7 | 100.4 | 104.1 | |||||||||||||||||||||||||
Brazil | 161.6 | (58.8 | ) | (0.2 | ) | — | — | — | 0.2 | 102.6 | 102.8 | ||||||||||||||||||||||||
Finland | 84.0 | (12.5 | ) | — | — | — | — | 0.6 | 71.5 | 72.1 | |||||||||||||||||||||||||
Total | $ | 2,600.7 | $ | (2,065.6 | ) | $ | 500.6 | $ | 0.5 | $ | 200.0 | $ | 284.7 | $ | 381.0 | $ | 1,520.9 | $ | 1,901.9 | ||||||||||||||||
November 30, 2017 | |||||||||||||||||||||||||||||||||||
Issuer Risk | Counterparty Risk | Issuer and Counterparty Risk | |||||||||||||||||||||||||||||||||
Fair Value of Long Debt Securities | Fair Value of Short Debt Securities | Net Derivative Notional Exposure | Loans and Lending | Securities and Margin Finance | OTC Derivatives | Cash and Cash Equivalents | Excluding Cash and Cash Equivalents | Including Cash and Cash Equivalents | |||||||||||||||||||||||||||
Germany | $ | 493.3 | $ | (396.2 | ) | $ | 98.2 | $ | — | $ | 78.9 | $ | 2.1 | $ | 181.9 | $ | 276.3 | $ | 458.2 | ||||||||||||||||
United Kingdom | 634.6 | (394.4 | ) | (72.1 | ) | 0.7 | 97.8 | 26.9 | 45.0 | 293.5 | 338.5 | ||||||||||||||||||||||||
Spain | 217.9 | (181.3 | ) | 7.5 | — | — | — | 151.6 | 44.1 | 195.7 | |||||||||||||||||||||||||
Japan | 100.1 | (81.3 | ) | 4.1 | — | 25.8 | — | 136.3 | 48.7 | 185.0 | |||||||||||||||||||||||||
Canada | 205.3 | (164.7 | ) | (128.5 | ) | — | 17.3 | 222.8 | 7.4 | 152.2 | 159.6 | ||||||||||||||||||||||||
Netherlands | 315.9 | (210.9 | ) | 0.9 | — | 44.1 | 2.2 | — | 152.2 | 152.2 | |||||||||||||||||||||||||
Switzerland | 31.0 | (16.9 | ) | (1.1 | ) | — | 54.3 | 3.3 | 4.5 | 70.6 | 75.1 | ||||||||||||||||||||||||
Hong Kong | 23.0 | (25.1 | ) | — | — | 1.0 | — | 58.7 | (1.1 | ) | 57.6 | ||||||||||||||||||||||||
Australia | 50.5 | (14.0 | ) | 0.3 | — | 15.0 | 0.3 | 4.7 | 52.1 | 56.8 | |||||||||||||||||||||||||
Singapore | 36.0 | (4.2 | ) | — | — | — | — | 24.7 | 31.8 | 56.5 | |||||||||||||||||||||||||
Total | $ | 2,107.6 | $ | (1,489.0 | ) | $ | (90.7 | ) | $ | 0.7 | $ | 334.2 | $ | 257.6 | $ | 614.8 | $ | 1,120.4 | $ | 1,735.2 | |||||||||||||||
Our net issuer and counterparty risk exposure to Puerto Rico of $16.6 million at May 31, 2018 is in connection with our municipal securities market-making activities. The government of Puerto Rico is seeking to restructure much of its $74.1 billion in debt on a voluntary basis. At May 31, 2018, we had no other material exposure to countries where either sovereign or non-sovereign sectors potentially pose potential default risk as the result of liquidity concerns.
Operational Risk
Operational risk refers to the risk of loss resulting from our operations, including, but not limited to, improper or unauthorized execution and processing of transactions, deficiencies in our operating systems, business disruptions and inadequacies or breaches in our internal control processes. Our businesses are highly dependent on our ability to process, on a daily basis, a large number of transactions across numerous and diverse markets in many currencies. In addition, the transactions we process have become increasingly complex. If our financial, accounting or other data processing systems do not operate properly or are disabled or if there are other shortcomings or failures in our internal processes, people or systems, we could suffer an impairment to our liquidity, financial loss, a disruption of our businesses, liability to clients, regulatory intervention or reputational damage.
90
JEFFERIES GROUP LLC AND SUBSIDIARIES
These systems may fail to operate properly or become disabled as a result of events that are wholly or partially beyond our control, including a disruption of electrical or communications services or our inability to occupy one or more of our buildings. The inability of our systems to accommodate an increasing volume of transactions could also constrain our ability to expand our businesses. We also face the risk of operational failure or termination of any of the clearing agents, exchanges, clearing houses or other financial intermediaries we use to facilitate our securities transactions. Any such failure or termination could adversely affect our ability to effect transactions and manage our exposure to risk. In addition, despite the contingency plans we have in place, our ability to conduct business may be adversely impacted by a disruption in the infrastructure that supports our businesses and the communities in which they are located. This may include a disruption involving electrical, communications, transportation or other services used by us or third parties with which we conduct business.
Our operations rely on the secure processing, storage and transmission of confidential and other information in our computer systems and networks. Although we take protective measures and endeavor to modify them as circumstances warrant, our computer systems, software and networks may be vulnerable to unauthorized access, computer viruses or other malicious code, and other events that could have a security impact. If one or more of such events occur, this potentially could jeopardize our or our clients’ or counterparties’ confidential and other information processed and stored in, and transmitted through, our computer systems and networks, or otherwise cause interruptions or malfunctions in our, our clients’, our counterparties’ or third parties’ operations. We may be required to expend significant additional resources to modify our protective measures or to investigate and remediate vulnerabilities or other exposures, and we may be subject to litigation and financial losses that are either not insured against or not fully covered through any insurance maintained by us.
Our Operational Risk framework includes governance, collection of operational risk incidents, proactive operational risk management, and periodic review and analysis of business metrics to identify and recommend controls and process-related enhancements.
Each revenue producing and support department is responsible for the management and reporting of operational risks and the implementation of the Operational Risk policy and processes within the department. Operational Risk policy, framework, infrastructure, methodology, processes, guidance and oversight of the operational risk processes are centralized and consistent firm wide and also subject to regional operational risk governance.
Legal and Compliance Risk
Legal and compliance risk includes the risk of noncompliance with applicable legal and regulatory requirements. We are subject to extensive regulation in the different jurisdictions in which we conduct our business. We have various procedures addressing issues such as regulatory capital requirements, sales and trading practices, use of and safekeeping of customer funds, credit granting, collection activities, anti-money laundering and record keeping. These risks also reflect the potential impact that changes in local and international laws and tax statutes have on the economics and viability of current or future transactions. In an effort to mitigate these risks, we continuously review new and pending regulations and legislation and participate in various industry interest groups. We also maintain an anonymous hotline for employees or others to report suspected inappropriate actions by us or by our employees or agents.
New Business Risk
New business risk refers to the risks of entering into a new line of business or offering a new product. By entering a new line of business or offering a new product, we may face risks that we are unaccustomed to dealing with and may increase the magnitude of the risks we currently face. The New Business Committee reviews proposals for new businesses and new products to determine if we are prepared to handle the additional or increased risks associated with entering into such activities.
Reputational Risk
We recognize that maintaining our reputation among clients, investors, regulators and the general public is an important aspect of minimizing legal and operational risks. Maintaining our reputation depends on a large number of factors, including the selection of our clients and the conduct of our business activities. We seek to maintain our reputation by screening potential clients and by conducting our business activities in accordance with high ethical standards. Our reputation and business activity can be affected by statements and actions of third parties, even false or misleading statements by them. We actively monitor public comment concerning us and are vigilant in seeking to assure accurate information and perception prevails.
91
JEFFERIES GROUP LLC AND SUBSIDIARIES
Item 3. Quantitative and Qualitative Disclosures About Market Risk.
Quantitative and qualitative disclosures about market risk are set forth under “Management’s Discussion and Analysis of Financial Condition and Results of Operations —Risk Management” in Part I, Item 2 of this Form 10-Q.
Item 4. Controls and Procedures.
Our Management, under the direction of our Chief Executive Officer and Chief Financial Officer, evaluated the effectiveness of our disclosure controls and procedures as of the end of the period covered by this report. Based on that evaluation, our Chief Executive Officer and Chief Financial Officer concluded that our disclosure controls and procedures are functioning effectively to provide reasonable assurance that the information required to be disclosed by us in reports filed under the Securities Exchange Act of 1934 is (i) recorded, processed, summarized and reported within the time periods specified in the SEC’s rules and forms and (ii) accumulated and communicated to our management, including our Chief Executive Officer and Chief Financial Officer, as appropriate, to allow timely decisions regarding disclosure. A controls system cannot provide absolute assurance that the objectives of the controls system are met, and no evaluation of controls can provide absolute assurance that all control issues and instances of fraud, if any, within a company have been detected.
No change in our internal control over financial reporting occurred during the quarter ended May 31, 2018 that has materially affected, or is reasonably likely to materially affect, our internal control over financial reporting.
92
JEFFERIES GROUP LLC AND SUBSIDIARIES
PART II. OTHER INFORMATION
Item 1. Legal Proceedings
Many aspects of our business involve substantial risks of legal and regulatory liability. In the normal course of business, we have been named as defendants or co-defendants in lawsuits involving primarily claims for damages. We are also involved in a number of judicial and regulatory matters, including exams, investigations and similar reviews, arising out of the conduct of our business. Based on currently available information, we do not believe that any matter will have a material adverse effect on our consolidated financial statements.
Item 1A. Risk Factors
Information regarding our risk factors appears in Item 1A. of our Annual Report on Form 10-K for the fiscal year ended November 30, 2017 filed with the SEC on January 26, 2018. These risk factors describe some of the assumptions, risks, uncertainties and other factors that could adversely affect our business or that could otherwise result in changes that differ materially from our expectations.
Item 2. Unregistered Sales of Equity Securities and Use of Proceeds
None.
Item 6. Exhibits
Exhibit No. | Description |
4 | Instruments defining the rights of holders of long-term debt securities of the Registrant and its subsidiaries are omitted pursuant to Item 601(b)(4)(iii) of Regulation S-K. Registrant hereby agrees to furnish copies of these instruments to the Commission upon request. |
12* | |
31.1* | |
31.2* | |
32* | |
101* | Interactive data files pursuant to Rule 405 of Regulation S-T: (i) the Consolidated Statements of Financial Condition as of May 31, 2018 and November 30, 2017; (ii) the Consolidated Statements of Earnings for the three and six months ended May 31, 2018 and 2017; (iii) the Consolidated Statements of Comprehensive Income for the three and six months ended May 31, 2018 and 2017; (iv) the Consolidated Statements of Changes in Equity for the six months ended May 31, 2018 and for the year ended November 30, 2017; (v) the Consolidated Statements of Cash Flows for the six months ended May 31, 2018 and 2017; and (vi) the Notes to Consolidated Financial Statements. |
* | Filed herewith. |
93
SIGNATURES
Pursuant to the requirements of the Securities Exchange Act of 1934, the registrant has duly caused this report to be signed on its behalf by the undersigned thereunto duly authorized.
JEFFERIES GROUP LLC (Registrant) | |||
Date: | July 9, 2018 | By: | /s/ Peregrine C. Broadbent |
Peregrine C. Broadbent Chief Financial Officer (duly authorized officer) | |||
94