Attached files
Table of Contents
As filed with the Securities and Exchange Commission on June 29, 2018
Registration Statement No. 333-
UNITED STATES
SECURITIES AND EXCHANGE COMMISSION
WASHINGTON, D.C. 20549
FORM S-1
REGISTRATION STATEMENT
UNDER
THE SECURITIES ACT OF 1933
TENABLE HOLDINGS, INC.
(Exact name of registrant as specified in its charter)
| Delaware | 7372 | 47-5580846 | ||
| (State or other jurisdiction of incorporation or organization) |
(Primary Standard Industrial Classification Code Number) |
(I.R.S. Employer Identification Number) |
7021 Columbia Gateway Drive, Suite 500
Columbia, Maryland 21046
(410) 872-0555
(Address, including zip code, and telephone number, including area code, of registrant’s principal executive offices)
Amit Y. Yoran
President and Chief Executive Officer
Tenable Holdings, Inc.
7021 Columbia Gateway Drive, Suite 500
Columbia, Maryland 21046
(410) 872-0555
(Name, address, including zip code, and telephone number, including area code, of agent for service)
Copies to:
| Eric Jensen Brian F. Leaf Madison A. Jones Cooley LLP 11951 Freedom Drive Reston, Virginia 20190 (703) 456-8000 |
Stephen A. Riddick General Counsel Columbia, Maryland 21046 (410) 872-0555 |
Michael C. Labriola Mark R. Fitzgerald Megan J. Baier Mark G.C. Bass Wilson Sonsini Goodrich & Rosati, P.C. 1700 K Street, NW, Fifth Floor Washington, DC 20006 (202) 973-8800 |
Approximate date of commencement of proposed sale to the public: As soon as practicable after the effective date of this registration statement.
If any of the securities being registered on this Form are to be offered on a delayed or continuous basis pursuant to Rule 415 under the Securities Act of 1933, as amended, check the following box. ☐
If this Form is filed to register additional securities for an offering pursuant to Rule 462(b) under the Securities Act, check the following box and list the Securities Act registration statement number of the earlier effective registration statement for the same offering. ☐
If this Form is a post-effective amendment filed pursuant to Rule 462(c) under the Securities Act, check the following box and list the Securities Act registration statement number of the earlier effective registration statement for the same offering. ☐
If this Form is a post-effective amendment filed pursuant to Rule 462(d) under the Securities Act, check the following box and list the Securities Act registration number of the earlier effective registration statement for the same offering. ☐
Indicate by check mark whether the registrant is a large accelerated filer, an accelerated filer, a non-accelerated filer, a smaller reporting company, or an emerging growth company. See the definitions of “large accelerated filer,” “accelerated filer,” “smaller reporting company” and “emerging growth company” in Rule 12b-2 of the Exchange Act.
| Large Accelerated Filer | ☐ | Accelerated Filer | ☐ | |||
| Non-accelerated Filer | ☒ | Smaller Reporting Company | ☐ | |||
| Emerging Growth Company | ☒ | |||||
If an emerging growth company, indicate by check mark if the registrant has elected not to use the extended transition period for complying with any new or revised financial accounting standards provided pursuant to Section 7(a)(2)(B) of the Securities Act. ☒
CALCULATION OF REGISTRATION FEE
|
| ||||
| Title of Each Class of Securities to be Registered |
Proposed Maximum Aggregate |
Amount of Registration Fee | ||
| Common Stock, $0.01 par value per share |
$100,000,000 |
$12,450 | ||
|
| ||||
|
| ||||
| (1) | In accordance with Rule 457(o) under the Securities Act of 1933, as amended, the number of shares being registered and the proposed maximum offering price per share are not included in this table. |
| (2) | Estimated solely for purposes of computing the amount of the registration fee pursuant to Rule 457(o) under the Securities Act of 1933, as amended. Includes the aggregate offering price of shares that the underwriters have the option to purchase to cover over-allotments, if any. |
The registrant hereby amends this Registration Statement on such date or dates as may be necessary to delay its effective date until the registrant shall file a further amendment that specifically states that this Registration Statement shall thereafter become effective in accordance with Section 8(a) of the Securities Act of 1933, as amended, or until the Registration Statement shall become effective on such date as the Securities and Exchange Commission, acting pursuant to said Section 8(a), may determine.
Table of Contents
The information in this prospectus is not complete and may be changed. We may not sell these securities until the registration statement filed with the Securities and Exchange Commission is effective. This prospectus is not an offer to sell these securities and we are not soliciting offers to buy these securities in any state where the offer or sale is not permitted.
PRELIMINARY PROSPECTUS
(Subject to Completion) Issued , 2018
Shares

COMMON STOCK
Tenable Holdings, Inc. is offering shares of its common stock. This is our initial public offering, and no public market currently exists for our shares of common stock. We anticipate that the initial public offering price will be between $ and $ per share.
We have applied to list our common stock on the Nasdaq Global Market under the symbol “TENB.”
We are an “emerging growth company” as defined under the U.S. federal securities laws and, as such, may elect to comply with certain reduced public company reporting requirements for this and future filings. Investing in our common stock involves risks. See “Risk Factors” beginning on page 13.
PRICE $ A SHARE
| Price to Public |
Underwriting Discounts and |
Proceeds to |
||||||||||
| Per Share |
$ | $ | $ | |||||||||
| Total |
$ | $ | $ | |||||||||
| (1) | See “Underwriting” for a description of the compensation payable to the underwriters. |
We have granted the underwriters the right to purchase up to an additional shares of common stock to cover over-allotments.
, each a member of our board of directors, have indicated an interest in purchasing, directly or through associated entities, up to an aggregate of approximately $ million of shares of our common stock in this offering (or an aggregate of shares based on the midpoint of the price range set forth on the cover page of this prospectus) at the initial public offering price. To the extent these affiliates purchase any such shares from us, the number of shares to be sold to the underwriters will accordingly be reduced. Because these indications of interest are not binding agreements or commitments to purchase, the underwriters could determine to sell more, less or no shares to any of these potential investors and any of these potential investors could determine to purchase more, less or no shares in this offering. The underwriters will receive the same discount from any shares sold to these potential investors as they will from any other shares sold to the public in this offering. Any shares purchased by such potential investors will be subject to lock-up restrictions described in “Shares Eligible for Future Sale.”
The Securities and Exchange Commission and state securities regulators have not approved or disapproved of these securities, or determined if this prospectus is truthful or complete. Any representation to the contrary is a criminal offense.
The underwriters expect to deliver the shares of common stock to purchasers on , 2018.
| Morgan Stanley | J.P. Morgan | Allen & Company LLC | Deutsche Bank Securities |
| Stifel |
| William Blair | BTIG | |
, 2018
Table of Contents
tenable® Empowering organization to understand and reduce their cybersecurity risk
Table of Contents
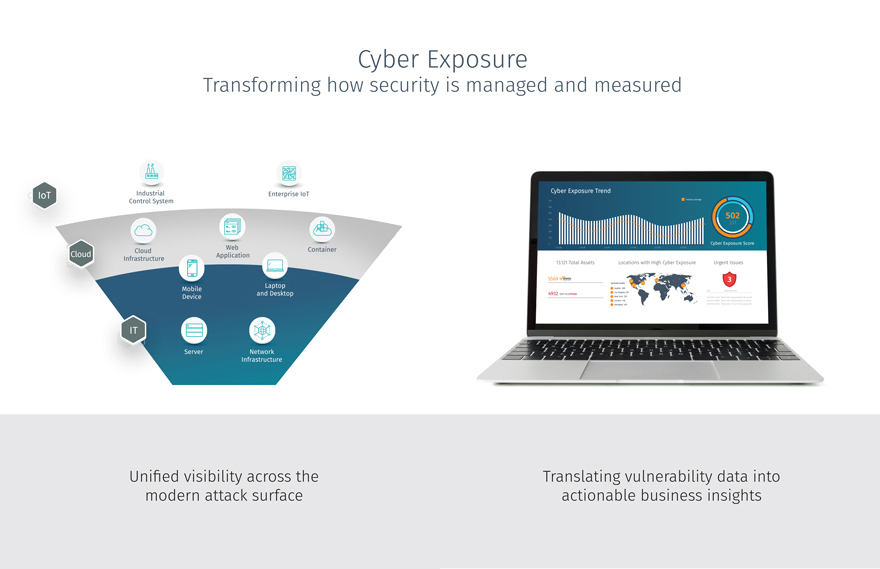
Cyber Exposure Transforming how security is managed and measured 300 276 416 435 Cyber Exposure Trend 13.121 Total Assets Locations with High Cyber Exposure 5569 4932 Seattle 300 Los Angeles 270 New York 276 London 416 Shanghai 435 270 EXPOSURE SCORES Urgent Issues 3 CVE DESCRIPTION CVE-2016-4000 MS15-054: Vulnerability Microsoft CVE-2017-8896 MS14-052: Vulnerability in Group CVE-2016-7830 Wireshark 1.12.x<1.12.8 pcapng File 502 331 Cyber Exposure Score 700 Industry Average 600 500 400 300 200 100 0 1/1/18 2/1/18 3/1/18 4/1/18 5/1/18 6/1/18 Network Infrastructure Web Application Mobile Device IT Cloud IoT Laptop and Desktop Cloud Container Infrastructure Industrial Control System Enterprise IoT Unified visibility across the modern attack surface Translating vulnerability data into actionable business insights Server
Table of Contents
You should rely only on the information contained in this document and any free writing prospectus we may authorize to be delivered or made available to you. We and the underwriters have not authorized anyone to provide any information or to make any representations other than those contained in this prospectus or in any free writing prospectus prepared by us or on our behalf. We and the underwriters take no responsibility for, and can provide no assurance as to the reliability of, any other information that others may give you. This prospectus is an offer to sell only the shares offered hereby, but only under circumstances and in jurisdictions where it is lawful to do so. The information contained in this prospectus is current only as of its date, regardless of the time of delivery of this prospectus or any sale of shares of our common stock.
Through and including , 2018 (25 days after the date of this prospectus), all dealers that effect transactions in our common stock, whether or not participating in this offering, may be required to deliver a prospectus. This delivery requirement is in addition to the dealer’s obligation to deliver a prospectus when acting as an underwriter and with respect to unsold allotments or subscriptions.
For investors outside the United States: We and the underwriters have not done anything that would permit this offering or the possession or distribution of this prospectus in any jurisdiction where action for those purposes is required, other than in the United States. Persons outside the United States who come into possession of this prospectus must inform themselves about, and observe any restrictions relating to, the offering of the shares of common stock and the distribution of this prospectus outside of the United States.
i
Table of Contents
This summary highlights information contained elsewhere in this prospectus and does not contain all of the information that you should consider in making your investment decision. Before investing in our common stock, you should carefully read this entire prospectus, including our consolidated financial statements and the related notes and the information set forth under the sections titled “Risk Factors,” “Special Note Regarding Forward-Looking Statements,” and “Management’s Discussion and Analysis of Financial Condition and Results of Operations,” in each case included elsewhere in this prospectus. Unless the context otherwise requires, we use the terms “Tenable,” “company,” “our,” “us,” and “we” in this prospectus to refer to Tenable Holdings, Inc. and, where appropriate, our consolidated subsidiaries.
TENABLE
Overview
We are the first and only provider of solutions for a new category of cybersecurity that we call Cyber Exposure. Cyber Exposure is a discipline for managing and measuring cybersecurity risk in the digital era. We are building on our deep technology expertise in the traditional vulnerability assessment and management market and expanding that market to include modern attack surfaces and provide analytics that translate vulnerability data into business insight.
Digital transformation is driving radical change. As organizations modernize their IT infrastructure and adopt cloud or hybrid cloud architectures that are no longer housed in the confines of their corporate networks, they have less visibility and control over the security of these assets. Organizations are also increasingly implementing modern solutions, such as Internet of Things, or IoT, devices and application containers, to enable the rapid development and deployment of new products, services and business models, as well as to drive operational efficiencies. Further, safety-critical Operational Technology, or OT, such as Industrial Control Systems, are now network-connected and need to be secured from cybersecurity threats. This digital transformation increases IT complexity and cybersecurity risk as attack surfaces expand. We refer to an organization’s inability to see the breadth of the modern attack surface and analyze the level of cyber exposure as the Cyber Exposure Gap.
While other functions in an organization, such as finance and operations, have a system to help them manage and measure risk, to date, cybersecurity risk has not been adequately measured and understood. Our platform is built to be the Cyber Exposure Command Center for an organization’s Chief Information Security Officer, or CISO. Our platform provides the CISO with unified visibility into the organization’s state of security and enables security teams to prioritize and focus remediation efforts. Our platform also translates vulnerability data into actionable business metrics and insights that boards of directors and executives can understand and use to make strategic decisions. We believe our Cyber Exposure solutions are transforming how security is managed and measured and will help organizations more rapidly embrace digital transformation.
Our enterprise platform offerings include Tenable.io and SecurityCenter. Tenable.io is our software as a service, or SaaS, offering that manages and measures cyber exposure across a range of traditional IT assets, such as networking infrastructure, desktops and on-premises servers and modern IT assets, such as cloud workloads, containers, web applications, IoT and OT assets. SecurityCenter is built to manage and measure cyber exposure across traditional IT assets and can be run on-premises, in the cloud or in a hybrid environment. Our enterprise platform offerings provide broad visibility into Cyber Exposure issues such as vulnerabilities, misconfigurations, internal and regulatory compliance violations and other indicators of the state of an organization’s security. We also provide deep analytics to help organizations measure trends in their cyber exposure over time. Our platform integrates and analyzes data from our native collectors alongside IT asset, vulnerability and threat data from third-party systems and applications to prioritize security issues for remediation and focus an organization’s
1
Table of Contents
resources based on risk and business criticality. Later in 2018, we plan to release Tenable.io Lumin, an application that will provide enhanced risk-based prioritization of issues and benchmarking against industry peers and best-in-class performers.
We believe that our long history in vulnerability management provides us with a significant competitive advantage in closing the Cyber Exposure Gap. We have been an integral part of the cybersecurity market for nearly two decades, initially by helping organizations assess their IT environments for vulnerabilities. Our co-founder is the creator of Nessus, one of the most widely deployed vulnerability assessment solutions in the cybersecurity industry, which underpins our enterprise platform. Since the introduction of Nessus in 1998, an extensive community of Nessus users has emerged. We continue to cultivate knowledge and affinity within this user base, which, when combined with our enterprise customers and our Tenable Research team of cybersecurity and data science experts, creates powerful network effects in the form of a continuous feedback loop of data and insights. We use these learnings to expand our assessment capabilities and coverage, continually optimize our solutions and inform our product strategy and innovation priorities. These data and insights will also fuel and strengthen our benchmarking capabilities over time. We believe the breadth and scale of our data asset is a sustainable advantage and, as the size of our network increases, the value of our data and insights increases and extends our competitive barrier.
We believe we have a differentiated business model in the cybersecurity industry that combines the adoption benefits of our free version of Nessus, Nessus Home, and our paid version of Nessus, Nessus Professional, both of which serve as on-ramps for customers and potential customers to our enterprise platform. Our free version of Nessus has had approximately two million cumulative unique downloads over the past 20 years, which we believe has created broad familiarity and affinity with our products, as well as mindshare among the overwhelming majority of security practitioners. Among our approximately 19,000 Nessus Professional customers, we believe we have significant opportunity to drive adoption of our enterprise platform offerings.
As of December 31, 2016 and 2017, we had over 21,000 and 24,000 customers, respectively, who licensed our Tenable.io, SecurityCenter or Nessus Professional products. This includes over 3,100 and 4,400 enterprise platform customers at those respective dates, which we define as a customer that has a current license for Tenable.io or SecurityCenter for an annual amount of $5,000 or greater. Our customers are located in over 160 countries and include enterprises of all sizes and government agencies around the world. As of December 31, 2017, 53% of the Fortune 500 and 29% of the Global 2000 organizations licensed paid versions of our various products, including enterprise platform customers in 30 of the Fortune 500 and 58 of the Global 2000 organizations.
We have experienced rapid growth in recent periods. Our enterprise platform offerings are primarily sold on an annual prepaid subscription basis. In 2016 and 2017, our total revenue was $124.4 million and $187.7 million, respectively, representing a year-over-year growth rate of 51%. In the three months ended March 31, 2017 and 2018, our total revenue was $40.5 million and $59.1 million, respectively, representing a year-over-year growth rate of 46%. In both 2016 and 2017, our recurring revenue, which includes revenue from subscription arrangements for software and cloud-based solutions and maintenance associated with perpetual licenses, represented 86% of our total revenue. In the three months ended March 31, 2017 and 2018, our recurring revenue represented 85% and 89%, respectively, of our total revenue. Our net loss was $37.2 million, $41.0 million and $15.9 million in 2016, 2017 and the three months ended March 31, 2018, respectively. Our net cash (used in) provided by operating activities was $(2.8) million, $(6.3) million and $0.5 million in 2016, 2017 and the three months ended March 31, 2018, respectively, and our free cash flow, a non-GAAP measure, was $(8.6) million, $(9.0) million and $(1.1) million, respectively, for those periods. We have not raised any primary institutional capital prior to this offering. See “Management’s Discussion and Analysis of Financial Condition and Results of Operations” for further description and analysis of our financial results and “Selected Consolidated Financial Data—Non-GAAP Financial Measures” for a discussion of how we calculate free cash flow, including a reconciliation to the most directly comparable GAAP measure.
2
Table of Contents
Industry Background
Digital Transformation Increases IT Complexity and Cybersecurity Risk
Organizations of all sizes across industries are embracing digital transformation in order to seek competitive advantages. While digital transformation creates new opportunities, the underlying technologies and platforms that enable this transformation dramatically increase IT complexity and overall cybersecurity risk by creating a significantly expanding attack surface for hackers to exploit. These areas include:
| • | Modernization of IT infrastructure and adoption of cloud computing. As organizations modernize their legacy IT infrastructure and adopt cloud or hybrid cloud architectures that are no longer housed in the confines of their corporate networks, they have less visibility and control over the security of these assets. |
| • | The growth of applications. The number of applications and frequency of releases have grown substantially in recent years, and often these applications are developed outside of traditional development processes, sometimes bypassing traditional security controls. |
| • | The rise of DevOps. The increased need for application development velocity has resulted in the rise of DevOps, software development practices and tools that increase an organization’s ability to rapidly deliver applications and services. In a DevOps model, new application features can be deployed on an hourly to daily basis. These critical and short-lived assets are deployed rapidly, creating blind spots for security teams and building security into these development processes is extremely difficult. |
| • | The proliferation of IoT devices in the enterprise. Organizations are seeing a significant rise in IoT devices. While such connected devices serve as a way to collect and transmit operational data to enhance business operations, they also create new points of attack for hackers due to their connectivity with business-critical systems. |
| • | IT / OT convergence. Operational Technology, such as Industrial Control Systems used in industries like manufacturing, were not originally designed with network connectivity and IT security in mind. However, as organizations are being driven to connect all aspects of their infrastructure, OT assets are becoming increasingly connected, and a cyberattack on an OT asset is not just a matter of business disruption; it can also be a public safety concern. |
Cybersecurity Risk is Business Risk, Yet Organizations Lack the Insight to Guide Decisions
Cybersecurity risk is no longer a tactical technology issue for IT professionals alone, but rather a strategic business issue. Executives and boards of directors are struggling to effectively understand and manage their organizations’ cybersecurity risk in response to mandates from insurers, regulators, stockholders and consumers.
Boards seek to understand how secure their organization is, where the greatest risks are, how much they should be investing to reduce risk and how their organization compares to their industry peers and best-in-class organizations. As boards focus their attention on understanding and benchmarking their cyber exposure, CISOs need solutions that translate vulnerability data into actionable business insights so that they and their boards can proactively understand, measure and manage cybersecurity risk.
Existing Solutions Fall Short of Addressing Cyber Exposure
Many organizations have implemented vulnerability assessment and management tools that scan traditional IT systems on scheduled intervals and present raw lists of technical issues.
These traditional solutions fall short on two key dimensions:
| • | Lack of visibility across the breadth of the modern attack surface. Many tools were designed before the rise of cloud, containers, “bring your own device,” or BYOD, devices and IoT and focus instead on traditional IT systems such as networking infrastructure, desktops and on-premises servers. These tools do not address the dynamic nature of modern IT assets, or fully assess IoT devices and OT systems. |
3
Table of Contents
| • | Inability to translate vulnerability data into business insights. Traditional tools lack both the prioritization and deep analytics that security teams, the CISOs, executives and boards of directors need to assess and benchmark their cybersecurity risk to make informed business decisions based on this raw technical security data. |
In addition to traditional vulnerability management tools, organizations typically deploy many security tools, such as protection and detection and response technologies, which address different parts of security, but do not address the Cyber Exposure problem specifically. These point solutions are designed to collect, understand and react to threat activity, but do not answer fundamental strategic questions about the organization’s state of security.
Our Solution
Our vision is to empower every organization to understand and reduce their cybersecurity risk. We are the first and only Cyber Exposure platform designed to provide broad visibility and deep insights into cyber exposure across the entire modern attack surface.
Our platform is built to serve as the Cyber Exposure Command Center, enabling organizations to answer foundational and strategic questions such as:
| • | Where are we exposed? |
| • | Where should we prioritize based on risk? |
| • | Are we reducing our exposure over time? |
| • | How do we compare to our peers? |
Our enterprise platform offerings include Tenable.io and SecurityCenter. With our platform, our customers are able to gain visibility into their cyber exposure, prioritize remediation efforts based on risk and business criticality and benchmark cybersecurity risk in order to guide strategic decision making. Our solutions deliver the following key business benefits for our customers:
| • | Visibility across a breadth of assets. We provide customers with broad visibility into the full range of attack surfaces within a single platform. Our solutions cover traditional IT assets, such as networking infrastructure, desktops and on-premises servers, as well as modern IT assets, such as cloud, containers, web applications, BYOD devices, IoT and OT assets that reside both inside and outside of a customer’s corporate network. Our solutions provide a range of continuous discovery and assessment techniques applied to the entire scope of a customer’s IT infrastructure. |
| • | Depth of analytics to prioritize issues and measure cybersecurity risk. Once asset discovery and assessment information is obtained, our platform is designed to give our customers a comprehensive and objective understanding of their cybersecurity posture and where they are exposed. Our solutions integrate and analyze our natively collected data alongside third-party data to rapidly prioritize security issues. Our analytics use our deep knowledge base, built over 20 years, to provide customers with a quantitative assessment of their cyber exposure. |
Competitive Strengths
We believe we have the following strengths that drive value to our customers and provide sustainable advantage for us:
| • | Deeply trusted brand among large global Nessus community. Nessus is a widely adopted vulnerability assessment solution, with approximately two million cumulative unique downloads globally over the |
4
Table of Contents
| past 20 years. This community has developed a deep trust and affinity for Nessus, which we believe is a competitive advantage difficult to replicate. |
| • | Our data asset drives significant network effects. The combination of our extensive community of Nessus users, our approximately 19,000 Nessus Professional customers and our Tenable Research team provides a continuous feedback loop of data, insight and learnings, which we use to expand our assessment capabilities and coverage. |
| • | Differentiated business model. We believe that our business model is a key differentiator in our market and creates a strong competitive moat by combining the adoption benefits of free software with the economic benefits of a proprietary software business model. Through the large and growing base of Nessus users, we are able to create familiarity with our products and gain mindshare among security practitioners. Among our approximately 19,000 Nessus Professional customers, we believe we have a significant opportunity to convert customers to our enterprise platform products, Tenable.io and SecurityCenter. |
| • | Powerful assessment capabilities. Our platform provides broad vulnerability assessment capabilities that cover the full range of IT assets and cloud environments. We built the majority of these assessment capabilities natively into our platform from the ground up, which have been optimized and enhanced over the course of the past 20 years in close collaboration with the security community. In addition, we partner with other companies that possess deep expertise in specific markets and asset types. |
Our Opportunity
We address what we refer to as the Cyber Exposure market, which includes traditional and modern attack surfaces. We estimate our total addressable market will reach approximately $16 billion in 2019. See “Business—Our Opportunity.”
Growth Strategy
In order to maintain our market leadership in Cyber Exposure and to capture our large market opportunity, key elements of our growth strategy include:
| • | Continue to acquire new enterprise platform customers. |
| • | Expand asset coverage within our customer base. |
| • | Invest in our technology platform and expand use cases. |
| • | Accelerate international expansion. |
Selected Risks Affecting Our Business
Investing in our common stock involves risk. You should carefully consider all the information in this prospectus prior to investing in our common stock. These risks are discussed more fully in the section entitled “Risk Factors” immediately following this prospectus summary. These risks and uncertainties include, but are not limited to, the following:
| • | We have a history of losses and may not achieve or maintain profitability in the future. |
| • | We may not be able to sustain our revenue growth rate in the future. |
| • | We may not be able to scale our business quickly enough to meet our customers’ growing needs. |
| • | If our solutions fail to detect vulnerabilities or incorrectly detect vulnerabilities, or if they contain undetected errors or defects, our brand and reputation could be harmed. |
| • | Our future quarterly results of operations are likely to fluctuate significantly due to a wide range of factors, which makes our future results difficult to predict. |
5
Table of Contents
| • | We face intense competition. |
| • | If we do not continue to innovate and offer solutions that address the dynamic cybersecurity landscape, we may not remain competitive. |
| • | Our business and results of operations depend substantially on our customers renewing their subscriptions with us and expanding the number of assets under their subscriptions. Any decline in our customer renewals, terminations or failure to convince our customers to expand their use of subscription offerings would harm our business, results of operations and financial condition. |
| • | Our brand, reputation and ability to attract, retain and serve our customers are dependent in part upon the reliable performance of our solutions and network infrastructure. |
| • | We rely on third parties to maintain and operate certain elements of our network infrastructure. |
| • | We rely on our third-party channel partner network of distributors and resellers to generate a substantial amount of our revenue. |
| • | Concentration of ownership among our existing directors, executive officers and holders of 5% or more of our outstanding common stock may prevent new investors from influencing significant corporate decisions, including the ability to influence the outcome of director elections and other matters requiring stockholder approval. |
Ownership of our Capital Stock
Prior to this offering, our directors, executive officers and greater than 5% stockholders, together with their respective affiliates, beneficially own, in the aggregate, approximately 73.1 million shares of our common stock, or approximately 89% of our outstanding common stock. Upon the completion of this offering, these persons and entities will beneficially own, in the aggregate, approximately % of our outstanding common stock, assuming no exercise of the underwriters’ option to purchase additional shares of our common stock in this offering.
Corporate Information
Tenable Network Security, Inc., our predecessor, was incorporated under the laws of the State of Delaware in 2002. In 2015, in connection with the sale of 39,538,354 shares of Series B redeemable convertible preferred stock to investors, we entered into the series of transactions below, which we refer to collectively as our Series B financing or our recapitalization. Tenable Holdings, Inc. was incorporated in Delaware in October 2015, and in November 2015, Tenable Network Security, Inc. was merged into our wholly-owned indirect subsidiary and in 2017 was renamed as Tenable, Inc. As part of the Series B financing, we entered into contribution agreements with certain stockholders of Tenable, Inc. pursuant to which they contributed shares of Tenable, Inc. to us in exchange for the same class and number of shares of Tenable Holdings, Inc. As a result, we issued an aggregate of 20,670,193 shares of common stock and 15,847,500 shares of Series A redeemable convertible preferred stock to these stockholders and paid aggregate cash consideration of $229.1 million.
Pursuant to the merger agreement, each outstanding share of common stock of Tenable, Inc. held by accredited investors (other than the shares contributed to us and shares held by dissenting stockholders) was, at such holder’s election, converted into the right to receive a combination of cash consideration and shares of our common stock. Shares held by non-accredited investors, and, at their election, shares held by certain accredited investors, were automatically converted into cash. We used the proceeds from the Series B financing to purchase these shares and make the payments referenced above. None of the proceeds from the sale of Series B redeemable convertible preferred stock were retained by us. See “Certain Relationships and Related Party Transactions—Sale of Series B Redeemable Convertible Preferred Stock and Stock Repurchases.” Additionally, at the effective time of the merger, each outstanding option granted by Tenable, Inc. was assumed by us and
6
Table of Contents
converted into an option to acquire our common stock and continued to be subject to the same terms and conditions applicable to the options. As a result, outstanding Tenable, Inc. options were assumed by us and converted into options to purchase an aggregate of 7,616,253 shares of our common stock.
Our principal executive offices are located at 7021 Columbia Gateway Drive, Suite 500, Columbia, Maryland 21046. Our telephone number is (410) 872-0555. Our website address is www.tenable.com. The information contained on, or that can be accessed through, our website is not incorporated by reference into this prospectus, and you should not consider any information contained on, or that can be accessed through, our website as part of this prospectus or in deciding whether to purchase our common stock.
“Tenable,” “Nessus,” “Tenable.io” and the Tenable logo, and other trademarks or service marks of Tenable Holdings, Inc. appearing in this prospectus are the property of Tenable Holdings, Inc. This prospectus contains additional trade names, trademarks and service marks of others, which are the property of their respective owners. Solely for convenience, trademarks and trade names referred to in this prospectus may appear without the ® or TM symbols.
Implications of Being an Emerging Growth Company
We qualify as an “emerging growth company” as defined in the Jumpstart Our Business Startups Act of 2012, or the JOBS Act. An emerging growth company may take advantage of specified reduced reporting and other burdens that are otherwise applicable generally to public companies. These provisions include:
| • | a requirement to have only two years of audited financial statements and only two years of related selected financial data and management’s discussion and analysis of financial condition and results of operations disclosure; |
| • | an exemption from the auditor attestation requirement in the assessment of our internal control over financial reporting pursuant to the Sarbanes-Oxley Act of 2002, or the Sarbanes-Oxley Act; |
| • | an exemption from implementation of new or revised financial accounting standards until they would apply to private companies and from compliance with any new requirements adopted by the Public Company Accounting Oversight Board requiring mandatory audit firm rotation; |
| • | reduced disclosure obligations regarding executive compensation arrangements; and |
| • | no requirement to seek nonbinding advisory votes on executive compensation or golden parachute arrangements. |
We may take advantage of some or all these provisions until we are no longer an emerging growth company. We are choosing to irrevocably “opt out” of the extended transition periods available under the JOBS Act for complying with new or revised accounting standards, but we intend to take advantage of the other exemptions discussed above. Accordingly, the information contained herein may be different than the information you receive from other public companies in which you hold stock.
We will remain an emerging growth company until the earlier to occur of (1) the last day of the fiscal year (a) following the fifth anniversary of the closing of this offering, (b) in which we have total annual gross revenue of at least $1.07 billion or (c) in which we are deemed to be a “large accelerated filer,” under the rules of the U.S. Securities and Exchange Commission, or SEC, which means the market value of our equity securities that is held by non-affiliates exceeds $700 million as of the prior June 30th, and (2) the date on which we have issued more than $1.0 billion in non-convertible debt during the prior three-year period.
7
Table of Contents
THE OFFERING
| Common stock offered by us |
shares | |
| Common stock to be outstanding after this offering |
shares | |
| Over-allotment option of common stock offered by us |
shares | |
| Use of proceeds |
We estimate that we will receive net proceeds of approximately $ million (or approximately $ million if the underwriters exercise their over-allotment option in full), assuming an initial public offering price of $ per share, the midpoint of the price range set forth on the cover page of this prospectus, after deducting estimated underwriter discounts and commissions and estimated offering expenses payable by us. The principal purposes of this offering are to increase our financial flexibility, create a public market for our common stock and facilitate our future access to the capital markets. We expect to use the net proceeds of this offering for working capital and other general corporate purposes. We may use a portion of the proceeds from this offering for acquisitions or strategic investments in complementary businesses or technologies, although we do not currently have any plans for any such acquisitions or investments. These expectations are subject to change. See “Use of Proceeds” for additional information. | |
| Directed share program |
At our request, the underwriters have reserved up to shares of common stock offered by this prospectus, or up to 5% of the shares of common stock offered by this prospectus, for sale, at the initial public offering price, to friends, professional contacts and family members of executive officers and directors. If purchased by these persons, these shares will not be subject to a lock-up restriction. The number of shares of common stock available for sale to the general public will be reduced by the number of reserved shares sold to these individuals. Any reserved shares that are not so purchased will be offered by the underwriters to the general public on the same basis as the other shares offered by this prospectus. See “Underwriting.” | |
| Risk factors |
See “Risk Factors” and the other information included in this prospectus for a discussion of factors you should carefully consider before deciding to invest in our common stock. | |
| Proposed Nasdaq Global Market symbol |
“TENB” | |
8
Table of Contents
The number of shares of our common stock that will be outstanding after this offering is based on 80,179,454 shares of common stock outstanding as of March 31, 2018, and excludes:
| • | 15,217,352 shares of common stock issuable upon the exercise of options outstanding as of March 31, 2018, at a weighted-average exercise price of $4.93 per share; |
| • | 2,557,234 shares of common stock reserved for future issuance as of March 31, 2018 under our 2016 Stock Incentive Plan, which shares will cease to be available for issuance at the time our 2018 Equity Incentive Plan becomes effective and will be added to, and become available for issuance under, our 2018 Equity Incentive Plan; |
| • | 736,500 shares of common stock issuable upon the exercise of options granted under our 2016 Stock Incentive Plan subsequent to March 31, 2018, at an exercise price of $14.06 per share; |
| • | 4,012,148 shares of common stock issuable upon the exercise of options granted under our 2016 Stock Incentive Plan subsequent to March 31, 2018, at an exercise price of $16.21 per share; |
| • | 973,800 shares of common stock issuable upon the settlement of restricted stock units granted under our 2016 Stock Incentive Plan subsequent to March 31, 2018; |
| • | 9,900,000 shares of common stock reserved for future issuance pursuant to our 2018 Equity Incentive Plan, which will become effective prior to the closing of this offering; and |
| • | 4,000,000 shares of common stock reserved for future issuance under our 2018 Employee Stock Purchase Plan, which will become effective prior to the closing of this offering. |
Unless otherwise indicated, this prospectus reflects and assumes the following:
| • | the conversion of all outstanding shares of our convertible preferred stock into an aggregate of 55,385,854 shares of our common stock immediately prior to the closing of this offering; |
| • | no exercise of outstanding options or settlement of outstanding restricted stock units after March 31, 2018; |
| • | no repurchase of outstanding shares of common stock after March 31, 2018; |
| • | no exercise by the underwriters of their over-allotment option to purchase additional shares of our common stock; and |
| • | the filing and effectiveness of our amended and restated certificate of incorporation in Delaware and the adoption of our amended and restated bylaws, each of which will occur immediately prior to the closing of this offering. |
, each a member of our board of directors, have indicated an interest in purchasing, directly or through associated entities, up to an aggregate of approximately $ million of shares of our common stock in this offering (or an aggregate of shares based on the midpoint of the price range set forth on the cover page of this prospectus) at the initial public offering price. To the extent these affiliates purchase any such shares from us, the number of shares to be sold to the underwriters will accordingly be reduced. Because these indications of interest are not binding agreements or commitments to purchase, the underwriters could determine to sell more, less or no shares to any of these potential investors and any of these potential investors could determine to purchase more, less or no shares in this offering. The underwriters will receive the same discount from any shares sold to these potential investors as they will from any other shares sold to the public in this offering. Any shares purchased by such potential investors will be subject to lock-up restrictions described in “Shares Eligible for Future Sale.”
9
Table of Contents
SUMMARY CONSOLIDATED FINANCIAL AND OTHER DATA
We derived the summary consolidated statements of operations data for the years ended December 31, 2016 and 2017 from our audited consolidated financial statements included elsewhere in this prospectus. In order to provide additional historical financial information, we have included supplemental consolidated statements of operations data for the year ended December 31, 2015, which is derived from the consolidated statement of operations and comprehensive loss for the year ended December 31, 2015 from our audited financial statements not included in this prospectus. We derived the summary consolidated statements of operations data for the three months ended March 31, 2017 and 2018 and the summary consolidated balance sheet data as of March 31, 2018 from the unaudited consolidated financial statements included elsewhere in this prospectus. Our unaudited interim consolidated financial statements have been prepared on the same basis as our audited consolidated financial statements and reflect, in the opinion of management, all adjustments of a normal, recurring nature that are necessary for a fair presentation of our unaudited interim consolidated financial statements. Our historical results are not necessarily indicative of the results to be expected in the future, and our operating results for the three months ended March 31, 2018 are not necessarily indicative of the results that may be expected for the entire year ending December 31, 2018.
When you read this summary consolidated financial data, it is important that you read it together with the historical consolidated financial statements and related notes to those statements, as well as “Selected Consolidated Financial Data” and “Management’s Discussion and Analysis of Financial Condition and Results of Operations,” included elsewhere in this prospectus.
| Year Ended December 31, | Three Months Ended March 31, | |||||||||||||||||||||||
| 2015 | 2016 | 2017 | 2017 | 2018 | ||||||||||||||||||||
| (in thousands, except per share data) |
||||||||||||||||||||||||
| Consolidated Statements of Operations Data: |
||||||||||||||||||||||||
| Revenue(1) |
$ | 93,466 | $ | 124,371 | $ | 187,727 | $ | 40,481 | $ | 59,107 | ||||||||||||||
| Cost of revenue(2) |
10,914 | 14,219 | 25,588 | 4,438 | 8,728 | |||||||||||||||||||
|
|
|
|
|
|
|
|
|
|
|
|||||||||||||||
| Gross profit |
82,552 | 110,152 | 162,139 | 36,043 | 50,379 | |||||||||||||||||||
| Operating expenses: |
||||||||||||||||||||||||
| Sales and marketing(1)(2) |
60,635 | 85,736 | 116,299 | 26,168 | 39,588 | |||||||||||||||||||
| Research and development(2) |
25,288 | 40,085 | 57,673 | 12,458 | 17,185 | |||||||||||||||||||
| General and administrative(2) |
15,348 | 20,164 | 28,927 | 6,163 | 9,055 | |||||||||||||||||||
| Recapitalization costs(3) |
67,039 | — | — | — | — | |||||||||||||||||||
|
|
|
|
|
|
|
|
|
|
|
|||||||||||||||
| Total operating expenses |
168,310 | 145,985 | 202,899 | 44,789 | 65,828 | |||||||||||||||||||
|
|
|
|
|
|
|
|
|
|
|
|||||||||||||||
| Loss from operations |
(85,758 | ) | (35,833 | ) | (40,760 | ) | (8,746 | ) | (15,449 | ) | ||||||||||||||
| Other expense, net |
189 | 532 | 91 | 29 | 8 | |||||||||||||||||||
|
|
|
|
|
|
|
|
|
|
|
|||||||||||||||
| Loss before income taxes |
(85,947 | ) | (36,365 | ) | (40,851 | ) | (8,775 | ) | (15,457 | ) | ||||||||||||||
| (Benefit from) provision for income taxes |
(2,188 | ) | 843 | 171 | 51 | 431 | ||||||||||||||||||
|
|
|
|
|
|
|
|
|
|
|
|||||||||||||||
| Net loss |
(83,759 | ) | (37,208 | ) | (41,022 | ) | (8,826 | ) | (15,888 | ) | ||||||||||||||
| Accretion of Series A and B redeemable convertible preferred stock |
29 | 763 | 763 | 187 | 188 | |||||||||||||||||||
|
|
|
|
|
|
|
|
|
|
|
|||||||||||||||
| Net loss attributable to common stockholders |
$ | (83,788 | ) | $ | (37,971 | ) | $ | (41,785 | ) | $ | (9,013 | ) | $ | (16,076 | ) | |||||||||
|
|
|
|
|
|
|
|
|
|
|
|||||||||||||||
| Net loss per share attributable to common stockholders, basic and diluted(4) |
$ | (1.45 | ) | $ | (1.81 | ) | $ | (1.88 | ) | $ | (0.42 | ) | $ | (0.68 | ) | |||||||||
|
|
|
|
|
|
|
|
|
|
|
|||||||||||||||
| Weighted-average shares used to compute net loss per share attributable to common stockholders, basic and diluted |
57,654 | 20,974 | 22,211 | 21,257 | 23,495 | |||||||||||||||||||
|
|
|
|
|
|
|
|
|
|
|
|||||||||||||||
| Pro forma net loss per share, basic and diluted (unaudited)(5) |
$ | (0.53 | ) | $ | (0.20 | ) | ||||||||||||||||||
|
|
|
|
|
|||||||||||||||||||||
| Weighted-average shares used in computing pro forma net loss per share, basic and diluted (unaudited) |
77,597 | 78,881 | ||||||||||||||||||||||
|
|
|
|
|
|||||||||||||||||||||
10
Table of Contents
| (1) | We adopted Accounting Standards Codification Topic 606, Revenue From Contracts With Customers, or ASC 606, on January 1, 2017 using the modified retrospective method. The 2015 and 2016 consolidated statements of operations were not adjusted for the adoption of ASC 606. See Note 2 to our consolidated financial statements included elsewhere in this prospectus for details on the impact of adopting ASC 606. |
| (2) | Includes stock-based compensation expense as follows: |
| Year Ended December 31, | Three Months Ended March 31, | |||||||||||||||||||
| 2015 | 2016 | 2017 | 2017 | 2018 | ||||||||||||||||
| (in thousands) |
||||||||||||||||||||
| Cost of revenue |
$ | 52 | $ | 223 | $ | 281 | $ | 54 | $ | 77 | ||||||||||
| Sales and marketing |
866 | 969 | 1,579 | 270 | 602 | |||||||||||||||
| Research and development |
252 | 602 | 1,782 | 394 | 527 | |||||||||||||||
| General and administrative |
509 | 738 | 4,118 | 908 | 1,193 | |||||||||||||||
|
|
|
|
|
|
|
|
|
|
|
|||||||||||
| Total stock-based compensation expense |
$ | 1,679 | $ | 2,532 | $ | 7,760 | $ | 1,626 | $ | 2,399 | ||||||||||
|
|
|
|
|
|
|
|
|
|
|
|||||||||||
| (3) | We recorded a charge of $67.0 million primarily resulting from the repurchase price paid to common stockholders exceeding the estimated fair value of the common stock on the date of the Series B financing. |
| (4) | See Note 9 to our consolidated financial statements appearing elsewhere in this prospectus for further details on the calculation of basic and diluted net loss per share attributable to common stockholders. |
| (5) | Pro forma basic and diluted net loss per share represents net loss divided by the pro forma weighted-average shares of common stock outstanding. Pro forma weighted-average shares outstanding reflects the conversion of all outstanding shares of preferred stock (using the if-converted method) into common stock as though the conversion had occurred on the first day of the relevant period. |
| As of March 31, 2018 | ||||||||||||
| Actual | Pro forma(1) | Pro forma as adjusted(2)(3) |
||||||||||
| (in thousands) | ||||||||||||
| Consolidated Balance Sheet Data: |
||||||||||||
| Cash and cash equivalents |
$ | 26,424 | $ | 26,424 | ||||||||
| Working capital (deficit)(4) |
(81,983 | ) | (81,983 | ) | ||||||||
| Total assets |
155,645 | 155,645 | ||||||||||
| Deferred revenue, current and non-current |
230,614 | 230,614 | ||||||||||
| Redeemable convertible preferred stock |
277,923 | — | ||||||||||
| Accumulated deficit |
(408,475 | ) | (408,475 | ) | ||||||||
| Total stockholders’ (deficit) equity |
(384,863 | ) | (106,940 | ) | ||||||||
| (1) | Pro forma consolidated balance sheet data reflects the conversion of all outstanding shares of preferred stock into common stock immediately prior to the closing of this offering as if such conversion had occurred on March 31, 2018. |
| (2) | Pro forma as adjusted consolidated balance sheet data reflects the pro forma items described immediately above and our sale of shares of common stock in this offering at an assumed initial public offering price of $ per share, the midpoint of the price range set forth on the cover page of this prospectus, after deducting estimated underwriting discounts and commissions and estimated offering expenses payable by us. |
| (3) | Pro forma as adjusted consolidated balance sheet data is illustrative only and will change based on the actual initial public offering price and other terms of this offering determined at pricing. Each $1.00 increase or decrease in the assumed initial public offering price of $ per share, the midpoint of the price range set forth on the cover page of this prospectus, would increase or decrease pro forma as adjusted cash and cash equivalents, working capital (deficit), total assets and total stockholders’ deficit by approximately $ million, assuming that the number of shares offered by us, as set forth on the cover page of this |
11
Table of Contents
| prospectus, remains the same, and after deducting estimated underwriting discounts and commissions and estimated offering expenses payable by us. We may also increase or decrease the number of shares we are offering. A 1,000,000 share increase or decrease in the number of shares offered by us would increase or decrease pro forma as adjusted cash and cash equivalents, total assets and total stockholders’ deficit by approximately $ million, assuming that the assumed initial offering price to the public remains the same, and after deducting estimated underwriting discounts and commissions and estimated offering expenses payable by us. |
| (4) | We define working capital (deficit) as total current assets less total current liabilities. See our consolidated financial statements included elsewhere in this prospectus for further details regarding our current assets and current liabilities. Changes in working capital (deficit) reflect increases in deferred revenue and deferred commissions as a result of our subscription model and our adoption of ASC 606. |
12
Table of Contents
Investing in our common stock involves a high degree of risk. You should consider carefully the risks and uncertainties described below, together with all of the other information in this prospectus, including our consolidated financial statements and related notes, before deciding whether to purchase shares of our common stock. The risks and uncertainties described below are not the only ones we face. Additional risks and uncertainties that we are unaware of, or that we currently believe are not material, may also become important factors that affect us. If any of the following risks are realized, our business, financial condition, results of operations and prospects could be materially and adversely affected. In that event, the price of our common stock could decline, and you could lose part or all of your investment.
Risks Related to Our Business and Industry
We have a history of losses and may not achieve or maintain profitability in the future.
We have historically incurred net losses, including net losses of $37.2 million, $41.0 million and $15.9 million in 2016, 2017 and the three months ended March 31, 2018, respectively. As of March 31, 2018, we had an accumulated deficit of $408.5 million. Because the market for our offerings is highly competitive and rapidly evolving and these solutions have not yet reached widespread adoption, it is difficult for us to predict our future results of operations. While we have experienced significant revenue growth in recent periods, we are not certain whether or when we will obtain a high enough volume of sales of our offerings to sustain or increase our growth or achieve or maintain profitability in the future. We also expect our costs to increase in future periods, which could negatively affect our future operating results if our revenue does not increase at a greater rate. In particular, we expect to continue to expend substantial financial and other resources on:
| • | research and development related to our offerings, including investments in our research and development team; |
| • | sales and marketing, including a significant expansion of our sales organization, both domestically and internationally; |
| • | continued international expansion of our business; and |
| • | general and administrative expense, including legal and accounting expenses related to being a public company. |
These investments may not result in increased revenue or growth in our business. If we are unable to increase our revenue at a rate sufficient to offset the expected increase in our costs, our business, financial position and results of operations will be harmed and we may not be able to achieve or maintain profitability over the long term. Additionally, we may encounter unforeseen operating expenses, difficulties, complications, delays and other unknown factors that may result in losses in future periods. If our revenue growth does not meet our expectations in future periods, our financial performance may be harmed, and we may not achieve or maintain profitability in the future.
We may not be able to sustain our revenue growth rate in the future.
From 2016 to 2017, our revenue grew from $124.4 million to $187.7 million, representing year-over-year growth of 51%. Our adoption of ASC 606 as of January 1, 2017 contributed three percentage points to that growth rate. From the three months ended March 31, 2017 to the three months ended March 31, 2018, our revenue grew from $40.5 million to $59.1 million, representing year-over-year growth of 46%. This growth was primarily from an increase in subscription revenue. Although we have experienced rapid growth historically and currently have high customer renewal rates, we may not continue to grow as rapidly in the future due to a decline in our renewal rates, failure to attract new customers or other factors. Any success that we may experience in the future will depend in large part on our ability to, among other things:
| • | maintain and expand our customer base; |
| • | increase revenue from existing customers through increased or broader use of our offerings within their organizations; |
13
Table of Contents
| • | improve the performance and capabilities of our offerings through research and development; |
| • | continue to develop and expand our enterprise platform; |
| • | maintain the rate at which customers purchase and renew subscriptions to our enterprise platform offerings; |
| • | continue to successfully expand our business domestically and internationally; and |
| • | successfully compete with other companies. |
If we are unable to maintain consistent revenue or revenue growth, our stock price could be volatile, and it may be difficult to achieve and maintain profitability. You should not rely on our revenue for any prior quarterly or annual periods as any indication of our future revenue or revenue growth.
We may be unable to rapidly and efficiently adjust our cost structure in response to significant revenue declines, which could adversely affect our operating results.
We recognize substantially all of our revenue ratably over the term of our subscriptions and, to a lesser extent, perpetual licenses ratably over an expected period of benefit and, as a result, downturns in sales may not be immediately reflected in our operating results.
We recognize substantially all of our revenue ratably over the terms of our subscriptions with customers, which generally occurs over a one-year period and, for our perpetual licenses, over a five-year expected period of benefit. As a result, a substantial portion of the revenue that we report in each period will be derived from the recognition of deferred revenue relating to agreements entered into during previous periods. Consequently, a decline in new sales or renewals in any one period may not be immediately reflected in our revenue results for that period. This decline, however, will negatively affect our revenue in future periods. Accordingly, the effect of significant downturns in sales and market acceptance of our solutions and potential changes in our rate of renewals may not be fully reflected in our results of operations until future periods. This also makes it difficult for us to rapidly increase our revenue growth through additional sales in any period, as revenue from new customers generally will be recognized over the term of the applicable agreement.
We may not be able to scale our business quickly enough to meet our customers’ growing needs.
As usage of our enterprise platform grows, and as customers expand in size or expand the number of IT assets or IP addresses under their subscriptions, we may need to devote additional resources to improving our technology architecture, integrating with third-party systems and maintaining infrastructure performance. In addition, we will need to appropriately scale our sales and marketing headcount, as well as grow our third-party channel partner network, to serve our growing customer base. If we are unable to scale our business appropriately, it could reduce the attractiveness of our solutions to customers, resulting in decreased sales to new customers, lower renewal rates by existing customers or the issuance of service credits or requested refunds, each of which could hurt our revenue growth and our reputation. Even if we are able to upgrade our systems and expand our personnel, any such expansion will be expensive and complex, requiring management time and attention. We could also face inefficiencies or operational failures as a result of our efforts to scale our infrastructure. Moreover, there are inherent risks associated with upgrading, improving and expanding our information technology systems. We cannot be sure that the expansion and improvements to our infrastructure and systems will be fully or effectively implemented on a timely basis, if at all. These efforts may reduce revenue and our margins and adversely impact our financial results.
If our enterprise platform offerings do not interoperate with our customers’ network and security infrastructure or with third-party products, websites or services, our results of operations may be harmed.
Our enterprise platform offerings, Tenable.io and SecurityCenter, must interoperate with our customers’ existing network and security infrastructure. These complex systems are developed, delivered and maintained by
14
Table of Contents
the customer and a myriad of vendors and service providers. As a result, the components of our customers’ infrastructure have different specifications, rapidly evolve, utilize multiple protocol standards, include multiple versions and generations of products and may be highly customized. We must be able to interoperate and provide our security offerings to customers with highly complex and customized networks, which requires careful planning and execution between our customers, our customer support teams and our channel partners. Further, when new or updated elements of our customers’ infrastructure or new industry standards or protocols, such as HTTP/2, are introduced, we may have to update or enhance our cloud platform and our other solutions to allow us to continue to provide service to customers. Our competitors or other vendors may refuse to work with us to allow their products to interoperate with our solutions, which could make it difficult for our cloud platform to function properly in customer networks that include these third-party products.
We may not deliver or maintain interoperability quickly or cost-effectively, or at all. These efforts require capital investment and engineering resources. If we fail to maintain compatibility of our cloud platform and our other solutions with our customers’ network and security infrastructures, our customers may not be able to fully utilize our solutions, and we may, among other consequences, lose or fail to increase our market share and experience reduced demand for our services, which would materially harm our business, operating results and financial condition.
If our solutions fail to detect vulnerabilities or incorrectly detect vulnerabilities, or if they contain undetected errors or defects, our brand and reputation could be harmed.
If our solutions fail to detect vulnerabilities in our customers’ cybersecurity infrastructure, or if our solutions fail to identify to new and increasingly complex methods of cyberattacks, our business and reputation may suffer. There is no guarantee that our solutions will detect all vulnerabilities, especially in light of the rapidly changing security landscape to which we must respond. Additionally, our solutions may falsely detect vulnerabilities or threats that do not actually exist. For example, our solutions rely on information provided by an active community of users who contribute new exploits, attacks and vulnerabilities. If the information from these third parties is inaccurate, the potential for false indications of security vulnerabilities increases. These false positives, while typical in the industry, may impair the perceived reliability of our offerings and may therefore adversely impact market acceptance of our products and could result in negative publicity, loss of customers and sales and increased costs to remedy any problem.
Our solutions may also contain undetected errors or defects when first introduced or as new versions are released. We have experienced these errors or defects in the past in connection with new solutions and product upgrades and we expect that these errors or defects will be found from time to time in the future in new or enhanced solutions after commercial release. Defects may cause our solutions to be vulnerable to attacks, cause them to fail to detect vulnerabilities, or temporarily interrupt customers’ networking traffic. Any errors, defects, disruptions in service or other performance problems with our solutions may damage our customers’ business and could hurt our reputation. If our solutions or fail to detect vulnerabilities for any reason, we may incur significant costs, the attention of our key personnel could be diverted, our customers may delay or withhold payment to us or elect not to renew or other significant customer relations problems may arise. We may also be subject to liability claims for damages related to errors or defects in our solutions. A material liability claim or other occurrence that harms our reputation or decreases market acceptance of our solutions may harm our business and operating results.
An actual or perceived security breach or theft of the sensitive data of one of our customers, regardless of whether the breach is attributable to the failure of our solutions, could adversely affect the market’s perception of our brand and our offerings and subject us to legal claims.
15
Table of Contents
Our future quarterly results of operations are likely to fluctuate significantly due to a wide range of factors, which makes our future results difficult to predict.
Our revenue and results of operations have historically varied from period to period, and we expect that they will continue to do so as a result of a number of factors, many of which are outside of our control, including:
| • | the level of demand for our enterprise platform; |
| • | the introduction of new products and product enhancements by existing competitors or new entrants into our market, and changes in pricing for solutions offered by us or our competitors; |
| • | the rate of renewal of subscriptions, and extent of expansion of IT assets under such subscriptions, with existing customers; |
| • | the mix of customers licensing our products on a subscription basis as compared to a perpetual license; |
| • | large customers failing to renew their subscriptions; |
| • | the size, timing and terms of our subscription agreements with new customers; |
| • | our ability to interoperate our solutions with our customers’ network and security infrastructure; |
| • | the timing and growth of our business, in particular through our hiring of new employees and international expansion; |
| • | network outages, security breaches, technical difficulties or interruptions with our solutions; |
| • | changes in the growth rate of the markets in which we compete; |
| • | the length of the license term, amount prepaid and other material terms of subscriptions to our solutions sold during a period; |
| • | customers delaying purchasing decisions in anticipation of new developments or enhancements by us or our competitors or otherwise; |
| • | changes in customers’ budgets; |
| • | seasonal variations related to sales and marketing and other activities, such as expenses related to our customers; |
| • | our ability to increase, retain and incentivize the channel partners that market and sell our solutions; |
| • | our ability to integrate our solutions with our ecosystem partners’ technology; |
| • | our brand and reputation; |
| • | the timing of our adoption of new or revised accounting pronouncements applicable to public companies and the impact on our results of operations; |
| • | our ability to control costs, including our operating expenses; |
| • | our ability to hire, train and maintain our direct sales force; |
| • | unforeseen litigation and intellectual property infringement; |
| • | fluctuations in our effective tax rate; and |
| • | general economic and political conditions, both domestically and internationally, as well as economic conditions specifically affecting industries in which our customers operate. |
Any one of these or other factors discussed elsewhere in this prospectus, or the cumulative effect of some of these factors, may result in fluctuations in our revenue and operating results, meaning that quarter-to-quarter comparisons of our revenue, results of operations and cash flows may not necessarily be indicative of our future performance and may cause us to miss our guidance and analyst expectations and may cause our stock price to decline.
16
Table of Contents
In addition, we have historically experienced seasonality in entering into agreements with customers. We typically enter into a significantly higher percentage of agreements with new customers, as well as renewal agreements with existing customers, in the third and fourth quarters. The increase in customer agreements for the third quarter is primarily attributable to U.S. government and related agencies, and the increase in the fourth quarter is primarily attributable to large enterprise account buying patterns typical in the software industry. We expect that seasonality will continue to affect our operating results in the future and may reduce our ability to predict cash flow and optimize the timing of our operating expenses.
We face intense competition.
The market for cybersecurity solutions is fragmented, intensely competitive and constantly evolving. We compete with a range of established and emerging cybersecurity software and services vendors, as well as homegrown solutions. With the introduction of new technologies and market entrants, we expect the competitive environment to remain intense going forward. Our competitors include: vulnerability management and assessment vendors, including Qualys and Rapid7; diversified security software and services vendors, including IBM; endpoint security vendors with nascent vulnerability assessment capabilities, including Tanium and CrowdStrike; and providers of point solutions that compete with some of the features present in our solutions. We also compete against internally-developed efforts that often use open source solutions.
Some of our actual and potential competitors have significant advantages over us, such as longer operating histories, significantly greater financial, technical, marketing or other resources, stronger brand and business user recognition, larger intellectual property portfolios and broader global distribution and presence. In addition, our industry is evolving rapidly and is becoming increasingly competitive. Larger and more established companies may focus on cybersecurity and could directly compete with us. Smaller companies could also launch new products and services that we do not offer and that could gain market acceptance quickly.
Our competitors may be able to respond more quickly and effectively than we can to new or changing opportunities, technologies, standards or customer requirements. With the introduction of new technologies, the evolution of our offerings and new market entrants, we expect competition to intensify in the future. In addition, some of our larger competitors have substantially broader product offerings and can bundle competing products and services with other software offerings. As a result, customers may choose a bundled product offering from our competitors, even if individual products have more limited functionality than our solutions. These competitors may also offer their products at a lower price as part of this larger sale, which could increase pricing pressure on our offerings and cause the average sales price for our offerings to decline. These larger competitors are also often in a better position to withstand any significant reduction in capital spending, and will therefore not be as susceptible to economic downturns. One component of our enterprise platform involves assessing Cyber Exposure in a public cloud environment. We are dependent upon the public cloud providers to allow our solutions to access their cloud offerings. If one or more cloud providers elected to offer exclusively their own cloud security product or otherwise eliminate the ability of our solutions to access their cloud on behalf of our customers, our business and financial results could be harmed.
Furthermore, our current and potential competitors may establish cooperative relationships among themselves or with third parties that may further enhance their resources and products and services offerings in the markets we address. In addition, current or potential competitors may be acquired by third parties with greater available resources. As a result of such relationships and acquisitions, our current or potential competitors might be able to adapt more quickly to new technologies and customer needs, devote greater resources to the promotion or sale of their products and services, initiate or withstand substantial price competition, take advantage of other opportunities more readily or develop and expand their product and service offerings more quickly than we do. For all of these reasons, we may not be able to compete successfully against our current or future competitors.
17
Table of Contents
If we do not continue to innovate and offer solutions that address the dynamic cybersecurity landscape, we may not remain competitive.
The cybersecurity market is characterized by very rapid technological advances, changes in customer requirements, frequent new product introductions and enhancements and evolving industry standards. Our success also depends on continued innovation to provide features that make our solutions responsive to the cybersecurity landscape. While we continue to invest significant resources in research and development in order to ensure that our solutions continue to address the cyber security risks that our customers face, the introduction of solutions and services embodying new technologies could render our existing solutions or services obsolete or less attractive to customers. In addition, developing new solutions and product enhancements is expensive and time-consuming, and there is no assurance that such activities will result in significant cost savings, revenue or other expected benefits. For example, we plan to release a new product, Tenable.io Lumin, in late 2018, and there can be no assurance that product will offer the benefits we expect or generate customer interest. If we spend significant time and effort on research and development and are unable to generate an adequate return on our investment, our business and results of operations may be materially and adversely affected. Further, we may not be able to successfully anticipate or adapt to changing technology or customer requirements or the dynamic threat landscape on a timely basis, or at all, which would impair our ability to execute on our business strategy.
Our business and results of operations depend substantially on our customers renewing their subscriptions with us and expanding the number of IT assets or IP addresses under their subscriptions. Any decline in our customer renewals, terminations or failure to convince our customers to expand their use of subscription offerings would harm our business, results of operations, and financial condition.
Our subscription offerings are term-based and a majority of our subscription contracts entered into in 2017 were for one year in duration. In order for us to maintain or improve our results of operations, it is important that a high percentage of our customers renew their subscriptions with us when the existing subscription term expires, and renew on the same or more favorable terms. Our customers have no obligation to renew their subscriptions, and we may not be able to accurately predict customer renewal rates. In addition, the growth of our business depends in part on our customers expanding their use of subscription offerings and related services. Historically, some of our customers have elected not to renew their subscriptions with us for a variety of reasons, including as a result of changes in their strategic IT priorities, budgets, costs and, in some instances, due to competing solutions. Our retention rate may also decline or fluctuate as a result of a number of other factors, including our customers’ satisfaction or dissatisfaction with our software, the increase in the contract value of subscription and support contracts from new customers, the effectiveness of our customer support services, our pricing, the prices of competing products or services, mergers and acquisitions affecting our customer base, global economic conditions, and the other risk factors described in this prospectus. Additionally, many of our customers, including certain top customers, have the right to terminate their agreements with us for convenience and for other reasons. We cannot assure you that customers will maintain their agreements with us, renew subscriptions or increase their usage of our software. If our customers do not maintain or renew their subscriptions or renew on less favorable terms, or if we are unable to expand our customers’ use of our software, our business, results of operations, and financial condition may be harmed.
In addition, while customers are typically invoiced in advance, including multi-year contracts, and our contracts generally do not provide for refunds during the subscription or maintenance period, a small number of customers could take the position that provisions in their customer agreements give them the right to terminate their agreement with us, or allege a material breach of their agreement with us, due to or in connection with the sale of our common stock. Early termination of these customer agreements for these reasons would generally only allow us to retain fees already paid by the customer for services rendered prior to the termination. Termination of these agreements, or allegations that we have breached one of these agreements with them, could decrease our customer revenue and increase legal and administrative costs.
18
Table of Contents
Our brand, reputation and ability to attract, retain and serve our customers are dependent in part upon the reliable performance of our solutions and network infrastructure.
We have experienced, and may in the future experience, disruptions, outages and other performance problems due to a variety of factors, including infrastructure changes, human or software errors, capacity constraints and fraud or cybersecurity attacks. In some instances, we may not be able to identify the cause or causes of these performance problems within an acceptable period of time.
Prolonged delays or unforeseen difficulties in connection with adding capacity or upgrading our network architecture when required may cause our service quality to suffer. Problems with the reliability or security of our systems could harm our reputation. Damage to our reputation and the cost of remedying these problems could negatively affect our business, financial condition, and operating results.
Any disruptions or other performance problems with our solutions could harm our reputation and business and may damage our customers’ businesses. Interruptions in our service delivery might reduce our revenue, cause us to issue credits to customers, subject us to potential liability and cause customers to not renew their purchases of our solutions.
We must maintain and enhance our brand.
We believe that developing and maintaining widespread awareness of our brand in a cost-effective manner is critical to achieving widespread acceptance of our enterprise platform and attracting new customers. Brand promotion activities may not generate customer awareness or increase revenue and, even if they do, any increase in revenue may not offset the expenses we incur in building our brand. If we fail to successfully promote and maintain our brand, or incur substantial expenses, we may fail to attract or retain customers necessary to realize a sufficient return on our brand-building efforts, or to achieve the widespread brand awareness that is critical for broad customer adoption of our solutions.
We rely on third parties to maintain and operate certain elements of our network infrastructure.
We utilize data centers located in North America, Europe and Asia to operate and maintain certain elements of our own network infrastructure. Some elements of this complex system are operated by third parties that we do not control and that could require significant time to replace. We expect this dependence on third parties to continue. For example, Tenable.io is hosted on Amazon Web Services, or AWS, which provides us with computing and storage capacity. Interruptions in our systems or the third-party systems on which we rely, particularly AWS, whether due to system failures, computer viruses, physical or electronic break-ins or other factors, could affect the security or availability of our solutions, network infrastructure and website.
Our existing data center facilities and third-party hosting providers have no obligations to renew their agreements with us on commercially reasonable terms or at all, and certain of the agreements governing these relationships may be terminated by either party at any time, with no or limited notice. For example, our agreement with AWS allows AWS to terminate the agreement with 30 days’ written notice. Although we expect that we could receive similar services from other third parties, if any of our arrangements with third parties, including AWS, are terminated, we could experience interruptions on our platform and in our ability to make our platform available to customers, as well as downtime, delays and additional expenses in arranging alternative cloud infrastructure services.
It is possible that our customers and potential customers would hold us accountable for any breach of security affecting third parties’ infrastructure. We may incur significant liability from those customers and from third parties with respect to any such breach. Because our agreement with AWS limits their liability for damages, we may not be able to recover a material portion of our liabilities to our customers and third parties from AWS in the event of any breach affecting AWS systems.
19
Table of Contents
If we continue to grow, we may not be able to manage our growth effectively.
We have recently experienced a period of rapid growth in our headcount and operations. In particular, we grew from 751 employees as of December 31, 2016 to 984 employees as of December 31, 2017 and to 1,054 employees as of March 31, 2018. We have also significantly increased the size of our customer base over the last several years. We anticipate that we will continue to significantly expand our operations and headcount in the near term. Our growth has placed, and future growth will place, a significant strain on our management, administrative, operational and financial infrastructure. Our success will depend in part on our ability to manage this growth effectively. To manage the expected growth of our operations and personnel, we will need to continue to improve our operational, financial and management controls and our reporting systems and procedures. Failure to effectively manage our growth could result in difficulty or delays in deploying our solutions and services to customers, declines in quality or customer satisfaction, increases in costs, difficulties in introducing new features or other operational difficulties. Any of these difficulties could adversely impact our business performance and results of operations.
Our rapid growth also makes it difficult to evaluate our future prospects. Our ability to forecast our future operating results is subject to a number of uncertainties, including our ability to plan for and model future growth. If our assumptions regarding these uncertainties, which we use to plan our business, are incorrect or change in reaction to changes in our markets, or if we do not address these risks successfully, our operating and financial results could differ materially from our expectations, our business could suffer and the trading price of our stock may decline.
Organizations may be reluctant to purchase our enterprise platform offerings that are cloud-based due to the actual or perceived vulnerability of cloud solutions.
Some organizations, including those in the defense industry and highly regulated industries such as healthcare and financial services, have historically been reluctant to use cloud-based solutions for cybersecurity because they have concerns regarding the risks associated with the reliability or security of the technology delivery model associated with these solutions. If we or other software companies with cloud-based offerings experience security incidents, breaches of customer data, disruptions in service delivery or other problems, the market for cloud-based solutions as a whole may be negatively impacted, which in turn would negatively impact our revenue and our growth prospects.
Our sales cycle is long and unpredictable.
The timing of sales of our offerings is difficult to forecast because of the length and unpredictability of our sales cycle, particularly with large enterprises and with respect to certain of our solutions. We sell our solutions primarily to IT departments that are managing a growing set of user and compliance demands, which has increased the complexity of customer requirements to be met and confirmed during the sales cycle and prolonged our sales cycle. Our average sales cycle with an enterprise customer is approximately four months. Further, the length of time that potential customers devote to their testing and evaluation, contract negotiation and budgeting processes varies significantly, depending on the size of the organization and nature of the product or service under consideration. In addition, we might devote substantial time and effort to a particular unsuccessful sales effort, and as a result, we could lose other sales opportunities or incur expenses that are not offset by an increase in revenue, which could harm our business.
We rely on our third-party channel partner network of distributors and resellers to generate a substantial amount of our revenue.
Our success is dependent in part upon establishing and maintaining relationships with a variety of channel partners that we utilize to extend our geographic reach and market penetration. We use a two-tiered, indirect fulfillment model whereby we sell our products and services to our distributors, which in turn sell to our resellers, which then sell to our end users, which we call customers. We anticipate that we will continue to rely
20
Table of Contents
on this two-tiered sales model in order to help facilitate sales of our offerings as part of larger purchases in the United States and to grow our business internationally. In 2016, 2017 and the three months ended March 31, 2017 and 2018, we derived 80%, 83%, 80% and 86%, respectively, of our revenue from subscriptions and perpetual licenses sold through channel partners, and the percentage of revenue derived from channel partners may increase in future periods. Ingram Micro, Inc., a distributor, accounted for 42%, 45%, 41% and 45% of our revenue in 2016, 2017 and the three months ended March 31, 2017 and 2018, respectively, and 51% of our accounts receivable as of each of December 31, 2016 and 2017 and 45% as of March 31, 2018. At December 31, 2017, our channel partners accounted for over 20% of our new enterprise customer sales. Our agreements with our channel partners, including our agreement with Ingram Micro, are non-exclusive and do not prohibit them from working with our competitors or offering competing solutions, and some of our channel partners may have more established relationships with our competitors. Similarly, our channel partners have no obligations to renew their agreements with us on commercially reasonable terms or at all, and certain of the agreements governing these relationships may be terminated by either party at any time, with no or limited notice. For example, our agreement with Ingram Micro allows Ingram Micro to terminate the agreement in their discretion upon 30 days’ written notice to us. If our channel partners choose to place greater emphasis on products of their own or those offered by our competitors or a result of an acquisition, competitive factors or other reasons do not continue to market and sell our solutions in an effective manner or at all, our ability to grow our business and sell our solutions, particularly in key international markets, may be adversely affected. In addition, our failure to recruit additional channel partners, or any reduction or delay in their sales of our solutions and professional services or conflicts between channel sales and our direct sales and marketing activities may harm our results of operations. Finally, even if we are successful, our relationships with channel partners may not result in greater customer usage of our solutions and professional services or increased revenue.
A portion of our revenue is generated from subscriptions and perpetual licenses sold to domestic governmental entities, foreign governmental entities and other heavily regulated organizations, which are subject to a number of challenges and risks.
A portion of our revenue is generated from subscriptions and perpetual licenses sold to governmental entities in the United States. Additionally, many of our current and prospective customers, such as those in the financial services, energy, insurance and healthcare industries, are highly regulated and may be required to comply with more stringent regulations in connection with subscribing to and implementing our enterprise platform. Selling licenses to these entities can be highly competitive, expensive and time-consuming, often requiring significant upfront time and expense without any assurance that we will successfully complete a sale. Governmental demand and payment for our enterprise platform may also be impacted by public sector budgetary cycles and funding authorizations, with funding reductions or delays adversely affecting public sector demand for our enterprise platform. In addition, governmental entities have the authority to terminate contracts at any time for the convenience of the government, which creates risk regarding revenue anticipated under our existing government contracts.
Further, governmental and highly regulated entities often require contract terms that differ from our standard customer arrangements, including terms that can lead to those customers obtaining broader rights in our solutions than would be expected under a standard commercial contract and terms that can allow for early termination. The U.S. government will be able to terminate any of its contracts with us either for its convenience or if we default by failing to perform in accordance with the contract schedule and terms. Termination for convenience provisions would generally enable us to recover only our costs incurred or committed, settlement expenses, and profit on the work completed prior to termination. Termination for default provisions do not permit these recoveries and would make us liable for excess costs incurred by the U.S. government in procuring undelivered items from another source. Contracts with governmental and highly regulated entities may also include preferential pricing terms. In the United States, federal government agencies may promulgate regulations, and the President may issue executive orders, requiring federal contractors to adhere to different or additional requirements after a contract is signed. If we do not meet applicable requirements of law or contract, we could be subject to significant liability from our customers or regulators. Even if we do meet these requirements, the
21
Table of Contents
additional costs associated with providing our enterprise platform to government and highly regulated customers could harm our operating results. Moreover, changes in the underlying statutory and regulatory conditions that affect these types of customers could harm our ability to efficiently provide them access to our enterprise platform and to grow or maintain our customer base. In addition, engaging in sales activities to foreign governments introduces additional compliance risks, including risks specific to the U.S. Foreign Corrupt Practices Act of 1977, as amended, or the FCPA, the U.K. Bribery Act 2010 and other similar statutory requirements prohibiting bribery and corruption in the jurisdictions in which we operate.
Some of our revenue is derived from contracts with U.S. government entities, as well as subcontracts with higher-tier contractors. As a result, we are subject to federal contracting regulations, including the Federal Acquisition Regulation, or the FAR. Under the FAR, certain types of contracts require pricing that is based on estimated direct and indirect costs, which are subject to change.
In connection with our U.S. government contracts, we may be subject to government audits and review of our policies, procedures, and internal controls for compliance with contract terms, procurement regulations, and applicable laws. In certain circumstances, if we do not comply with the terms of a contract or with regulations or statutes, we could be subject to contract termination or downward contract price adjustments or refund obligations, could be assessed civil or criminal penalties, or could be debarred or suspended from obtaining future government contracts for a specified period of time. Any such termination, adjustment, sanction, debarment or suspension could have an adverse effect on our business.
In the course of providing our solutions and professional services to governmental entities, our employees and those of our channel partners may be exposed to sensitive government information. Any failure by us or our channel partners to safeguard and maintain the confidentiality of such information could subject us to liability and reputational harm, which could materially and adversely affect our results of operations and financial performance.
We may need to reduce our prices or change our pricing model to remain competitive.
Subscriptions and perpetual licenses to our enterprise platform are generally priced based on the number of IP addresses that can be monitored, or the total IT assets that can be monitored. We expect that we may need to change our pricing from time to time. As competitors introduce new products that compete with ours or reduce their prices, we may be unable to attract new customers or retain existing customers based on our historical pricing. We also must determine the appropriate price to enable us to compete effectively internationally. Moreover, mid- to large-size enterprises may demand substantial price discounts as part of the negotiation of sales contracts. As a result, we may be required or choose to reduce our prices or change our pricing model, which could adversely affect our business, operating results and financial condition.
Our pricing model subjects us to various challenges that could make it difficult for us to derive expected value from our customers.
Our enterprise platform offerings are generally priced based on the number of IT assets or IP addresses that a customer chooses to monitor. As the amount of IT assets or IP addresses within our customers’ organizations grows, we may face pressure from our customers regarding our pricing, which could adversely affect our revenue and operating margins.
Our subscription agreements and perpetual licenses generally provide that we can audit our customers’ use of our offerings to ensure compliance with the terms of such agreement or license and monitor an increase in IT assets and IP addresses being monitored. However, a customer may resist or refuse to allow us to audit their usage, in which case we may have to pursue legal recourse to enforce our rights under the agreement or license, which would require us to spend money, distract management and potentially adversely affect our relationship with our customers and users.
22
Table of Contents
If our enterprise platform offerings do not achieve sufficient market acceptance, our results of operations and competitive position will suffer.
We spend substantial amounts of time and money to research and develop and enhance our enterprise platform offerings to meet our customers’ rapidly evolving demands. In addition, we invest in efforts to continue to add capabilities to our existing products and enable the continued detection of new network vulnerabilities. We typically incur expenses and expend resources upfront to market, promote and sell our new and enhanced offerings. Therefore, when we develop and introduce new or enhanced offerings, they must achieve high levels of market acceptance in order to justify the amount of our investment in developing and bringing them to market. For example, if Tenable.io does not garner widespread market adoption and implementation, our operating results and competitive position could suffer.
Further, we may make enhancements to our offerings that our customers do not like, find useful or agree with. We may also discontinue certain features, begin to charge for certain features that are currently free or increase fees for any of our features or usage of our offerings.
Our new offerings or enhancements and changes to our existing offerings could fail to attain sufficient market acceptance for many reasons, including:
| • | failure to predict market demand accurately in terms of functionality and to supply offerings that meets this demand in a timely fashion; |
| • | defects, errors or failures; |
| • | negative publicity about their performance or effectiveness; |
| • | delays in releasing our new offerings or enhancements to our existing offerings to the market; |
| • | introduction or anticipated introduction of competing products by our competitors; |
| • | poor business conditions for our customers, causing them to delay IT purchases; and |
| • | reluctance of customers to purchase cloud-based offerings. |
If our new or enhanced offerings do not achieve adequate acceptance in the market, our competitive position will be impaired, and our revenue will be diminished. The adverse effect on our operating results may be particularly acute because of the significant research, development, marketing, sales and other expenses we will have incurred in connection with the new or enhanced offerings.
Our strategy of offering and deploying our solutions in the cloud, on-premises environments or using a hybrid approach causes us to incur increased expenses and may pose challenges to our business.
We offer and sell our enterprise platform for use in the cloud, on-premises environments or using a hybrid approach using the customer’s own infrastructure. Our cloud offering enables our customers to eliminate the burden of provisioning and maintaining infrastructure and to scale their usage of our solutions quickly, while our on-premises offering allows for the customer’s complete control over data security and software infrastructure. Historically, our solutions were developed in the context of the on-premises offering, and we have less operating experience offering and selling subscriptions to our solutions via our cloud offering. Although a substantial majority of our revenue has historically been generated from customers using our solutions on an on-premises basis, our customers are increasingly adopting our cloud offering. We expect that our customers will continue to move to our cloud offering and that it will become more central to our distribution model. We expect our gross profit to increase in absolute dollars and our gross margin to decrease to the extent that revenue from our cloud-based subscriptions increases as a percentage of total revenue, although our gross margin could fluctuate from period to period. To support both on-premises environments and cloud instances of our product, our support team must be trained on and learn multiple environments in which our solution is deployed, which is more expensive than supporting only a cloud offering. Moreover, we must engineer our software for an on-premises environment,
23
Table of Contents
cloud offering and hybrid installation, which we expect will cause us additional research and development expense that may impact our operating results. As more of our customers transition to the cloud, we may be subject to additional competitive pressures, which may harm our business. We are directing a significant portion of our financial and operating resources to implement a robust and secure cloud offering for our customers, but even if we continue to make these investments, we may be unsuccessful in growing or implementing our cloud offering in a way that competes successfully against our current and future competitors and our business, results of operations and financial condition could be harmed.
Our customers’ increased usage of our cloud-based offerings requires us to continually improve our computer network and infrastructure to avoid service interruptions or slower system performance.
As usage of our cloud-based offerings grows and as customers use them for more complicated applications, increased assets and with increased data requirements, we will need to devote additional resources to improving our platform architecture and our infrastructure in order to maintain the performance of our cloud offering. Any failure or delays in our computer systems could cause service interruptions or slower system performance. If sustained or repeated, these performance issues could reduce the attractiveness of our enterprise platform to customers. These performance issues could result in lost customer opportunities and lower renewal rates, any of which could hurt our revenue growth, customer loyalty and reputation.
A component of our growth strategy is dependent on our continued international expansion, which adds complexity to our operations.
We market and sell our solutions and professional services throughout the world and have personnel in many parts of the world. International operations generated 31% and 33% of our revenue in 2017 and the three months ended March 31, 2018, respectively. Our growth strategy is dependent, in part, on our continued international expansion. We expect to conduct a significant amount of our business with organizations that are located outside the United States, particularly in Europe and Asia. We cannot assure that our expansion efforts into international markets will be successful in creating further demand for our solutions and professional services outside of the United States or in effectively selling our solutions and professional services in the international markets that we enter. Our current international operations and future initiatives will involve a variety of risks, including:
| • | increased management, infrastructure and legal costs associated with having international operations; |
| • | reliance on channel partners; |
| • | trade and foreign exchange restrictions; |
| • | economic or political instability in foreign markets, including instability related to the United Kingdom’s referendum in June 2016 in which voters approved an exit from the European Union, commonly referred to as “Brexit”; |
| • | greater difficulty in enforcing contracts, accounts receivable collection and longer collection periods; |
| • | changes in regulatory requirements, including, but not limited to data privacy, data protection and data security regulations; |
| • | difficulties and costs of staffing, managing and potentially reorganizing foreign operations; |
| • | the uncertainty and limitation of protection for intellectual property rights in some countries; |
| • | costs of compliance with foreign laws and regulations and the risks and costs of non-compliance with such laws and regulations; |
| • | costs of compliance with U.S. laws and regulations for foreign operations, including the FCPA, import and export control laws, tariffs, trade barriers, economic sanctions and other regulatory or contractual limitations on our ability to sell or provide our solutions in certain foreign markets, and the risks and costs of non-compliance; |
24
Table of Contents
| • | requirements to comply with foreign privacy, data protection and information security laws and regulations and the risks and costs of noncompliance; |
| • | heightened risks of unfair or corrupt business practices in certain geographies and of improper or fraudulent sales arrangements that may impact financial results and result in restatements of, and irregularities in, financial statements; |
| • | the potential for political unrest, acts of terrorism, hostilities or war; |
| • | management communication and integration problems resulting from cultural differences and geographic dispersion; |
| • | costs associated with language localization of our solutions; and |
| • | costs of compliance with multiple and possibly overlapping tax structures. |
Our business, including the sales of our solutions and professional services by us and our channel partners, may be subject to foreign governmental regulations, which vary substantially from country to country and change from time to time. Our failure, or the failure by our channel partners, to comply with these regulations could adversely affect our business. Further, in many foreign countries it is common for others to engage in business practices that are prohibited by our internal policies and procedures or U.S. regulations applicable to us. Although we have implemented policies and procedures designed to comply with these laws and policies, there can be no assurance that our employees, contractors, channel partners and agents have complied, or will comply, with these laws and policies. Violations of laws or key control policies by our employees, contractors, channel partners or agents could result in delays in revenue recognition, financial reporting misstatements, fines, penalties or the prohibition of the importation or exportation of our solutions and could have a material adverse effect on our business and results of operations. If we are unable to successfully manage the challenges of international expansion and operations, our business and operating results could be adversely affected.
We rely on the performance of highly skilled personnel, including senior management and our engineering, professional services, sales and technology professionals.
We believe our success has depended, and continues to depend, on the efforts and talents of our senior management team and our highly skilled team members, including our sales personnel, professional services personnel and software engineers. We do not maintain key man insurance on any of our executive officers or key employees. From time to time, there may be changes in our senior management team resulting from the termination or departure of our executive officers and key employees. Our senior management and key employees are employed on an at-will basis, which means that they could terminate their employment with us at any time. The loss of any of our senior management or key employees could adversely affect our ability to build on the efforts they have undertaken and to execute our business plan, and we may not be able to find adequate replacements. We cannot ensure that we will be able to retain the services of any members of our senior management or other key employees.
Our ability to successfully pursue our growth strategy also depends on our ability to attract, motivate and retain our personnel. Competition for well-qualified employees in all aspects of our business, including sales personnel, professional services personnel and software engineers, is intense. Our recruiting efforts focus on elite universities and our primary recruiting competition are well-known, high-paying firms. Our continued ability to compete effectively depends on our ability to attract new employees and to retain and motivate existing employees. If we do not succeed in attracting well-qualified employees or retaining and motivating existing employees, our business would be adversely affected.
We must effectively develop and expand our sales and marketing capabilities.
Our ability to increase our customer base and achieve broader market acceptance of our Cyber Exposure solutions will depend to a significant extent on our ability to expand our sales and marketing operations. We plan
25
Table of Contents
to continue expanding our sales force and our third-party channel partner network of distributors and resellers both domestically and internationally; however, there is no assurance that we will be successful in attracting and retaining talented sales personnel or strategic partners or that any new sales personnel or strategic partners will be able to achieve productivity in a reasonable period of time or at all. We also plan to dedicate significant resources to sales and marketing programs, including through electronic marketing campaigns and trade event sponsorship and participation. All of these efforts will require us to invest significant financial and other resources and our business will be harmed if our efforts do not generate a correspondingly significant increase in revenue.
We must offer high-quality support.
Our customers rely on our personnel for support of our enterprise platform. High-quality support is important for the renewal of our agreements with existing customers and to our existing customers expanding the number of IP addresses or IT assets under their subscriptions. The importance of high-quality support will increase as we expand our business and pursue new customers. If we do not help our customers quickly resolve issues and provide effective ongoing support, our ability to sell new software to existing and new customers would suffer and our reputation with existing or potential customers would be harmed.
Our growth depends in part on the success of our strategic relationships with third parties.
In order to grow our business, we anticipate that we will continue to depend on relationships with strategic partners to provide broader customer coverage and solution delivery capabilities. We depend on partnerships with market leading technology companies to maintain and expand our Cyber Exposure ecosystem by integrating third party data into our platform. For example, we developed our Industrial Security solution in partnership with Siemens. Identifying partners, and negotiating and documenting relationships with them, requires significant time and resources. Our agreements with our strategic partners generally are non-exclusive and do not prohibit them from working with our competitors or offering competing solutions. Our competitors may be effective in providing incentives to third parties to favor their products or services or to prevent or reduce subscriptions to our services. If our partners choose to place greater emphasis on products of their own or those offered by our competitors or do not effectively market and sell our product, our ability to grow our business and sell software and professional services may be adversely affected. In addition, acquisitions of our partners by our competitors could result in a decrease in the number of our current and potential customers, as our partners may no longer facilitate the adoption of our solutions by potential customers.
If we are unsuccessful in establishing or maintaining our relationships with third parties, our ability to compete in the marketplace or to grow our revenue could be impaired and our operating results may suffer. Even if we are successful, we cannot assure you that these relationships will result in increased customer usage of our solutions or increased revenue.
Catastrophic events may disrupt our business.
Our corporate headquarters are located in Columbia, Maryland. The area around Washington, D.C. could be subject to terrorist attacks. Additionally, we rely on our network and third-party infrastructure and enterprise applications, internal technology systems and our website for our development, marketing, operational support, hosted services and sales activities. In the event of a major hurricane, earthquake or catastrophic event such as fire, power loss, telecommunications failure, cyberattack, war or terrorist attack, we may be unable to continue our operations and may endure system interruptions, reputational harm, delays in our software development, lengthy interruptions in our services, breaches of data security and loss of critical data, all of which could have an adverse effect on our future operating results.
26
Table of Contents
Future acquisitions could disrupt our business and adversely affect our business operations and financial results.
We have in the past acquired products and technologies from other parties, and we may choose to expand our current business by acquiring additional businesses or technologies in the future. Acquisitions involve many risks, including the following:
| • | an acquisition may negatively affect our financial results because it may require us to incur charges or assume substantial debt or other liabilities, may cause adverse tax consequences or unfavorable accounting treatment, may expose us to claims and disputes by third parties, including intellectual property claims and disputes, or may not generate sufficient financial return to offset additional costs and expenses related to the acquisition; |
| • | we may encounter difficulties or unforeseen expenditures in integrating the business, technologies, products, personnel or operations of any company that we acquire, particularly if key personnel of the acquired company decide not to work for us; |
| • | an acquisition may disrupt our ongoing business, divert resources, increase our expenses and distract our management; |
| • | an acquisition may result in a delay or reduction of customer purchases for both us and the company acquired due to customer uncertainty about continuity and effectiveness of service from either company; |
| • | we may encounter difficulties in, or may be unable to, successfully sell any acquired solutions; |
| • | an acquisition may involve the entry into geographic or business markets in which we have little or no prior experience or where competitors have stronger market positions; |
| • | our use of cash to pay for an acquisition would limit other potential uses for our cash; and |
| • | if we incur debt to fund such acquisition, such debt may subject us to material restrictions on our ability to conduct our business as well as financial maintenance covenants. |
The occurrence of any of these risks could have a material adverse effect on our business operations and financial results. In addition, we may only be able to conduct limited due diligence on an acquired company’s operations. Following an acquisition, we may be subject to unforeseen liabilities arising from an acquired company’s past or present operations and these liabilities may be greater than the warranty and indemnity limitations that we negotiate. Any unforeseen liability that is greater than these warranty and indemnity limitations could have a negative impact on our financial condition.
We may require additional capital to support business growth, and this capital might not be available on acceptable terms, if at all.
We expect that our existing cash and cash equivalents, together with the net proceeds that we receive in this offering, will be sufficient to meet our anticipated cash needs for working capital and capital expenditures for at least the next 12 months. However, we intend to continue to make investments to support our business growth and may require additional funds to respond to business challenges, including the need to develop new features or enhance our product, improve our operating infrastructure or acquire complementary businesses and technologies. Accordingly, we may need to engage in equity or debt financings to secure additional funds. If we raise additional funds through future issuances of equity or convertible debt securities, our existing stockholders could suffer significant dilution, and any new equity securities we issue could have rights, preferences and privileges superior to those of holders of our common stock. Our loan and security agreement with Silicon Valley Bank includes restrictive covenants relating to our capital raising activities and other financial and operational matters, which may make it more difficult for us to obtain additional capital and to pursue business opportunities, including potential acquisitions, and any debt financing that we secure in the future could have similar restrictive
27
Table of Contents
covenants. We may not be able to obtain additional financing on terms favorable to us, if at all. If we are unable to obtain adequate financing or financing on terms satisfactory to us when we require it, our ability to continue to support our business growth and to respond to business challenges could be significantly impaired, and our business may be adversely affected.
The nature of our business requires the application of complex revenue recognition rules. Significant changes in current principles will affect our consolidated financial statements and changes in financial accounting standards or practices may cause adverse, unexpected financial reporting fluctuations and harm our results of operations.
The accounting rules and regulations that we must comply with are complex and subject to interpretation by the Financial Accounting Standards Board, or FASB, the Securities and Exchange Commission, or SEC, and various bodies formed to promulgate and interpret appropriate accounting principles. In addition, many companies’ accounting disclosures are being subjected to heightened scrutiny by regulators and the public. Further, the accounting rules and regulations are continually changing in ways that could impact our financial statements.
For example, in May 2014, the FASB issued new accounting guidance on revenue recognition in the form of ASU No. 2014-09, Revenue from Contracts with Customers (Topic 606), or ASC 606. The core principle of ASC 606 is that an entity should recognize revenue to depict the transfer of promised goods or services to customers in an amount that reflects the consideration to which the entity expects to be entitled in exchange for those goods or services. We early adopted ASC 606 as of January 1, 2017. The most significant impact of adopting ASC 606 was the deferral of perpetual license revenue over an estimated economic life, including estimated maintenance renewal periods, whereas under previous guidance we recognized perpetual license revenue upon delivery of the perpetual license. The impact of the adoption of ASC 606 on our 2017 revenue was a net increase of $3.5 million after giving effect to the recognition of perpetual license revenue from prior year sales and the deferral of perpetual license revenue from 2017 sales. Additionally, the incremental costs of obtaining a contract with a customer are deferred and will be amortized over a longer estimated period of benefit, whereas under previous guidance such costs were recognized immediately or amortized over the contract term.
If our estimates or judgments relating to our critical accounting policies prove to be incorrect or financial reporting standards or interpretations change, our results of operations could be adversely affected.
The preparation of financial statements in conformity with generally accepted accounting principles in the United States, or U.S. GAAP, requires management to make estimates and assumptions that affect the amounts reported in the consolidated financial statements and accompanying notes. We base our estimates on historical experience and on various other assumptions that we believe to be reasonable under the circumstances, as provided in “Management’s Discussion and Analysis of Financial Condition and Results of Operations.” The results of these estimates form the basis for making judgments about the carrying values of assets, liabilities and equity, and the amount of revenue and expenses that are not readily apparent from other sources. Significant assumptions and estimates used in preparing our consolidated financial statements include estimated economic life of perpetual licenses for revenue recognition, the estimated period of benefit for deferred commissions, income taxes and the related valuation allowance and stock-based compensation. Our results of operations may be adversely affected if our assumptions change or if actual circumstances differ from those in our assumptions, which could cause our results of operations to fall below the expectations of securities analysts and investors, resulting in a decline in the trading price of our common stock.
Additionally, we regularly monitor our compliance with applicable financial reporting standards and review new pronouncements and drafts thereof that are relevant to us. As a result of new standards, changes to existing standards and changes in their interpretation, we might be required to change our accounting policies, alter our operational policies and implement new or enhance existing systems so that they reflect new or amended financial reporting standards, or we may be required to restate our published financial statements. Such changes
28
Table of Contents
to existing standards or changes in their interpretation may have an adverse effect on our reputation, business, financial position and profit, or cause an adverse deviation from our revenue and operating profit target, which may negatively impact our financial results.
Our operating results may be negatively affected if we are required to pay additional state sales tax, value added, or other transaction taxes, and we could be subject to liability with respect to all or a portion of past or future sales.
We currently collect and remit sales and use, value added and other transaction taxes in certain of the jurisdictions where we do business based on our assessment of the amount of taxes owed by us in such jurisdictions. However, in some jurisdictions in which we do business, we do not believe that we owe such taxes, and therefore we currently do not collect and remit such taxes in those jurisdictions or record contingent tax liabilities in respect of those jurisdictions.
Further, due to uncertainty in the application and interpretation of applicable tax laws in various jurisdictions, we may be exposed to sales and use, value added or other transaction tax liability. A successful assertion that we are required to pay additional taxes in connection with sales of our solutions, or the imposition of new laws or regulations requiring the payment of additional taxes, would create increased costs and administrative burdens for us. If we are subject to additional taxes and determine to offset such increased costs by collecting and remitting sales taxes from our customers, or otherwise passing those costs through to our customers, companies may be discouraged from using our solutions. Any increased tax burden may decrease our ability or willingness to compete in relatively burdensome tax jurisdictions, result in substantial tax liabilities related to past sales or otherwise harm our business and operating results.
Our ability to use net operating losses to offset future taxable income may be subject to certain limitations.
As of December 31, 2017 we had federal, state and foreign net operating loss carryforwards, or NOLs, of $103.7 million, $38.6 million, and $18.4 million, respectively, available to offset future taxable income, which begin to expire in 2030. A lack of future taxable income would adversely affect our ability to utilize these NOLs before they expire.
In addition, under the provisions of the Internal Revenue Code of 1986, as amended, or the Internal Revenue Code, substantial changes in our ownership may limit the amount of pre-change NOLs that can be utilized annually in the future to offset taxable income. Section 382 of the Internal Revenue Code imposes limitations on a company’s ability to use NOLs if a company experiences a more-than-50-percent ownership change over a three-year testing period. Based upon our analysis as of December 31, 2017, we have determined that we do not expect these limitations to impair our ability to use our NOLs prior to expiration. However, if changes in our ownership occur in the future, our ability to use our NOLs may be further limited. For these reasons, we may not be able to utilize a material portion of the NOLs, even if we achieve profitability.
Uncertainties in the interpretation and application of the 2017 Tax Cuts and Jobs Act could materially affect our tax obligations and effective tax rate.
Forecasts of our income tax position and effective tax rate for financial accounting purposes are complex and subject to uncertainty because our income tax position for each year combines the effects of a mix of profits earned and losses incurred by us in various tax jurisdictions with a broad range of income tax rates, as well as changes in the valuation of deferred tax assets and liabilities, the impact of various accounting rules and changes to these rules and tax laws, the results of examinations by various tax authorities, and the impact of any acquisition, business combination or other reorganization or financing transaction. To forecast our global tax rate, we estimate our pre-tax profits and losses by jurisdiction and forecast our tax expense by jurisdiction. If the mix of profits and losses, our ability to use tax credits, our assessment of the need for valuation allowances, or
29
Table of Contents
effective tax rates by jurisdiction is different than those estimated, our actual tax rate could be materially different than forecasted, which could have a material impact on our results of business, financial condition and results of operations.
On December 22, 2017, U.S. Federal tax reform was enacted with the signing of the Tax Cuts and Jobs Act, or TCJA. Notable provisions of the TCJA include significant changes to corporate taxation, including reduction of the corporate tax rate from a top marginal rate of 35% to a flat rate of 21%, limitation of the tax deduction for interest expense to 30% of adjusted earnings (except for certain small businesses), limitation of the deduction for net operating losses to 80% of current year taxable income and elimination of net operating loss carrybacks, one time taxation of offshore earnings at reduced rates regardless of whether they are repatriated, elimination of U.S. tax on foreign earnings (subject to certain important exceptions), immediate deductions for certain new investments instead of deductions for depreciation expense over time, and modifying or repealing many business deductions and credits.
While the changes from the TCJA are generally effective beginning in 2018, U.S. GAAP accounting for income taxes requires the effect of a change in tax laws or rates to be recognized in income from continuing operations for the period that includes the enactment date. Due to the complexities involved in accounting for the enactment of the TCJA, the Securities and Exchange Commission published Staff Accounting Bulletin No. 118, which allows us to record provisional amounts in earnings for the year ended December 31, 2017. Where reasonable estimates can be made, the provisional accounting should be based on such estimates. When no reasonable estimate can be made, the provisional accounting may be based on the tax law in effect before the TCJA. We are required to complete our tax accounting for the TCJA in the period when we have obtained, prepared, and analyzed the information to complete the income tax accounting, or by December 22, 2018, whichever date comes first.
We have not completed our accounting for the tax effects of enactment of the TCJA; however, as we describe in Note 10 to our consolidated financial statements appearing elsewhere in this prospectus, we have made reasonable estimates of the effects of the TCJA in certain cases in our financial statements that are included as a component of income tax expense. The U.S. Department of Treasury has broad authority to issue regulations and interpretative guidance that may significantly impact how we will apply the law and impact our results of operations in the period issued. As additional regulatory guidance is issued by the applicable taxing authorities, as accounting treatment is clarified, as we perform additional analysis on the application of the law, and as we refine estimates in calculating the effect, our final analysis, which will be recorded in the period completed, may be different from our current provisional amounts, which could materially affect our tax obligations and effective tax rate.
We are subject to anti-corruption laws, anti-bribery and similar laws with respect to our domestic and international operations, and non-compliance with such laws can subject us to criminal and/or civil liability and materially harm our business and reputation.
We are subject to the FCPA, the U.S. domestic bribery statute contained in 18 U.S.C. § 201, the U.S. Travel Act, the U.K. Bribery Act 2010, and other anti-corruption laws in countries in which we conduct activities. Anti-corruption laws are interpreted broadly and prohibit our company from authorizing, offering, or providing, directly or indirectly, improper payments or benefits to recipients in the public or private sector. We use third-party law firms, accountants, and other representatives for regulatory compliance, sales, and other purposes in several countries. We sell directly and indirectly, via third-party representatives, to the U.S. and non-U.S. government sectors, and our employees and third-party representatives interact with government officials. We can be held liable for the corrupt or other illegal activities of these third-party representatives, our employees, contractors, and other agents, even if we do not explicitly authorize such activities. Noncompliance with these laws could subject us to whistleblower complaints, investigations, sanctions, settlements, prosecution, other enforcement actions, disgorgement of profits, significant fines, damages, other civil and criminal penalties or injunctions, suspension and/or debarment from contracting with certain persons, the loss of export privileges,
30
Table of Contents
reputational harm, adverse media coverage, and other collateral consequences. If any subpoenas or investigations are launched, or governmental or other sanctions are imposed, or if we do not prevail in any possible civil or criminal litigation, our reputation, business, results of operations and financial condition could be materially harmed. In addition, responding to any action will likely result in a materially significant diversion of management’s attention and resources and significant defense costs and other professional fees. Enforcement actions and sanctions could further harm our business, results of operations, and financial condition. Moreover, as an issuer of securities, we also are subject to the accounting and internal controls provisions of the FCPA. These provisions require us to maintain accurate books and records and a system of internal controls sufficient to detect and prevent corrupt conduct. Failure to abide by these provisions may have an adverse effect on our business, operations or financial condition.
We are subject to governmental export and import controls and economic and trade sanctions that could impair our ability to conduct business in international markets and subject us to liability if we are not in compliance with applicable laws and regulations.
The United States and other countries maintain and administer export and import laws and regulations. Our products are subject to U.S. export control and import laws and regulations, including the U.S. Export Administration Regulations, U.S. Customs regulations, and various economic and trade sanctions administered by the U.S. Treasury Department’s Office of Foreign Assets Control. We are required to comply with these laws and regulations. If we fail to comply with such laws and regulations, we and certain of our employees could be subject to substantial civil or criminal penalties, including the possible loss of export or import privileges; fines, which may be imposed on us and responsible employees or managers; and, in extreme cases, the incarceration of responsible employees or managers. Obtaining the necessary authorizations, including any required license, for a particular sale may be time-consuming, is not guaranteed and may result in the delay or loss of sales opportunities. In addition, changes in our solutions, or changes in applicable export or import laws and regulations may create delays in the introduction and sale of our products in international markets or, in some cases, prevent the export or import of our solutions to certain countries, governments or persons altogether. Any change in export or import laws and regulations or economic or trade sanctions, shift in the enforcement or scope of existing laws and regulations, or change in the countries, governments, persons or technologies targeted by such laws and regulations could also result in decreased use of our products, or in our decreased ability to export or sell our products to existing or potential customers. Any decreased use of our products or limitation on our ability to export or sell our products would likely adversely affect our business, financial condition, and results of operations.
Furthermore, we incorporate encryption technology into certain of our solutions. Various countries regulate the import of certain encryption technology, including import permitting and licensing requirements, and have enacted laws that could limit our ability to distribute our solutions or could limit our customers’ ability to implement our solutions in those countries. Encrypted products and the underlying technology may also be subject to export control restrictions. Governmental regulation of encryption technology and regulation of imports or exports of encryption solutions, or our failure to obtain required import or export approval for our solutions, could harm our international sales and adversely affect our revenue. Compliance with applicable laws and regulations regarding the export and import of our solutions, including with respect to new solutions or changes in existing solutions, may create delays in the introduction of our solutions in international markets, prevent our customers with international operations from deploying our solutions globally or, in some cases, could prevent the export or import of our solutions to certain countries, governments, entities or persons altogether.
Moreover, U.S. export control laws and economic sanctions programs prohibit the shipment of certain products and services to countries, governments and persons that are subject to U.S. economic embargoes and trade sanctions. Any violations of such economic embargoes and trade sanction regulations could have negative consequences, including government investigations, penalties and reputational harm.
31
Table of Contents
Risks Related to Government Regulation, Data Collection and Intellectual Property
Our business could be adversely affected if our employees cannot obtain and maintain required security clearances or we cannot establish and maintain a required facility security clearance.
Certain U.S. government contracts may require our employees to maintain various levels of security clearances, and may require us to maintain a facility security clearance, to comply with Department of Defense, or DoD, requirements. The DoD has strict security clearance requirements for personnel who perform work in support of classified programs. Obtaining and maintaining security clearances for employees involves a lengthy process, and it is difficult to identify, recruit and retain employees who already hold security clearances. If our employees are unable to obtain security clearances in a timely manner, or at all, or if our employees who hold security clearances are unable to maintain their clearances or terminate employment with us, then a customer requiring classified work could terminate an existing contract or decide not to renew the contract upon its expiration. To the extent we are not able to obtain or maintain a facility security clearance, we may not be able to bid on or win new classified contracts, and existing contracts requiring a facility security clearance could be terminated.
Any failure to protect our proprietary technology and intellectual property rights could substantially harm our business and operating results.
Our success and ability to compete depend in part on our ability to protect our proprietary technology and intellectual property. To safeguard these rights, we rely on a combination of patent, trademark, copyright and trade secret laws and contractual protections in the United States and other jurisdictions, all of which provide only limited protection and may not now or in the future provide us with a competitive advantage.
As of March 31, 2018, we had 14 issued patents and three patent applications pending in the United States relating to our technology. We cannot assure you that any patents will issue from any patent applications, that patents that issue from such applications will give us the protection that we seek or that any such patents will not be challenged, invalidated or circumvented. Any patents that may issue in the future from our pending or future patent applications may not provide sufficiently broad protection and may not be enforceable in actions against alleged infringers. Obtaining and enforcing software patents in the United States is becoming increasingly challenging. Any patents we have obtained or may obtain in the future may be found to be invalid or unenforceable in light of recent and future changes in the law. We have registered the “Tenable,” “Nessus” and “Tenable.io” names and our Tenable logo in the United States and certain other countries. We have registrations and/or pending applications for additional marks in the United States; however, we cannot assure you that any future trademark registrations will be issued for pending or future applications or that any registered trademarks will be enforceable or provide adequate protection of our proprietary rights. While we have copyrights in our software we do not typically register such copyrights with the Copyright Office. This failure to register the copyrights in our software may preclude us from obtaining statutory damages for infringement under certain circumstances. We also license software from third parties for integration into our software, including open source software and other software available on commercially reasonable terms. We cannot assure you that such third parties will maintain such software or continue to make it available.
In order to protect our unpatented proprietary technologies and processes, we rely on trade secret laws and confidentiality and invention assignment agreements with our employees, consultants, strategic partners, vendors and others. Despite our efforts to protect our proprietary technology and trade secrets, unauthorized parties may attempt to misappropriate, copy, reverse engineer or otherwise obtain and use them. In addition, others may independently discover our trade secrets, in which case we would not be able to assert trade secret rights, or develop similar technologies and processes. Further, several agreements may give customers limited rights to access portions of our proprietary source code, and the contractual provisions that we enter into may not prevent unauthorized use or disclosure of our proprietary technology or intellectual property rights and may not provide an adequate remedy in the event of unauthorized use or disclosure of our proprietary technology or intellectual property rights. Moreover, policing unauthorized use of our technologies, trade secrets and intellectual property
32
Table of Contents
is difficult, expensive and time-consuming, particularly in foreign countries where the laws may not be as protective of intellectual property rights as those in the United States and where mechanisms for enforcement of intellectual property rights may be weak. To the extent that we expand our activities outside of the United States, our exposure to unauthorized copying and use of our solutions and proprietary information may increase. We may be unable to determine the extent of any unauthorized use or infringement of our solutions, technologies or intellectual property rights.
There can be no assurance that the steps that we take will be adequate to protect our proprietary technology and intellectual property, that others will not develop or patent similar or superior technologies, solutions or services, or that our trademarks, patents, and other intellectual property will not be challenged, invalidated or circumvented by others. Furthermore, effective trademark, patent, copyright, and trade secret protection may not be available in every country in which our software is available or where we have employees or independent contractors. In addition, the legal standards relating to the validity, enforceability, and scope of protection of intellectual property rights in internet and software-related industries are uncertain and still evolving.
In order to protect our intellectual property rights, we may be required to spend significant resources to monitor and protect these rights. Litigation brought to protect and enforce our intellectual property rights could be costly, time-consuming and distracting to management and could result in the impairment or loss of portions of our intellectual property. Furthermore, our efforts to enforce our intellectual property rights may be met with defenses, counterclaims and countersuits attacking the validity and enforceability of our intellectual property rights. Our failure to secure, protect and enforce our intellectual property rights could seriously adversely affect our brand and adversely impact our business.
We may be subject to intellectual property rights claims by third parties, which are extremely costly to defend, could require us to pay significant damages and could limit our ability to use certain technologies.
Companies in the software and technology industries, including some of our current and potential competitors, own significant numbers of patents, copyrights, trademarks and trade secrets and frequently enter into litigation based on allegations of infringement or other violations of intellectual property rights. In addition, many of these companies have the capability to dedicate substantially greater resources to enforce their intellectual property rights and to defend claims that may be brought against them. The litigation may involve patent holding companies or other adverse patent owners that have no relevant product revenue and against which our patents may therefore provide little or no deterrence. In the past, we have been subject to allegations of patent infringement that were unsuccessful, and we expect in the future to be subject to claims that we have misappropriated, misused, or infringed other parties’ intellectual property rights, and, to the extent we gain greater market visibility or face increasing competition, we face a higher risk of being the subject of intellectual property infringement claims, which is not uncommon with respect to enterprise software companies. We may in the future be subject to claims that employees or contractors, or we, have inadvertently or otherwise used or disclosed trade secrets or other proprietary information of our competitors or other parties. To the extent that intellectual property claims are made against our customers based on their usage of our technology, we have certain obligations to indemnify and defend such customers from those claims. The term of our contractual indemnity provisions often survives termination or expiration of the applicable agreement. Large indemnity payments, defense costs or damage claims from contractual breach could harm our business, results of operations and financial condition.
There may be third-party intellectual property rights, including issued or pending patents that cover significant aspects of our technologies or business methods. Any intellectual property claims, with or without merit, could be very time-consuming, could be expensive to settle or litigate, could divert our management’s attention and other resources and could result in adverse publicity. These claims could also subject us to making substantial payments for legal fees, settlement payments, and other costs or damages, potentially including treble damages if we are found to have willfully infringed patents or copyrights. These claims could also result in our
33
Table of Contents
having to stop making, selling, offering for sale, or using technology found to be in violation of a third party’s rights. We might be required to seek a license for the third-party intellectual property rights, which may not be available on reasonable terms or at all. Even if a license is available to us, we may be required to pay significant upfront fees, milestones or royalties, which would increase our operating expenses. Moreover, to the extent we only have a license to any intellectual property used in our solutions, there may be no guarantee of continued access to such intellectual property, including on reasonable terms. As a result, we may be required to develop alternative non-infringing technology, which could require significant effort and expense. If a third party is able to obtain an injunction preventing us from accessing such third-party intellectual property rights, or if we cannot license or develop technology for any infringing aspect of our business, we would be forced to limit or stop sales of our software or cease business activities covered by such intellectual property, and may be unable to compete effectively. Any of these results would adversely affect our business, results of operations, financial condition and cash flows.
Portions of our solutions utilize open source software, and any failure to comply with the terms of one or more of these open source licenses could negatively affect our business.
Our software contains software made available by third parties under so-called “open source” licenses. From time to time, there have been claims against companies that distribute or use open source software in their products and services, asserting that such open source software infringes the claimants’ intellectual property rights. We could be subject to suits by parties claiming that what we believe to be licensed open source software infringes their intellectual property rights. Use and distribution of open source software may entail greater risks than use of third-party commercial software, as open source licensors generally do not provide warranties or other contractual protections regarding infringement claims or the quality of the code. In addition, certain open source licenses require that source code for software programs that are subject to the license be made available to the public and that any modifications or derivative works to such open source software continue to be licensed under the same terms. Further, certain open source licenses also include a provision that if we enforce any patents against the software programs that are subject to the license, we would lose the license to such software. If we were to fail to comply with the terms of such open source software licenses, such failures could result in costly litigation, lead to negative public relations or require that we quickly find replacement software which may be difficult to accomplish in a timely manner.
Although we monitor our use of open source software in an effort both to comply with the terms of the applicable open source licenses and to avoid subjecting our software to conditions we do not intend, the terms of many open source licenses have not been interpreted by U.S. courts, and there is a risk that these licenses could be construed in a way that could impose unanticipated conditions or restrictions on our ability to commercialize our product or operate our business. By the terms of certain open source licenses, we could be required to release the source code of our software and to make our proprietary software available under open source licenses, if we combine or distribute our software with open source software in a certain manner. In the event that portions of our software are determined to be subject to an open source license, we could be required to publicly release the affected portions of our source code, re-engineer all, or a portion of, that software or otherwise be limited in the licensing of our software, each of which could reduce or eliminate the value of our product. Many of the risks associated with usage of open source software cannot be eliminated, and could negatively affect our business, results of operations and financial condition.
Risks Related to Our Common Stock and this Offering
Our stock price may be volatile, and you may lose some or all of your investment.
There has been no public market for our common stock prior to this offering. The initial public offering price for the shares of our common stock will be determined by negotiations between us and the representatives of the underwriters and may not be indicative of the market price of our common stock following this offering. The market price of our common stock following this offering may fluctuate substantially and may be lower than
34
Table of Contents
the initial public offering price. The market price of our common stock following this offering will depend on a number of factors, including those described in this “Risk Factors” section, many of which are beyond our control and may not be related to our operating performance. These fluctuations could cause you to lose all or part of your investment in our common stock, since you might not be able to sell your shares at or above the price you paid in this offering. Factors that could cause fluctuations in the market price of our common stock include the following:
| • | actual or anticipated changes or fluctuations in our operating results; |
| • | the financial projections we may provide to the public, any changes in these projections or our failure to meet these projections; |
| • | announcements by us or our competitors of new products or new or terminated significant contracts, commercial relationships or capital commitments; |
| • | industry or financial analyst or investor reaction to our press releases, other public announcements and filings with the SEC; |
| • | rumors and market speculation involving us or other companies in our industry; |
| • | price and volume fluctuations in the overall stock market from time to time; |
| • | changes in operating performance and stock market valuations of other technology companies generally, or those in our industry in particular; |
| • | the expiration of market stand-off or contractual lock-up agreements and sales of shares of our common stock by us or our stockholders; |
| • | failure of industry or financial analysts to maintain coverage of us, changes in financial estimates by any analysts who follow our company, or our failure to meet these estimates or the expectations of investors; |
| • | actual or anticipated developments in our business or our competitors’ businesses or the competitive landscape generally; |
| • | litigation involving us, our industry or both, or investigations by regulators into our operations or those of our competitors; |
| • | developments or disputes concerning our intellectual property rights or our solutions, or third-party proprietary rights; |
| • | announced or completed acquisitions of businesses or technologies by us or our competitors; |
| • | new laws or regulations or new interpretations of existing laws or regulations applicable to our business; |
| • | any major changes in our management or our board of directors; |
| • | general economic conditions and slow or negative growth of our markets; and |
| • | other events or factors, including those resulting from war, incidents of terrorism or responses to these events. |
Recently, the stock markets have experienced extreme price and volume fluctuations that have affected and continue to affect the market prices of equity securities of many companies. These fluctuations have often been unrelated or disproportionate to the operating performance of those companies. Broad market and industry fluctuations, as well as general economic, political, regulatory and market conditions, may negatively impact the market price of our common stock. If the market price of our common stock after this offering does not exceed the initial public offering price, you may lose some or all of your investment. In the past, companies that have experienced volatility in the market price of their securities have been subject to securities class action litigation. We may be the target of this type of litigation in the future, which could result in substantial costs and divert our management’s attention.
35
Table of Contents
No public market for our common stock currently exists, and an active public trading market may not develop or be sustained following this offering.
Prior to this offering, there has been no public market or active private market for our common stock. Application has been made to list our common stock on the Nasdaq Global Market; however, an active public trading market may not develop following the completion of this offering or, if developed, may not be sustained. The lack of an active market may impair your ability to sell your shares at the time you wish to sell them or at a price that you consider reasonable. The lack of an active market may also reduce the fair value of your shares. An inactive market may also impair our ability to raise capital to continue to fund operations by selling shares and may impair our ability to acquire other companies or technologies by using our shares as consideration. We cannot predict the prices at which our common stock will trade. The initial public offering price of our common stock will be determined by negotiations between us and the underwriters and may not bear any relationship to the market price at which our common stock will trade after this offering or to any other established criteria of the value of our business and prospects.
If securities or industry analysts do not publish research or reports about our business, or publish negative reports about our business, our stock price and trading volume could decline.
The trading market for our common stock will depend, in part, on the research and reports that securities or industry analysts publish about us or our business. We do not control these analysts or the content and opinions included in their reports. As a new public company, we may be slow to attract research coverage and the analysts who publish information about our common stock will have had relatively little experience with our company, which could affect their ability to accurately forecast our results and make it more likely that we fail to meet their estimates. If our financial performance fails to meet analyst estimates or one or more of the analysts who cover us downgrade our shares or change their opinion of our shares, our share price would likely decline. In addition, the stock prices of many companies in the technology industry have declined significantly after those companies have failed to meet, or significantly exceed, the financial guidance publicly announced by the companies or the expectations of analysts. If our financial results fail to meet, or exceed, our announced guidance or the expectations of analysts or public investors, analysts could downgrade our common stock or publish unfavorable research about us. If one or more of these analysts cease coverage of our company or fail to regularly publish reports on us, we could lose visibility in the financial markets, which could cause our share price or trading volume to decline.
Sales of substantial amounts of our common stock in the public markets, or the perception that they might occur, could reduce the price that our common stock might otherwise attain and may dilute your voting power and your ownership interest in us.
After this offering, there will be shares of our common stock outstanding, assuming no exercise of the underwriters’ over-allotment option. Sales of a substantial number of shares of our common stock in the public market after this offering, or the perception that these sales might occur, could depress the market price of our common stock, impair our ability to raise capital through the sale of additional equity securities and make it more difficult for you to sell your common stock at a time and price that you deem appropriate. Of our issued and outstanding shares of our common stock, all of the shares sold in this offering will be freely transferable without restrictions or further registration under the Securities Act of 1933, as amended, or the Securities Act, except for any shares acquired by our affiliates, as defined in Rule 144 under the Securities Act. The remaining shares outstanding after this offering will be restricted as a result of securities laws, lock-up agreements or other contractual restrictions that restrict transfers for 180 days after the date of this prospectus.
Additionally, following the completion of this offering, stockholders holding approximately shares of our common stock outstanding, will, after the expiration of the lock-up periods specified above, have the right, subject to various conditions and limitations, to include their shares of our common stock in registration statements relating to our securities. If the offer and sale of these shares are registered, they will be freely
36
Table of Contents
tradable without restriction under the Securities Act. Shares of common stock sold under such registration statements can be freely sold in the public market. In the event such registration rights are exercised and a large number of shares of common stock are sold in the public market, such sales could reduce the trading price of our common stock. See “Description of Capital Stock—Registration Rights” and “Shares Eligible for Future Sale—Lock-Up Agreements” for a more detailed description of these registration rights and the lock-up period.
We intend to file a registration statement on Form S-8 under the Securities Act to register the total number of shares of our common stock that may be issued under our equity incentive plans. See “Shares Eligible for Future Sale—Form S-8 Registration Statements” for a more detailed description of the shares of common stock that will be available for future sale upon the registration and issuance of such shares, subject to any applicable vesting or lock-up period or other restrictions provided under the terms of the applicable plan and/or the option agreements entered into with the option holders.
In addition, in the future we may issue common stock or other securities convertible into shares of our common stock from time to time in connection with a financing, acquisition, investment or otherwise. The number of new shares of our common stock issued in connection with raising additional capital could constitute a material portion of the then outstanding shares of our common stock, which could result in substantial dilution to our existing stockholders and cause the market price of our common stock to decline.
Concentration of ownership among our existing directors, executive officers and holders of 5% or more of our outstanding common stock may prevent new investors from influencing significant corporate decisions, including the ability to influence the outcome of director elections and other matters requiring stockholder approval.
Following this offering, our directors, executive officers and holders of more than 5% of our common stock, some of whom are represented on our board of directors, together with their affiliates will beneficially own % of the voting power of our outstanding capital stock. As a result, these stockholders will, immediately following this offering, be able to determine the outcome of matters submitted to our stockholders for approval, including the election of directors and approval of significant corporate transactions. Some of these persons or entities may have interests that are different from yours, and this ownership could affect the value of your shares of common stock if, for example, these stockholders elect to delay, defer or prevent a change in corporate control, merger, consolidation, takeover or other business combination. This concentration of ownership may also adversely affect the market price of our common stock.
We have broad discretion to determine how to use the funds raised in this offering, and we may use them in ways that may not enhance our operating results or the price of our common stock.
The principal purposes of this offering are to increase our capitalization and financial flexibility, to create a public market for our stock and thereby enable access to the public equity markets for our employees and stockholders, to obtain additional capital and to increase our visibility in the marketplace. We currently intend to use a significant portion of the net proceeds from this offering for general corporate purposes, including for any of the purposes described in “Use of Proceeds.” However, we do not currently have any specific or preliminary plans for the net proceeds from this offering and will have broad discretion in how we use the net proceeds of this offering. We could spend the proceeds from this offering in ways that our stockholders may not agree with or that do not yield a favorable return. You will not have the opportunity as part of your investment decision to assess whether the net proceeds are being used appropriately. Investors in this offering will need to rely upon the judgment of our management with respect to the use of proceeds. If we do not use the net proceeds that we receive in this offering effectively, our business, financial condition, results of operations and prospects could be harmed, and the market price of our common stock could decline.
37
Table of Contents
The requirements of being a public company may strain our resources, divert management’s attention and affect our ability to attract and retain qualified board members.
As a public company, we will be subject to the reporting and corporate governance requirements of the Exchange Act, the listing requirements of the Nasdaq Stock Market and other applicable securities rules and regulations, including the Sarbanes-Oxley Act and the Dodd-Frank Wall Street Reform and Consumer Protection Act. Compliance with these rules and regulations will increase our legal and financial compliance costs, make some activities more difficult, time-consuming or costly and increase demand on our systems and resources, particularly after we are no longer an “emerging growth company” as defined in the JOBS Act. Among other things, the Exchange Act requires that we file annual, quarterly and current reports with respect to our business and results of operations and maintain effective disclosure controls and procedures and internal control over financial reporting. In order to improve our disclosure controls and procedures and internal control over financial reporting to meet this standard, significant resources and management oversight may be required. As a result, management’s attention may be diverted from other business concerns, which could harm our business, financial condition, results of operations and prospects. Although we have already hired and are in the process of hiring, additional personnel to help comply with these requirements, we may need to further expand our legal and finance departments in the future, which will increase our costs and expenses.
In addition, changing laws, regulations and standards relating to corporate governance and public disclosure are creating uncertainty for public companies, increasing legal and financial compliance costs and making some activities more time-consuming. These laws, regulations and standards are subject to varying interpretations, in many cases due to their lack of specificity, and, as a result, their application in practice may evolve over time as new guidance is provided by regulatory and governing bodies. This could result in continuing uncertainty regarding compliance matters and higher costs necessitated by ongoing revisions to disclosure and governance practices. We intend to invest resources to comply with evolving laws, regulations and standards, and this investment may result in increased general and administrative expense and a diversion of management’s time and attention from revenue-generating activities to compliance activities. If our efforts to comply with new laws, regulations and standards differ from the activities intended by regulatory or governing bodies, regulatory authorities may initiate legal proceedings against us and our business and prospects may be harmed. As a result of disclosure of information in the filings required of a public company and in this prospectus, our business and financial condition will become more visible, which may result in threatened or actual litigation, including by competitors and other third parties. If such claims are successful, our business, financial condition, results of operations and prospects could be materially harmed, and even if the claims do not result in litigation or are resolved in our favor, these claims, and the time and resources necessary to resolve them, could divert the resources of our management and materially harm our business, financial condition, results of operations and prospects.
We also expect that being a public company and these new rules and regulations will make it more expensive for us to obtain director and officer liability insurance, and we may be required to accept reduced coverage or incur substantially higher costs to obtain coverage. These factors could also make it more difficult for us to attract and retain qualified executive officers and members of our board of directors, particularly to serve on our audit committee and compensation committee.
In addition, as a result of our disclosure obligations as a public company, we will have reduced strategic flexibility and will be under pressure to focus on short-term results, which may materially and adversely affect our ability to achieve long-term profitability.
We do not intend to pay dividends for the foreseeable future and, as a result, your ability to achieve a return on your investment will depend on appreciation in the price of our common stock.
We have never declared or paid any cash dividends on our common stock and do not intend to pay any cash dividends in the foreseeable future. We anticipate that we will retain all of our future earnings for use in the
38
Table of Contents
development of our business and for general corporate purposes. Any determination to pay dividends in the future will be at the discretion of our board of directors. Accordingly, investors must rely on sales of their common stock after price appreciation, which may never occur, as the only way to realize any future gains on their investments. In addition, our loan and security agreement with Silicon Valley Bank contains restrictive covenants that prohibit us, subject to certain exceptions, from paying dividends on our common stock.
If you purchase shares of our common stock in this offering, you will incur immediate and substantial dilution in the book value of your shares.
Investors purchasing common stock in this offering will pay a price per share that substantially exceeds the historical net tangible book value per share, which was $(17.60) per share of common stock as of March 31, 2018. As a result of the dilution to investors purchasing shares in this offering, investors may receive significantly less than the purchase price paid in this offering, if anything, in the event of our liquidation.
Furthermore, if the underwriters exercise their over-allotment option in full, outstanding options are exercised, we issue awards to our employees under our equity incentive plans or we otherwise issue additional shares of our common stock, you could experience further dilution. See “Dilution” for more information.
Anti-takeover provisions in our charter documents and under Delaware law could make an acquisition of us more difficult, limit attempts by our stockholders to replace or remove members of our board of directors and our current management and could negatively impact the market price of our common stock.
Our amended and restated certificate of incorporation and amended and restated bylaws that will be in effect upon completion of this offering contain provisions that could delay or prevent a change in control of our company. These provisions could also make it difficult for stockholders to elect directors that are not nominated by the current members of our board of directors or take other corporate actions, including effecting changes in our management. These provisions include:
| • | a classified board of directors with three-year staggered terms, which could delay the ability of stockholders to change the membership of a majority of our board of directors; |
| • | the ability of our board of directors to issue shares of preferred stock and to determine the price and other terms of those shares, including preferences and voting rights, without stockholder approval, which could be used to significantly dilute the ownership of a hostile acquirer; |
| • | the exclusive right of our board of directors to elect a director to fill a vacancy created by the expansion of our board of directors or the resignation, death or removal of a director, which prevents stockholders from being able to fill vacancies on our board of directors; |
| • | a prohibition on stockholder action by written consent, which forces stockholder action to be taken at an annual or special meeting of our stockholders; |
| • | the requirement that a special meeting of stockholders may be called only by the chairperson of our board of directors, chief executive officer or president (in the absence of a chief executive officer) or a majority vote of our board of directors, which could delay the ability of our stockholders to force consideration of a proposal or to take action, including the removal of directors; |
| • | the requirement for the affirmative vote of holders of at least 66 2/3% of the voting power of all of the then outstanding shares of the voting stock, voting together as a single class, to amend the provisions of our amended and restated certificate of incorporation relating to the issuance of preferred stock and management of our business or our amended and restated bylaws, which may inhibit the ability of an acquirer to affect such amendments to facilitate an unsolicited takeover attempt; |
| • | the ability of our board of directors, by majority vote, to amend our amended and restated bylaws, which may allow our board of directors to take additional actions to prevent an unsolicited takeover and inhibit the ability of an acquirer to amend our amended and restated bylaws to facilitate an unsolicited takeover attempt; and |
39
Table of Contents
| • | advance notice procedures with which stockholders must comply to nominate candidates to our board of directors or to propose matters to be acted upon at a stockholders’ meeting, which may discourage or deter a potential acquirer from conducting a solicitation of proxies to elect the acquirer’s own slate of directors or otherwise attempting to obtain control of us. |
These provisions may prohibit large stockholders, in particular those owning 15% or more of our outstanding voting stock, from merging or combining with us for a certain period of time. See “Description of Capital Stock—Anti-Takeover Provisions.”
Our amended and restated certificate of incorporation to be effective in connection with the closing of this offering will provide that the Court of Chancery of the State of Delaware or the U.S. federal district courts will be the exclusive forums for substantially all disputes between us and our stockholders, which could limit our stockholders’ ability to obtain a favorable judicial forum for disputes with us or our directors, officers or other employees.
Our amended and restated certificate of incorporation to be effective in connection with the closing of this offering provides that the Court of Chancery of the State of Delaware is the sole and exclusive forum for any derivative action or proceeding brought on our behalf, any action asserting a breach of fiduciary duty owed by any of our directors, officers or other employees to us or our stockholders, any action asserting a claim against us arising pursuant to any provisions of the Delaware General Corporation Law, our amended and restated certificate of incorporation or our amended and restated bylaws, or any action asserting a claim against us that is governed by the internal affairs doctrine. Our amended and restated certificate of incorporation further provides that the U.S. federal district courts will be the exclusive forum for resolving any complaint asserting a cause of action arising under the Securities Act. These choice of forum provisions may limit a stockholder’s ability to bring a claim in a judicial forum that it finds favorable for disputes with us or our directors, officers or other employees, which may discourage such lawsuits. Some companies that adopted a similar federal district court forum selection provision are currently subject to a suit in the Chancery Court of Delaware by stockholders who assert that the provision is not enforceable. If a court were to find either choice of forum provision contained in our amended and restated certificate of incorporation to be inapplicable or unenforceable in an action, we may incur additional costs associated with resolving such action in other jurisdictions, which could adversely affect our results of operations and financial condition.
We are an “emerging growth company” and we cannot be certain if the reduced reporting and disclosure requirements applicable to emerging growth companies will make our common stock less attractive to investors.
We are an “emerging growth company,” as defined in the JOBS Act, and we may take advantage of certain exemptions from various reporting requirements that are applicable to other public companies that are not “emerging growth companies” including, but not limited to, the auditor attestation requirements of Section 404 of the Sarbanes-Oxley Act, reduced disclosure obligations regarding executive compensation in our periodic reports and proxy statements, and exemptions from the requirements of holding a nonbinding advisory vote on executive compensation and stockholder approval of any golden parachute payments not previously approved. We may take advantage of these exemptions until we are no longer an emerging growth company. We would cease to be an emerging growth company upon the earliest to occur of: (1) the first fiscal year following the fifth anniversary of our initial public offering; (2) the first fiscal year after our annual gross revenue is $1.07 billion or more; (3) the date on which we have, during the previous three-year period, issued more than $1.0 billion in non-convertible debt securities; or (4) as of the end of any fiscal year in which the market value of our common stock held by non-affiliates exceeded $700.0 million as of the end of the second quarter of that fiscal year. We cannot predict if investors will find our common stock less attractive if we choose to rely on these exemptions. If some investors find our common stock less attractive as a result, there may be a less active trading market for our common stock and our stock price may be more volatile.
40
Table of Contents
SPECIAL NOTE REGARDING FORWARD-LOOKING STATEMENTS
This prospectus contains forward-looking statements that involve substantial risks and uncertainties. The forward-looking statements are contained principally in the sections of this prospectus entitled “Prospectus Summary,” “Risk Factors,” “Management’s Discussion and Analysis of Financial Condition and Results of Operations” and “Business,” but are also contained elsewhere in this prospectus. In some cases, you can identify forward-looking statements by the words “anticipate,” “believe,” “continue,” “could,” “estimate,” “expect,” “intend,” “may,” “might,” “objective,” “ongoing,” “plan,” “predict,” “project,” “potential,” “should,” “will,” or “would,” or the negative of these terms, or other comparable terminology intended to identify statements about the future. These statements involve known and unknown risks, uncertainties and other factors that may cause our actual results, levels of activity, performance or achievements to be materially different from the information expressed or implied by these forward-looking statements. These statements are inherently uncertain and investors are cautioned not to unduly rely upon these statements. In addition, statements that “we believe” and similar statements reflect our beliefs and opinions on the relevant subject. The forward-looking statements and opinions contained in this prospectus are based upon information available to us as of the date of this prospectus and, while we believe such information forms a reasonable basis for such statements, such information may be limited or incomplete, and our statements should not be read to indicate that we have conducted an exhaustive inquiry into, or review of, all potentially available relevant information. Forward-looking statements include statements about:
| • | our market opportunity; |
| • | the effects of increased competition as well as innovations by new and existing competitors in our market; |
| • | our ability to adapt to technological change and effectively enhance, innovate and scale our enterprise platform and solutions; |
| • | our ability to effectively manage or sustain our growth and to achieve profitability; |
| • | our ability to maintain and expand our customer base, including by attracting new customers; |
| • | our relationships with third parties, including channel partners; |
| • | potential acquisitions and integration of complementary businesses and technologies; |
| • | our expected use of proceeds; |
| • | our ability to maintain, or strengthen awareness of, our brand; |
| • | perceived or actual problems with the security, integrity, reliability, compatibility and quality of our platform and solutions; |
| • | future revenue, hiring plans, expenses, capital expenditures, capital requirements and stock performance; |
| • | our ability to attract and retain qualified employees and key personnel and further expand our overall headcount; |
| • | our ability to stay abreast of new or modified laws and regulations that currently apply or become applicable to our business both in the United States and internationally; |
| • | our ability to maintain, protect and enhance our intellectual property; |
| • | costs associated with defending intellectual property infringement and other claims; and |
| • | the future trading prices of our common stock and the impact of securities analysts’ reports on these prices. |
We caution you that the foregoing list may not contain all of the forward-looking statements made in this prospectus.
41
Table of Contents
You should refer to the “Risk Factors” section of this prospectus for a discussion of important factors that may cause our actual results to differ materially from those expressed or implied by our forward-looking statements. As a result of these factors, we cannot assure you that the forward-looking statements in this prospectus will prove to be accurate. Furthermore, if our forward-looking statements prove to be inaccurate, the inaccuracy may be material. In light of the significant uncertainties in these forward-looking statements, you should not regard these statements as a representation or warranty by us or any other person that we will achieve our objectives and plans in any specified time frame or at all. We undertake no obligation to publicly update any forward-looking statements, whether as a result of new information, future events or otherwise, except as required by law. The Private Securities Litigation Reform Act of 1995 and Section 27A of the Securities Act of 1933, as amended, or the Securities Act, do not protect any forward-looking statements that we make in connection with this offering.
You should read this prospectus and the documents that we reference in this prospectus and have filed as exhibits to the registration statement, of which this prospectus is a part, completely and with the understanding that our actual future results may be materially different from what we expect. We qualify all of our forward-looking statements by these cautionary statements.
42
Table of Contents
Information contained in this prospectus concerning our industry and the market in which we operate, including our general expectations and market position, market opportunity and market size is based on information from various sources, including independent industry publications by International Data Corporation, or IDC, Gartner, Inc., or Gartner, and Cisco. In presenting this information, we have also made assumptions based on such data and other similar sources, and on our knowledge of, and in our experience to date in, the markets for our services. This information involves a number of assumptions and limitations, and you are cautioned not to give undue weight to such estimates. Although neither we nor the underwriters have independently verified the accuracy or completeness of any third-party information, we believe the market position, market opportunity and market size information included in this prospectus is reliable. The industry in which we operate is subject to a high degree of uncertainty and risk due to a variety of factors, including those described in the “Risk Factors” section. These and other factors could cause results to differ materially from those expressed in the estimates made by the independent parties and by us.
The Gartner report described herein, or the Gartner Report, represents research opinion or viewpoints published, as part of a syndicated subscription service, by Gartner, and are not representations of fact. Each Gartner Report speaks as of its original publication date (and not as of the date of this prospectus) and the opinions expressed in the Gartner Report are subject to change without notice.
This prospectus makes various references to the following research opinions published by IDC:
| • | IDC, Worldwide Security and Vulnerability Management Forecast, 2017–2021, dated January 2018. |
| • | IDC, Container Infrastructure Market Assessment: Bridging Legacy and Cloud-Native Architectures — x86 Software Containers Forecast, 2017–2021, dated March 2018. |
| • | IDC, IDC Quarterly Server Tracker, Forecast Installed Base, dated 31 October 2017. |
| • | IDC, IDC Quarterly Personal Computing Device Tracker - Tablet Forecast, Q4 2017. |
| • | IDC, Worldwide Business Use Smartphone Forecast, 2018–2022, dated March 2018. |
43
Table of Contents
We estimate that the net proceeds from our issuance and sale of shares of our common stock in this offering will be approximately $ million, or approximately $ million if the underwriters exercise their over-allotment option in full, based upon an assumed initial public offering price of $ per share, the midpoint of the price range set forth on the cover page of this prospectus, after deducting estimated underwriting discounts and commissions and estimated offering expenses payable by us.
Each $1.00 increase or decrease in the assumed initial public offering price of $ per share, the midpoint of the price range set forth on the cover page of this prospectus, would increase or decrease the net proceeds to us from this offering by approximately $ million, assuming that the number of shares offered by us, as set forth on the cover page of this prospectus, remains the same, and after deducting estimated underwriting discounts and commissions and estimated offering expenses payable by us. We may also increase or decrease the number of shares we are offering. A 1,000,000 share increase or decrease in the number of shares offered by us would increase or decrease the net proceeds to us from this offering by approximately $ million, assuming that the assumed initial offering price to the public remains the same, and after deducting estimated underwriting discounts and commissions and estimated offering expenses payable by us. We do not expect that a change in the initial price to the public or the number of shares by these amounts would have a material effect on the uses of the proceeds from this offering, although it may accelerate the time at which we will need to seek additional capital.
The principal purposes of this offering are to increase our financial flexibility, create a public market for our common stock and facilitate our future access to the capital markets. Although we have not yet determined with certainty the manner in which we will allocate the net proceeds of this offering, we expect to use the net proceeds from this offering for working capital and other general corporate purposes, including continuing to invest in sales and marketing and in our solutions and increasing international expansion.
We may also use a portion of the proceeds from this offering for acquisitions or strategic investments in complementary businesses or technologies, although we do not currently have any plans for any such acquisitions or investments. We have not allocated specific amounts of net proceeds for any of these purposes.
The expected use of net proceeds from this offering represents our intentions based upon our present plans and business conditions. We cannot predict with certainty all of the particular uses for the proceeds of this offering or the amounts that we will actually spend on the uses set forth above. Accordingly, our management will have significant flexibility in applying the net proceeds of this offering. The timing and amount of our actual expenditures will be based on many factors, including cash flows from operations and the anticipated growth of our business. Pending their use, we intend to invest the net proceeds of this offering in a variety of capital-preservation investments, including short- and intermediate-term, interest-bearing, investment-grade securities and government securities.
44
Table of Contents
We have never declared or paid any dividends on our common stock. In addition, our loan and security agreement with Silicon Valley Bank contains restrictive covenants that prohibit us, subject to certain exceptions, from paying dividends on our common stock, and future debt securities or other financing arrangements could contain similar or more restrictive negative covenants. We currently intend to retain all available funds and any future earnings for the operation and expansion of our business. Accordingly, following this offering, we do not anticipate declaring or paying cash dividends in the foreseeable future. The payment of any future dividends will be at the discretion of our board of directors and will depend on our results of operations, capital requirements, financial condition, prospects, contractual arrangements, any limitations on payment of dividends present in our current and future debt agreements, and other factors that our board of directors may deem relevant.
45
Table of Contents
The following table sets forth our cash and cash equivalents and our capitalization as of March 31, 2018:
| • | on an actual basis; |
| • | on a pro forma basis to reflect (1) the conversion of all outstanding shares of our preferred stock into an aggregate of 55,385,854 shares of common stock as if such conversion had occurred on March 31, 2018 and (2) the filing of our amended and restated certificate of incorporation immediately prior to the completion of this offering; and |
| • | on a pro forma as adjusted basis to reflect the pro forma items described immediately above and the sale of shares of common stock in this offering at an assumed initial public offering price of $ per share, the midpoint of the price range set forth on the cover page of this prospectus, after deducting estimated underwriting discounts and commissions and estimated offering expenses payable by us. |
You should read this table together with “Selected Consolidated Financial Data,” “Management’s Discussion and Analysis of Financial Condition and Results of Operations” and our consolidated financial statements and the related notes appearing elsewhere in this prospectus.
| As of March 31, 2018 | ||||||||||||
| Actual | Pro Forma | Pro Forma As Adjusted(1) |
||||||||||
| (in thousands, except per share data) | ||||||||||||
| Cash and cash equivalents |
$ | 26,424 | $ | 26,424 | ||||||||
|
|
|
|
|
|
|
|||||||
| Redeemable convertible preferred stock: |
||||||||||||
| Redeemable convertible Series A preferred stock, $0.01 par value per share; 15,848 shares authorized, issued and outstanding, actual; no shares authorized, issued or outstanding, pro forma and pro forma as adjusted |
$ | 49,940 | $ | — | ||||||||
| Redeemable convertible Series B preferred stock, $0.01 par value per share; 42,000 shares authorized, 39,538 issued and outstanding, actual; no shares authorized, issued or outstanding, pro forma and pro forma as adjusted |
227,983 | — | ||||||||||
| Stockholders’ (deficit) equity: |
||||||||||||
| Preferred stock, $0.01 par value per share; no shares authorized, issued and outstanding, actual; shares authorized, pro forma and pro forma as adjusted; shares issued and outstanding, pro forma and pro forma as adjusted |
— | — | ||||||||||
| Common stock, $0.01 par value per share; 93,855 shares authorized, actual; 24,794 shares issued and outstanding, actual; shares authorized, pro forma; 80,179 shares issued and outstanding, pro forma; shares authorized, pro forma as adjusted; shares issued and outstanding, pro forma as adjusted |
249 | 803 | ||||||||||
| Additional paid-in capital |
23,363 | 300,732 | ||||||||||
| Accumulated deficit |
(408,475 | ) | (408,475 | ) | ||||||||
|
|
|
|
|
|||||||||
| Total stockholders’ (deficit) equity |
(384,863 | ) | (106,940 | ) | ||||||||
|
|
|
|
|
|
|
|||||||
| Total capitalization |
$ | (106,940 | ) | $ | (106,940 | ) | ||||||
|
|
|
|
|
|
|
|||||||
46
Table of Contents
| (1) | The pro forma as adjusted information set forth above is illustrative only and will change based on the actual initial public offering price and other terms of this offering determined at pricing. Each $1.00 increase or decrease in the assumed initial public offering price of $ per share, the midpoint of the price range set forth on the cover page of this prospectus, would increase or decrease pro forma as adjusted cash and cash equivalents, additional paid-in capital, total stockholders’ (deficit) equity and total capitalization by approximately $ million, assuming that the number of shares offered by us, as set forth on the cover page of this prospectus, remains the same, and after deducting estimated underwriting discounts and commissions and estimated offering expenses payable by us. We may also increase or decrease the number of shares we are offering. A 1,000,000 share increase or decrease in the number of shares offered by us would increase or decrease pro forma as adjusted cash and cash equivalents, additional paid-in capital, total stockholders’ (deficit) equity and total capitalization by approximately $ million, assuming that the assumed initial offering price to the public remains the same, and after deducting estimated underwriting discounts and commissions and estimated offering expenses payable by us. |
The outstanding share information in the table above excludes:
| • | 15,217,352 shares of common stock issuable upon the exercise of options outstanding as of March 31, 2018, at a weighted-average exercise price of $4.93 per share; |
| • | 2,557,234 shares of common stock reserved for future issuance as of March 31, 2018 under our 2016 Stock Incentive Plan, which shares will cease to be available for issuance at the time our 2018 Equity Incentive Plan becomes effective and will be added to, and become available for issuance under, our 2018 Equity Incentive Plan; |
| • | 736,500 shares of common stock issuable upon the exercise of options granted under our 2016 Stock Incentive Plan subsequent to March 31, 2018, at an exercise price of $14.06 per share; |
| • | 4,012,148 shares of common stock issuable upon the exercise of options granted under our 2016 Stock Incentive Plan subsequent to March 31, 2018, at an exercise price of $16.21 per share; |
| • | 973,800 shares of common stock issuable upon the settlement of restricted stock units granted under our 2016 Stock Incentive Plan subsequent to March 31, 2018; |
| • | 9,900,000 shares of common stock reserved for future issuance pursuant to our 2018 Equity Incentive Plan, which will become effective prior to the closing of this offering; and |
| • | 4,000,000 shares of common stock reserved for future issuance under our 2018 Employee Stock Purchase Plan, which will become effective prior to the closing of this offering. |
47
Table of Contents
If you invest in our common stock, your interest will be diluted to the extent of the difference between the initial public offering price per share of our common stock and the pro forma as adjusted net tangible book value per share of our common stock immediately after the closing of this offering.
Our historical net tangible book value as of March 31, 2018 was $(436.5) million, or $(17.60) per share of common stock. Our historical net tangible book value per share represents our total tangible assets less our total liabilities and preferred stock (which is not included within stockholders’ deficit), divided by the number of shares of common stock outstanding as of March 31, 2018.
Our pro forma net tangible book value as of March 31, 2018 was $(158.5) million, or $(1.98) per share of common stock. Pro forma net tangible book value per share represents our total tangible assets less our total liabilities, divided by the number of shares of common stock outstanding as of March 31, 2018, after giving effect to the conversion of all outstanding shares of our preferred stock into an aggregate of 55,385,854 shares of common stock immediately prior to the closing of this offering as if such conversion had occurred on March 31, 2018.
Our pro forma as adjusted net tangible book value represents our pro forma net tangible book value, plus the effect of the sale of shares of common stock in this offering at an assumed initial public offering price of $ per share, the midpoint of the price range set forth on the cover page of this prospectus, after deducting estimated underwriting discounts and commissions and estimated offering expenses payable by us. Our pro forma as adjusted net tangible book value as of March 31, 2018 was $ million, or $ per share of common stock. This amount represents an immediate increase in pro forma net tangible book value of $ per share to our existing stockholders and an immediate dilution of $ per share to investors participating in this offering. We determine dilution per share to investors participating in this offering by subtracting pro forma as adjusted net tangible book value per share after this offering from the assumed initial public offering price per share paid by investors participating in this offering.
The following table illustrates this dilution on a per share basis to new investors:
| Assumed initial public offering price per share |
$ | |||||||
| Historical net tangible book value per share as of March 31, 2018 |
$ | (17.60 | ) | |||||
| Increase per share attributable to the pro forma transactions described above |
15.62 | |||||||
|
|
|
|||||||
| Pro forma net tangible book value per share as of March 31, 2018 |
(1.98 | ) | ||||||
| Increase in pro forma net tangible book value per share attributable to new investors purchasing shares from us in this offering |
||||||||
|
|
|
|||||||
| Pro forma as adjusted net tangible book value per share after giving effect to this offering |
||||||||
|
|
|
|||||||
| Dilution in pro forma as adjusted net tangible book value per share to new investors in this offering |
$ | |||||||
|
|
|
The pro forma as adjusted dilution information discussed above is illustrative only and will change based on the actual initial public offering price and other terms of this offering determined at pricing. Each $1.00 increase or decrease in the assumed initial public offering price of $ per share, the midpoint of the price range set forth on the cover page of this prospectus, would increase or decrease the pro forma as adjusted net tangible book value per share by $ per share and the dilution per share to investors participating in this offering by $ per share, assuming that the number of shares offered by us, as set forth on the cover page of this prospectus, remains the same and after deducting estimated underwriting discounts and commissions and estimated offering expenses payable by us. We may also increase or decrease the number of shares we are
48
Table of Contents
offering. A 1,000,000 share increase in the number of shares offered by us, as set forth on the cover page of this prospectus, would increase the pro forma as adjusted net tangible book value per share by $ and decrease the dilution per share to investors participating in this offering by $ , assuming the assumed initial public offering price of $ per share, the midpoint of the price range set forth on the cover page of this prospectus, remains the same and after deducting estimated underwriting discounts and commissions and estimated offering expenses payable by us. A 1,000,000 share decrease in the number of shares offered by us, as set forth on the cover page of this prospectus, would decrease the pro forma as adjusted net tangible book value per share after this offering by $ and increase the dilution per share to new investors participating in this offering by $ , assuming the assumed initial public offering price of $ per share, the midpoint of the price range set forth on the cover page of this prospectus, remains the same and after deducting estimated underwriting discounts and commissions and estimated offering expenses payable by us.
If the underwriters exercise their over-allotment option in full to purchase an additional shares of our common stock in this offering, the pro forma as adjusted net tangible book value of our common stock would increase to $ per share, representing an immediate increase to existing stockholders of $ per share and an immediate dilution of $ per share to investors participating in this offering.
The following table summarizes as of March 31, 2018, on the pro forma as adjusted basis described above, the number of shares of our common stock, the total consideration and the average price per share (1) paid to us by our existing stockholders and (2) to be paid by investors purchasing our common stock in this offering at an assumed initial public offering price of $ per share, the midpoint of the price range set forth on the cover page of this prospectus, before deducting estimated underwriting discounts and commissions and estimated offering expenses payable by us.
| Shares Purchased | Total Consideration | Weighted- Average Price Per Share |
||||||||||||||||||
| Number | Percent | Amount | Percent | |||||||||||||||||
| Existing stockholders |
80,179,454 | % | $ | 285,056,050 | (1) | % | $ | 3.56 | ||||||||||||
| New investors |
||||||||||||||||||||
|
|
|
|
|
|
|
|
|
|||||||||||||
| Total |
100.0 | % | $ | 100.0 | % | |||||||||||||||
|
|
|
|
|
|
|
|
|
|||||||||||||
| (1) | We received aggregate consideration of $280.0 million for the issuance of our Series A and Series B redeemable convertible preferred stock. The proceeds from the sale of such shares of preferred stock were used to repurchase shares of our common stock. |
The outstanding share information used in the computations above excludes:
| • | 15,217,352 shares of common stock issuable upon the exercise of options outstanding as of March 31, 2018, at a weighted-average exercise price of $4.93 per share; |
| • | 2,557,234 shares of common stock reserved for future issuance as of March 31, 2018 under our 2016 Stock Incentive Plan, which shares will cease to be available for issuance at the time our 2018 Equity Incentive Plan becomes effective and will be added to, and become available for issuance under, our 2018 Equity Incentive Plan; |
| • | 736,500 shares of common stock issuable upon the exercise of options granted under our 2016 Stock Incentive Plan subsequent to March 31, 2018, at an exercise price of $14.06 per share; |
| • | 4,012,148 shares of common stock issuable upon the exercise of options granted under our 2016 Stock Incentive Plan subsequent to March 31, 2018, at an exercise price of $16.21 per share; |
| • | 973,800 shares of common stock issuable upon the settlement of restricted stock units granted under our 2016 Stock Incentive Plan subsequent to March 31, 2018; |
49
Table of Contents
| • | 9,900,000 shares of common stock reserved for future issuance pursuant to our 2018 Equity Incentive Plan, which will become effective prior to the closing of this offering; and |
| • | 4,000,000 shares of common stock reserved for future issuance under our 2018 Employee Stock Purchase Plan, which will become effective prior to the closing of this offering. |
To the extent that outstanding options or warrants are exercised, new options or other securities are issued under our equity incentive plans, or we issue additional shares of common stock in the future, there will be further dilution to investors participating in this offering. In addition, we may choose to raise additional capital because of market conditions or strategic considerations, even if we believe that we have sufficient funds for our current or future operating plans. If we raise additional capital through the sale of equity or convertible debt securities, the issuance of these securities could result in further dilution to our stockholders.
50
Table of Contents
SELECTED CONSOLIDATED FINANCIAL DATA
We derived the selected consolidated statements of operations data for the years ended December 31, 2016 and 2017 and the selected consolidated balance sheet data as of December 31, 2016 and 2017 from our audited consolidated financial statements included elsewhere in this prospectus. In order to provide additional historical financial information, we have included supplemental consolidated statements of operations data for the year ended December 31, 2015, which is derived from the consolidated statement of operations and comprehensive loss for the year ended December 31, 2015, and consolidated balance sheet data as of December 31, 2015, in each case from our audited financial statements not included elsewhere in this prospectus. We derived the selected consolidated statements of operations data for the three months ended March 31, 2017 and 2018 and the selected consolidated balance sheet data as of March 31, 2018 from the unaudited consolidated financial statements included elsewhere in this prospectus. Our unaudited interim consolidated financial statements have been prepared on the same basis as our audited consolidated financial statements and reflect, in the opinion of management, all adjustments of a normal, recurring nature that are necessary for a fair presentation of our unaudited interim consolidated financial statements. Our historical results are not necessarily indicative of the results to be expected in the future, and our operating results for the three months ended March 31, 2018, are not necessarily indicative of the results that may be expected for the entire year ending December 31, 2018.
When you read this selected consolidated financial data, it is important that you read it together with the historical consolidated financial statements and related notes to those statements, as well as “Management’s Discussion and Analysis of Financial Condition and Results of Operations,” included elsewhere in this prospectus.
| Year Ended December 31, | Three Months Ended March 31, | |||||||||||||||||||
| 2015 | 2016 | 2017 | 2017 | 2018 | ||||||||||||||||
| (in thousands, except per share data) |
||||||||||||||||||||
| Consolidated Statements of Operations Data: |
||||||||||||||||||||
| Revenue(1) |
$ | 93,466 | $ | 124,371 | $ | 187,727 | $ | 40,481 | $ | 59,107 | ||||||||||
| Cost of revenue(2) |
10,914 | 14,219 | 25,588 | 4,438 | 8,728 | |||||||||||||||
|
|
|
|
|
|
|
|
|
|
|
|||||||||||
| Gross profit |
82,552 | 110,152 | 162,139 | 36,043 | 50,379 | |||||||||||||||
| Operating expenses: |
||||||||||||||||||||
| Sales and marketing(1)(2) |
60,635 | 85,736 | 116,299 | 26,168 | 39,588 | |||||||||||||||
| Research and developmen(2) |
25,288 | 40,085 | 57,673 | 12,458 | 17,185 | |||||||||||||||
| General and administrative(2) |
15,348 | 20,164 | 28,927 | 6,163 | 9,055 | |||||||||||||||
| Recapitalization costs(3) |
67,039 | — | — | — | — | |||||||||||||||
|
|
|
|
|
|
|
|
|
|
|
|||||||||||
| Total operating expenses |
168,310 | 145,985 | 202,899 | 44,789 | 65,828 | |||||||||||||||
|
|
|
|
|
|
|
|
|
|
|
|||||||||||
| Loss from operations |
(85,758 | ) | (35,833 | ) | (40,760 | ) | (8,746 | ) | (15,449 | ) | ||||||||||
| Other expense, net |
189 | 532 | 91 | 29 | 8 | |||||||||||||||
|
|
|
|
|
|
|
|
|
|
|
|||||||||||
| Loss before income taxes |
(85,947 | ) | (36,365 | ) | (40,851 | ) | (8,775 | ) | (15,457 | ) | ||||||||||
| (Benefit from) provision for income taxes |
(2,188 | ) | 843 | 171 | 51 | 431 | ||||||||||||||
|
|
|
|
|
|
|
|
|
|
|
|||||||||||
| Net loss |
(83,759 | ) | (37,208 | ) | (41,022 | ) | (8,826 | ) | (15,888 | ) | ||||||||||
| Accretion of Series A and B redeemable convertible preferred stock |
29 | 763 | 763 | 187 | 188 | |||||||||||||||
|
|
|
|
|
|
|
|
|
|
|
|||||||||||
| Net loss attributable to common stockholders |
$ | (83,788 | ) | $ | (37,971 | ) | $ | (41,785 | ) | $ | (9,013 | ) | $ | (16,076 | ) | |||||
|
|
|
|
|
|
|
|
|
|
|
|||||||||||
| Net loss per share attributable to common stockholders, basic and diluted(4) |
$ | (1.45 | ) | $ | (1.81 | ) | $ | (1.88 | ) | $ | (0.42 | ) | $ | (0.68 | ) | |||||
|
|
|
|
|
|
|
|
|
|
|
|||||||||||
| Weighted-average shares used to compute net loss per share attributable to common stockholders, basic and diluted |
57,654 | 20,974 | 22,211 | 21,257 | 23,495 | |||||||||||||||
|
|
|
|
|
|
|
|
|
|
|
|||||||||||
| Pro forma net loss per share, basic and diluted (unaudited)(5) |
$ | (0.53 | ) | $ | (0.20 | ) | ||||||||||||||
|
|
|
|
|
|||||||||||||||||
| Weighted-average shares used in computing pro forma net loss per share, basic and diluted (unaudited) |
77,597 | 78,881 | ||||||||||||||||||
|
|
|
|
|
|||||||||||||||||
51
Table of Contents
| (1) | We adopted Accounting Standards Codification Topic 606, Revenue From Contracts With Customers, or ASC 606, on January 1, 2017 using the modified retrospective method. The 2015 and 2016 consolidated statements of operations were not adjusted for the adoption of ASC 606. See Note 2 to our consolidated financial statements included elsewhere in this prospectus for details on the impact of adopting ASC 606. |
| (2) | Includes stock-based compensation expense as follows: |
| Year Ended December 31, | Three Months Ended March 31, | |||||||||||||||||||
| 2015 | 2016 | 2017 | 2017 | 2018 | ||||||||||||||||
| (in thousands) |
||||||||||||||||||||
| Cost of revenue |
$ | 52 | $ | 223 | $ | 281 | $ | 54 | $ | 77 | ||||||||||
| Sales and marketing |
866 | 969 | 1,579 | 270 | 602 | |||||||||||||||
| Research and development |
252 | 602 | 1,782 | 394 | 527 | |||||||||||||||
| General and administrative |
509 | 738 | 4,118 | 908 | 1,193 | |||||||||||||||
|
|
|
|
|
|
|
|
|
|
|
|||||||||||
| Total stock-based compensation expense |
$ | 1,679 | $ | 2,532 | $ | 7,760 | $ | 1,626 | $ | 2,399 | ||||||||||
|
|
|
|
|
|
|
|
|
|
|
|||||||||||
| (3) | We recorded a charge of $67.0 million primarily resulting from the repurchase price paid to common stockholders exceeding the estimated fair value of the common stock on the date of the Series B financing. |
| (4) | See Note 9 to our consolidated financial statements appearing elsewhere in this prospectus for further details on the calculation of basic and diluted net loss per share attributable to common stockholders. |
| (5) | Pro forma basic and diluted net loss per share represents net loss divided by the pro forma weighted-average shares of common stock outstanding. Pro forma weighted-average shares outstanding reflects the conversion of all outstanding shares of our preferred stock (using the if-converted method) into common stock as though the conversion had occurred on the first day of the relevant period. |
| As of December 31, | As of March 31, | |||||||||||||||
| 2015 | 2016 | 2017 | 2018 | |||||||||||||
| (in thousands) | ||||||||||||||||
| Consolidated Balance Sheet Data: |
||||||||||||||||
| Cash and cash equivalents |
$ | 43,743 | $ | 34,470 | $ | 27,210 | $ | 26,424 | ||||||||
| Working capital (deficit)(1) |
13,862 | (18,538 | ) | (69,091 | ) | (81,983 | ) | |||||||||
| Total assets |
83,993 | 105,494 | 164,337 | 155,645 | ||||||||||||
| Deferred revenue, current and non-current |
63,218 | 107,447 | 225,818 | 230,614 | ||||||||||||
| Redeemable convertible preferred stock |
276,209 | 276,972 | 277,735 | 277,923 | ||||||||||||
| Accumulated deficit |
(275,939 | ) | (313,147 | ) | (392,587 | ) | (408,475 | ) | ||||||||
| Total stockholders’ deficit |
(266,862 | ) | (301,918 | ) | (371,665 | ) | (384,863 | ) | ||||||||
| (1) | We define working capital (deficit) as total current assets less total current liabilities. See our consolidated financial statements included elsewhere in this prospectus for further details regarding our current assets and current liabilities. Changes in working capital (deficit) reflect increases in deferred revenue and deferred commissions as a result of our subscription model and our adoption of ASC 606. |
Non-GAAP Financial Measures
To supplement our consolidated financial statements, which are prepared and presented in accordance with GAAP, we use certain non-GAAP financial measures, as described below, to understand and evaluate our core operating performance. These non-GAAP financial measures, which may be different than similarly titled measures used by other companies, are presented to enhance investors’ overall understanding of our financial performance and should not be considered a substitute for, or superior to, the financial information prepared and presented in accordance with GAAP.
We believe that these non-GAAP financial measures provide useful information about our financial performance, enhance the overall understanding of our past performance and future prospects and allow for greater transparency with respect to important metrics used by management for financial and operational decision-making. We are
52
Table of Contents
presenting these non-GAAP metrics to assist investors in seeing our financial performance using a management view and because we believe that these measures provide an additional tool for investors to use in comparing our core financial performance over multiple periods with other companies in our industry.
Calculated Current Billings
We use the non-GAAP measure of calculated current billings, which we believe is a key metric to measure our periodic performance. Given that most of our customers pay in advance, we typically recognize a majority of the related revenue ratably over time. We use calculated current billings to measure and monitor our ability to provide our business with the working capital generated by upfront payments from our customers.
Calculated current billings consists of our total revenue recognized in a period plus the change in current deferred revenue in the corresponding period. We believe that current billings, which excludes deferred revenue for periods beyond twelve months in a customer’s contractual term, more closely correlates with annual contract value and that the variability in total billings, depending on the timing of large multi-year contracts and the preference for annual billing versus multi-year upfront billing, may distort growth in one period over another. While we believe that calculated current billings provides valuable insight into the cash that will be generated from sales of our subscriptions, this metric may vary from period-to-period for a number of reasons, and therefore has a number of limitations as a quarter-to-quarter or year-over-year comparative measure. For example, billings include amounts that have not yet been recognized as revenue; an increasing number of large sales transactions, for which the timing has and will continue to vary, may occur in quarters subsequent to or in advance of those that we anticipate; and our calculation of current billings may be different from other companies that report similar financial measures. Additionally, calculated current billings in any one period may be impacted by the timing of customer renewals, including early renewals, which could favorably or unfavorably impact year-over-year comparisons. Because of these and other limitations, you should consider calculated current billings along with revenue and our other GAAP financial results.
The following table presents a reconciliation of revenue, the most directly comparable financial measure calculated in accordance with GAAP, to calculated current billings, for each of the periods presented:
| Year Ended December 31, | Three Months Ended March 31, | |||||||||||||||||||
| 2015 | 2016 | 2017 | 2017 | 2018 | ||||||||||||||||
| (in thousands) | ||||||||||||||||||||
| Revenue |
$ | 93,466 | $ | 124,371 | $ | 187,727 | $ | 40,481 | $ | 59,107 | ||||||||||
| Deferred revenue (current), end of period |
54,721 | 88,011 | 154,898 | 110,605 | 160,503 | |||||||||||||||
| Deferred revenue (current), beginning of period(1) |
(33,163 | ) | (54,721 | ) | (107,006 | ) | (107,006 | ) | (154,898 | ) | ||||||||||
|
|
|
|
|
|
|
|
|
|
|
|||||||||||
| Calculated current billings |
$ | 115,024 | $ | 157,661 | $ | 235,619 | $ | 44,080 | $ | 64,712 | ||||||||||
|
|
|
|
|
|
|
|
|
|
|
|||||||||||
| (1) | In connection with adopting ASC 606, we recorded $19.0 million of current deferred revenue on January 1, 2017, related to perpetual license revenue recognized in prior periods. See Note 2 to our consolidated financial statements for additional details. |
Non-GAAP Loss from Operations and Non-GAAP Operating Margin
We use non-GAAP loss from operations, which excludes the effect of stock-based compensation, amortization of intangible assets and recapitalization costs, as a key indicator of our financial performance, along with non-GAAP operating margin, which is calculated as non-GAAP loss from operations divided by our total revenue for the period. We believe that these non-GAAP financial measures provide useful information about our core operating results over multiple periods. There are a number of limitations related to the use of the non-GAAP financial measures as compared to GAAP loss from operations and operating margin, including that
53
Table of Contents
non-GAAP loss from operations and non-GAAP operating margin exclude stock-based compensation expense, which has been, and will continue to be for the foreseeable future, a significant recurring expense in our business and an important part of our compensation strategy.
The following table presents a reconciliation of loss from operations, the most directly comparable financial measure calculated in accordance with GAAP, to non-GAAP loss from operations, and operating margin, the most directly comparable financial measure calculated in accordance with GAAP, to non-GAAP operating margin, for each of the periods presented:
| Year Ended December 31, | Three Months Ended March 31, | |||||||||||||||||||
| 2015 | 2016 | 2017 | 2017 | 2018 | ||||||||||||||||
| Loss from operations |
$ | (85,758 | ) | $ | (35,833 | ) | $ | (40,760 | ) | $ | (8,746 | ) | $ | (15,449 | ) | |||||
| Stock-based compensation |
1,679 | 2,532 | 7,760 | 1,626 | 2,399 | |||||||||||||||
| Amortization of intangible assets |
3 | 178 | 603 | 151 | 151 | |||||||||||||||
| Recapitalization costs |
67,039 | — | — | — | — | |||||||||||||||
|
|
|
|
|
|
|
|
|
|
|
|||||||||||
| Non-GAAP loss from operations |
$ | (17,037 | ) | $ | (33,123 | ) | $ | (32,397 | ) | $ | (6,969 | ) | $ | (12,899 | ) | |||||
|
|
|
|
|
|
|
|
|
|
|
|||||||||||
| Operating margin |
(92 | )% | (29 | )% | (22 | )% | (22 | )% | (26 | )% | ||||||||||
| Non-GAAP operating margin |
(18 | )% | (27 | )% | (17 | )% | (17 | )% | (22 | )% | ||||||||||
Non-GAAP Net Loss and Non-GAAP Net Loss Per Share
We use non-GAAP net loss, which excludes the effect of the accretion of our Series A and B redeemable convertible preferred stock, stock-based compensation expense, amortization of intangible assets and recapitalization costs, as well as the related tax impact, to calculate non-GAAP net loss per share. We believe that these non-GAAP measures provide important information to management and investors because they facilitate comparisons of our core operating results over multiple periods.
The following table presents a reconciliation of net loss, and net loss per share attributable to common stockholders, the most comparable financial measures calculated in accordance with GAAP, to non-GAAP net loss and non-GAAP net loss per share for each of the periods presented:
| Year Ended December 31, | Three Months Ended March 31, |
|||||||||||||||||||
| 2015 | 2016 | 2017 | 2017 | 2018 | ||||||||||||||||
| (in thousands) | ||||||||||||||||||||
| Net loss attributable to common stockholders |
$ | (83,788 | ) | $ | (37,971 | ) | $ | (41,785 | ) | $ | (9,013 | ) | $ | (16,076 | ) | |||||
| Accretion of Series A and B redeemable convertible preferred stock |
29 | 763 | 763 | 187 | 188 | |||||||||||||||
| Stock-based compensation |
1,679 | 2,532 | 7,760 | 1,626 | 2,399 | |||||||||||||||
| Tax impact of stock-based compensation(1) |
(17 | ) | (22 | ) | (54 | ) | (10 | ) | (23 | ) | ||||||||||
| Amortization of intangible assets(1) |
3 | 178 | 603 | 151 | 151 | |||||||||||||||
| Recapitalization costs(1) |
67,039 | — | — | — | — | |||||||||||||||
|
|
|
|
|
|
|
|
|
|
|
|||||||||||
| Non-GAAP net loss |
$ | (15,055 | ) | $ | (34,520 | ) | $ | (32,713 | ) | $ | (7,059 | ) | $ | (13,361 | ) | |||||
|
|
|
|
|
|
|
|
|
|
|
|||||||||||
| Net loss per share attributable to common stockholders, basic and diluted |
$ | (1.45 | ) | $ | (1.81 | ) | $ | (1.88 | ) | $ | (0.42 | ) | $ | (0.68 | ) | |||||
| Accretion of Series A and B redeemable convertible preferred stock |
— | 0.03 | 0.03 | 0.01 | 0.01 | |||||||||||||||
| Stock-based compensation |
0.03 | 0.12 | 0.35 | 0.08 | 0.10 | |||||||||||||||
| Tax impact of stock-based compensation(1) |
— | — | — | — | — | |||||||||||||||
| Amortization of intangible assets(1) |
— | 0.01 | 0.03 | — | — | |||||||||||||||
| Recapitalization costs(1) |
1.16 | — | — | — | — | |||||||||||||||
|
|
|
|
|
|
|
|
|
|
|
|||||||||||
| Non-GAAP net loss per share, basic and diluted |
$ | (0.26 | ) | $ | (1.65 | ) | $ | (1.47 | ) | $ | (0.33 | ) | $ | (0.57 | ) | |||||
|
|
|
|
|
|
|
|
|
|
|
|||||||||||
| Weighted-average shares used to compute net loss per share attributable to common stockholders and non-GAAP net loss per share, basic and diluted |
57,654 | 20,974 | 22,211 | 21,257 | 23,495 | |||||||||||||||
|
|
|
|
|
|
|
|
|
|
|
|||||||||||
54
Table of Contents
| (1) | The tax effect of the adjustments to net loss attributable to common stockholders is based on the tax treatment for applicable tax jurisdictions. There was no tax effect related to the amortization of intangible assets or recapitalization costs as they were incurred in the United States in periods in which we had a net operating loss for which we maintained a full valuation allowance. |
Free Cash Flow
We use the non-GAAP measure of free cash flow, which we define as GAAP net cash flows from operating activities reduced by purchases of property and equipment. We believe free cash flow is an important liquidity measure of the cash (if any) that is available, after purchases of property and equipment, for operational expenses, investment in our business, and to make acquisitions. Free cash flow is useful to investors as a liquidity measure because it measures our ability to generate or use cash. Once our business needs and obligations are met, cash can be used to maintain a strong balance sheet and invest in future growth.
The following table summarizes our cash flows for the periods presented and presents a reconciliation of net cash from operating activities, the most directly comparable financial measure calculated in accordance with GAAP, to free cash flow, for each of the periods presented:
| Year Ended December 31, | Three Months Ended March 31, |
|||||||||||||||||||
| 2015 | 2016 | 2017 | 2017 | 2018 | ||||||||||||||||
| (in thousands) |
||||||||||||||||||||
| Net cash (used in) provided by operating activities |
$ | (2,076 | ) | $ | (2,785 | ) | $ | (6,266 | ) | $ | 1,187 | $ | 504 | |||||||
| Purchases of property and equipment |
(2,672 | ) | (5,776 | ) | (2,755 | ) | (460 | ) | (1,596 | ) | ||||||||||
|
|
|
|
|
|
|
|
|
|
|
|||||||||||
| Free cash flow |
$ | (4,748 | ) | $ | (8,561 | ) | $ | (9,021 | ) | $ | 727 | $ | (1,092 | ) | ||||||
|
|
|
|
|
|
|
|
|
|
|
|||||||||||
Our use of free cash flow has limitations as an analytical tool and you should not consider it in isolation or as a substitute for an analysis of our results under GAAP. First, free cash flow is not a substitute for net cash used in operating activities. Second, other companies may calculate free cash flow or similarly titled non-GAAP financial measures differently or may use other measures to evaluate their performance, all of which could reduce the usefulness of free cash flow as a tool for comparison. Additionally, the utility of free cash flow is further limited as it does not reflect our future contractual commitments and does not represent the total increase or decrease in our cash balance for a given period. Because of these and other limitations, you should consider free cash flow along with our GAAP financial measures.
55
Table of Contents
MANAGEMENT’S DISCUSSION AND ANALYSIS OF FINANCIAL CONDITION AND RESULTS OF OPERATIONS
The following discussion and analysis of our financial condition and results of operations should be read in conjunction with the section titled “Selected Consolidated Financial Data” and our consolidated financial statements and related notes included elsewhere in this prospectus. This discussion contains forward-looking statements that involve risks and uncertainties. Our actual results could differ materially from those discussed below. Factors that could cause or contribute to such difference include, but are not limited to, those identified below and those discussed in the section titled “Risk Factors” included elsewhere in this prospectus.
Overview
We are the first and only provider of solutions for a new category of cybersecurity that we call Cyber Exposure. Cyber Exposure is a discipline for managing and measuring cybersecurity risk in the digital era. Our enterprise platform enables broad visibility into an organization’s cyber exposure across the modern attack surface and deep insights that help organizations translate vulnerability data into business insights to understand and reduce their cybersecurity risk.
Our enterprise platform offerings include Tenable.io and SecurityCenter. Tenable.io is our SaaS offering that manages and measures cyber exposure across a range of traditional and modern IT assets. SecurityCenter was built to manage and measure cyber exposure across traditional IT assets and can be run on-premises, in the customer’s cloud or in a hybrid environment. Later in 2018, we plan to release Tenable.io Lumin, an application that will provide enhanced risk-based prioritization of issues and benchmarking against industry peers and best-in-class performers.
Our enterprise platform offerings are primarily sold on a subscription basis with terms ranging from one to three years, primarily one year. These offerings are typically prepaid in advance. To a lesser extent, we generate ratably recognizable revenue from perpetual licenses and from the related ongoing maintenance. Revenue from perpetual license sales is recognized ratably over a five-year estimated economic life in accordance with ASC 606. Revenue from our enterprise platform offerings accounted for 58%, 67%, 64% and 72% of total revenue in 2016, 2017 and the three months ended March 31, 2017 and 2018, respectively.
Many of our enterprise platform customers initially use either our free or paid version of Nessus, one of the industry’s most widely deployed vulnerability assessment solution. Nessus, which is the technology that underpins our enterprise platform offerings, is designed to quickly and accurately identify vulnerabilities, configuration and compliance issues and malware. Our free version of Nessus, Nessus Home, allows for vulnerability assessment over a limited number of IP addresses. We believe many of our Nessus customers begin with Nessus Home and subsequently upgrade to Nessus Professional, the paid version of Nessus; however, we expect many users to continue to use Nessus Home. Revenue from Nessus Professional accounted for 39%, 31%, 34% and 26% of total revenue in 2016, 2017 and the three months ended March 31, 2017 and 2018, respectively. Nessus Professional revenue as a percentage of total revenue has decreased as customers have increasingly adopted our enterprise platform offerings.
56
Table of Contents
The following graphic illustrates the number of cumulative free Nessus unique downloads from 2004 through 2017:
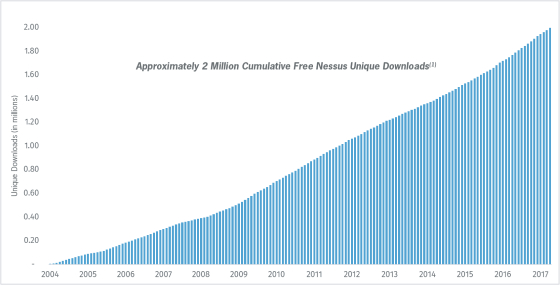
| (1) | Each unique download refers to an individual email address utilized to register for the use of Nessus Home. |
We believe that the cumulative number of unique downloads of the free version of Nessus is representative of our brand recognition among cybersecurity professionals and that continued growth in this number suggests broader awareness among potential customers. While we believe that the cumulative number of unique downloads may provide an indication of the growth and scale of our thought leadership and brand awareness, we do not expect this metric to necessarily correlate to future revenue growth opportunities, and we do not consider this metric a measure of our operating performance.
The following are key company milestones:
1998: Initial release of free version of Nessus under an open source license by co-founder Renaud Deraison
2002: Tenable founded
2003: Launched SecurityCenter enterprise platform
2005: Closed sourced Nessus (source code no longer published)
2008: Launched paid Nessus offering
2012: Enhanced SecurityCenter platform offering to include passive network monitoring
2015: Introduced enterprise subscription model and increased investment in sales and marketing to accelerate sales growth and customer acquisition
2017: Launched Tenable.io enterprise platform offering
2018: Announced Tenable.io Lumin
We sell and market our enterprise platform offerings through our field sales force that works closely with our channel partners, which includes a network of distributors and resellers, in developing sales opportunities. We use a two-tiered channel model whereby we sell our enterprise platform offerings to our distributors, which in turn sell to our resellers, which then sell to end users, which we call customers. Nessus Professional is also sold by our channel partners without the direct involvement of our sales force, as well as through our own e-commerce store. One of our distributors, Ingram Micro, Inc., accounted for 42%, 45%, 41% and 45% of revenue
57
Table of Contents
in 2016, 2017 and the three months ended March 31, 2017 and 2018, respectively. No customer accounted for more than 2% of revenue in 2016, 2017 or the three months ended March 31, 2017 or 2018.
Our enterprise platform offerings are generally priced based on the number of IT assets or IP addresses that a customer chooses to monitor. Subscriptions to Nessus Professional are generally priced on a per-license basis.
We believe the market for our solutions is large and growing as cybersecurity continues to become more strategic for organizations. We have made substantial investments in developing our platform offerings and expanding our sales and marketing footprint globally. Worldwide, we have offices in 12 countries, and our total employee base has grown from 751 as of December 31, 2016 to 984 as of December 31, 2017 and 1,054 as of March 31, 2018. Our international revenue represented 31% of our revenue for both 2016 and 2017 and 29% and 33% of our revenue for the three months ended March 31, 2017 and 2018, respectively. In the near future, we intend to continue to invest heavily to grow our business to take advantage of our market opportunity rather than optimizing for profitability or cash flow.
We have experienced rapid growth in recent years. Revenue in 2016, 2017 and the three months ended March 31, 2017 and 2018 was $124.4 million, $187.7 million, $40.5 million and $59.1 million, respectively, representing year-over-year growth of 51% and 46% for the annual and quarterly periods, respectively. Our net loss in 2016, 2017 and the three months ended March 31, 2018 was $37.2 million, $41.0 million and $15.9 million, respectively, as we continue to invest in our business and market opportunity.
Factors Affecting Our Performance
Product Leadership
We offer the first and only Cyber Exposure platform to provide visibility into the broadest range of traditional and modern IT assets across cloud and on-premises environments. We are intensely focused on continued innovation that empowers organizations to understand and reduce their cyber exposure. This includes ongoing development of our enterprise platform offerings. In February 2017, we released Tenable.io, our SaaS offering that is designed to provide broad visibility and insights across a broad range of traditional and modern IT assets and cloud environments. Throughout 2017, we introduced new features to Tenable.io, including web application scanning and container security.
In 2017, we introduced Industrial Security, an Operational Technology-specific offering that we developed in partnership with Siemens in order to provide continuous visibility and protection of Industrial Control Systems.
We also offer SecurityCenter, which manages vulnerabilities across traditional IT assets and provides automated assessment of security frameworks and compliance regulations. We continue to expand the capabilities of SecurityCenter, as well as our Nessus products, specifically as it relates to the ability to scan for and detect the rapidly expanding volume of vulnerabilities.
In addition, in late 2018 we plan to release Tenable.io Lumin, an application that will provide enhanced risk-based prioritization of issues and benchmarking against industry peers and best-in-class performers.
We intend to continue to invest in our engineering capabilities and marketing activities to maintain our position in the highly-competitive market for cybersecurity solutions. Our results of operations may fluctuate as we make these investments to drive increased customer adoption and usage.
58
Table of Contents
New Enterprise Platform Customer Acquisition
We believe that our customer base provides a significant opportunity to expand sales of our enterprise platform offerings. The following tables summarize key components of our customer base for the periods indicated:
| Year Ended December 31, |
Three Months Ended March 31, 2018 |
|||||||||||||||
| 2015 | 2016 | 2017 | ||||||||||||||
| Number of new enterprise platform customers(1) |
493 | 786 | 1,017 | 301 | ||||||||||||
| (1) | We define an enterprise platform customer as a customer that has licensed Tenable.io or SecurityCenter for an annual amount of $5,000 or greater. New enterprise platform customers represent new customer logos during the respective period and do not include customer conversion from Nessus Professional to enterprise platforms. |
| As of December 31, | As of March 31, 2018 |
|||||||||||||||
| 2015 | 2016 | 2017 | ||||||||||||||
| Number of customers with $100,000 and greater in annual contract value |
45 | 124 | 265 | 307 | ||||||||||||
We believe our ability to continue to grow our enterprise platform customers will increase future opportunities for renewals and follow-on sales. We believe that we have significant room to capture additional market share.
We expect to grow our enterprise platform customers by continuing to expand our sales organization and leveraging channel partner network, which we believe will allow us to identify new enterprise customers, enter new markets, including internationally, as well as to convert more of our existing Nessus Professional customers to enterprise platform customers.
We have increased our sales and marketing headcount in recent years and we will continue to invest significantly in our partner network and sales and marketing capability in order to grow domestically and internationally.
Retaining and Expanding Revenue from Existing Customers
Our enterprise platform offerings utilize IT asset-based or IP address-based pricing models. Once enterprise customers have licensed our platform offerings, they typically seek broader coverage over their traditional IT assets, including networking infrastructure, desktops and on-premises servers. As customers launch new applications or migrate existing applications to the cloud and deploy web applications, containers, IoT and OT, they often increase the scope of their subscriptions and/or add additional perpetual licenses to our enterprise platforms.
We are also focused on upselling customers from Nessus Professional to our enterprise platform offerings. Nessus customers are typically organizations or independent security consultants that use Nessus for a single vulnerability assessment at a point in time. We seek to convert our Nessus Professional users to customers of our enterprise platform offerings, which provide continuous visibility and insights into their attack surface.
Further, we plan to expand existing platform capabilities and launch new products, such as Tenable.io Lumin, which we believe will drive new product purchases and follow-on purchases over time, thereby contributing to customer renewals. We believe that there is a significant opportunity to drive additional sales to existing customers, and we expect to invest in sales and marketing and customer success personnel and activities to achieve additional revenue growth from existing customers.
The chart below illustrates enterprise platform annual recurring revenue, or ARR, from each customer cohort over the years presented, and illustrates how our customers spend more with us over time. We define
59
Table of Contents
enterprise platform ARR as subscription and maintenance payments we would contractually expect to receive from enterprise platform customers over the following 12 months. Each cohort represents customers that made their initial purchase from us during a given year. For example, the 2014 cohort represents all customers that made their initial purchase from us between January 1, 2014 and December 31, 2014.
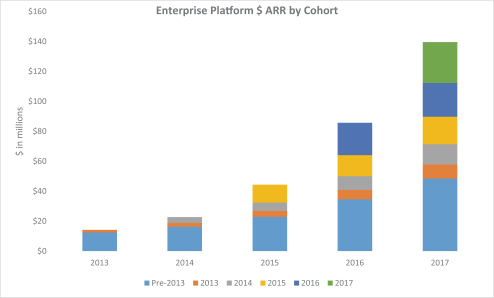
We believe our ability to expand sales with customers is most effectively measured by our dollar-based net expansion rate. We utilize dollar-based net expansion rate to measure the long-term value of our customer relationships because it is driven by our ability to retain and expand the revenue generated from our existing customers.
We calculate our dollar-based net expansion rate as follows:
| • | Denominator: To calculate our dollar-based net expansion rate as of the end of a reporting period, we first establish the ARR from all active subscriptions and maintenance from perpetual licenses as of the last day of the same reporting period in the prior year. This represents recurring payments that we expect to receive in the next 12-month period from the cohort of customers that existed on the last day of the same reporting period in the prior year. |
| • | Numerator: We measure the ARR for that same cohort of customers representing all subscriptions and maintenance from perpetual licenses based on customer orders as of the end of the reporting period. |
We calculate dollar-based net expansion rate by dividing the numerator by the denominator.
The following table summarizes our dollar-based net expansion rate for the trailing twelve months at December 31, 2016, 2017 and March 31, 2018;
| Trailing 12 Months Ended | ||||||||||||
| December 31, | March 31, | |||||||||||
| 2016 | 2017 | 2018 | ||||||||||
| Dollar-based net expansion rate |
125 | % | 121 | % | 124 | % | ||||||
If we had included in the numerator the annual contract value of incremental payments related to perpetual licenses and services from existing customers, our trailing 12-month dollar-based net expansion rate would have increased by over 10 percentage points at December 31, 2016, 2017 and March 31, 2018.
60
Table of Contents
Our ability to increase sales to existing customers will depend on a number of factors, including satisfaction or dissatisfaction with our products and services, competition, pricing, economic conditions or overall changes in our spending levels. Our dollar-based net expansion rate may fluctuate due to a number of factors, including the performance of our products, the rate of ARR expansion of our existing customers, potential changes in our rate of renewals and other factors described in this prospectus.
Investing in Business Growth
Since our founding, we have invested significantly in growing our business. In 2015, in order to accelerate customer acquisition and revenue growth, we accelerated our investments in our sales and marketing and research and development teams. We have financed this growth and our operations through sales of our software solutions and have not raised any primary institutional capital prior to this offering. The proceeds from our convertible preferred stock financings were fully used to repurchase shares of our capital stock. We intend to continue to invest in sales and marketing to grow our sales team, expand brand and Cyber Exposure awareness and optimize our channel partner network. We also intend to continue to invest in our research and development team to further our technological leadership position in Cyber Exposure and enhance the functionality of our solutions. Any investments we make in our sales and marketing and research and development teams will occur in advance of experiencing the benefits from such investments, so it may be difficult for us to determine if we are efficiently allocating resources in those areas. Our sales and marketing and research and development expense increased $30.6 million and $17.6 million, respectively, from 2016 to 2017 and $13.4 million and $4.7 million, respectively, from the three months ended March 31, 2017 to the three months ended March 31, 2018. These investment activities could increase our net losses over the short term if our revenue growth does not increase at a higher rates. However, we expect that these investments will benefit our results of operations.
Components of Our Results of Operations
Revenue
We generate revenue from subscription arrangements for our software and cloud-based solutions, perpetual licenses, maintenance associated with perpetual licenses and professional services. We begin to recognize revenue when control of our software or services is transferred to the customer, which for sales made through distributors is concurrent with the transfer to the end user.
Our subscription arrangements generally have annual or multi-year contractual terms and allow customers to use our software or cloud-based solutions, including ongoing software updates during the contractual period. Revenue is recognized ratably over the subscription term given the critical utility provided by the ongoing updates that are released throughout the contract period.
Our perpetual licenses are generally sold with one or more years of maintenance, which includes ongoing software updates. Given the critical utility provided by the ongoing software updates and updated ability to identify network vulnerabilities included in maintenance, we combined the perpetual license and the maintenance into a single performance obligation. Perpetual license arrangements generally contain a material right related to the customer’s ability to renew maintenance at a price that is less than the initial license fee. We apply a practical alternative to allocating a portion of the transaction price to the material right and estimate a hypothetical transaction price which includes fees for expected maintenance renewals based on the estimated economic life of perpetual license contracts. We currently estimate this economic life of perpetual license arrangements to be five years, based on historical contract attrition, expected renewal periods, the lifecycle of our technology and other factors. This estimate may change over time. We allocate the transaction price between the cybersecurity subscription provided in the initial contract and the material right related to expected contract renewals based on the hypothetical transaction price.
Professional services and other revenue is primarily comprised of advisory services and training related to the deployment and optimization of our products. These services do not result in significant customization of our products. Professional services and other revenue is recognized as the services are performed.
61
Table of Contents
On January 1, 2017, we early adopted ASC 606 under the modified retrospective method, applying the guidance to all contracts as of January 1, 2017. Under the modified retrospective method, periods prior to January 1, 2017 were not restated. The most significant impact of adopting ASC 606 was the deferral of perpetual license revenue over an estimated economic life, as discussed above, including estimated maintenance renewal periods, whereas under previous guidance we recognized perpetual license revenue upon delivery of the perpetual license. The impact of the adoption of ASC 606 on 2017 revenue was a net increase of $3.5 million after giving effect to the recognition of perpetual license revenue from prior year sales and the deferral of perpetual license revenue from 2017 sales.
Cost of Revenue
Cost of revenue includes personnel costs related to our technical support group that provides assistance to customers, including salaries, benefits, bonuses, payroll taxes and stock-based compensation. Cost of revenue also includes public cloud hosting costs for Tenable.io, the costs related to professional services and training, depreciation and amortization and allocated overhead costs, which consist of information technology and facilities.
We intend to continue to invest additional resources in our cloud-based platform and our customer support team as we grow our business. The level and timing of investment in these areas could affect our cost of revenue in the future.
Gross Profit and Gross Margin
Gross profit, or revenue less cost of revenue and gross margin, or gross profit as a percentage of revenue, have been and will continue to be affected by various factors, including the timing of our acquisition of new customers and our renewals of and follow-on sales to existing customers, the costs associated with operating our cloud-based platform, the extent to which we expand our customer support team and the extent to which we can increase the efficiency of our technology and infrastructure through technological improvements. We expect our gross profit to increase in absolute dollars but our gross margin to decrease, as we expect revenue from our cloud-based subscriptions to increase as a percentage of revenue, although our gross margin could fluctuate from period to period depending on the interplay of all of these factors.
Operating Expenses
Our operating expenses consist of sales and marketing, research and development and general and administrative expenses. Personnel costs are the most significant component of operating expenses and consist of salaries, benefits, bonuses, payroll taxes and stock-based compensation expense. Operating expenses also include depreciation and amortization as well as allocated overhead costs including IT and facilities costs.
Sales and Marketing
Sales and marketing expense consists of personnel costs, sales commissions that are recognized as expense over the period of benefit, marketing programs, travel and entertainment, expenses for conferences and events and allocated overhead costs.
Under ASC 606, sales commissions, including related incremental fringe benefit costs, on initial sales are not commensurate with sales commissions on contract renewals and therefore are deferred over an estimated period of benefit, which ranges between three and four years for subscription arrangements and five years for perpetual license arrangements. Sales commissions on contract renewals are capitalized and amortized ratably over the contract term, with the exception of contracts with renewal periods that are one year or less, in which case the incremental costs are expensed as incurred. In periods prior to January 1, 2017, sales commissions for subscriptions were capitalized and amortized over the corresponding period in which the related revenue was recognized. Commissions on perpetual license sales were recognized upon the delivery of the license. In 2017, commission expense was reduced by $8.8 million as a result of the adoption of ASC 606.
62
Table of Contents
We intend to continue to make significant investments in our sales and marketing teams to grow revenue, further penetrate the market and expand our global customer base. We expect our sales and marketing expense to continue to increase in absolute dollars and to be our largest operating expense category for the foreseeable future. However, as our revenue increases, we expect our sales and marketing expense to decrease as a percentage of our revenue over the long term, although our sales and marketing expense may fluctuate as a percentage of our revenue from period to period due to the timing and extent of these expenses.
Research and Development
Research and development expense consists of personnel costs, software used to develop our products, travel and entertainment, consulting and professional fees for third-party development resources as well as allocated overhead. Our research and development expense supports our efforts to continue to add capabilities to our existing products and enable the continued detection of new network vulnerabilities. We expect our research and development expense to continue to increase in absolute dollars for the foreseeable future, particularly in 2018, as we continue to invest in research and development efforts to enhance the functionality of our cloud-based platform. However, we expect our research and development expense to decrease as a percentage of our revenue over the long term, although our research and development expense may fluctuate as a percentage of our revenue from period to period due to the timing and extent of these expenses.
General and Administrative
General and administrative expense consists of personnel costs for our executive, finance, legal, human resources and administrative departments. Additional expenses include travel and entertainment, professional fees, insurance and allocated overhead. We expect our general and administrative expense to continue to increase in absolute dollars for the foreseeable future, in particular in 2018, due to additional costs associated with accounting, compliance, insurance and investor relations as we become a public company. However, we expect our general and administrative expense to decrease as a percentage of our revenue over the long term, although our general and administrative expense may fluctuate as a percentage of our revenue from period to period due to the timing and extent of these expenses.
Other Expense, Net
Other income (expense), net consists primarily of net foreign currency remeasurement and transaction gains and losses, income earned on cash and cash equivalents and interest expense in connection with unused line of credit fees on our revolving credit facility.
Provision for Income Taxes
Provision for income taxes consists primarily of income taxes in certain foreign jurisdictions in which we conduct business. We have recorded deferred tax assets for which a full valuation allowance has been provided, including net operating loss carryforwards and tax credits. We expect to maintain this full valuation allowance for the foreseeable future as it is more likely than not that some or all of those deferred tax assets may not be realized based on our history of losses.
63
Table of Contents
Results of Operations
The following tables set forth our consolidated results of operations for the periods presented in dollars and as a percentage of revenue:
| Year Ended December 31, |
Three Months Ended March 31, |
|||||||||||||||
| 2016 | 2017 | 2017 | 2018 | |||||||||||||
| (dollars in thousands) |
||||||||||||||||
| Revenue |
$ | 124,371 | $ | 187,727 | $ | 40,481 | $ | 59,107 | ||||||||
| Cost of revenue(1) |
14,219 | 25,588 | 4,438 | 8,728 | ||||||||||||
|
|
|
|
|
|
|
|
|
|||||||||
| Gross profit |
110,152 | 162,139 | 36,043 | 50,379 | ||||||||||||
| Operating expenses: |
||||||||||||||||
| Sales and marketing(1) |
85,736 | 116,299 | 26,168 | 39,588 | ||||||||||||
| Research and development(1) |
40,085 | 57,673 | 12,458 | 17,185 | ||||||||||||
| General and administrative(1) |
20,164 | 28,927 | 6,163 | 9,055 | ||||||||||||
|
|
|
|
|
|
|
|
|
|||||||||
| Total operating expenses |
145,985 | 202,899 | 44,789 | 65,828 | ||||||||||||
|
|
|
|
|
|
|
|
|
|||||||||
| Loss from operations |
(35,833 | ) | (40,760 | ) | (8,746 | ) | (15,449 | ) | ||||||||
| Other expense, net |
532 | 91 | 29 | 8 | ||||||||||||
|
|
|
|
|
|
|
|
|
|||||||||
| Loss before income taxes |
(36,365 | ) | (40,851 | ) | (8,775 | ) | (15,457 | ) | ||||||||
| Provision for income taxes |
843 | 171 | 51 | 431 | ||||||||||||
|
|
|
|
|
|
|
|
|
|||||||||
| Net loss |
$ | (37,208 | ) | $ | (41,022 | ) | $ | (8,826 | ) | $ | (15,888 | ) | ||||
|
|
|
|
|
|
|
|
|
|||||||||
| (1) | Includes stock-based compensation expense as follows: |
| Year Ended December 31, |
Three Months Ended March 31, |
|||||||||||||||
| 2016 | 2017 | 2017 | 2018 | |||||||||||||
| (dollars in thousands) |
||||||||||||||||
| Cost of revenue |
$ | 223 | $ | 281 | $ | 54 | $ | 77 | ||||||||
| Sales and marketing |
969 | 1,579 | 270 | 602 | ||||||||||||
| Research and development |
602 | 1,782 | 394 | 527 | ||||||||||||
| General and administrative |
738 | 4,118 | 908 | 1,193 | ||||||||||||
|
|
|
|
|
|
|
|
|
|||||||||
| Total stock-based compensation expense |
$ | 2,532 | $ | 7,760 | $ | 1,626 | $ | 2,399 | ||||||||
|
|
|
|
|
|
|
|
|
|||||||||
64
Table of Contents
The following table sets forth our consolidated statements of operations data expressed as a percentage of total revenue:
| Year Ended December 31, |
Three Months Ended March 31, |
|||||||||||||||
| 2016 | 2017 | 2017 | 2018 | |||||||||||||
| Percentage of Revenue Data: |
||||||||||||||||
| Revenue |
100 | % | 100 | % | 100 | % | 100 | % | ||||||||
| Cost of revenue |
11 | 14 | 11 | 15 | ||||||||||||
|
|
|
|
|
|
|
|
|
|||||||||
| Gross profit |
89 | 86 | 89 | 85 | ||||||||||||
| Operating expenses: |
||||||||||||||||
| Sales and marketing |
69 | 62 | 65 | 67 | ||||||||||||
| Research and development |
32 | 31 | 31 | 29 | ||||||||||||
| General and administrative |
16 | 15 | 15 | 15 | ||||||||||||
|
|
|
|
|
|
|
|
|
|||||||||
| Total operating expenses |
117 | 108 | 111 | 111 | ||||||||||||
|
|
|
|
|
|
|
|
|
|||||||||
| Loss from operations |
(29 | ) | (22 | ) | (22 | ) | (26 | ) | ||||||||
| Other expense, net |
0 | 0 | 0 | 0 | ||||||||||||
|
|
|
|
|
|
|
|
|
|||||||||
| Loss before income taxes |
(29 | ) | (22 | ) | (22 | ) | (26 | ) | ||||||||
| Provision for income taxes |
1 | 0 | 0 | 1 | ||||||||||||
|
|
|
|
|
|
|
|
|
|||||||||
| Net loss |
(30 | )% | (22 | )% | (22 | )% | (27 | )% | ||||||||
|
|
|
|
|
|
|
|
|
|||||||||
Comparison of the Three Months Ended March 31, 2017 and 2018
Revenue
| Three Months Ended March 31, |
Change | |||||||||||||||
| 2017 | 2018 | $ | % | |||||||||||||
| (dollars in thousands) | ||||||||||||||||
| Revenue |
$ | 40,481 | $ | 59,107 | $ | 18,626 | 46 | % | ||||||||
The increase in revenue of $18.6 million was comprised of increases in subscription revenue of $16.6 million, perpetual licenses and maintenance revenue of $1.5 million and professional services and other revenue of $0.5 million. Revenue from existing customers comprised 45% of the increase in revenue, while the remaining increase was due to revenue from new customers since April 1, 2017. The increase in professional services revenue resulted from the growth of our installed customer base. International revenue increased $7.5 million, or 63%.
Cost of Revenue, Gross Profit and Gross Margin
| Three Months Ended March 31, |
Change | |||||||||||||||
| 2017 | 2018 | $ | % | |||||||||||||
| (dollars in thousands) | ||||||||||||||||
| Cost of revenue |
$ | 4,438 | $ | 8,728 | $ | 4,290 | 97 | % | ||||||||
| Gross profit |
$ | 36,043 | $ | 50,379 | $ | 14,336 | 40 | % | ||||||||
| Gross margin |
89 | % | 85 | % | ||||||||||||
The increase in cost of revenue of $4.3 million was primarily due to a $2.0 million increase in third-party cloud infrastructure costs largely associated with the increased adoption of Tenable.io and a $1.9 million increase in personnel costs primarily associated with an increase in headcount. In addition, depreciation and amortization increased $0.2 million primarily from the amortization of purchased technology.
65
Table of Contents
Operating Expenses
Sales and Marketing
| Three Months Ended March 31, |
Change | |||||||||||||||
| 2017 | 2018 | $ | % | |||||||||||||
| (dollars in thousands) | ||||||||||||||||
| Sales and marketing |
$ | 26,168 | $ | 39,588 | $ | 13,420 | 51 | % | ||||||||
The increase in sales and marketing expense of $13.4 million was primarily due to a $6.2 million increase in personnel costs largely associated with an increase in headcount. Stock-based compensation accounted for $0.3 million of the increase in personnel costs. Expenses for demand generation programs, including advertising, sponsorships and brand awareness efforts aimed at acquiring new customers and our inaugural user conference held in February 2018, increased $2.6 million. Selling expenses, including travel and meeting costs as well as the costs of software subscriptions, increased $1.7 million. In addition, sales commissions increased $2.8 million from increased sales and the amortization of deferred commissions.
Research and Development
| Three Months Ended March 31, |
Change | |||||||||||||||
| 2017 | 2018 | $ | % | |||||||||||||
| (dollars in thousands) | ||||||||||||||||
| Research and development |
$ | 12,458 | $ | 17,185 | $ | 4,727 | 38 | % | ||||||||
The increase in research and development expense of $4.7 million was primarily due to a $3.3 million increase in personnel costs largely associated with an increase in headcount, which is net of $0.5 million of development costs capitalized related to internal use software in the three months ended March 31, 2018. Stock-based compensation accounted for $0.1 million of the increase in personnel costs. Other expenses, including travel costs, increased $0.7 million, largely related to our inaugural user conference. In addition, third-party cloud infrastructure costs increased $0.5 million related to the development of new and future offerings and allocated overhead increased $0.2 million driven by both the increase in headcount and the overall increase in such costs on a year-over-year basis.
General and Administrative
| Three Months Ended March 31, |
Change | |||||||||||||||
| 2017 | 2018 | $ | % | |||||||||||||
| (dollars in thousands) | ||||||||||||||||
| General and administrative |
$ | 6,163 | $ | 9,055 | $ | 2,892 | 47 | % | ||||||||
The increase in general and administrative expense of $2.9 million was primarily due to a $1.3 million increase in personnel costs largely associated with an increase in headcount. Stock-based compensation accounted for $0.3 million of the increase in personnel costs. In addition, professional fees increased $0.9 million and allocated overhead increased $0.1 million driven by both the increase in headcount and the overall increase in such costs on a year-over-year basis. Other expenses primarily including software subscriptions and travel costs increased $0.3 million.
66
Table of Contents
Comparison of 2016 and 2017
Revenue
| Year Ended December 31, |
Change | |||||||||||||||
| 2016 | 2017 | $ | % | |||||||||||||
| (dollars in thousands) | ||||||||||||||||
| Revenue |
$ | 124,371 | $ | 187,727 | $ | 63,356 | 51 | % | ||||||||
The increase in revenue of $63.4 million in 2017 was comprised of subscription revenue of $52.5 million, perpetual licenses and maintenance revenue of $10.0 million and professional services and other revenue of $0.9 million. Revenue from existing customers comprised 68% of the increase in revenue, while the remaining increase was due to revenue from new customers. The increase in professional services revenue resulted from the growth of our installed customer base. The impact of the ASC 606 adoption on 2017 revenue was a net increase of $3.5 million. International revenue increased $19.3 million, or 50%, consistent with our overall revenue growth rate.
Cost of Revenue, Gross Profit and Gross Margin
| Year Ended December 31, |
Change | |||||||||||||||
| 2016 | 2017 | $ | % | |||||||||||||
| (dollars in thousands) | ||||||||||||||||
| Cost of revenue |
$ | 14,219 | $ | 25,588 | $ | 11,369 | 80 | % | ||||||||
| Gross profit |
$ | 110,152 | $ | 162,139 | $ | 51,987 | 47 | % | ||||||||
| Gross margin |
89 | % | 86 | % | ||||||||||||
The increase in cost of revenue of $11.4 million was primarily due to a $5.4 million increase in third-party cloud infrastructure costs largely associated with the increased adoption of Tenable.io and a $4.0 million increase in personnel costs primarily associated with an increase in headcount. Stock-based compensation accounted for $0.1 million of the increase in personnel costs. In addition, depreciation and amortization increased $0.9 million primarily from the amortization of purchased technology and allocated overhead increased $0.8 million driven by both the increase in headcount and the overall increase in such costs on a year-over-year basis.
Operating Expenses
Sales and Marketing
| Year Ended December 31, |
Change | |||||||||||||||
| 2016 | 2017 | $ | % | |||||||||||||
| (dollars in thousands) | ||||||||||||||||
| Sales and marketing |
$ | 85,736 | $ | 116,299 | $ | 30,563 | 36 | % | ||||||||
The increase in sales and marketing expense of $30.6 million was primarily due to a $17.3 million increase in personnel costs largely associated with an increase in headcount. Stock-based compensation accounted for $0.6 million of the increase in personnel costs. Expenses for demand generation programs, including advertising, sponsorships and brand awareness efforts aimed at acquiring new customers increased $4.0 million. Selling expenses, including travel and meeting costs as well as the costs of software subscriptions, increased $3.9 million. In addition, sales commissions increased $2.7 million from increased sales and the amortization of deferred commissions, net of an $8.8 million reduction in commissions expense as a result of the adoption of ASC 606. Allocated overhead increased $2.1 million driven by both the increase in headcount and the overall increase in such costs on a year-over-year basis.
67
Table of Contents
Research and Development
| Year Ended December 31, |
Change | |||||||||||||||
| 2016 | 2017 | $ | % | |||||||||||||
| (dollars in thousands) | ||||||||||||||||
| Research and development |
$ | 40,085 | $ | 57,673 | $ | 17,588 | 44 | % | ||||||||
The increase in research and development expense of $17.6 million was primarily due to a $12.7 million increase in personnel costs largely associated with an increase in headcount. Stock-based compensation accounted for $1.2 million of the increase in personnel costs. Other expenses primarily including event and travel costs increased $2.0 million. In addition, third-party cloud infrastructure costs increased $1.7 million related to the development of new and future offerings and allocated overhead increased $1.2 million driven by both the increase in headcount and the overall increase in such costs on a year-over-year basis.
General and Administrative
| Year Ended December 31, |
Change | |||||||||||||||
| 2016 | 2017 | $ | % | |||||||||||||
| (dollars in thousands) | ||||||||||||||||
| General and administrative |
$ | 20,164 | $ | 28,927 | $ | 8,763 | 43 | % | ||||||||
The increase in general and administrative expense of $8.8 million was primarily due to a $5.6 million increase in personnel costs largely associated with an increase in headcount. Stock-based compensation accounted for $3.4 million of the increase in personnel costs. In addition, professional fees increased $1.0 million and allocated overhead increased $0.6 million driven by both the increase in headcount and the overall increase in such costs on a year-over-year basis.
Quarterly Results of Operations
The following tables summarize our unaudited quarterly consolidated statements of operations data for each of the nine quarters through the period ended March 31, 2018. The information for each of these quarters has been prepared on the same basis as our audited annual consolidated financial statements and reflect, in the opinion of management, all adjustments of a normal, recurring nature that are necessary for the fair presentation of the results of operations for these periods. This data should be read in conjunction with our consolidated financial statements included elsewhere in this prospectus. Historical results are not necessarily indicative of the results that may be expected in the future, and the quarterly results for the three months ended March 31, 2018 are not necessarily indicative of the results that may be expected for the full year ending December 31, 2018 or any other period.
68
Table of Contents
| Three Months Ended | ||||||||||||||||||||||||||||||||||||
| March 31, 2016 |
June 30, 2016 |
September 30, 2016 |
December 31, 2016 |
March 31, 2017 |
June 30, 2017 |
September 30, 2017 |
December 31, 2017 |
March 31, 2018 |
||||||||||||||||||||||||||||
| (in thousands) | ||||||||||||||||||||||||||||||||||||
| Revenue(1) |
$ | 25,591 | $ | 28,850 | $ | 33,733 | $ | 36,197 | $ | 40,481 | $ | 44,149 | $ | 48,980 | $ | 54,117 | $ | 59,107 | ||||||||||||||||||
| Cost of revenue(2) |
3,072 | 3,392 | 3,621 | 4,134 | 4,438 | 5,348 | 7,424 | 8,378 | 8,728 | |||||||||||||||||||||||||||
|
|
|
|
|
|
|
|
|
|
|
|
|
|
|
|
|
|
|
|||||||||||||||||||
| Gross profit |
22,519 | 25,458 | 30,112 | 32,063 | 36,043 | 38,801 | 41,556 | 45,739 | 50,379 | |||||||||||||||||||||||||||
| Operating expenses: |
||||||||||||||||||||||||||||||||||||
| Sales and marketing(1)(2) |
20,237 | 19,581 | 21,883 | 24,035 | 26,168 | 27,773 | 29,574 | 32,784 | 39,588 | |||||||||||||||||||||||||||
| Research and development(2) |
7,951 | 10,161 | 10,706 | 11,267 | 12,458 | 13,713 | 15,869 | 15,633 | 17,185 | |||||||||||||||||||||||||||
| General and administrative(2) |
4,258 | 5,209 | 5,029 | 5,668 | 6,163 | 6,544 | 7,275 | 8,945 | 9,055 | |||||||||||||||||||||||||||
|
|
|
|
|
|
|
|
|
|
|
|
|
|
|
|
|
|
|
|||||||||||||||||||
| Total operating expenses |
32,446 | 34,951 | 37,618 | 40,970 | 44,789 | 48,030 | 52,718 | 57,362 | 65,828 | |||||||||||||||||||||||||||
| Loss from operations |
(9,927 | ) | (9,493 | ) | (7,506 | ) | (8,907 | ) | (8,746 | ) | (9,229 | ) | (11,162 | ) | (11,623 | ) | (15,449 | ) | ||||||||||||||||||
| Other expense, net |
(3 | ) | 200 | 79 | 256 | 29 | (56 | ) | 92 | 26 | 8 | |||||||||||||||||||||||||
|
|
|
|
|
|
|
|
|
|
|
|
|
|
|
|
|
|
|
|||||||||||||||||||
| Loss before income taxes |
(9,924 | ) | (9,693 | ) | (7,585 | ) | (9,163 | ) | (8,775 | ) | (9,173 | ) | (11,254 | ) | (11,649 | ) | (15,457 | ) | ||||||||||||||||||
| Provision for income taxes |
10 | 132 | 31 | 670 | 51 | 41 | 59 | 20 | 431 | |||||||||||||||||||||||||||
|
|
|
|
|
|
|
|
|
|
|
|
|
|
|
|
|
|
|
|||||||||||||||||||
| Net loss |
$ | (9,934 | ) | $ | (9,825 | ) | $ | (7,616 | ) | $ | (9,833 | ) | $ | (8,826 | ) | $ | (9,214 | ) | $ | (11,313 | ) | $ | (11,669 | ) | $ | (15,888 | ) | |||||||||
|
|
|
|
|
|
|
|
|
|
|
|
|
|
|
|
|
|
|
|||||||||||||||||||
| (1) | We adopted Accounting Standards Codification Topic 606, Revenue From Contracts With Customers, or ASC 606, on January 1, 2017 using the modified retrospective method. The 2016 consolidated statements of operations were not adjusted for the adoption of ASC 606. See Note 2 to our consolidated financial statements included elsewhere in this prospectus for details on the impact of adopting ASC 606. |
| (2) | Includes stock-based compensation expense as follows: |
| Three Months Ended | ||||||||||||||||||||||||||||||||||||
| March 31, 2016 |
June 30, 2016 |
September 30, 2016 |
December 31, 2016 |
March 31, 2017 |
June 30, 2017 |
September 30, 2017 |
December 31, 2017 |
March 31, 2018 |
||||||||||||||||||||||||||||
| (in thousands) | ||||||||||||||||||||||||||||||||||||
| Cost of revenue |
$ | 20 | $ | 27 | $ | 93 | $ | 83 | $ | 54 | $ | 50 | $ | 63 | $ | 114 | $ | 77 | ||||||||||||||||||
| Sales and marketing |
143 | 243 | 312 | 271 | 270 | 358 | 409 | 542 | 602 | |||||||||||||||||||||||||||
| Research and development |
54 | 44 | 194 | 310 | 394 | 452 | 510 | 426 | 527 | |||||||||||||||||||||||||||
| General and administrative |
116 | 127 | 207 | 288 | 908 | 989 | 1,046 | 1,175 | 1,193 | |||||||||||||||||||||||||||
|
|
|
|
|
|
|
|
|
|
|
|
|
|
|
|
|
|
|
|||||||||||||||||||
| Total stock-based compensation expense |
$ | 333 | $ | 441 | $ | 806 | $ | 952 | $ | 1,626 | $ | 1,849 | $ | 2,028 | $ | 2,257 | $ | 2,399 | ||||||||||||||||||
|
|
|
|
|
|
|
|
|
|
|
|
|
|
|
|
|
|
|
|||||||||||||||||||
69
Table of Contents
The following table sets forth our consolidated statement of operations data for the nine quarters in the period ended March 31, 2018 expressed as a percentage of total revenue:
| Three Months Ended | ||||||||||||||||||||||||||||||||||||
| March 31, 2016 |
June 30, 2016 |
September 30, 2016 |
December 31, 2016 |
March 31, 2017 |
June 30, 2017 |
September 30, 2017 |
December 31, 2017 |
March 31, 2018 |
||||||||||||||||||||||||||||
| Revenue |
100 | % | 100 | % | 100 | % | 100 | % | 100 | % | 100 | % | 100 | % | 100 | % | 100 | % | ||||||||||||||||||
| Cost of revenue |
12 | 12 | 11 | 11 | 11 | 12 | 15 | 15 | 15 | |||||||||||||||||||||||||||
|
|
|
|
|
|
|
|
|
|
|
|
|
|
|
|
|
|
|
|||||||||||||||||||
| Gross profit |
88 | 88 | 89 | 89 | 89 | 88 | 85 | 85 | 85 | |||||||||||||||||||||||||||
| Operating expenses: |
||||||||||||||||||||||||||||||||||||
| Sales and marketing |
79 | 68 | 65 | 66 | 65 | 63 | 60 | 61 | 67 | |||||||||||||||||||||||||||
| Research and development |
31 | 35 | 32 | 31 | 31 | 31 | 32 | 29 | 29 | |||||||||||||||||||||||||||
| General and administrative |
17 | 18 | 15 | 16 | 15 | 15 | 15 | 17 | 15 | |||||||||||||||||||||||||||
|
|
|
|
|
|
|
|
|
|
|
|
|
|
|
|
|
|
|
|||||||||||||||||||
| Total operating expenses |
127 | 121 | 112 | 113 | 111 | 109 | 108 | 106 | 111 | |||||||||||||||||||||||||||
|
|
|
|
|
|
|
|
|
|
|
|
|
|
|
|
|
|
|
|||||||||||||||||||
| Loss from operations |
(39 | ) | (33 | ) | (22 | ) | (25 | ) | (22 | ) | (21 | ) | (23 | ) | (21 | ) | (26 | ) | ||||||||||||||||||
| Other expense, net |
0 | 1 | 0 | 1 | 0 | 0 | 0 | 0 | 0 | |||||||||||||||||||||||||||
|
|
|
|
|
|
|
|
|
|
|
|
|
|
|
|
|
|
|
|||||||||||||||||||
| Loss before income taxes |
(39 | ) | (34 | ) | (22 | ) | (25 | ) | (22 | ) | (21 | ) | (23 | ) | (22 | ) | (26 | ) | ||||||||||||||||||
|
|
|
|
|
|
|
|
|
|
|
|
|
|
|
|
|
|
|
|||||||||||||||||||
| Provision for income taxes |
0 | 0 | 0 | 2 | 0 | 0 | 0 | 0 | 1 | |||||||||||||||||||||||||||
|
|
|
|
|
|
|
|
|
|
|
|
|
|
|
|
|
|
|
|||||||||||||||||||
| Net loss |
(39 | )% | (34 | )% | (23 | )% | (27 | )% | (22 | )% | (21 | )% | (23 | )% | (22 | )% | (27 | )% | ||||||||||||||||||
|
|
|
|
|
|
|
|
|
|
|
|
|
|
|
|
|
|
|
|||||||||||||||||||
Quarterly Revenue Trends
Our quarterly revenue increased sequentially for all periods presented due primarily to an increase in the sales of subscription services and, to a lesser extent, perpetual licenses and maintenance revenue. We have historically experienced, and expect in the future to experience, seasonality in entering into agreements with customers. We typically enter into a significantly higher percentage of agreements with new customers, as well as renewal agreements with existing customers, in the third and fourth quarters of the year. The increase in customer agreements for the third quarter is primarily attributable to U.S. government and related agencies, and the increase in the fourth quarter is primarily attributable to large enterprise account buying patterns typical in the software industry. Our recent growth and the ratable nature of our subscription revenue makes this seasonality less apparent in our overall financial results.
Quarterly Cost of Revenue, Gross Profit and Gross Margin Trends
Cost of revenue increased sequentially as a result of the increase in our revenue. Gross profit increased sequentially for all periods presented primarily due to growth in revenue. Gross margins began to decrease in the second half of 2017 as we began making investments in building a public cloud infrastructure and a DevOps organization to support Tenable.io.
Quarterly Expense Trends
Total operating expenses generally increased sequentially for all periods presented primarily due to the addition of personnel in connection with the expansion of our business.
70
Table of Contents
Liquidity and Capital Resources
Since our inception, we have financed our operations through cash provided by operations, including payments received from customers using our software products and services, and we have not raised any primary institutional capital prior to this offering. The proceeds of our Series A and Series B redeemable convertible preferred stock financings were used to repurchase shares of capital stock from former stockholders. We had cash and cash equivalents consisting of bank deposits and money market funds of $26.4 million at March 31, 2018, of which $8.9 million was held by foreign subsidiaries. We have generated significant operating losses from our operations as reflected by our accumulated deficit of $408.5 million at March 31, 2018.
We typically invoice our customers annually in advance and, to a lesser extent, multi-year in advance. Therefore, a substantial source of our cash is from such prepayments, which are included on our consolidated balance sheets as deferred revenue. Deferred revenue consists primarily of the unearned portion of billed fees for our subscriptions and perpetual licenses, which is subsequently recognized as revenue in accordance with our revenue recognition policy. At March 31, 2018, we had deferred revenue of $230.6 million, of which $160.5 million was recorded as a current liability and is expected to be recorded as revenue in the next 12 months, provided all other revenue recognition criteria are met.
Our principal uses of cash in recent periods have been funding our operations, expansion of our sales and marketing and research and development activities and investments in infrastructure. We expect to continue incurring operating losses and generating negative cash flows from operations in the near-term; however, we believe that our existing cash and cash equivalents, together with amounts available under the revolving credit facility, will be sufficient to fund our operating and capital needs for at least the next 12 months. Our future capital requirements will depend on many factors, including our revenue growth rate, subscription renewal activity, the timing and extent of spending to support further infrastructure and research and development efforts, the timing and extent of additional capital expenditures to invest in new and existing office spaces, such as our new corporate headquarters, the expansion of sales and marketing and international operating activities, the timing of introduction of new product capabilities and enhancements of our platform and the continuing market acceptance of our platform.
We may in the future enter into arrangements to acquire or invest in complementary businesses, services and technologies, including intellectual property rights. We may be required to seek equity or debt financing. In the event that financing is required from outside sources, we may not be able to raise it on terms acceptable to us or at all. If we are unable to raise additional capital when desired, or if we cannot expand our operations or otherwise capitalize on our business opportunities because we lack sufficient capital, our business, operating results and financial condition would be adversely affected.
Credit Facility
In May 2017, we entered into a $25.0 million revolving credit facility with Silicon Valley Bank. Pursuant to the terms of the revolving credit facility, we may issue up to $5.0 million of letters of credit, which reduce the total amount available for borrowing under such facility. The revolving credit facility terminates on May 4, 2020. To date, we have not borrowed any amounts under the revolving credit facility.
Interest on borrowings under the revolving credit facility accrues at a variable rate tied to the prime rate or the LIBOR rate, at our election. Interest is payable quarterly in arrears. We are required to pay an annual commitment fee that accrues at a rate of 0.25% per annum on the unused portion of the borrowing commitment.
The revolving credit facility contains customary conditions to borrowing, events of default and covenants, including restrictions on indebtedness, liens, acquisitions and investments, restricted payments and dispositions. If, as of the last day of any quarter, the outstanding balance of the revolving credit facility exceeds $5 million, there are financial covenants that require us to maintain a minimum level of earnings before income taxes,
71
Table of Contents
interest, depreciation and amortization adjusted to add changes in deferred revenue for the period and a minimum current ratio level. We were in compliance with all covenants under the revolving credit facility at March 31, 2018.
Cash Flows
The following table summarizes our cash flows for the periods presented:
| Year Ended December 31, |
Three Months Ended March 31, |
|||||||||||||||
| 2016 | 2017 | 2017 | 2018 | |||||||||||||
| (in thousands) | ||||||||||||||||
| Net cash (used in) provided by operating activities |
$ | (2,785 | ) | $ | (6,226 | ) | $ | 1,187 | $ | 504 | ||||||
| Net cash used in investing activities |
(7,851 | ) | (2,755 | ) | (460 | ) | (1,596 | ) | ||||||||
| Net cash provided by financing activities |
1,363 | 2,091 | 1,408 | 363 | ||||||||||||
| Effect of exchange rate changes on cash and cash equivalents |
— | (68 | ) | 7 | (57 | ) | ||||||||||
|
|
|
|
|
|
|
|
|
|||||||||
| Net (decrease) increase in cash, cash equivalents and restricted cash |
$ | (9,273 | ) | $ | (6,998 | ) | $ | 2,142 | $ | (786 | ) | |||||
|
|
|
|
|
|
|
|
|
|||||||||
Operating Activities
Our principal source of operating cash is cash collections from our customers for software subscriptions and perpetual licenses. Our primary uses of cash from operating activities are for employee-related expenditures, infrastructure-related costs and marketing expenses. Net cash used in operating activities is impacted by our net loss adjusted for certain non-cash items, including stock-based compensation, depreciation and amortization, as well as the effect of changes in operating assets and liabilities.
In the three months ended March 31, 2018, net cash provided by operating activities was $0.5 million, which primarily consisted of our $15.9 million loss, adjusted for stock-based compensation expense of $2.4 million and depreciation and amortization of $1.5 million, as well as a net cash inflow of $12.5 million from changes in operating assets and liabilities. The net inflow from changes in operating assets and liabilities was primarily due to a $7.8 million decrease in accounts receivable due to collections from customers and a $4.8 million increase in deferred revenue primarily due to increased subscription sales as a majority of our customers are invoiced in advance. In addition, quarterly bonuses and commissions earned in the fourth quarter of 2017 were paid in the first quarter of 2018.
In the three months ended March 31, 2017, net cash provided by operating activities was $1.2 million, which primarily consisted of our $8.8 million loss, adjusted for stock-based compensation expense of $1.6 million and depreciation and amortization of $1.0 million, as well as a net cash inflow of $7.3 million from changes in operating assets and liabilities. The net inflow from changes in operating assets and liabilities was primarily due to a $5.2 million decrease in accounts receivable due to collections from customers and a $4.9 million increase in deferred revenue primarily due to increased subscription sales. In addition, quarterly bonuses and commissions earned in the fourth quarter of 2016 were paid in the first quarter of 2017.
In 2017, net cash used in operating activities was $6.3 million, which primarily consisted of our $41.0 million net loss, adjusted for stock-based compensation expense of $7.8 million and depreciation and amortization of $4.7 million, as well as a net cash inflow of $23.1 million from operating assets and liabilities. The net inflow from operating assets and liabilities was primarily due to an increase of $63.4 million in deferred revenue, excluding the cumulative impact of adopting the new revenue recognition guidance, from increased
72
Table of Contents
subscription sales as a majority of our customers are invoiced in advance partially offset by a $14.8 million increase in accounts receivable. In addition, deferred commissions increased $20.1 million, excluding the cumulative impact of adopting the new revenue recognition guidance. The increase in net cash used in operating activities in 2017 compared to 2016 was primarily due to an increase in our net loss, adjusted for stock-based compensation and depreciation and amortization, as well as a lower net cash inflow from changes in operating assets and liabilities.
In 2016, net cash used in operating activities was $2.8 million, which primarily consisted of our $37.2 million net loss, adjusted for depreciation and amortization of $3.1 million and stock-based compensation expense of $2.5 million, as well as a net cash inflow of $27.9 million from changes in operating assets and liabilities. The net inflow from operating assets and liabilities was primarily due to an increase of $44.2 million in deferred revenue from increased subscription sales as a majority of our customers are invoiced in advance partially offset by a $13.6 million increase in accounts receivable.
Investing Activities
Net cash used in investing activities is primarily impacted by purchases of property and equipment, particularly for making improvements to existing and new office spaces and purchasing furniture and equipment.
In the three months ended March 31, 2018 and 2017, net cash used in investing activities was $1.6 million and $0.5 million, respectively. The increase in cash used in investing activities was primarily due to the capitalization of development costs related to internal use software in 2018.
In 2017, net cash used in investing activities was $2.8 million, which primarily consisted of capital expenditures related to leasehold improvements for office build-outs. The decrease in cash used in investing activities in 2017 compared to 2016 was primarily due to a reduction in capital expenditures for infrastructure equipment and leasehold improvements.
In 2016, net cash used in investing activities was $7.9 million, which primarily consisted of capital expenditures related to our infrastructure and leasehold improvements for office build-outs, as well as our acquisition of a company for $2.1 million.
Financing Activities
Net cash provided by financing activities is primarily impacted by proceeds from the exercise of stock options, capital lease obligations for our infrastructure equipment and repurchases of common stock.
In the three months ended March 31, 2018 and 2017, net cash provided by financing activities was $0.4 million and $1.4 million, which primarily consisted of proceeds from the exercise of stock options.
In 2017, net cash provided by financing activities was $2.1 million, which primarily consisted of $3.0 million of proceeds from the exercise of stock options offset by principal payments of capital lease obligations, credit facility issuance costs and repurchases of common stock. The increase in cash provided by financing activities in 2017 compared to 2016 was primarily due to an increase of proceeds from the exercise of stock options.
In 2016, net cash provided by financing activities was $1.4 million, which primarily consisted of $1.0 million in proceeds from the state of Maryland as an economic incentive.
73
Table of Contents
Contractual Obligations
The following table summarizes our contractual obligations at December 31, 2017:
| Total | Less than 1 year |
1-3 years | 3-5 years | More than 5 years |
||||||||||||||||
| (in thousands) | ||||||||||||||||||||
| Operating lease commitments(1) |
$ | 82,940 | $ | 3,825 | $ | 7,631 | $ | 13,632 | $ | 57,852 | ||||||||||
| Capital lease commitments |
1,697 | 572 | 1,073 | 52 | — | |||||||||||||||
| Non-cancellable purchase obligations |
9,440 | 5,632 | 3,808 | — | — | |||||||||||||||
|
|
|
|
|
|
|
|
|
|
|
|||||||||||
| Total contractual obligations |
$ | 94,077 | $ | 10,029 | $ | 12,512 | $ | 13,684 | $ | 57,852 | ||||||||||
|
|
|
|
|
|
|
|
|
|
|
|||||||||||
| (1) | Consists of future non-cancelable minimum rental payments under operating leases for our offices including $68.2 million of future lease payments related to the lease of our new headquarters, which is currently being constructed. These lease payments are expected to commence in the first quarter of 2021. |
Not included in the table above is a $1.8 million financing obligation related to our build-to-suit lease for our future corporate headquarters, $1.2 million of unrecognized tax benefits and $0.8 million of asset retirement obligations, because the timing of future cash outflows is uncertain.
In October 2017, we entered into a new lease agreement for office space in Columbia, Maryland to serve as our new corporate headquarters. We currently anticipate to incur approximately $6 million of capital expenditures in excess of the tenant improvement reimbursement associated with the build-out. We plan to take possession of our new corporate headquarters in mid-2019, at which time we will begin to record rent expense. We expect to start making recurring rental payments under the lease in the first quarter of 2021. Included in the operating lease commitments above are total expected minimum obligations under the lease agreement of $68.2 million, which exclude $16.0 million of expected tenant improvement reimbursements and incentives from the landlord and variable operating expenses. We have also excluded a $2.5 million security deposit, which may be increased to $5.0 million, that is expected to be paid in advance of occupancy. At our option, we may deposit cash or provide an unconditional letter of credit, which would reduce the borrowing capacity under our revolving credit facility.
We are contractually obligated for our current corporate headquarters through May 2021. However, unless we transfer our contractual obligation, we will continue to include the committed lease payments for our current corporate headquarters in the table above.
Off-Balance Sheet Arrangements
At December 31, 2017 and March 31, 2018, we did not have any relationships with unconsolidated organizations or financial partnerships, such as structured finance or special purpose entities, which would have been established for the purpose of facilitating off-balance sheet arrangements or other contractually narrow or limited purposes.
Quantitative and Qualitative Disclosures about Market Risk
We are exposed to market risks in the ordinary course of our business, including interest rate, foreign currency exchange and inflation risks.
Interest Rate Risk
We had cash and cash equivalents of $26.4 million at March 31, 2018, consisting of cash deposits and money market funds. The primary objectives of our investment activities are the preservation of capital, the fulfillment of liquidity needs and the fiduciary control of cash and investments. We do not enter into investments for trading or speculative purposes. Due to the short-term nature of these instruments, we believe that we do not have any material exposure to changes in fair value as a result of changes in interest rates.
74
Table of Contents
We have not had any amounts outstanding under the revolving credit facility since it was established in May 2017. Any borrowings under the revolving credit facility would bear interest at a variable rate tied to the prime rate or the LIBOR rate. We do not have any other long-term debt or financial liabilities with floating interest rates that would subject us to interest rate fluctuations.
A hypothetical 10% change in interest rates during any of the periods presented would not have had a material impact on our financial statements.
Foreign Currency Exchange Risk
Substantially all of our sales contracts are denominated in U.S. dollars, with a limited number of contracts denominated in foreign currencies. A portion of our operating expenses are incurred outside the United States, denominated in foreign currencies and subject to fluctuations due to changes in foreign currency exchange rates, particularly changes in the Euro, British Pound and Australian dollar. Additionally, fluctuations in foreign currency exchange rates may cause us to recognize remeasurement and transaction gains (losses) in our consolidated statements of operations. As the impact of foreign currency exchange rates has not been material to our historical operating results, we have not entered into derivative or hedging transactions, but we may do so in the future if our exposure to foreign currency becomes more significant.
Inflation Risk
We do not believe that inflation has had a material effect on our business, results of operations, or financial condition. Nonetheless, if our costs were to become subject to significant inflationary pressures, we may not be able to fully offset such higher costs. Our inability or failure to do so could harm our business, results of operations, or financial condition.
Critical Accounting Policies and Estimates
Our financial statements are prepared in accordance with U.S. GAAP. The preparation of these financial statements requires us to make estimates and assumptions that affect the reported amounts of assets, liabilities, revenue and expenses, as well as related disclosures. We evaluate our estimates and assumptions on an ongoing basis. Our estimates are based on historical experience and various other assumptions that we believe to be reasonable under the circumstances. Our actual results could differ from these estimates.
The critical accounting estimates, assumptions and judgments that we believe have the most significant impact on our consolidated financial statements are described below.
Revenue Recognition
We early adopted ASC 606 on January 1, 2017 using the modified retrospective method and applying the guidance to all contracts as of January 1, 2017.
The core principle of ASC 606 is that revenue should be recognized to depict the transfer of promised goods or services to customers in an amount that reflects the consideration to which the entity expects to be entitled in exchange for those goods or services. To achieve the core principle of ASC 606, we apply the following steps:
| • | Identify the contract with a customer |
| • | Identify the performance obligations in the contract |
| • | Determine the transaction price |
| • | Allocate the transaction price to the performance obligations in the contract |
| • | Recognize revenue when or as performance obligations are satisfied |
We generate revenue from subscription arrangements for our software and cloud-based solutions, perpetual licenses, maintenance associated with perpetual licenses and professional services and other revenue.
75
Table of Contents
Subscription Revenue
Our subscription arrangements generally have annual or multi-year contractual terms and allow customers to use our software or cloud solutions, including ongoing software updates and the ability to identify the latest cybersecurity vulnerabilities. Revenue is recognized ratably over the subscription term given the critical utility provided by the ongoing updates that are released throughout the contract period.
Perpetual License and Maintenance Revenue
Our perpetual licenses are generally sold with one or more years of maintenance, which include ongoing software updates and the ongoing ability to identify the latest cybersecurity vulnerabilities. Given the critical utility provided by the ongoing software updates and updated ability to identify network vulnerabilities included in maintenance, we combine the perpetual license and the maintenance into a single performance obligation. Perpetual license arrangements generally contain a material right related to the customer’s ability to renew maintenance at a price that is less than the initial license fee. We apply a practical alternative to allocating a portion of the transaction price to the material right and estimate a hypothetical transaction price which includes fees for expected maintenance renewals based on the estimated economic life of the perpetual license contracts. We recognize the amount allocated to the combined license and maintenance performance obligation and the amount allocated to the material right over a five-year period, which represents the combination of the initial contractual period (generally one year) and the estimated number of contract renewals (generally four years). We have estimated this five-year economic life of perpetual license contracts based on historical contract attrition, expected renewal periods, the lifecycle of the our technology and other factors. While we believe that the estimates we have made are reasonable and appropriate, different assumptions and estimates could materially impact our reported financial results. We allocate the transaction price between the cybersecurity subscription provided in the initial contract and the material right related to expected contract renewals based on the hypothetical transaction price.
Professional Services and Other Revenue
Professional services and other revenue is primarily comprised of advisory services and training related to the deployment and optimization of our products. These services do not result in significant customization of our products. Professional services and other revenue is recognized as the services are performed.
Contracts with Multiple Performance Obligations
In cases where our contracts with customers contain multiple performance obligations, the contract transaction price is allocated on a relative standalone selling price basis. We typically determine standalone selling price based on observable selling prices of our products and services.
Variable Consideration
We record revenue from sales at the net sales price, which is the transaction price, including estimates of variable consideration when applicable. Certain of our customers may be entitled to receive credits and in certain circumstances, refunds, if service level commitments are not met. We have not historically experienced significant incidents affecting the ability to meet these service level commitments and any estimated refunds related to these agreements have not been material.
Sales through our channel partner network of distributors and resellers are generally discounted as compared to the price that we would sell to an end user. Revenue for sales through our channel network, which is fixed, is recorded net of any distributor or reseller margin.
Legacy Revenue Accounting Policies
For periods prior to January 1, 2017, we recognized revenue when all the following criteria were met: (1) persuasive evidence of an arrangement exists, (2) delivery has occurred, (3) the fee is fixed or determinable and (4) collectability is reasonably assured.
76
Table of Contents
We recognized subscription revenue ratably over the term of the subscription period in accordance with ASC 605, Revenue Recognition. When subscription arrangements involved multiple elements that qualified as separate units of accounting, we allocated arrangement consideration at the inception of the arrangement to all deliverables based on the relative selling price method in accordance with the selling price hierarchy, which included (i) vendor-specific objective evidence, or VSOE, if available, (ii) third-party evidence, or TPE, if VSOE was not available, and (iii) best estimate of selling price, or BESP, if neither VSOE nor TPE were available. When VSOE could not be established for deliverables within subscription arrangements, we utilized BESP in our allocation of arrangement consideration, as it generally could not establish TPE. BESP was determined by considering multiple factors including, but not limited to, prices charged for similar offerings, market conditions, competitive landscape and pricing practices.
We recognized perpetual license revenue upon delivery of the license in accordance with ASC 985-605, Software—Revenue Recognition. We established VSOE of fair value for substantially all products and services with the exception of new subscription agreements and perpetual licenses. VSOE was established for maintenance and support based upon actual renewals and historical pricing when sold separately. Revenue from maintenance agreements was deferred and recognized ratably over the term of the maintenance period. The VSOE of fair value for professional services was based on the price for these same services when they were sold separately.
Other services revenue was recognized as the services were performed.
Deferred Commissions
In connection with our adoption of ASC 606, sales commissions, including related incremental fringe benefit costs, are considered to be incremental costs of obtaining a contract, and therefore are deferred over an estimated period of benefit, which ranges between three and four years for subscription arrangements and five years for perpetual license arrangements. We have estimated the period of benefit based on the expected contract term including renewal periods, the lifecycle of our technology and other factors. Sales commissions on contract renewals are capitalized and amortized ratably over the contract term, with the exception of contracts with renewal periods that are one year or less, in which case the incremental costs are expensed as incurred. While we believe that the estimates we have made are reasonable and appropriate, different assumptions and estimates could materially impact our reported financial results.
Prior to January 1, 2017, we capitalized sales commissions for subscriptions and recognized the expense over the corresponding period in which the related revenue was recognized. Commissions on perpetual license sales were recognized upon the delivery of the license.
Stock-Based Compensation
Stock-based compensation expense is calculated based on the fair value of the awards granted and is recognized on a straight-line basis over the requisite service period of the awards, which is generally three to four years. The fair value of each option award is estimated on the grant date using the Black-Scholes option pricing model, which requires us to make assumptions and judgements, including the fair value of the underlying common stock, expected term, expected volatility and risk-free interest rates. The fair value of restricted stock is based on the estimated fair value of our common stock at the date of the grant.
Prior to January 1, 2017, we recognized stock-based compensation expense net of estimated forfeitures. We adopted Accounting Standards Update, or ASU, No. 2016-09—Compensation-Stock Compensation (Topic 718): Improvement to Employee Share-based Payment Accounting, or ASU 2016-09, on January 1, 2017 and made an accounting policy election to account for forfeitures as they occur. This election was applied on a modified retrospective basis, resulting in a cumulative-effect adjustment to increase accumulated deficit by $0.1 million.
77
Table of Contents
ASU 2016-09 also requires excess tax benefits and tax deficiencies be recorded in the income statement as opposed to additional paid-in capital when the awards vest or are settled, and we applied this on a prospective basis beginning on January 1, 2017. In addition, ASU 2016-09 eliminated the requirement that excess tax benefits be realized before they can be recorded. As a result, on January 1, 2017, we recorded a $1.9 million deferred tax asset attributable to excess tax benefits from stock-based compensation, which had not been previously recognized, with a corresponding increase to the valuation allowance.
Estimating the fair value of stock options using the Black-Scholes option-pricing model requires assumptions as to the fair value of our underlying common stock, the estimated term of the option, the risk free interest rates, the expected volatility of the price of our common stock and the expected dividend yield. The assumptions used to estimate the fair value of the option awards reflect our best estimates. If any of the assumptions change significantly, stock-based compensation for future awards may differ significantly compared with the awards granted previously.
The assumptions and estimates are as follows:
| • | Fair Value of Common Stock—see “Common Stock Valuations” discussion below. |
| • | Expected Term—This is the period of time that the options granted are expected to remain unexercised. We employ the simplified method to calculate the average expected term. |
| • | Volatility—This is a measure of the amount by which a financial variable, such as a share price, has fluctuated (historical volatility) or is expected to fluctuate (expected volatility) during a period. As we do not yet have sufficient history of our own volatility, we have identified several public entities of similar size, complexity and stage of development and estimate volatility based on the volatility of these companies. |
| • | Risk-Free Interest Rate—This is the U.S. Treasury rate, having a term that most closely resembles the expected life of the stock option. |
| • | Dividend Yield—We have not and do not expect to pay dividends on our common stock. |
Common Stock Valuations
Prior to our initial public offering, the lack of an active public market for our common stock requires our board of directors to exercise reasonable judgement and consider a number of factors in order to make the best estimate of fair value of our common stock, in accordance with the technical practice-aid issued by the American Institute of Certified Public Accountants Practice Aid entitled Valuation of Privately-Held Company Equity Securities Issued as Compensation. Factors considered in connection with estimating the fair value of our common stock underlying our award of restricted stock and stock option awards when performing the fair value calculations with the Black Scholes option-pricing model included:
| • | The results of independent third-party valuations of our common stock |
| • | Recent arm’s length transactions involving the sale or transfer of our common stock |
| • | The rights, preferences and privileges of our Series A and Series B redeemable convertible preferred stock relative to those of our common stock |
| • | Our historical financial results and future financial projections |
| • | The market value of equity interests in substantially similar businesses, which equity interests can be valued through nondiscretionary, objective means |
| • | The lack of marketability of our common stock |
| • | The likelihood of achieving a liquidity event, such as an initial public offering given prevailing market conditions |
78
Table of Contents
| • | Industry outlook |
| • | General economic outlook including economic growth, inflation and unemployment, interest rate environment and global economic trends |
As described above, the exercise price of our stock option awards was determined by our board of directors, with input from management, taking into account the factors described above, using a combination of valuation methodologies with varying weighting applied to each methodology as of the grant date.
Application of these approaches involves the use of estimates, judgment and assumptions that are highly complex and subjective, such as those regarding our expected future revenue, expenses and future cash flows, discount rates, market multiples, the selection of comparable companies and the probability of possible future events. Changes in any or all of these estimates and assumptions or the relationships between those assumptions impact our valuations as of each valuation date and may have a material impact on the valuation of our common stock.
The following table summarizes by grant date the number of shares of common stock subject to stock options and awards of restricted stock granted from January 1, 2017 through March 31, 2018, as well as the associated per share exercise price for options granted and the estimated fair value per share of our common stock on the grant date.
| Grant Date |
Number of Shares Underlying Equity Awards Granted |
Exercise Price per Share for Options Granted |
Fair Value per Share |
|||||||||
| January 18, 2017 |
5,110,571 | $ | 4.25 | $ | 4.25 | |||||||
| January 18, 2017 |
1,582,685 | — | (1) | 4.25 | ||||||||
| February 23, 2017 |
87,000 | 4.25 | 4.25 | |||||||||
| February 27, 2017 |
1,170,000 | 4.25 | 4.25 | |||||||||
| May 23, 2017 |
716,000 | 5.96 | 5.96 | |||||||||
| June 26, 2017 |
559,500 | 7.75 | 7.75 | |||||||||
| July 26, 2017 |
49,000 | 7.75 | 7.75 | |||||||||
| September 19, 2017 |
373,500 | 7.75 | 7.75 | |||||||||
| September 20, 2017 |
10,000 | 7.75 | 7.75 | |||||||||
| September 25, 2017 |
25,000 | 7.75 | 7.75 | |||||||||
| October 26, 2017 |
410,500 | 9.66 | 9.66 | |||||||||
| December 7, 2017 |
348,000 | 9.66 | 9.66 | |||||||||
| December 21, 2017 |
83,000 | 9.66 | 9.66 | |||||||||
| December 29, 2017 |
80,000 | 9.66 | 9.66 | |||||||||
| February 21, 2018 |
722,000 | 10.97 | 10.97 | |||||||||
| March 14, 2018 |
443,000 | 10.97 | 10.97 | |||||||||
| (1) | Represents award of restricted stock. |
On May 8, 2018 we granted stock options to purchase 736,500 shares of our common stock at an exercise price of $14.06 per share. On June 21, 2018, we granted options to purchase 4,012,148 shares of our common stock at $16.21 per share and restricted stock units for 973,800 shares of our common stock. The restricted stock units vest upon the satisfaction of both a service-based vesting condition and a performance-based vesting condition. The performance-based vesting condition will be satisfied upon the expiration of the lock-up period following the completion of an initial public offering of our common stock.
Following this offering, it will not be necessary for the board of directors to estimate the fair value of our common stock, as the shares will be traded in the public market.
Based upon the initial public offering price of $ per share, which is the midpoint of the estimated offering price range set forth on the cover page of this prospectus, the aggregate intrinsic value of outstanding stock options as of March 31, 2018 was $ million, with $ million related to vested stock options, and the value of restricted stock outstanding as of March 31, 2018 was $ million.
79
Table of Contents
Income Taxes
We are subject to federal, state and local taxes in the United States as well as numerous international jurisdictions. These foreign jurisdictions have different statutory tax rates than the United States. Earnings generated by our international entities are related to transfer pricing requirements as applicable under local jurisdiction tax laws.
We record a provision for income taxes under the asset and liability method, which requires recognition of deferred tax assets and liabilities for the expected future tax consequences of temporary differences between the financial statement carrying amounts and the tax basis of existing assets and liabilities, net operating loss carryforwards and tax credit carryforwards. Deferred tax assets and liabilities are measured using the tax rates that are expected to apply to taxable income for the years in which those tax assets and liabilities are expected to be realized or settled. A valuation allowance is provided if it is more likely than not that some or all of the deferred tax assets will not be realized. We have valuation allowances in all jurisdictions against deferred tax assets net of deferred tax liabilities that will reverse and provide a source of taxable income. Our evaluation of valuation allowances could change in the future and the impact could have a material impact on our financial statements.
We recognize tax benefits from an uncertain tax position if it is more likely than not to be sustained upon audit by the relevant taxing authority. Interest and penalties associated with such uncertain tax positions are classified as a component of income tax expense.
The Tax Cuts and Jobs Act, or the 2017 Tax Act, was enacted into law, which contains several significant changes to how corporations are taxed in the United States, including the reduction of the corporate income tax rate from 35% to 21% effective January 1, 2018. The new legislation also includes a variety of other changes, such as a one-time repatriation tax on accumulated foreign earnings, or transition tax, acceleration of business asset expensing and reduction in the amount of executive pay that could qualify as a tax deduction.
The 2017 Tax Act also included international tax provisions that will affect the Company, including the favorable tax regime for taxing foreign derived intangible income. Additional international provisions include the global intangible low taxed income, or GILTI, regime and the base erosion anti-abuse tax.
Depending on the jurisdiction, distributions of earnings could be subject to withholding taxes at rates applicable to the distributing jurisdiction. As we intend to continue to reinvest the earnings of foreign subsidiaries indefinitely, we have not provided for a U.S. income tax liability and foreign withholding taxes on undistributed foreign earnings of foreign subsidiaries.
We have not yet completed the accounting for the tax effects of the enactment of the 2017 Tax Act, but have made a reasonable estimate of the effects on existing deferred tax balances and the one-time transition tax. We will continue to evaluate our transition tax obligation and application of GILTI and we have not yet made an election with regard to GILTI. Subsequent adjustments resulting from additional analysis may be recorded in 2018 when our analysis is expected to be completed and any adjustments may materially impact our provision for income taxes in the period in which the adjustments are made.
Emerging Growth Company Status
We are an emerging growth company, as defined in the JOBS Act. Under the JOBS Act, emerging growth companies can delay adopting new or revised accounting standards issued subsequent to the enactment of the JOBS Act until such time as those standards apply to private companies. We have irrevocably elected not to avail ourselves of this exemption from new or revised accounting standards and, therefore, we will be subject to the same new or revised accounting standards as other public companies that are not emerging growth companies.
Recently Issued Accounting Pronouncements
Refer to Note 2 to our consolidated financial statements included elsewhere in this prospectus for more information regarding recently issued accounting pronouncements.
80
Table of Contents
Overview
We are the first and only provider of solutions for a new category of cybersecurity that we call Cyber Exposure. Cyber Exposure is a discipline for managing and measuring cybersecurity risk in the digital era. We are building on our deep technology expertise in the traditional vulnerability assessment and management market and expanding that market to include modern attack surfaces and provide analytics that translate vulnerability data into business insight.
Digital transformation is driving radical change. As organizations modernize their IT infrastructure and adopt cloud or hybrid cloud architectures that are no longer housed in the confines of their corporate networks, they have less visibility and control over the security of these assets. Organizations are also increasingly implementing modern solutions, such as Internet of Things, or IoT, devices and application containers, to enable the rapid development and deployment of new products, services and business models, as well as to drive operational efficiencies. Further, safety-critical Operational Technology, or OT, such as Industrial Control Systems, are now network-connected and need to be secured from cybersecurity threats. This digital transformation increases IT complexity and cybersecurity risk as attack surfaces expand. We refer to an organization’s inability to see the breadth of the modern attack surface and analyze the level of cyber exposure as the Cyber Exposure Gap.
While other functions in an organization, such as finance and operations, have a system to help them manage and measure risk, to date, cybersecurity risk has not been adequately measured and understood. Our platform is built to be the Cyber Exposure Command Center for an organization’s Chief Information Security Officer, or CISO. Our platform provides the CISO with unified visibility into the organization’s state of security and enables security teams to prioritize and focus their remediation efforts. Our platform also translates vulnerability data into actionable business metrics and insights that boards of directors and executives can understand and use to make strategic decisions. We believe our Cyber Exposure solutions are transforming how security is managed and measured and will help organizations more rapidly embrace digital transformation.
Our enterprise platform offerings include Tenable.io and SecurityCenter. Tenable.io is our software as a service, or SaaS, offering that manages and measures cyber exposure across a range of traditional IT assets, such as networking infrastructure, desktops and on-premises servers, and modern IT assets, such as cloud workloads, containers, web applications, IoT and OT assets. SecurityCenter is built to manage and measure cyber exposure across traditional IT assets and can be run on-premises, in the cloud or in a hybrid environment. Our platform offerings provide broad visibility into security issues such as vulnerabilities, misconfigurations, internal and regulatory compliance violations and other indicators of the state of an organization’s security. We also provide deep analytics to help organizations measure trends in their cyber exposure over time. Our platform integrates and analyzes data from our native collectors alongside IT asset, vulnerability and threat data from third-party systems and applications to prioritize security issues for remediation and focus an organization’s resources based on risk and business criticality. Later in 2018, we plan to release Tenable.io Lumin, an application that will provide enhanced risk-based prioritization of issues and benchmarking against industry peers and best-in-class performers.
We believe that our long history in vulnerability management provides us with a significant competitive advantage in closing the Cyber Exposure Gap. We have been an integral part of the cybersecurity market for nearly two decades, initially by helping organizations assess their IT environments for vulnerabilities. Our co-founder is the creator of Nessus, one of the most widely deployed vulnerability assessment solutions in the cybersecurity industry, which underpins our enterprise platform offerings. Since the introduction of Nessus in 1998, an extensive community of Nessus users has emerged. We continue to cultivate knowledge and affinity within this user base, which, when combined with our enterprise customers and our Tenable Research team of cybersecurity and data science experts, creates powerful network effects in the form of a continuous feedback loop of data and insights. We use these learnings to expand our assessment capabilities and coverage, continually
81
Table of Contents
optimize our solutions and inform our product strategy and innovation priorities. These data and insights will also fuel and strengthen our benchmarking capabilities over time. We believe the breadth and scale of our data asset is a sustainable advantage and, as the size of our network increases, the value of our data and insights increases and extends our competitive barrier.
We believe we have a differentiated business model in the cybersecurity industry that combines the adoption benefits of our free version of Nessus, Nessus Home, and our paid version of Nessus, Nessus Professional, both of which serve as on-ramps for customers and potential customers to migrate to our enterprise platform. Our free version of Nessus has had approximately two million cumulative unique downloads over the past 20 years, which we believe has created broad familiarity and affinity with our products, as well as mindshare among the overwhelming majority of security practitioners. Among our approximately 19,000 Nessus Professional customers, we believe we have significant opportunity to drive adoption of our enterprise platform offerings.
As of December 31, 2016 and 2017, we had over 21,000 and 24,000 customers, respectively, who licensed our Tenable.io, SecurityCenter or Nessus Professional products. This includes over 3,100 and 4,400 enterprise platform customers at those respective dates, which we define as a customer that has a current license for Tenable.io or SecurityCenter for an annual amount of $5,000 or greater. Our customers are located in over 160 countries and include enterprises of all sizes and government agencies around the world. As of December 31, 2017, 53% of the Fortune 500 and 29% of the Global 2000 organizations licensed paid versions of our various products, including enterprise platform customers in 30 of the Fortune 500 and 58 of the Global 2000 organizations. In 2017, our billings to large enterprises, mid-size enterprises and small enterprises were 55%, 21% and 24% respectively. We define large enterprises as customers with greater than 2,500 employees, mid-size enterprises as customers with 250 to 2,500 employees and small enterprises as customers with fewer than 250 employees.
We have experienced rapid growth in recent periods. Our enterprise platform offerings are primarily sold on an annual prepaid subscription basis. In 2016 and 2017, our total revenue was $124.4 million and $187.7 million, respectively, representing a year-over-year growth rate of 51%. In the three months ended March 31, 2017 and 2018, our total revenue was $40.5 million and $59.1 million, respectively, representing a year-over-year growth rate of 46%. In both 2016 and 2017, our recurring revenue, which includes revenue from subscription arrangements for software and cloud-based solutions and maintenance associated with perpetual licenses, represented 86% of our total revenue. In the three months ended March 31, 2017 and 2018, our recurring revenue represented 85% and 89%, respectively, of our total revenue. Our net loss was $37.2 million, $41.0 million and $15.9 million in 2016, 2017 and the three months ended March 31, 2018, respectively. Our net cash (used in) provided by operating activities was $(2.8) million, $(6.3) million and $0.5 million in 2016, 2017 and the three months ended March 31, 2018, respectively, and our free cash flow, a non-GAAP measure, was $(8.6) million, $(9.0) million and $(1.1) million, respectively, for those periods. We have not raised any primary institutional capital prior to this offering. See “Management’s Discussion and Analysis of Financial Condition and Results of Operations” for further description and analysis of our financial results and “Selected Consolidated Financial Data—Non-GAAP Financial Measures” for a discussion of how we calculate free cash flow, including a reconciliation to the most directly comparable GAAP measure.
82
Table of Contents
Industry Background
Digital Transformation Increases IT Complexity and Cybersecurity Risk
Organizations of all sizes across industries are embracing digital transformation in order to seek competitive advantages. New digital technologies and modern compute platforms enable organizations to rapidly deliver new products and services, create agile business models and revenue streams and enhance levels of operational efficiency. While digital transformation creates new opportunities, the underlying technologies and platforms that enable this transformation dramatically increase IT complexity and overall cybersecurity risk by creating a significantly expanding attack surface for hackers to exploit. These areas include:
| • | Modernization of IT infrastructure and adoption of cloud computing. The cost and agility benefits of cloud computing make it a desirable platform for organizations of all sizes. According to Cisco, the number of discrete cloud workloads is expected to increase from 262 million to 534 million between 2017 and 2021, representing a 19% compound annual growth rate. However, as organizations modernize their legacy IT infrastructure and adopt cloud or hybrid cloud architectures that are no longer housed in the confines of their corporate networks, organizations have less visibility and control over the security of these assets. Cloud workloads are dynamic in nature, making it increasingly |
| difficult for organizations to accurately account for their assets, as well as to understand and monitor their overall cyber exposure at any given time. Furthermore, organizations want the flexibility to move workloads among multiple public and hybrid cloud environments, limiting the effectiveness of security tools provided by individual public cloud providers. |
| • | The growth of applications. The number of applications and frequency of releases have grown substantially in recent years. Furthermore, these applications are often developed outside of traditional development processes, sometimes bypassing traditional security controls. These applications store and transmit sensitive company and customer data, making them critical IT assets to protect. As more applications are released, the potential attack surface expands and requires additional protection. In addition, the need for users to access applications from anywhere means more IT assets that are connected to the Internet, further increasing organizations’ vulnerability to cyberattacks. |
| • | The rise of DevOps. The increased need for application development velocity has resulted in the rise of DevOps, or software development practices and tools that increase an organization’s ability to rapidly deliver applications and services. In a DevOps model, which allows new application features to be deployed on an hourly to daily basis, building security into the application development process is extremely difficult. Technologies like microservices, which structure an application as a collection of loosely coupled services, and application containers, which are lightweight, portable pieces of software used to package applications and services, have emerged to support DevOps processes. IDC, a market research firm, estimates that the installed base of container instances will grow from 0.5 billion in 2017 to 3.0 billion in 2021, representing a 58% compound annual growth rate. These critical and short-lived assets are deployed rapidly, creating the need for new approaches that eliminate blind spots for security teams. |
| • | The proliferation of IoT devices in the enterprise. Organizations are seeing a significant rise in the Internet of Things, or IoT, a set of physical devices embedded with software and sensors that enable these assets to connect to the Internet and exchange data. According to Gartner, there will be an estimated 9.1 billion IoT devices deployed in the enterprise by 2021.(1) These connected devices range from HVAC systems to electric generators. While they serve as a way to collect and transmit operational data to enhance business operations, they also create new points of attack for hackers due to their connectivity with many business-critical systems. For example, video conferencing systems can be hacked to eavesdrop into confidential discussions, HVAC systems can be breached to gain access to customer data on central servers, and manufacturing equipment can be compromised to shut down the plant or business operations of a company. |
| (1) | Gartner, Forecast Analysis: Internet of Things — Services, Worldwide, 2017 Update, dated December 28 2017. |
83
Table of Contents
| • | IT / OT convergence. While IoT devices are relatively new technologies, OT, such as Industrial Control Systems used in industries like manufacturing, power generation and oil and gas processing, have existed for years. These critical systems were not originally designed with network connectivity and IT security in mind and instead were intended to be isolated from cybersecurity threats and the broader network. However, as organizations are being driven to connect all aspects of their infrastructure, OT assets are increasingly being connected to IT networks, even though the tools and approaches used for IT security were not designed to protect OT assets. Due to the nature of these assets, a cyberattack on an OT asset is not just a matter of business disruption; it can also be a public safety concern, making their security a critical issue for organizations. |
Cybersecurity Risk is Business Risk, Yet Organizations Lack the Insight to Guide Decisions
Cybersecurity risk is no longer a tactical technology issue for IT professionals alone, but rather a strategic business issue. The rapid expansion of attack surfaces caused by digital transformation has increased cybersecurity risk for organizations of all sizes. This is evidenced by the wave of high profile breaches over the past few years, which are not only increasing in severity, but also resulting from cybersecurity breaches across a range of digital assets, from web applications to cloud workloads to IoT and OT assets. Recent breaches have resulted in CEOs testifying in front of Congressional committees about their cybersecurity operations and risk management practices. Executives and boards of directors are struggling to effectively understand and manage their organizations’ cybersecurity risk in response to mandates from insurers, regulators, shareholders and consumers. For example, the Securities and Exchange Commission recently released new interpretive guidance on cybersecurity risk disclosure and initiated enforcement actions, further focusing attention on this problem.
CISOs are increasingly being asked to present to executives and boards of directors on the state of their organization’s security readiness. Boards seek to understand how secure their organization is, where the greatest risks are, how much they should be investing to reduce risk and how their organization compares to their industry peers and best-in-class organizations. However, CISOs who are relying on existing tools can often only produce vulnerability data that may list thousands to millions of potential security problems with no business insight or prioritization based on risk and business criticality. As boards focus their attention on understanding and benchmarking their cyber exposure, CISOs need solutions that translate this vulnerability data into actionable business insights that help to answer strategic questions as to how secure an organization is, thereby allowing boards to proactively understand and exercise the appropriate oversight of cybersecurity risk.
Existing Solutions Fall Short of Addressing Cyber Exposure
Many organizations have implemented vulnerability assessment and management tools that scan networks for vulnerabilities on traditional IT systems on scheduled intervals and present raw lists of technical issues.
These traditional solutions fall short on two key dimensions:
| • | Lack of visibility across the breadth of the modern attack surface. Many solutions were designed before the rise of cloud, containers, BYOD devices and IoT, and focus instead on traditional IT systems such as networking infrastructure, desktops and on-premises servers. With the increase in software release frequency, along with the dynamic nature of cloud workloads and containers, assets must be assessed in a more continuous manner. Many traditional solutions are unable to keep pace with assessing dynamic assets and cloud environments, which is hindering cloud adoption. In addition, many IoT devices and OT systems cannot be assessed with traditional methods, such as active scanning and agent-based scanning, because they do not respond to general inbound communications, do not communicate via the IP protocol or do not allow the installation of agents. Additionally, many OT systems can be knocked offline by active scanning, thus precluding its use with critical infrastructure. |
| • | Inability to translate vulnerability data into business insights. The proliferation of digital technologies and compute platforms, coupled with the rise in the number of vulnerabilities, leave even the most |
84
Table of Contents
| sophisticated and heavily-resourced security teams lacking the context to prioritize remediation efforts. Simply relying on a raw list of issues is no longer sufficient for either IT prioritization or translation of vulnerabilities into business insights. Traditional tools lack both the prioritization and deep analytics that security teams, the CISO, executives and boards of directors can use to assess the business impact of cybersecurity risk, benchmark their cybersecurity against industry peers and make more informed business decisions. |
We believe these shortfalls of traditional solutions will continue to drive increased demand for Cyber Exposure solutions as organizations seek a unified platform to secure a broad range of IT assets and cloud environments, as well as the ability to translate vulnerability data into business insights.
In addition to traditional vulnerability management tools, organizations typically have dozens to hundreds of security tools deployed that address different parts of security but do not address the Cyber Exposure problem specifically. These include:
| • | Protection technologies, such as firewall, anti-virus and intrusion prevention technologies designed to build a fence around an enterprise and protect organizations from an outside attack; and |
| • | Detection and response technologies, such as endpoint security, network access control and security information and event management, or SIEM, tools designed to rapidly detect, contain and remediate an issue once it has been identified. |
These point solutions are designed to collect, understand and react to threat activity and take action based on it. Such technologies were not designed to answer fundamental strategic questions about the organization’s state of security.
We believe that market adoption of Cyber Exposure will reduce the relevance of traditional vulnerability management tools as well as some point security software solutions in adjacent markets that were not designed to address Cyber Exposure. We believe continued market adoption will shift investment from traditional solutions to Cyber Exposure solutions, and that we will be able to increase our share of these existing markets over time.
Our Solution
Our vision is to empower every organization to understand and reduce their cybersecurity risk. We are the first and only platform designed to provide broad visibility and deep insights into cyber exposure across the entire modern attack surface, as a result of which we believe our platform can become the system of record for cybersecurity.
Our enterprise platform is built to serve as the Cyber Exposure Command Center, enabling organizations to answer foundational and strategic questions such as:
| • | Where are we exposed? |
| • | Where should we prioritize based on risk? |
| • | Are we reducing our exposure over time? |
| • | How do we compare to our peers? |
Our enterprise platform offerings include Tenable.io and SecurityCenter. With our platform, our customers are able to gain visibility into their cyber exposure, prioritize remediation efforts based on risk and business criticality and benchmark cybersecurity risk in order to guide strategic decision making. The core capabilities of our platform include live discovery, automated exposure assessment, deep analytics for prioritization, an open and extensible platform and cyber exposure measurement.
85
Table of Contents
Cyber Exposure is becoming a strategic component of every organization’s security technology stack to help understand and reduce cybersecurity risk. Our Cyber Exposure platform delivers the following key business benefits for our customers:
| • | Visibility across a breadth of assets. We provide customers with broad visibility into the full range of attack surfaces within a single platform. Our solutions cover traditional IT assets, such as networking infrastructure, desktops and on-premises servers, as well as modern IT assets, such as cloud workloads, containers, web applications, BYOD devices, IoT and OT assets that reside both inside and outside of a customer’s corporate network. Our solutions provide a range of continuous discovery and assessment techniques applied to the entire scope of a customer’s IT infrastructure, including active scanning, passive network monitoring, agent-based scanning, workload image scanning, web application scanning and public cloud workload assessment. |
| • | Depth of analytics to prioritize issues and measure cybersecurity risk. Once the asset discovery and assessment information is obtained, our platform is designed to give our customers a comprehensive and objective understanding of their cybersecurity posture and where they are exposed across an organization’s entire IT infrastructure. Our solutions integrate and analyze our natively collected data alongside third-party asset, vulnerability and threat data to rapidly prioritize security issues and where to focus an organization’s remediation resources based on risk and business criticality. For example, a business-critical system with a remote code execution vulnerability being actively exploited by attackers would be prioritized at a high risk level for remediation, such as applying a patch or isolating the asset. Our analytics use our deep knowledge base, built over 20 years of analyzing vulnerabilities, assets and networks, to provide customers with a quantitative assessment of their cyber exposure, so they know where to focus and how they are improving over time. |
All of these factors together help our customers more effectively and efficiently manage cybersecurity risk by focusing security teams and investment where it will have the most business impact. Security practitioners benefit from an easy-to-use and intuitive interface, while CISOs use our offerings to identify and understand their cybersecurity posture with insightful visuals and meaningful business metrics. We believe these benefits enable organizations to rapidly embrace new digital technologies for competitive advantage while also effectively managing their cyber exposure.
Competitive Strengths
We believe we have the following strengths that drive value to our customers and provide sustainable advantage for us:
| • | Deeply trusted brand among large global Nessus community. Nessus is a widely adopted vulnerability assessment solution, with approximately two million cumulative unique downloads over the past 20 years. With approximately 750,000 security professionals in the United States according to CyberSeek, part of the U.S. Commerce Department’s National Institute of Standards and Technology, we believe that the substantial majority of security professionals currently use or have used Nessus at some point in their career. We are aware that many cybersecurity professionals started their careers with Nessus, or used it even earlier in an academic setting. We recently performed an analysis of LinkedIn users’ self-identified proficiency with Tenable.io, Security Center and Nessus as compared to vulnerability management tools offered by three of our largest competitors. In this analysis of publicly available user profiles, we noted that users reported having proficiency with one or more of our products nearly as frequently as with all three of the other tools combined. We invest significant resources in fostering the Nessus community by providing users with product intelligence, educational content, best practices guidance and a forum for information sharing and professional networking. As a result, this community has developed a deep trust and affinity for Nessus over the past 20 years, which we believe is a competitive advantage difficult to replicate. |
| • | Our data asset drives significant network effects. Most vulnerabilities are already known. Through 2021, 99% of the vulnerabilities exploited will continue to be ones known by security and IT |
86
Table of Contents
| professionals for at least one year.(1) The combination of our extensive community of Nessus users, including our approximately 19,000 Nessus Professional customers and our Tenable Research team of cybersecurity and data science experts together create a continuous feedback loop of vulnerability data, insight and learnings. We use these to expand our assessment capabilities and coverage, continually optimize our solutions and inform our product strategy and innovation priorities. Because of the breadth and scale of our data asset, we are able to provide prioritization capabilities and plan to release products that provide additional benchmarking capabilities. As the size of our network increases, the value of the data and insight increases and further strengthens our competitive position. |
| • | Differentiated business model. We believe that our business model is a key differentiator in the cybersecurity market and creates a strong competitive moat by combining the adoption benefits of free software with the economic benefits of a proprietary software business model. Our Nessus user base serves as an efficient, low-cost customer acquisition channel, as the majority of these users have a familiarity with our products, and have built an affinity and trust for our brand and an understanding and respect for our technology. We believe many of the Nessus Home users can become paying customers over time by upgrading to our paid Nessus product, Nessus Professional. Among our approximately 19,000 Nessus Professional customers, we believe we have a significant opportunity to convert customers to our enterprise platform offerings. |
| • | Powerful assessment capabilities. Our platform provides broad vulnerability assessment capabilities that cover the full range of IT assets and cloud environments. We built the majority of these assessment capabilities natively into our platform from the ground up, which have been optimized and enhanced over the course of the past 20 years in close collaboration with the security community. In addition, we partner with other companies that possess deep expertise in specific markets and asset types, such as our collaboration with Siemens in the OT market. These partnerships provide us with deep insights into a wider range of assets, which we leverage to further enhance the breadth and depth of our assessment capabilities. We believe we are the only solution in the market with this breadth and depth of assessment capabilities to address the requirements of both traditional and modern IT assets. |
Our Opportunity
The traditional vulnerability management market, which includes policy and compliance, and device and application vulnerability assessment, is a large and growing market. According to IDC, these segments of the security and vulnerability management market represented $3.7 billion of IT spend in 2017 and is expected to grow to $5.8 billion in 2021, representing compound annual growth of 12%.
While we believe the traditional vulnerability market is already an attractive market, we also believe market estimates focus only on traditional attack surfaces. The Cyber Exposure market that we address includes both traditional and modern attack surfaces, such as cloud workloads, a broad range of web applications, containers, IoT and OT.
The Cyber Exposure market is undergoing significant growth. According to Cisco, cloud workloads are expected to increase from 393 million to 534 million between 2019 and 2021, representing a 16% compound annual growth rate. During the same time period, IDC reports that the installed base of container instances will grow from 1.4 billion to 3.0 billion, representing a 48% compound annual growth rate. Connected enterprise IoT devices, which include operational technology such as utilities IoT and manufacturing IoT, are expected to grow from 5.2 billion in 2019 to 9.1 billion in 2021, representing a 32% compound annual growth rate, as reported by Gartner.(2)
We estimate our total addressable market, or TAM, will reach approximately $16 billion in 2019. To calculate our TAM, we first derived the total number of traditional and modern IT assets worldwide based on estimates from industry research. These assets include personal computers, or PCs, servers, business
| (1) | Gartner, How to Respond to the 2018 Threat Landscape, dated 28 November 2017. |
87
Table of Contents
smartphones, IoT units, cloud workloads and containers. Gartner estimates that in 2019, IoT assets will total 5.2 billion units.(2) IDC estimates that the IT environment will include 49 million servers, 395 million PCs, 377 million smartphones and 1.4 billion container instances in 2019.(3) Cisco estimates that cloud workloads will reach 393 million in 2019. In total, these various IT assets amount to approximately 8 billion addressable assets in 2019. We then multiplied the total number of addressable assets in our market by our estimates of customer spend per asset.
Growth Strategy
Our objectives are to maintain our market leadership in Cyber Exposure and to capture our large market opportunity. To accomplish these objectives, we intend to:
| • | Continue to Acquire New Enterprise Platform Customers. We believe there is a substantial opportunity to increase adoption of our enterprise platform offerings. We have experienced strong growth in new platform customers due to investments in sales and marketing. We intend to continue to aggressively pursue new customers by adding sales capacity and leveraging our network of channel partners. While many new customers adopt our enterprise platform as their first engagement with us, we also acquire new platform customers by marketing to our approximately 19,000 Nessus Professional customers, particularly those among the Global 2000. In addition, we intend to continue to promote our Nessus offerings to grow our Nessus community, creating strong awareness among security professionals and providing an entry point for potential customers that can lead to additional product sales and broad adoption of our technology. |
| • | Expand Asset Coverage Within Our Customer Base. We believe we have a significant opportunity to expand our relationships with our existing customers by targeting additional teams, business units or geographies, pursuing broad enterprise deployments and generally expanding our coverage of their IT assets. There are two primary mechanisms for this expansion: |
| • | Traditional Assets. We believe that we are not yet highly penetrated in our existing customer base for traditional attack surfaces. Customers often cover increasing numbers of their existing IT assets by deploying our offerings over a period of time. Additionally, customers experiencing growth in traditional assets tend to increase the size of their deployment with us. |
| • | Modern Assets. As our customers increasingly migrate applications to the cloud and deploy web applications, containers, IoT and OT, they will need to assess their cyber exposure to these modern attack surfaces. We believe we can expand our sales of these types of assets to existing customers further by addressing these evolving needs. |
| • | Invest in Our Technology Platform and Expand Use Cases. We intend to continue to innovate and develop our enterprise platform, including the addition of incremental capabilities, such as coverage of new attack surfaces and the addition of analytical capabilities to deepen the insight we offer to our customers. We are also investing to expand the number of use cases that leverage our valuable data set. As we collect more data and ingest more data from third-party sources, we believe our data set will become even more valuable over time. In late 2018, we plan to release Tenable.io Lumin, an application that will provide enhanced risk-based prioritization of issues and benchmarking against industry peers and best-in-class performers. We intend to continue to develop new analytical products and capabilities to our existing product suite over time. |
| • | Accelerate International Expansion. In 2017 and the three months ended March 31, 2018, we derived 31% and 33%, respectively, of our revenue from customers outside the United States. We believe there |
| (2) | Gartner, Forecast Analysis: Internet of Things — Services, Worldwide, 2017 Update, dated 28 December 2017. |
| (3) | For a list of all IDC research opinions referenced herein, please see “Industry and Market Data.” |
88
Table of Contents
| is a substantial opportunity for us to increase our international customer base by leveraging and expanding investments in our technology, direct sales force and channel partnerships around the world. We have recently increased the number of countries in which we have a sales presence and are committed to continuing to expand our sales presence in the over 20 countries in which we currently operate and expect to enter new geographies by investing in our direct and indirect sales channels, professional services and customer support. |
Our Platform
We offer the first and only Cyber Exposure platform. Our enterprise platform offerings, including Tenable.io, SecurityCenter and Industrial Security, are built to provide organizations with the breadth of visibility to accurately understand both traditional and modern attack surfaces and the depth of insight that stems from risk-based analytics, prioritization and benchmarking. Our Cyber Exposure platform automatically discovers assets, including those in cloud environments, and assesses these assets for the presence of vulnerabilities, internal and regulatory compliance violations, misconfigurations and other cybersecurity issues, analyzes and prioritizes cybersecurity risks based on business risk and provides an objective way to measure an organization’s cyber exposure.
The following diagram is a visual representation of our platform:
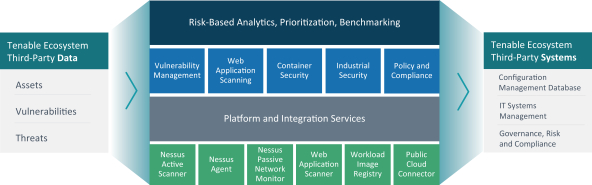
89
Table of Contents
The foundation of our enterprise platform is our collection of data sensors:
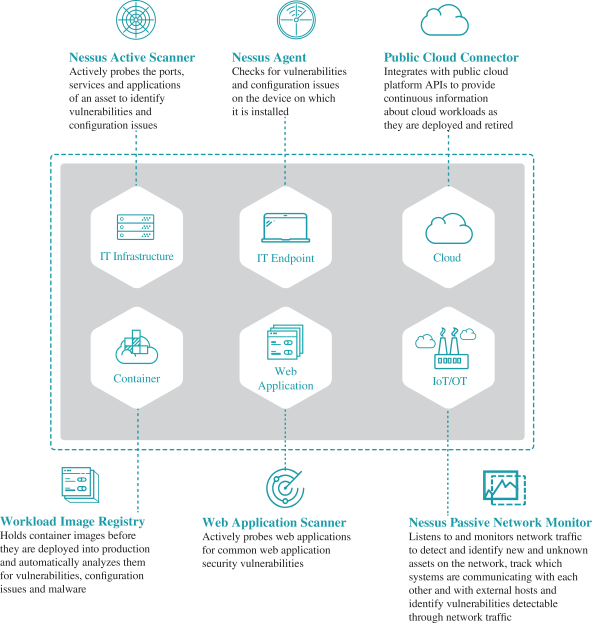
| • | The Nessus active scanner, which actively probes the ports, system applications and user applications of an asset to determine any vulnerabilities or configuration issues, using packets sent over a network to the asset. |
| • | The Nessus agent, which is a software application installed on certain types of endpoints, such as a PC, server or cloud workload, that provides similar assessment capabilities as the active scanner, but only checks for vulnerabilities and configuration issues on the device on which it is installed. |
| • | The Nessus passive network monitor, which listens to and monitors internal network traffic at the packet layer to detect new and unknown assets on the network, identify assets seen on the network, track which systems are communicating with each other and with external hosts and identify vulnerabilities detectable through network traffic. It observes network traffic passively, rather than |
90
Table of Contents
| actively sending packets to and probing specific assets. Passive network monitoring is the only way to accurately identify many IoT assets, which may not respond to general inbound communications or communicate via the IP protocol, preventing them from being assessed with traditional active scanners. Passive network monitoring is also the only safe, non-intrusive way to detect and assess many OT systems, such as Industrial Control Systems, which can be knocked offline by active scanning and which typically do not communicate via the IP protocol that active scanners use. |
| • | The web application scanner, which actively probes an organization’s web applications for the types of vulnerabilities commonly found in such applications, identifying vulnerabilities in an organization’s own custom-built applications as well as commercial web applications purchased from vendors. |
| • | The workload image registry, which is a storage repository that holds container images before they are deployed into production and which automatically analyzes these images for vulnerabilities, configuration issues and malware. This enables security issues in containers to be identified and remediated before vulnerable container instances are deployed. |
| • | The public cloud connector, which integrates with the application programming interfaces, or APIs, of public cloud platforms to provide continuous information about cloud workloads as they are deployed and retired, thus delivering live visibility into cloud environments and enabling new cloud workloads to be immediately assessed for vulnerabilities and configuration issues. |
Through our open API and software development kit, or SDK, we integrate a variety of third-party data into our platform to enable risk-based prioritization, including asset data to understand business criticality, threat intelligence to understand the severity of the vulnerability and additional vulnerability data. The data we collect and produce is also exported to third-party IT management and security systems, such as configuration management databases that are updated with cyber exposure data, ticketing and IT systems management tools that orchestrate and perform remediation and Governance, Risk and Compliance, or GRC, systems that can use cyber exposure data within the organization’s overall corporate risk and compliance framework.
Our platform includes applications purpose-built to address a variety of security use cases, including vulnerability management for traditional IT systems, container security, web application scanning, operational technology security and assessment against internal policy and regulatory compliance frameworks, such as the Payment Card Industry Data Security Standard, or PCI DSS. In late 2018, we plan to release Tenable.io Lumin, an application that will provide enhanced risk-based prioritization of issues and benchmarking against industry peers and best-in-class performers.
We believe the combination of applications, data sensors, third-party integration capabilities, automation, analytics, prioritization and benchmarking will allow our customers maximum visibility into their assets and vulnerabilities and deep insights to help make better business decisions based on cybersecurity risk.
Our Enterprise Platform Offerings
Our enterprise platform offerings include Tenable.io and SecurityCenter.
| • | Tenable.io: Built from the ground up to secure both traditional and modern, dynamic assets, spanning IT, cloud environments, IoT devices and OT systems, Tenable.io is primarily delivered as a SaaS offering. Select Tenable.io applications are also offered as on-premises software for customers that require it. Enterprises typically start with the vulnerability management application and expand their deployment over time to cover more traditional IT assets and/or more types of modern assets by deploying additional applications. |
Additionally, in late 2018, we plan to release Tenable.io Lumin, which will provide additional capabilities to help CISOs and executives analyze, prioritize and benchmark cyber exposure.
| • | SecurityCenter: Designed to manage vulnerabilities across traditional IT assets and provide automated assessment against security frameworks and compliance regulations, SecurityCenter includes a variety |
91
Table of Contents
| of pre-built, highly customizable dashboards and reports, including the industry’s only Assurance Report Cards, or ARCs, to enable organizations to track the effectiveness of their security and compliance programs. Some of our SecurityCenter customers choose to expand their deployments to include Tenable.io as their needs evolve. |
| • | Industrial Security: Launched in 2017 in partnership with Siemens, Industrial Security, an OT-specific offering, is an asset discovery and vulnerability assessment solution, built on our patented passive network monitoring technology. Industrial Security monitors critical infrastructure in energy, utilities and other sectors, utilizing a non-intrusive approach to give security and plant operations teams the ability to discover, visualize and monitor their most sensitive systems. We currently offer Industrial Security as a stand-alone solution, and we intend to integrate it within the Tenable.io offering. |
Our enterprise platform offerings deliver the following capabilities:
| • | Live asset discovery. We provide visibility across a broad range of traditional and modern IT assets and cloud environments. We use a combination of active scanning, passive network monitoring and public cloud monitoring via our connector to identify known and unknown assets. |
| • | Automated exposure assessment. With every change in a customer’s computing environment, we can automatically assess and identify where there are vulnerabilities, internal and regulatory compliance violations and misconfigurations across assets and cloud environments, such as missing software patches or outdated software versions. In addition, we can help optimize existing security technology investments to identify indicators of cyber exposure, such as improperly configured anti-virus software. |
| • | Deep analytics to allow for prioritization. We combine our product IP and third-party data to provide business context and allow organizations to prioritize remediation efforts based on the business criticality of the asset and the severity of the issue. |
| • | Open and extensible platform. Our platform ingests a wide set of third-party data sources to enhance analysis and integrates that data with industry-leading IT workflow, SIEM and systems management tools to accelerate remediation and provide common visibility across security and IT operations teams. |
| • | Cyber exposure measurement. Our data set helps our customers quantify and benchmark cyber exposure across their organizations, and we plan to offer benchmarking compared to industry peers. Our expansive knowledge base and data set is mined to create industry standard Cyber Exposure metrics, such as average remediation time, so that organizations can benchmark against industry best practices. We believe this objective measurement will help enterprises make data-driven investment decisions to maximize cybersecurity risk reduction. |
Our enterprise platform offerings have received numerous certifications for cloud security assurance and verification of controls related to security, availability, confidentiality, privacy and processing integrity of data. Examples of certifications include the Cloud Security Alliance: Security, Trust and Assurance Registry and the E.U.-U.S. Privacy Shield. In addition, we received positive results on an external penetration test performed and validated by an independent provider of cybersecurity services.
Our Nessus Offerings
Nessus Professional
Nessus Professional is a vulnerability assessment solution for identifying security vulnerabilities, configuration issues and malware. Nessus Professional serves as both a stand-alone product designed for security consultants and practitioners performing one-time or ad-hoc assessment as well as an on-ramp product to our enterprise platform. With broad vulnerability coverage, accurate analysis and an easy-to-use interface, Nessus Professional offers a cost-effective and comprehensive solution for security consultants and users with ad-hoc assessment needs.
92
Table of Contents
Nessus Home
We also offer a free version of our Nessus product, Nessus Home, which includes vulnerability and configuration assessment for a limited number of assets, but does not include access to support and certain features that Nessus Professional customers enjoy.
Technology Architecture
Our platform is built from the ground up to support the needs of modern IT assets and cloud environments. Our platform’s scalability can meet the requirements of the largest global enterprise customers, which may require assessment for millions of assets. In addition, we offer a published service level agreement promising 99.95% availability, to help ensure the reliability of operation for our customers.
Foundational elements of our technology architecture include:
| • | Microservices-based architecture. Our architecture consists of microservices running in containers provided by Docker Inc. and orchestrated by the open-source system Kubernetes. Containers allow us to utilize a DevOps philosophy in our software development lifecycle, which permits us to perform numerous code updates per day. The result is faster and more predictable time to market for new capabilities and services. |
| • | Public cloud infrastructure for agility. Our use of the public cloud delivers agility and market responsiveness without the capital investment or time delay involved with planning, purchasing and deploying hardware. It also provides a flexible cost profile in which capacity can be quickly adjusted up or down in response to new opportunities and market demand, with relatively modest fixed costs. |
| • | Scalability. Our platform scales up and down to continuously meet customer demands, through the use of public cloud infrastructure around the world. This approach provides elastic resources for compute, data transfer and storage, and allows us to meet the needs of even the largest global enterprises and government agencies. Our platform manages and supports millions of assets for multiple enterprise customers across a variety of industries, with the ability to process millions of API calls daily. The platform can scale to support IoT deployments that are an order of magnitude larger than IT deployments. |
| • | Availability. Our modern architecture, leveraging state-of-the-art public cloud services, offers high availability and high performance. It provides geographic redundancy, as well as automated backup, without the need for us to build redundant infrastructure. As a result, we offer a service level agreement for Tenable.io that promises 99.95% availability. |
| • | Portability. Tenable.io primarily resides in a public cloud environment and offers the flexibility to be deployed as traditional software in on-premises environments, partner environments and hybrid deployments. |
| • | Extensibility and integration. Our open API and SDK enable import of data from third-party sources and sensors—including competitor products—to augment our native discovery, assessment and analytics. This is essential to providing a unified view of assets, vulnerabilities and exposure across the enterprise. These capabilities also enable flexible export of our data to third party systems. |
| • | Widely adopted industry standard file format. The “.Nessus” file format for vulnerability data used in all of our products is openly documented and supported by dozens of products and programming languages, which simplifies integration with our ecosystem partners’ technologies. |
Our Technology Ecosystem
We have partnered and/or integrated with leading technology companies to pioneer the industry’s first Cyber Exposure ecosystem to help organizations build resilient cybersecurity programs. Our ecosystem consists
93
Table of Contents
of a variety of third-party data import sources into our platform offerings, as well as export of our data out to third-party IT systems. Our technology ecosystem connects disparate solutions and data to automate processes and accelerate an organization’s ability to understand, manage and reduce its cyber exposure.
We integrate a variety of third-party data sources into our platform to augment our native data collection and help with analysis and prioritization. Examples include:
| • | Threat intelligence feeds, including ExploitDB and ReversingLabs, which help our customers understand if a vulnerability is actively being exploited; |
| • | Configuration Management Database asset data, including IT asset data from ServiceNow, which provide business context for the asset, such as the asset’s business purpose; |
| • | Public cloud provider data, including Amazon Web Services, which provide visibility into cloud environments to trigger assessments as cloud workloads are created or updated; |
| • | Credential management tools, including CyberArk and Thycotic, which grant our platform privileged access to perform assessments at the system level rather than the network level to enhance the accuracy of our assessment; and |
| • | Mobile device management tools, such as Apple Profile Manager and Microsoft Exchange, to gain visibility into mobile assets and the applications and vulnerabilities on them. |
Furthermore, our data is also exported out to enrich third-party IT management and security systems. Examples include:
| • | IT Service Management and ticketing systems, including ServiceNow and BMC SecOps Response Service, which automatically populate the ticket with data from our platform to provide additional guidance to the IT operations team performing remediation; |
| • | SIEM solutions, including Splunk, Micro Focus (HPE) ArcSight and IBM QRadar, which correlate vulnerability data with threat activity to provide guidance to the security operations center team performing incident response; |
| • | Network access control tools, such as ForeScout and Cisco, which leverage our data to understand if an asset is exposed and, if so, allow those third parties’ technology to take action to block it from joining the network; and |
| • | GRC systems, including RSA Archer, which factor in Cyber Exposure metrics as part of the organization’s overall risk and compliance framework. |
Customers
As of December 31, 2016 and 2017, we had over 21,000 and 24,000 customers, respectively, who licensed our Tenable.io, SecurityCenter or Nessus Professional products. Our customers include 53% of the Fortune 500, including 30 enterprise platform customers, and 29% of the Global 2000, including 58 enterprise platform customers, in each case as of December 31, 2017. In 2016, 2017 and the three months ended March 31, 2018, no single customer represented more than 2% of our revenue.
94
Table of Contents
Our customers span a wide range of industries, including manufacturing, energy and industrials; technology, media and telecommunications; banking, insurance and finance; government, education and non-profit; healthcare; and retail and consumer. A representative list of our customers with annual bookings of more than $30,000 is set forth below by industry vertical:
| Financial Services |
Retail and Wholesale |
Technology and Telecom | ||
| Banco Santander (Puerto Rico) Deutsche Bank Securities First Data Nasdaq Navient Pentagon Federal Credit Union U.S. Bank |
American Eagle Outfitters Darden Restaurants FedEx Kohl’s O’Reilly Auto Parts Starbucks Sysco Wayfair |
Amazon.com DocuSign Global Payments PayPal SonicWall VMware Vodafone (UK) World Wide Technology | ||
| Healthcare |
Government |
Energy | ||
| AmeriHealth Caritas Assistance Publique – Hopitaux de Paris BJC HealthCare Bon Secours Health System Community Health Systems Mercy Health Sentara Healthcare |
Inland Revenue Department of New Zealand NASA Tri-County Metropolitan Transportation District of Oregon (TriMet) U.S. Department of Agriculture U.S. Department of Defense U.S. Department of Energy U.S. Department of Veterans Affairs U.S. Social Security Administration |
CPS Energy Enbridge Entergy Exelon Pacific Gas & Electric Tennessee Valley Authority TransGrid | ||
Customer Case Studies
Nasdaq
Nasdaq is a leading global provider of trading, clearing, exchange technology, listing, information and public company services. As the creator of the world’s first electronic stock market, its technology powers more than 90 marketplaces in 50 countries, and one in ten of the world’s securities transactions.
As Nasdaq continued to expand and diversify its business over the last 15 years, it sought to maintain high standards of cybersecurity to protect its critical infrastructure and data. No matter the location or type of asset, Nasdaq wanted to see and understand its complete Cyber Exposure at any time.
Solution and Benefits:
Nasdaq first purchased our enterprise platform more than a decade ago, and has since expanded its deployment of Tenable to help secure systems in over 10 countries – including servers, networking devices, laptops, desktops and public cloud workloads. The company also uses our passive network monitor to detect and identify new and unknown assets on its networks, reducing blind spots.
Tenable today serves as one of Nasdaq’s primary resources for vulnerability and exposure information globally. It is an important part of the organization’s cybersecurity program – measuring cybersecurity risk, supporting regulatory compliance frameworks and integrating with other solutions such as a data repository which serves to inventory IT assets and map the relationships between assets, ticketing/workflow and SIEM. Nasdaq utilizes Tenable’s comprehensive data collection and flexible reporting to see what is in its environment and understand how to prioritize issues for remediation. Tenable also serves as a key provider of insight into real-time cybersecurity threats, such as WannaCry or the Apache Struts vulnerability, enabling rapid and accurate response.
95
Table of Contents
Key benefits include:
| • | Improved prioritization of security issues and reduction of cybersecurity risk through timely and accurate Cyber Exposure visibility. |
| • | Consistent and comprehensive global view of assets, vulnerabilities and Cyber Exposure across on-premises and cloud environments. |
| • | Identification of new and rogue assets on corporate networks, enabling security assessment and remediation. |
Fortune 100 Retailer
Our customer is one of the largest retailers in the United States, with a significant physical store presence and rapidly growing e-commerce operations, and generates more than $25 billion in revenue annually.
This retailer wanted to replace its previous vulnerability management product with a solution that would support its demanding requirements, including significant scalability, high performance, comprehensive vulnerability coverage and broad asset coverage including OT.
Solution and Benefits:
The customer purchased our cloud-based enterprise platform in 2017. It selected Tenable due in part to the platform’s scalability, ease of use and deployment, open API and ability to assess traditional assets, web applications, containers and OT systems with a unified solution. This company now relies on Tenable’s cloud-based platform to help protect more than 500,000 assets in corporate facilities and retail stores, with plans to expand the deployment to well over one million assets. It has also integrated the solution with third-party technologies via pre-built integrations and the platform’s open API, enabling faster vulnerability remediation and improved insight across departments.
Key benefits include:
| • | Improved understanding of Cyber Exposure by assessing assets for vulnerabilities and misconfigurations more accurately, comprehensively and frequently. |
| • | Increased visibility into cybersecurity risk through a single, cloud-based platform that can span traditional assets, web applications, containers, OT systems and more. |
| • | Improved cybersecurity decision making through the use of Tenable’s open API to integrate Tenable data with other technologies and processes. |
First Data
First Data is the largest merchant acquirer, issuer processor, and independent network services provider in the world. In 2017, First Data’s payment processing in the United States alone represented over 10% of the country’s GDP.
As the complexity of First Data’s IT environment grew over time, the company’s existing vulnerability management tool began to lag in coverage of assets and vulnerabilities. The tool also produced an excessive number of false-positive results and created a high total cost of ownership due to a la carte pricing, the need for many servers to run the tool and a poor user experience that led to inefficient operation. To continue to safeguard its global networks and operate more efficiently, First Data sought a more modern solution.
Solution and Benefits:
Since first purchasing our enterprise platform in 2015, First Data has deployed Tenable globally to help secure more than 60,000 assets in more than 20 countries, gaining reliable and timely insight into security issues.
96
Table of Contents
The company’s use of Tenable includes our passive network monitor, which allows First Data to meet the continuous monitoring requirements of an operation it runs for a U.S. federal customer with Federal Information Security Management Act high compliance requirements.
With Tenable, the company has improved its visibility into global cyber exposure by increasing its vulnerability coverage, performing more assessments and leveraging tailored reporting. First Data’s security team is able to operate more efficiently and effectively with this single solution that combines vulnerability management and security configuration assessment. Powerful analysis and reporting now allow the company’s CISO to better understand cyber risk and optimize resource allocations across security to reduce risk.
Key benefits include:
| • | Improved cyber risk management through enhanced vulnerability detection and prioritization. |
| • | Increased exposure visibility compared to their prior vulnerability management solution, through the combination of passive network monitoring and active scanning that assesses systems in 50% less time. |
Tri-County Metropolitan Transportation District of Oregon (TriMet)
TriMet is the public mass transit agency serving the Portland metro area. Operating bus, light rail, and commuter rail lines, the agency has a daily ridership of over 300,000.
As the volume and variety of cyber threats facing TriMet grew over time, the organization was looking to advance from periodic vulnerability assessments to continuously managing its cyber exposure across all assets and platforms. Using the Center for Internet Security Controls as a guide, TriMet sought to gain better visibility into the assets, vulnerabilities and cyber exposure across its IT and OT networks.
Solution and Benefits:
TriMet moved from Nessus Professional to our cloud-based enterprise platform, Tenable.io, in December 2017. By assisting TriMet’s developers in the identification of web application vulnerabilities during development, the Tenable solution helps them produce more secure code and avoid vulnerabilities in production. TriMet also uses Tenable to embed vulnerability and configuration assessment of container images in its DevOps software build pipeline, securely enabling rapid development and delivery of software. The organization plans to additionally deploy Tenable’s passive network monitoring to help protect OT systems on trains and buses in the future.
Tenable enables TriMet to secure its modern attack surface and better understand cybersecurity risk as it continues its digital transformation. Using Tenable, the agency has increased its exposure visibility, while enhancing vulnerability prioritization for more effective remediation. Tenable’s dashboards also enable meaningful business discussions with senior leadership by providing essential information about the organization’s cyber exposure.
Key benefits include:
| • | Deep understanding of cybersecurity risk and trends through the ability to quantify the risk associated with IT and OT assets. |
| • | Improved compliance with organizational policies for system configuration and hardening. |
Sales and Marketing
Sales
We sell and market our enterprise platform offerings through our field and inside sales force that works closely with our channel partners, including a network of distributors and resellers, in developing sales
97
Table of Contents
opportunities. Our sales strategy employs both a direct-touch approach through our sales forces and a low-touch approach through sales closed by our channel partners and transacted our on e-commerce website. Both direct-touch and channel-originated sales are fulfilled through our channel partnerships. Our sales and customer success renewal teams collaborate closely with our channel partners to prospect, manage and support our customers, developing and maintaining close relationships with all of our platform customers.
We sell to organizations of all sizes across a broad range of industries, with a specific focus on enterprise accounts. Our sales team is divided by customer size and geography, including Americas; Europe, the Middle East and Africa, or EMEA; and Asia Pacific and Japan, or APAC.
Our partner ecosystem provides us with a number of advantages, including increased in-bound registered sales leads, broader geographic reach and greater deal velocity. Our channel partners include distributors, value-added resellers, system integrators and managed security service providers. Representative partners include:
| • | Americas: CDW Logistics, Inc., Ingram Micro, Inc., Optiv Security Inc. and SHI International Corp. |
| • | Public Sector: Blue Tech Inc., Iron Bow Technologies LLC and SHI International Corp. |
| • | EMEA: Capgemini SE, Satisnet Ltd, Softcat plc and Thales Group |
| • | APAC: Content Security Pty Ltd and Dimension Data |
Marketing
Our marketing efforts focus on cultivating brand awareness and leveraging our brand strength with Nessus, building demand across all segments with a specific emphasis on our enterprise customers and delivering tailored marketing programs focused on CISOs and security executives, functional managers and security practitioners and consultants with Nessus. We also provide educational programs to DevOps teams for our Container Security and Web Application Scanning products. We execute marketing programs targeted at new customer acquisition, customer retention and cross-selling and up-selling of products across our platform.
Given the scale of our Nessus community and high-velocity customer acquisition channel, we see our community not only as a valuable source of customer testimonials and social proof, but also a seeding strategy for on-ramp and up-sell to our enterprise platform offerings.
Telling our customers’ stories is one of the most impactful and valuable parts of our marketing strategy. We have a dedicated team that works with our customers to capture testimonials and stories, allowing us to highlight solutions our products provide to customer problems across a range of use cases.
We hosted our inaugural user conference, Tenable Edge, in March 2018, drawing over 500 registrations. The conference included Tenable University hands-on training, a new product launch keynote announcing Tenable.io Lumin and the expansion of our Tenable Research team, as well as sessions led by Tenable product experts and customer speakers.
Research and Development
Our engineering expertise combines extensive security product development experience with individuals who possess deep cloud and user interface design background. Our engineering team has groups that focus on Nessus configuration auditing, Nessus vulnerability enumeration, passive network traffic analysis and system log analysis, including public cloud.
Additionally, our Tenable Research team includes a team of cybersecurity and data science experts who produce original research and apply data science techniques to our security telemetry data to provide meaningful insights. This data fuels the benchmarking offering in our platform and we believe will become a trusted source throughout the industry for understanding Cyber Exposure. Tenable Research, including data science, is a key component of our thought leadership.
98
Table of Contents
We believe ongoing and timely development of new products and features is imperative to maintaining our competitive position. We continue to invest in development of our solutions across our global innovation centers in Columbia, MD, Los Angeles, CA, San Jose, CA and Dublin, Ireland.
Our research and development expense was $40.1 million, $57.7 million and $17.2 million in 2016 and 2017 and the three months ended March 31, 2018, respectively.
Backlog
We define backlog as contractually committed orders to be invoiced under our existing agreements that are not included in the deferred revenue on our consolidated balance sheets. As of December 31, 2016 and 2017, we had backlog of $0.4 million and $3.1 million, respectively. We expect substantially all of the backlog at December 31, 2017 to be invoiced within the following twelve months.
Competition
The market for cybersecurity solutions is fragmented, intensely competitive and constantly evolving. We compete with a range of established and emerging cybersecurity software and services vendors, as well as homegrown solutions. With the introduction of new technologies and market entrants, we expect the competitive environment to remain intense going forward. Our competitors include: vulnerability management and assessment vendors, including Qualys and Rapid7; diversified security software and services vendors, including IBM; endpoint security vendors with nascent vulnerability assessment capabilities, including Tanium and CrowdStrike; and providers of point solutions that compete with some of the features present in our solutions. We also compete against internally-developed efforts that often use open source solutions.
We believe that the principal competitive factors affecting the market for cybersecurity solutions include product functionality, breadth and depth of offerings, flexibility of delivery models, ease of deployment and use, integration capabilities such as open APIs and scalability, uptime and performance. We believe that our suite of solutions generally competes favorably with respect to these factors and may serve as a complement to the solutions offered by our competitors in some cases. Some of our more established actual and potential competitors have greater name recognition, longer operating histories, more established customer relationships, larger marketing budgets and significantly greater resources than we do. In addition, as our market grows and rapidly changes, we expect it will continue to attract new competitors, including larger established companies and smaller emerging companies, which could introduce new products and services.
Intellectual Property
Our success depends in part upon our ability to protect our core technology and intellectual property. We rely on a combination of trade secrets, copyrights, patents and trademarks, as well as contractual protections, to establish and protect our intellectual property rights and protect our proprietary technology.
As of March 31, 2018, we had 14 issued patents and three patent applications pending in the United States. Our issued patents expire between 2027 and 2034 and cover our passive network scanning, monitoring and analysis technologies and additional features of our enterprise platform. As of March 31, 2018, we had 16 registered trademarks and three trademark applications pending in the United States. We view our copyrights, trade secrets and know-how as a significant component of our intellectual property assets.
We also license certain software from third parties for integration into our solutions, including open source software and other software available on commercially reasonable terms. We cannot assure you that such third parties will maintain such software or continue to make it available.
We control access to and use of our proprietary software and other confidential information through the use of internal and external controls, including contractual protections with employees, contractors, customers and partners, and our software is protected by U.S. and international copyright and trade secret laws. Despite our
99
Table of Contents
efforts to protect our trade secrets and proprietary rights through intellectual property rights, licenses and confidentiality and invention assignment agreements, unauthorized parties may still attempt to copy, reverse engineer misappropriate or otherwise obtain and use our software and technology. In addition, we intend to expand our international operations, and effective patent, copyright, trademark and trade secret protection may not be available or may be limited in foreign countries.
Government Regulation
Various federal, state and foreign legislative and regulatory bodies have legislation pending that could affect our business. In particular, the European Union has passed the General Data Protection Regulation, or GDPR, which came into force on May 25, 2018. The GDPR includes more stringent operational requirements on entities that receive or process personal data (as compared to existing EU law), along with significant penalties for non-compliance, more robust obligations on data processors and data controllers, greater rights for data subjects (potentially requiring significant changes to both our technology and operations), and heavier documentation requirements for data protection compliance programs. Similarly, there are a number of federal and state level legislative proposals in the United States that could impose new obligations on us. In addition, some countries are considering or have passed legislation implementing more onerous data protection requirements or requiring local storage and processing of data or other requirements that could increase the cost and complexity of delivering our services.
Like other U.S.-based IT security products, our products are subject to U.S. export control laws and regulations, specifically the Export Administration Regulations, or EAR, U.S. economic and trade sanctions regulations and applicable foreign government import, export and use requirements. Certain of our products are subject to encryption controls under the EAR due to the nature of the product and its use or incorporation of encryption functionality. Under the encryption controls in the EAR, applicable products may only be exported outside of the United States with required export authorizations, such as a license, a license exception or other appropriate government authorizations. In addition to the restrictions under the EAR, U.S. export control laws and economic sanctions prohibit the export of products and services to countries, governments, entities or persons subject to U.S. embargoes or trade sanctions.
Employees and Culture
As of March 31, 2018, we had 1,054 employees.
We believe in upholding a core set of values for our entire global workforce:
| • | One Tenable: We are united as one Tenable team. We win together. We are one team internally, with our customers, with our partners and in the market. |
| • | We Care: About our work, about our customers, about one another and about our communities. We speak straight and we do the right thing. |
| • | Deliver Results: We set high goals, take bold risks, measure honestly and deliver results that exceed expectations. |
| • | What We Do Matters: The work that we do makes a difference in the world. |
Facilities
Our principal executive offices are located in Columbia, Maryland and consist of approximately 66,000 square feet under a lease that expires in December 2020. We have signed a lease for our planned new principal executive offices to be located in Columbia, Maryland, which will consist of approximately 150,000 square feet under a lease that expires in August 2031. We maintain additional offices in multiple locations in the United States and internationally in Europe, Asia and the Middle East. We believe that our current facilities are adequate to meet our ongoing needs and that suitable additional alternative spaces will be available in the future on commercially reasonable terms.
100
Table of Contents
Legal Proceedings
From time to time, we may be subject to legal proceedings and claims in the ordinary course of business. We are not presently a party to any legal proceedings that, if determined adversely to us, would individually or taken together have a material adverse effect on our business, results of operations, financial condition or cash flows. We have received, and may in the future continue to receive, claims from third parties asserting, among other things, infringement of their intellectual property rights. Future litigation may be necessary to defend ourselves, our partners and our customers by determining the scope, enforceability and validity of third-party proprietary rights, or to establish our proprietary rights. The results of any current or future litigation cannot be predicted with certainty, and regardless of the outcome, litigation can have an adverse impact on us because of defense and settlement costs, diversion of management resources and other factors.
101
Table of Contents
Executive Officers, Other Key Officers and Directors
The following table sets forth certain information with respect to our executive officers, other key officers and directors, including their ages as of June 1, 2018:
| Name |
Age |
Position(s) | ||||
| Executive Officers |
||||||
| Amit Y. Yoran |
47 | President, Chief Executive Officer and Chairman | ||||
| Stephen A. Vintz |
49 | Chief Financial Officer | ||||
| John G. Negron |
54 | Chief Revenue Officer | ||||
| Stephen A. Riddick |
54 | General Counsel and Corporate Secretary | ||||
| Other Key Officers |
||||||
| David M. Cole |
44 | Chief Product Officer | ||||
| Renaud M. Deraison |
38 | Chief Technology Officer and Co-Founder | ||||
| John C. Huffard Jr. (Jack) |
50 | Chief Operating Officer, Co-Founder and Director | ||||
| Jennifer L. Johnson (JJ) |
43 | Chief Marketing Officer | ||||
| Bridgett P. Paradise |
54 | Chief People Officer | ||||
| Bradley T. Pollard |
45 | Chief Information Officer | ||||
| Non-Employee Directors |
||||||
| Arthur W. Coviello, Jr. |
65 | Director | ||||
| Kimberly L. Hammonds |
51 | Director | ||||
| Jerry M. Kennelly |
67 | Director | ||||
| Ping Li |
46 | Director | ||||
| A. Brooke Seawell |
70 | Director | ||||
| Richard M. Wells |
40 | Director | ||||
Executive Officers
Amit Y. Yoran has served as our President, Chief Executive Officer and Chairman since May 2018 and was previously our Chief Executive Officer and Chairman from December 2016 to May 2018. Prior to joining Tenable, Mr. Yoran served as president of RSA Solutions, Inc. from October 2014 to December 2016 and as senior vice president of product of RSA Security LLC, the security division of Dell EMC, from April 2011 to October 2014. Mr. Yoran received a B.S. from the United States Military Academy at West Point and an M.S. in computer science from George Washington University. Our board of directors believes that Mr. Yoran is qualified to serve as a director based on his role as our Chief Executive Officer and his extensive management experience in the technology industry.
Stephen A. Vintz has served as our Chief Financial Officer since October 2014. Prior to joining Tenable, Mr. Vintz served as executive vice president and chief financial officer of Vocus, Inc., a publicly-traded public relations software company, from January 2001 to June 2014. Mr. Vintz has served on the board of directors of the Kennedy Krieger Institute since December 2012. Mr. Vintz received a B.B.A. in accounting from Loyola University Maryland and is a certified public accountant.
John G. Negron has served as our Chief Revenue Officer since February 2017. Prior to joining Tenable, Mr. Negron was a technology and cybersecurity consultant at JGN Advisors, an IT consulting firm, from April 2016 to February 2017. From October 2013 to April 2016, Mr. Negron served as vice president of global security sales for Cisco Systems, Inc. From July 2002 to October 2013, Mr. Negron held a variety of roles at Sourcefire, Inc., a network security company that was later acquired by Cisco, including senior vice president of worldwide sales from April 2011 to October 2013. Mr. Negron received a B.S. in business communications from Bentley University.
102
Table of Contents
Stephen A. Riddick has served as our General Counsel and Corporate Secretary since May 2018 and was previously our General Counsel from May 2016 to May 2018. Prior to joining Tenable, Mr. Riddick served in a number of roles, including associate general counsel, at Praxair, Inc., a producer and distributor of industrial gases and related technologies, from September 2010 to February 2016. Mr. Riddick has served on the board of directors of the D.C. Jazz Festival since April 2017. Mr. Riddick received a B.A. in economics from the University of Virginia and a J.D. from the University of North Carolina School of Law.
Other Key Officers
David M. Cole has served as our Chief Product Officer since June 2016. Prior to joining Tenable, Mr. Cole served as chief product officer of CrowdStrike Inc., a cybersecurity company, from November 2013 to May 2016. From November 2004 to August 2013, Mr. Cole held a number of product management leadership positions at Symantec Corporation, including vice president of product management from May 2011 to February 2013. Mr. Cole received a B.B.A. in computer and information sciences and support services from the University of Michigan.
Renaud M. Deraison has served as our Chief Technology Officer since December 2016 and has served in a number of roles since co-founding our company in 2002, including as our chief product officer from July 2014 to July 2016 and our chief research officer from April 2002 to July 2014. Mr. Deraison is the primary author of Nessus.
John C. Huffard Jr. has served as our Chief Operating Officer since May 2018. He previously served as our President and Chief Operating Officer from November 2008 to May 2018, and he co-founded our company in 2002. Mr. Huffard has also served as a member of our board of directors since 2002. Mr. Huffard received a B.S.B.A. from Washington and Lee University and an M.B.A. from Babson College. Our board of directors believes that Mr. Huffard is qualified to serve as a director based on his role as our co-founder and our Chief Operating Officer and his in-depth knowledge of our company and our products.
Jennifer L. Johnson has served as our Chief Marketing Officer since February 2017. Prior to joining Tenable, Ms. Johnson was a category design advisor for Play Bigger Advisors, LLC, a management consulting firm, from October 2016 to January 2017, where she continues to serve as a non-paid advisor. From November 2014 to August 2016, Ms. Johnson served as chief marketing officer for Tanium, Inc., an information technology and services company. From January 2014 to November 2014, Ms. Johnson was a partner at Andreessen Horowitz LLC, a venture capital firm. From July 2009 to January 2014, Ms. Johnson served as chief marketing officer for Coverity, Inc., a software development company that was acquired by Synopsys Inc. Ms. Johnson received a B.S.B.A. in marketing from the University of San Francisco and an M.B.A. from Santa Clara University.
Bridgett P. Paradise has served as our Chief People Officer since March 2018. Prior to joining Tenable, Ms. Paradise served as the chief people officer for Citadel Securities, LLC, a global financial institution, from December 2016 to March 2018. From August 2014 to December 2016, Ms. Paradise served as chief people officer and executive vice president of human resources at Houghton Mifflin Harcourt Company. Prior to joining Houghton Mifflin, Ms. Paradise served in a number of human resource leadership positions at Microsoft Corporation from January 1993 to May 2014, including general manager of human resources, worldwide services. Ms. Paradise received a B.A. in business communications from Catawba College and an M.S. in human resource management from Marymount University.
Bradley T. Pollard has served as our Chief Information Officer since October 2017. He previously served as our vice president of IT, information security and business platforms from July 2015 to October 2017. Prior to joining Tenable, Mr. Pollard served in various roles at Cisco Systems, Inc., including as the director of information security from October 2013 to April 2015 and as the vice president of information technology and operations of Sourcefire, Inc., a network security company that was later acquired by Cisco, from July 2002 to
103
Table of Contents
October 2013. Mr. Pollard received a B.A. in psychology from the University of Delaware and an M.S. in technology management from the University of Maryland University College.
Non-Employee Directors
Arthur W. Coviello, Jr. has served as a member of our board of directors since February 2018. Mr. Coviello is a venture partner at Rally Ventures, LLC, a position he has held since May 2015. From February 2011 to February 2015, Mr. Coviello served as executive chairman of RSA Security LLC. Mr. Coviello has served on the boards of directors of Synchrony Financial since November 2015. He previously served on the public company boards of directors of Gigamon, Inc. from April 2017 until its acquisition in December 2017 and EnerNOC, Inc. from June 2009 until its acquisition in August 2017. Mr. Coviello received a B.B.A. in Business Administration from the University of Massachusetts. Our board of directors believes that Mr. Coviello is qualified to serve as a director based on his extensive industry and management experience and his experience as a director of technology companies.
Kimberly L. Hammonds has served as a member of our board of directors since June 2018. Ms. Hammonds founded the Mangrove Digital Group in May 2018. She previously served as group chief operating officer of Deutsche Bank AG, a global financial services company, from January 2016 to June 2018, and as a member of the management board of Deutsche Bank from August 2016 to June 2018. She joined Deutsche Bank as global chief information officer and global co-head of group technology and operations in November 2013, a position that she held until January 2016. She previously served as the chief information officer of The Boeing Company, a global aerospace company, from January 2011 to November 2013. Ms. Hammonds has served on the boards of directors of Red Hat Inc. since August 2015 and Cloudera, Inc. since March 2017. Ms. Hammonds received a B.S. in mechanical engineering from the University of Michigan and an M.B.A. from Western Michigan University. Our board of directors believes that Ms. Hammonds is qualified to serve as a director based on her extensive experience in working with information technology companies.
Jerry M. Kennelly has served as a member of our board of directors since May 2018. Mr. Kennelly is the chairman and chief executive officer of Scandic Capital, LLC, an investment firm, a position he has held since April 2018. Prior to joining Scandic, Mr. Kennelly co-founded Riverbed Technology, Inc., a network infrastructure company, in 2002, and served as its chairman and chief executive officer from May 2002 to April 2018. Mr. Kennelly served on the board of directors of Nimble Storage, Inc., a flash storage company, from April 2013 to April 2017 when Nimble Storage was acquired by Hewlett Packard Enterprise Company. Mr. Kennelly received a B.A. in political economy from Williams College and an M.S. in accounting from New York University. Our board of directors believes that Mr. Kennelly is qualified to serve as a director based on his extensive operating and management experience with technology companies.
Ping Li has served as a member of our board of directors since October 2012. Mr. Li is a partner at Accel, a venture capital firm, where he has worked since 2004. Mr. Li has served on the board of directors of Cloudera, Inc. since October 2008. Mr. Li received an A.B. in economics from Harvard University and an M.B.A. from Stanford University. Our board of directors believes that Mr. Li is qualified to serve as a director based on his extensive investment experience in the IT and security industries and his experience serving on the boards of directors of public companies.
A. Brooke Seawell has served as a member of our board of directors since October 2017. Mr. Seawell is a venture partner at New Enterprise Associates Inc., a position he has held since January 2005. Mr. Seawell has served on the boards of directors of Tableau Software, Inc. since November 2011 and NVIDIA Corporation since December 1997. He served on the boards of directors of Informatica Corporation, a data integration software company, from December 1997 to August 2015 and Glu Mobile Inc., a publisher of mobile games, from June 2006 to February 2014. Mr. Seawell received both a B.A. in economics and an M.B.A. in finance from Stanford University. Our board of directors believes that Mr. Seawell is qualified to serve as a director based on his extensive experience in technology finance and operations, including having served as the chief financial officer of two public companies and his experience as a director of technology companies.
104
Table of Contents
Richard M. Wells has served as a member of our board of directors since December 2015. Mr. Wells serves as a managing director at Insight Venture Management, LLC, a private equity and venture capital firm, a position he has held since 2005. He also currently serves on the boards of directors of a number of private companies. Mr. Wells received a B.S. in economics from the University of Pennsylvania and an M.B.A. from Harvard University. Our board of directors believes that Mr. Wells is qualified to serve as a director based on his extensive experience in investing and advising managers of high growth software and Internet companies.
Family Relationships
There are no family relationships among any of our executive officers or directors.
Board Composition
Our board of directors currently consists of eight members. All of our directors currently serve on the board of directors pursuant to the provisions of a voting agreement between us and certain of our stockholders. This agreement will terminate upon the closing of this offering, after which there will be no further contractual obligations regarding the election of our directors, except that pursuant to the terms of Mr. Yoran’s offer letter entered into in October 2016, he will serve on our board of directors as long as he is our Chief Executive Officer.
In accordance with the terms of our amended and restated certificate of incorporation and amended and restated bylaws, which will be effective following the closing of this offering, our board of directors will be divided into three classes, Class I, Class II and Class III, with members of each class serving staggered three-year terms. Effective upon the closing of this offering, our board of directors will be divided into the following classes:
| • | Class I, which will consist of Messrs. Li and Yoran, whose terms will expire at our first annual meeting of stockholders to be held after the closing of this offering; |
| • | Class II, which will consist of Messrs. Huffard, Seawell and Wells, whose terms will expire at our second annual meeting of stockholders to be held after the closing of this offering; and |
| • | Class III, which will consist of Ms. Hammonds and Messrs. Coviello and Kennelly, whose terms will expire at our third annual meeting of stockholders to be held after the closing of this offering. |
At each annual meeting of stockholders to be held after the initial classification, the successors to directors whose terms then expire will be elected to serve from the time of election and qualification until the third annual meeting following their election and until their successors are duly elected and qualified. The authorized size of our board of directors is currently eight members, and may be changed only by resolution by a majority of the board of directors and an amendment to our voting agreement with certain of our stockholders, which agreement will terminate upon the closing of this offering. See “Certain Relationships and Related Party Transactions—Investors’ Rights, Management Rights, Voting and Co-Sale Agreements.” We expect that additional directorships resulting from an increase in the number of directors will be distributed among the three classes so that, as nearly as possible, each class will consist of one-third of the directors. This classification of the board of directors may have the effect of delaying or preventing changes in our control or management. Our directors may be removed for cause by the affirmative vote of the holders of at least 66 2/3% of our voting stock.
Director Independence
Our board of directors has undertaken a review of the independence of the directors and considered whether any director has a material relationship with us that could compromise his ability to exercise independent judgment in carrying out his responsibilities. Based upon information requested from and provided by each director concerning such director’s background, employment and affiliations, including family relationships, our board of directors determined that Ms. Hammonds and Messrs. Coviello, Kennelly, Li, Seawell and Wells,
105
Table of Contents
representing six of our eight directors, are “independent directors” as defined under current rules and regulations of the SEC and the listing standards of the Nasdaq Stock Market. In making these determinations, our board of directors considered the current and prior relationships that each non-employee director has with our company and all other facts and circumstances that our board of directors deemed relevant in determining their independence, including the beneficial ownership of our capital stock by each non-employee director and the transactions involving them described in “Certain Relationships and Related Party Transactions.”
Board Committees
Our board of directors has established an audit committee and a compensation committee and intends to establish a nominating and corporate governance committee in connection with this offering, each of which has the composition and responsibilities described below. From time to time, our board of directors may establish other committees to facilitate the management of our business.
Audit Committee
Upon the closing of this offering, our audit committee will consist of three directors, Ms. Hammonds and Messrs. Coviello and Seawell, each of whom our board of directors has determined satisfies the independence requirements for audit committee members under the listing standards of the Nasdaq Stock Market and Rule 10A-3 of the Securities Exchange Act of 1934, as amended, or the Exchange Act. Each member of our audit committee meets the financial literacy requirements under the rules and regulations of the Nasdaq Stock Market and the SEC. Mr. Seawell is the chairman of the audit committee and our board of directors has determined that Mr. Seawell is an audit committee “financial expert” as defined by Item 407(d) of Regulation S-K under the Securities Act. The principal duties and responsibilities of our audit committee include, among other things:
| • | selecting a qualified firm to serve as the independent registered public accounting firm to audit our financial statements; |
| • | helping to ensure the independence and performance of the independent registered public accounting firm; |
| • | discussing the scope and results of the audit with the independent registered public accounting firm, and reviewing, with management and the independent accountants, our interim and year-end operating results; |
| • | developing procedures for employees to submit concerns anonymously about questionable accounting or audit matters; |
| • | reviewing our policies on risk assessment and risk management; |
| • | reviewing related party transactions; |
| • | obtaining and reviewing a report by the independent registered public accounting firm at least annually, that describes its internal quality-control procedures, any material issues with such procedures, and any steps taken to deal with such issues when required by applicable law; and |
| • | approving (or, as permitted, pre-approving) all audit and all permissible non-audit services, other than de minimis non-audit services, to be performed by the independent registered public accounting firm. |
Our audit committee will operate under a written charter, to be effective immediately prior to the closing of this offering that satisfies the applicable rules of the SEC and the listing standards of the Nasdaq Stock Market.
Compensation Committee
Upon the closing of this offering, our compensation committee will consist of three directors, Messrs. Kennelly, Li and Wells. Our board of directors has determined that each of the compensation committee
106
Table of Contents
members is a non-employee member of our board of directors as defined in Rule 16b-3 under the Exchange Act. Mr. Kennelly will be the chairman of the compensation committee. The composition of our compensation committee meets the requirements for independence under the current listing standards of the Nasdaq Stock Market and current SEC rules and regulations. The principal duties and responsibilities of our compensation committee include, among other things:
| • | reviewing and approving, or recommending that our board of directors approve, the compensation of our executive officers; |
| • | reviewing and recommending to our board of directors the compensation of our directors; |
| • | reviewing and approving, or recommending that our board of directors approve, the terms of compensatory arrangements with our executive officers; |
| • | administering our stock and equity incentive plans; |
| • | reviewing and approving, or recommending that our board of directors approve, incentive compensation and equity plans; and |
| • | reviewing and establishing general policies relating to compensation and benefits of our employees and reviewing our overall compensation philosophy. |
Our compensation committee will operate under a written charter, to be effective immediately prior to the closing of this offering, that satisfies the applicable rules of the SEC and the listing standards of the Nasdaq Stock Market.
Nominating and Corporate Governance Committee
Upon the closing of this offering, our nominating and corporate governance committee will consist of three directors, Ms. Hammonds and Messrs. Coviello and Wells. Mr. Coviello will be the chairman of the nominating and corporate governance committee. The composition of our nominating and governance committee meets the requirements for independence under the current listing standards of the Nasdaq Stock Market and current SEC rules and regulations. The nominating and corporate governance committee’s responsibilities include, among other things:
| • | identifying, evaluating and selecting, or recommending that our board of directors approve, nominees for election to our board of directors and its committees; |
| • | evaluating the performance of our board of directors and of individual directors; |
| • | considering and making recommendations to our board of directors regarding the composition of our board of directors and its committees; |
| • | reviewing developments in corporate governance practices; |
| • | evaluating the adequacy of our corporate governance practices; |
| • | developing and making recommendations to our board of directors regarding corporate governance guidelines and matters; and |
| • | overseeing an annual evaluation of our board of directors’ performance. |
Our nominating and governance committee will operate under a written charter, to be effective immediately prior to the closing of this offering, that satisfies the applicable rules of the SEC and the listing standards of the Nasdaq Stock Market.
Compensation Committee Interlocks and Insider Participation
None of our executive officers currently serves, or in the past year has served, as a member of the board of directors or compensation committee of any entity that has one or more executive officers serving on our board
107
Table of Contents
of directors or compensation committee. None of the members of our compensation committee is an officer or employee of our company, nor have they ever been an officer or employee of our company.
Code of Business Conduct and Ethics
In connection with this offering, we intend to adopt a Code of Business Conduct and Ethics, or the Code of Conduct, applicable to all of our employees, executive officers and directors. Following the closing of this offering, the Code of Conduct will be available on our website at www.tenable.com. The nominating and corporate governance committee of our board of directors will be responsible for overseeing the Code of Conduct and must approve any waivers of the Code of Conduct for employees, executive officers and directors. We expect that any amendments to the Code of Conduct, or any waivers of its requirements, will be disclosed on our website as required by applicable law or the listing standards of the Nasdaq Stock Market. The inclusion of our website address in this prospectus does not include or incorporate by reference into this prospectus the information on or accessible through our website.
Non-Employee Director Compensation
Historically, we have provided equity-based compensation to our independent directors who are not employees or affiliated with our largest investors for the time and effort necessary to serve as a member of our board of directors. In addition, our non-employee directors are entitled to reimbursement of direct expenses incurred in connection with attending meetings of our board of directors or committees thereof. We expect that our board of directors will adopt a director compensation policy for non-employee directors following the closing of this offering.
2017 Director Compensation Table
The following table sets forth information regarding the compensation earned for service on our board of directors in 2017 by our non-employee directors. Amit Y. Yoran, our President and Chief Executive Officer, is also a member of our board of directors but did not receive any additional compensation for service as a director.
| Name |
Option Awards ($)(1)(2) |
All Other Compensation ($) |
Total ($) | |||||||||
| Matthew D. Gatto(3) |
— | — | — | |||||||||
| John C. Huffard Jr. |
— | 520,537 | (4) | 520,537 | ||||||||
| Ping Li |
— | — | — | |||||||||
| John K. Locke(5) |
— | — | — | |||||||||
| A. Brooke Seawell |
1,044,418 | — | 1,044,418 | |||||||||
| Richard M. Wells |
— | — | — | |||||||||
| (1) | This column reflects the full grant date fair value of options granted during the year measured pursuant to Financial Accounting Standard Board Accounting Standards Codification Topic 718, or ASC 718, the basis for computing stock-based compensation in our consolidated financial statements. The assumptions we used in valuing options are described in Note 8 to our consolidated financial statements included elsewhere in this prospectus. |
108
Table of Contents
| (2) | The table below shows the aggregate number of option awards outstanding for each of our directors who is not a named executive officer as of December 31, 2017: |
| Name |
Option Awards (#) |
|||
| Matthew D. Gatto(3) |
— | |||
| John C. Huffard Jr. |
— | |||
| Ping Li |
— | |||
| John K. Locke(5) |
— | |||
| A. Brooke Seawell |
230,000 | |||
| Richard M. Wells |
— | |||
| (3) | Mr. Gatto resigned from our board of directors on February 21, 2018. |
| (4) | This amount represents amounts paid pursuant to Mr. Huffard’s employment as our President and Chief Operating Officer in 2017, including $400,872 in salary, $107,900 in non-equity incentive plan compensation and $10,800 in company matching contributions under our 401(k) plan. Mr. Huffard did not receive any additional compensation for his service as a director. |
| (5) | Mr. Locke resigned from our board of directors on May 8, 2018. |
109
Table of Contents
This section discusses the material elements of our executive compensation policies for our “named executive officers” and the most important factors relevant to an analysis of these policies. It provides qualitative information regarding the manner and context in which compensation is awarded to and earned by our executive officers named in the “Summary Compensation Table” below, or our “named executive officers,” and is intended to place in perspective the data presented in the following tables and the corresponding narrative.
Summary Compensation Table
The following table sets forth information regarding compensation earned in 2017 by our named executive officers.
| Name and Principal Position |
Salary ($) |
Stock Awards ($)(1) |
Option Awards ($)(1) |
Non-Equity Incentive Plan Compensation ($)(2) |
All Other Compensation ($) |
Total ($) |
||||||||||||||||||
| Amit Y. Yoran(3) |
400,000 | 6,726,411 | 5,777,020 | 215,800 | — | 13,119,231 | ||||||||||||||||||
| President, Chief Executive Officer and Chairman |
||||||||||||||||||||||||
| Stephen A. Vintz |
336,000 | — | — | 230,905 | 437 | 567,342 | ||||||||||||||||||
| Chief Financial Officer |
||||||||||||||||||||||||
| John G. Negron |
479,643 | (4) | — | 1,250,762 | 54,781 | 1,560 | (5) | 1,786,746 | ||||||||||||||||
| Chief Revenue Officer |
||||||||||||||||||||||||
| Stephen A. Riddick |
250,000 | — | 624,520 | 161,850 | 10,800 | (5) | 1,047,170 | |||||||||||||||||
| General Counsel and Corporate Secretary |
||||||||||||||||||||||||
| (1) | This column reflects the full grant date fair value of restricted stock awards and option awards granted during the year measured pursuant to ASC 718, the basis for computing stock-based compensation in our consolidated financial statements. This calculation assumes that the named executive officer will perform the requisite service for the award to vest in full as required by SEC rules. The assumptions we used in valuing options are described in Note 8 to our consolidated financial statements included in this prospectus. |
| (2) | See “—Narrative to Summary Compensation Table—Quarterly Bonus Plan” below for a description of the material terms of the program pursuant to which this compensation was awarded. For Mr. Negron, the amount reflects the pro rata portion of the compensation earned by him in 2017 from commencement of his employment through December 31, 2017. For all named executive officers, amounts reflect above plan performance, as determined by the board of directors. |
| (3) | Mr. Yoran is also a member of our board of directors, but did not receive any additional compensation in his capacity as a director. |
| (4) | Mr. Negron’s employment with us commenced on February 27, 2017. The 2017 salary reported reflects the pro rata portion of Mr. Negron’s annual salary of $312,000 earned during 2017 from commencement of his employment through December 31, 2017, and includes $217,243 in sales commissions earned in 2017. |
| (5) | Consists of company matching contributions under our 401(k) plan. |
Narrative to Summary Compensation Table
We review compensation annually for all employees, including our executive officers. In setting executive base salaries and bonuses and granting equity incentive awards, we consider compensation for comparable positions in the market, the historical compensation levels of our executives, individual performance as compared to our expectations and objectives, our desire to motivate our employees to achieve short- and long-term results that are in the best interests of our stockholders and a long-term commitment to our company. We do not target a
110
Table of Contents
specific competitive position or a specific mix of compensation among base salary, bonus or long-term incentives.
The compensation committee of our board of directors has historically determined our executives’ compensation. Our compensation committee typically reviews and discusses management’s proposed compensation with the Chief Executive Officer for all executives other than the Chief Executive Officer. Based on those discussions and its discretion, the compensation committee then approves the compensation of each executive officer after discussions without members of management present.
Annual Base Salary
We have entered into offer letters with each of our named executive officers that establish annual base salaries, which are generally determined, approved and reviewed periodically by our compensation committee in order to compensate our named executive officers for the satisfactory performance of duties to our company. Annual base salaries are intended to provide a fixed component of compensation to our named executive officers, reflecting their skill sets, experience, roles and responsibilities. Base salaries for our named executive officers have generally been set at levels deemed necessary to attract and retain individuals with superior talent. See “—Offer Letters and Potential Payments Upon Termination or Change in Control.”
Quarterly Bonus Plan
Our named executive officers are eligible to participate in our company’s Quarterly Bonus Plan on the same basis as all employees of our company. The Quarterly Bonus Plan is designed to motivate and reward our employees for the attainment of certain key financial performance metrics by our company, as determined by our board of directors annually, and individual performance goals, as determined by our compensation committee for our Chief Executive Officer and by our Chief Executive Officer for the other named executive officers. Each named executive officer may earn more or less than the annual target amount set forth in his offer letter or determined by our compensation committee, as applicable, based on our company’s and his individual performance.
Equity-Based Awards
Our equity-based incentive awards are designed to align our interests with those of our employees and consultants, including our executive officers. Our compensation committee is responsible for approving equity grants. Vesting of equity awards is generally tied to continuous service with us and serves as an additional retention measure. Our executives generally are awarded an initial new hire grant upon commencement of employment. Additional grants may occur periodically in order to specifically incentivize executives with respect to achieving certain corporate goals or to reward executives for exceptional performance.
In June 2018, our board of directors granted stock options to purchase 565,657 shares to Mr. Yoran, 423,434 shares to Mr. Vintz, 161,616 shares to Mr. Negron and 116,162 shares to Mr. Riddick. Each option has an exercise price of $16.21 per share. For each of Messrs. Yoran, Negron and Riddick, 25% of the options vest in equal monthly installments over the twelve-month period beginning on the second anniversary of the date of grant and ending on the third anniversary of the date of grant, and the remaining options vest monthly over the twelve-month period thereafter, subject to his continued service as of each vesting date. For Mr. Vintz, 25% of the options vest on each anniversary of the date of grant, subject to his continued service as of each vesting date. All such awards are subject to acceleration of vesting upon termination of employment without cause or for good reason and acceleration of vesting in connection with a change in control transaction in which case the officer is terminated without cause or for good reason within a specified period of time before and after the change in control.
111
Table of Contents
Outstanding Equity Awards as of December 31, 2017
The following table sets forth certain information about outstanding equity awards granted to our named executive officers that remain outstanding as of December 31, 2017.
| Option Awards(1) | Stock Awards(1) | |||||||||||||||||||||||||||
| Name |
Grant Date |
Number of Securities Underlying Unexercised Options (#) Exercisable |
Number of Securities Underlying Unexercised Options (#) Unexercisable |
Option Exercise Price ($)(2) |
Option Expiration Date |
Number of Shares of Stock That Have Not Vested (#) |
Market Value of Shares of Stock That Have Not Vested ($)(3) |
|||||||||||||||||||||
| Amit Y. Yoran |
1/18/17 | — | 2,839,524 | (4) | 4.25 | 1/18/27 | ||||||||||||||||||||||
| 1/18/17 | 1,582,685 | (4) | 15,288,737 | |||||||||||||||||||||||||
| Stephen A. Vintz |
12/16/14 | (5) | 252,750 | 252,750 | (6) | 2.36 | 12/16/24 | |||||||||||||||||||||
| 6/30/16 | 26,250 | 78,750 | (7) | 4.15 | 6/30/26 | |||||||||||||||||||||||
| John G. Negron |
2/27/17 | — | 620,000 | (8) | 4.25 | 2/27/27 | ||||||||||||||||||||||
| Stephen A. Riddick |
5/31/16 | 50,000 | 150,000 | (9) | 4.15 | 5/31/26 | ||||||||||||||||||||||
| 6/26/17 | — | 225,000 | (10) | 5.96 | 6/26/27 | |||||||||||||||||||||||
| (1) | Except as noted, all of the option and restricted stock awards listed in the table were granted under our 2016 Stock Incentive Plan, the terms of which are described below under “—Equity Incentive Plans—2016 Stock Incentive Plan.” |
| (2) | All of the option awards listed in the table were granted with a per share exercise price equal to or above the fair market value of one share of our common stock on the date of grant, as determined in good faith by our board of directors. |
| (3) | Represents the market value of the restricted stock award as of December 31, 2017, based on an assumed fair market value of our common stock of $9.66 per share on December 31, 2017. |
| (4) | 25% of the shares subject to such awards vested on January 1, 2018, and will continue to vest quarterly thereafter, in each case subject to Mr. Yoran’s continued service. |
| (5) | Granted under our 2012 Stock Incentive Plan, the terms of which are described below under “—Equity Incentive Plans—2012 Stock Incentive Plan.” |
| (6) | 25% of the shares subject to the option vested on October 15, 2015 and will continue to vest on each twelve month anniversary thereof, in each case subject to Mr. Vintz’s continued service. |
| (7) | 25% of the shares subject to the option vested on June 30, 2017 and will continue to vest on each twelve month anniversary thereof, in each case subject to Mr. Vintz’s continued service. |
| (8) | 25% of the shares subject to the option vested on February 27, 2018, and will continue to vest quarterly thereafter, in each case subject to Mr. Negron’s continued service. |
| (9) | 25% of the shares subject to the option vested on May 31, 2017, and will continue to vest on each twelve month anniversary thereof, in each case subject to Mr. Riddick’s continued service. |
| (10) | 25% of the shares subject to the option will vest on June 26, 2018, and will continue to vest on each twelve month anniversary thereof, in each case subject to Mr. Riddick’s continued service. |
We may in the future, on an annual basis or otherwise, grant additional equity awards to our executive officers pursuant to our 2018 Equity Incentive Plan, or the 2018 Plan, the terms of which are described below under “—Equity Incentive Plans—2018 Equity Incentive Plan.”
Retirement Benefits and Other Compensation
We maintain a defined contribution retirement plan that provides eligible U.S. employees, including our named executive officers, with an opportunity to save for retirement on a tax advantaged basis. Eligible employees may defer eligible compensation on a pre-tax basis, up to the statutorily prescribed annual limits on contributions under the Internal Revenue Code of 1986, as amended, or the Code. We have the ability to make discretionary contributions to the 401(k) plan. For 2017, during each pay period, we made matching
112
Table of Contents
contributions for each $1.00 of an employee’s contribution, up to a maximum of 4% of the employee’s eligible earnings, subject to annual limitations, for the applicable pay period. We expect to do the same in 2018. Employee contributions are allocated to each participant’s individual account and are then invested in selected investment alternatives according to the participant’s directions. Employees are immediately and fully vested in their contributions. The 401(k) plan is intended to be qualified under Section 401(a) of the Code, with the 401(k) plan’s related trust intended to be tax exempt under Section 501(a) of the Code. As a tax-qualified retirement plan, contributions to the 401(k) plan and earnings on those contributions are not taxable to the employees until distributed from the 401(k) plan.
Our named executive officers are eligible to participate in our other benefit programs on the same basis as all employees of our company. We generally do not provide perquisites or personal benefits except in limited circumstances.
Offer Letters and Potential Payments Upon Termination or Change in Control
We are party to offer letters with each of our named executive officers. The agreements generally provide for at-will employment without any specific term and set forth the named executive officer’s initial base salary, eligibility for employee benefits and severance benefits upon a qualifying termination of employment or change in control of our company. Each of our named executive officers has executed our standard intellectual property assignment, non-disclosure, non-solicitation and non-competition agreement. The key terms of the offer letters with our named executive officers, including potential payments upon termination or change in control, are described below.
Mr. Yoran
We entered into an offer letter with Mr. Yoran in October 2016 and an addendum thereto in February 2017. The letter provides for a starting annual base salary of $400,000 and a target annual bonus of $200,000 based upon the achievement of goals established by our board of directors. The offer letter further provides for the grant of an option to purchase 2,839,524 shares of our common stock as well as 1,582,685 shares of restricted common stock, which were granted on January 18, 2017. In May 2018, our compensation committee approved an increase in Mr. Yoran’s target annual bonus to $400,000, effective July 1, 2018. The offer letter provides that Mr. Yoran will serve on our board of directors, without additional compensation, as long as he serves as Chief Executive Officer.
If we terminate Mr. Yoran without cause, or if Mr. Yoran terminates his employment for good reason or due to death or permanent disability, he will be entitled to (1) continued payment of his base salary for 12 months, (2) if he timely elects to continue healthcare coverage through COBRA, 12 months of reimbursement of the amount by which his COBRA payments exceed the premium paid by our employees for similar coverage and (3) accelerated vesting of his outstanding equity awards (granted pursuant to the offer letter) at a rate equal to 6.25% multiplied by a fraction, the numerator of which is equal to the number of completed months of continuous service that have elapsed since the most recent quarterly anniversary of January 2, 2017 and the denominator of which is three. The offer letter further provides that if Mr. Yoran’s employment is terminated by us (other than for cause or on account of death or permanent disability) or by Mr. Yoran for good reason 90 days prior to or within 12 months following the date on which we enter into a definitive agreement providing for a change in control of our company, Mr. Yoran’s then-outstanding equity awards (granted pursuant to the offer letter) will vest in full. Such severance is conditioned upon Mr. Yoran’s execution of a release agreement. The salary continuation and COBRA benefits are further conditioned upon Mr. Yoran’s compliance with certain non-disclosure and non-solicitation obligations and resignation from all positions with us.
Mr. Vintz
We entered into an offer letter with Mr. Vintz in October 2014. The letter provides for a starting annual base salary of $300,000 and a target annual bonus equal to 50% of his base salary. In May 2016, we increased
113
Table of Contents
Mr. Vintz’s annual base salary to $336,000 and his target annual bonus to $214,000. In May 2018, our compensation committee approved an increase in Mr. Vintz’s base salary to $350,000 and his target annual bonus to $225,000, effective July 1, 2018. On December 16, 2014, Mr. Vintz was granted an option to purchase shares of common stock of Tenable, Inc., which was converted into an option to purchase shares of our common stock following our recapitalization.
If we terminate Mr. Vintz without cause, or if Mr. Vintz terminates his employment for good reason, other than during a change of control termination period or due to death or disability, he will be entitled to (1) a lump sum payment equal to 12 months of his base salary, (2) if he timely elects to continue healthcare coverage through COBRA, 12 months of reimbursement of the amount by which his COBRA payments exceed the premium paid by our employees for similar coverage and (3) following the one-year anniversary of the vesting commencement date, accelerated vesting of his outstanding options at a rate equal to 25% multiplied by a fraction, the numerator of which is equal to the number of completed months of continuous service that have elapsed since the preceding anniversary of the vesting commencement date and the denominator of which is 12. The offer letter further provides that if we terminate Mr. Vintz without cause (other than on account of death or permanent disability), or if Mr. Vintz terminates his employment for good reason within the 12-month period following the date on which we enter into a definitive agreement providing for a change in control of our company, and, in the case of the options granted pursuant to the offer letter, within 90 days prior to such date, Mr. Vintz’s then-outstanding equity awards (granted pursuant to the offer letter) will vest in full and Mr. Vintz will be entitled to the aforementioned severance benefits as well as 100% of the target bonus amount for the year in which the termination or resignation occurred, less any bonus amounts already paid for that year. Such severance is conditioned upon Mr. Vintz’s execution of a release agreement in favor of Tenable. The salary continuation and COBRA benefits are further conditioned upon Mr. Vintz’s compliance with certain non-disclosure and non-solicitation obligations and resignation from all positions with us.
Mr. Negron
We entered into an offer letter with Mr. Negron in February 2017. The letter provides for a starting annual base salary of $312,000 and an annual target bonus in the aggregate of up to 95% of his annual base salary and commissions earned. In May 2018, our compensation committee approved an increase in Mr. Negron’s base salary to $350,000 and his target annual bonus to $300,000, effective July 1, 2018. On February 27, 2017, Mr. Negron was granted an option to purchase 620,000 shares of our common stock in accordance with the terms of the offer letter.
If we terminate Mr. Negron without cause, or if Mr. Negron terminates his employment for good reason, other than during a change of control termination period or due to death or disability, he will be entitled to (1) a lump sum payment equal to three months of base salary plus any incentive compensation earned through the date of termination, (2) if he timely elects to continue healthcare coverage through COBRA, three months of reimbursement of the amount by which his COBRA payments exceed the premium paid by our employees for similar coverage and (3) accelerated vesting of his outstanding equity awards (granted pursuant to the offer letter) at a rate equal to 6.25% multiplied by a fraction, the numerator of which is equal to the number of completed months of continuous service that have elapsed since the most recent quarterly anniversary of February 27, 2017 and the denominator of which is three. The offer letter further provides that if we terminate Mr. Negron without cause (other than on account of death or permanent disability), or if Mr. Negron terminates his employment for good reason during a change of control termination period beginning 90 days prior to and ending 12 months following the date on which we enter into a definitive agreement providing for a change in control of us, Mr. Negron will be entitled to (1) a lump sum payment equal to six months of base salary plus any incentive compensation earned through the date of termination, (2) a pro rata portion of the target bonus amount for the year in which the termination or resignation occurred, less any bonus amounts already paid for that year, (3) if he timely elects to continue healthcare coverage through COBRA, six months of reimbursement of the amount by which his COBRA payments exceed the premium paid by our employees for similar coverage and (4) full vesting of any outstanding equity awards (granted pursuant to the offer letter). The cash severance and COBRA benefits
114
Table of Contents
are conditioned upon Mr. Negron’s compliance with certain non-disclosure and non-solicitation obligations, execution of a release agreement and resignation from all positions with us.
Mr. Riddick
We entered into an offer letter with Mr. Riddick in May 2016. The letter provides for a starting annual base salary of $250,000 and an annual target bonus equal to 60% of his annual base salary. In May 2018, our compensation committee approved an increase in Mr. Riddick’s base salary to $320,000 and set his target annual bonus at $150,000, effective July 1, 2018. On May 31, 2016, Mr. Riddick was granted an option to purchase 200,000 shares of our common stock in accordance with the terms of the offer letter.
If Mr. Riddick terminates his employment for good reason or is terminated other than for cause during a period beginning when we enter into a definitive agreement providing for a change in control of our company and ending on the closing of such change in control or within 12 months following the date on which we enter into a definitive agreement providing for a change in control of our company, Mr. Riddick’s then-outstanding equity awards (granted pursuant to the offer letter) will vest in full.
Equity Incentive Plans
2018 Equity Incentive Plan
In June 2018 our board of directors adopted, and in , 2018 our stockholders approved, our 2018 Equity Incentive Plan, or 2018 Plan. The 2018 Plan will become effective immediately upon the execution of the underwriting agreement related to this offering, at which point no further grants will be made under our 2016 Stock Incentive Plan, as described below under “—2016 Stock Incentive Plan.” No awards have been granted and no shares of our common stock have been issued under our 2018 Plan.
Stock Awards. The 2018 Plan provides for the grant of incentive stock options within the meaning of Section 422 of the Code, nonstatutory stock options, stock appreciation rights, restricted stock awards, restricted stock unit awards, performance-based stock awards and other forms of equity compensation, which are collectively referred to as stock awards. Additionally, the 2018 Plan provides for the grant of performance cash awards. Incentive stock options may be granted only to employees. All other awards may be granted to employees, including officers, and to non-employee directors and consultants.
Share Reserve. Initially, the aggregate number of shares of our common stock that may be issued pursuant to stock awards under the 2018 Plan after the 2018 Plan becomes effective is the sum of (1) 9,900,000 shares and (2) the number of shares of common stock reserved for issuance under our 2016 Stock Incentive Plan at the time our 2018 Plan becomes effective. Additionally, any shares subject to stock options or other stock awards granted under our 2016 Stock Incentive Plan, 2012 Stock Incentive Plan or 2002 Stock Incentive Plan that would have otherwise returned to such plan (such as upon the expiration or termination of a stock award prior to vesting) will be added to, and available for issuance under, our 2018 Plan. In addition, the number of shares of our common stock reserved for issuance under our 2018 Plan will automatically increase on January 1 of each year, beginning on January 1, 2019 (assuming the 2018 Plan becomes effective before such date) and continuing through and including January 1, 2028, by 5% of the total number of shares of our capital stock outstanding on December 31 of the preceding calendar year, or a lesser number of shares determined by our board of directors. The maximum number of shares that may be issued upon the exercise of incentive stock options under our 2018 Plan is 90,000,000 shares.
If a stock award granted under the 2018 Plan expires or otherwise terminates without being exercised in full, or is settled in cash, the shares of our common stock not acquired pursuant to the stock award again will become available for subsequent issuance under the 2018 Plan. In addition, the following types of shares under the 2018 Plan may become available for the grant of new stock awards under the 2018 Plan: (1) shares that are forfeited to
115
Table of Contents
or repurchased by us prior to becoming fully vested; (2) shares withheld to satisfy income or employment withholding taxes; or (3) shares used to pay the exercise or purchase price of a stock award. Shares issued under the 2018 Plan may be previously unissued shares or reacquired shares bought by us on the open market.
Administration. Our board of directors, or a duly authorized committee thereof, has the authority to administer the 2018 Plan. Our board of directors may also delegate to one or more of our officers the authority to (1) designate employees (other than other officers) to be recipients of certain stock awards, (2) determine the number of shares of common stock to be subject to such stock awards and (3) specify the other terms and conditions, including the strike price or purchase price and vesting schedule, applicable to such awards. Subject to the terms of the 2018 Plan, our board of directors or the authorized committee, referred to as the plan administrator, determines recipients, dates of grant, the numbers and types of stock awards to be granted and the terms and conditions of the stock awards, including the period of their exercisability and vesting schedule applicable to a stock award. Subject to the limitations set forth below, the plan administrator will also determine the exercise price, strike price or purchase price of awards granted and the types of consideration to be paid for the award.
The plan administrator has the authority to modify outstanding awards under our 2018 Plan. Subject to the terms of our 2018 Plan, the plan administrator has the authority, without stockholder approval, to reduce the exercise, purchase or strike price of any outstanding stock award, cancel any outstanding stock award in exchange for new stock awards, cash or other consideration, or take any other action that is treated as a repricing under generally accepted accounting principles, with the consent of any adversely affected participant.
Stock Options. Incentive and nonstatutory stock options are evidenced by stock option agreements adopted by the plan administrator. The plan administrator determines the exercise price for a stock option, within the terms and conditions of the 2018 Plan, provided that the exercise price of a stock option generally cannot be less than 100% of the fair market value of our common stock on the date of grant. Options granted under the 2018 Plan vest at the rate specified by the plan administrator.
The plan administrator determines the term of stock options granted under the 2018 Plan, up to a maximum of 10 years. Unless the terms of an option holder’s stock option agreement provide otherwise, if an option holder’s service relationship with us, or any of our affiliates, ceases for any reason other than disability, death or cause, the option holder may generally exercise any vested options for a period of three months following the cessation of service. The option term will automatically be extended in the event that exercise of the option following such a termination of service is prohibited by applicable securities laws or our insider trading policy. If an option holder’s service relationship with us or any of our affiliates ceases due to disability or death, or an optionholder dies within a certain period following cessation of service, the optionholder or a beneficiary may generally exercise any vested options for a period of 12 months in the event of disability and 18 months in the event of death. In the event of a termination for cause, options generally terminate immediately. In no event may an option be exercised beyond the expiration of its term.
Acceptable consideration for the purchase of common stock issued upon the exercise of a stock option will be determined by the plan administrator and may include (1) cash, check, bank draft or money order, (2) a broker-assisted cashless exercise, (3) the tender of shares of our common stock previously owned by the optionholder, (4) a net exercise of the option if it is a nonqualified stock option and (5) other legal consideration approved by the plan administrator.
Unless the plan administrator provides otherwise, options generally are not transferable except by will, the laws of descent and distribution, or pursuant to a domestic relations order. An optionholder may designate a beneficiary, however, who may exercise the option following the option holder’s death.
Tax Limitations on Incentive Stock Options. The aggregate fair market value, determined at the time of grant, of our common stock with respect to incentive stock options that are exercisable for the first time by an optionholder during any calendar year under all of our equity incentive plans may not exceed $100,000. Options
116
Table of Contents
or portions thereof that exceed such limit will be treated as nonqualified stock options. No incentive stock option may be granted to any person who, at the time of the grant, owns or is deemed to own stock possessing more than 10% of our total combined voting power or that of any of our affiliates unless (1) the option exercise price is at least 110% of the fair market value of the stock subject to the option on the date of grant and (2) the term of the incentive stock option does not exceed five years from the date of grant.
Restricted Stock Awards. Restricted stock awards are evidenced by restricted stock award agreements adopted by the plan administrator. Restricted stock awards may be granted in consideration for (1) cash, check, bank draft or money order, (2) services rendered to us or our affiliates or (3) any other form of legal consideration. Common stock acquired under a restricted stock award may, but need not, be subject to a share repurchase option in our favor in accordance with a vesting schedule as determined by the plan administrator. Rights to acquire shares under a restricted stock award may be transferred only upon such terms and conditions as set by the plan administrator. Except as otherwise provided in the applicable award agreement, restricted stock unit awards that have not vested will be forfeited upon the participant’s cessation of continuous service for any reason.
Restricted Stock Unit Awards. Restricted stock unit awards evidenced by restricted stock unit award agreements adopted by the plan administrator. Restricted stock unit awards may be granted in consideration for any form of legal consideration or for no consideration. A restricted stock unit award may be settled by cash, delivery of stock, a combination of cash and stock as deemed appropriate by the plan administrator or in any other form of consideration set forth in the restricted stock unit award agreement. Additionally, dividend equivalents may be credited in respect of shares covered by a restricted stock unit award. Rights under a restricted stock units award may be transferred only upon such terms and conditions as set by the plan administrator. Restricted stock unit awards may be subject to vesting as determined by the plan administrator. Except as otherwise provided in the applicable award agreement, restricted stock units that have not vested will be forfeited upon the participant’s cessation of continuous service for any reason.
Stock Appreciation Rights. Stock appreciation rights are evidenced by stock appreciation grant agreements adopted by the plan administrator. The plan administrator determines the strike price for a stock appreciation right, which generally cannot be less than 100% of the fair market value of our common stock on the date of grant. Upon the exercise of a stock appreciation right, we will pay the participant an amount in cash or stock equal to (1) the excess of the per share fair market value of our common stock on the date of exercise over the strike price, multiplied by (2) the number of shares of common stock with respect to which the stock appreciation right is exercised. A stock appreciation right granted under the 2018 Plan vests at the rate specified in the stock appreciation right agreement as determined by the plan administrator.
The plan administrator determines the term of stock appreciation rights granted under the 2018 Plan, up to a maximum of ten years. Unless the terms of a participant’s stock appreciation right agreement provides otherwise, if a participant’s service relationship with us or any of our affiliates ceases for any reason other than cause, disability or death, the participant may generally exercise any vested stock appreciation right for a period of three months following the cessation of service. The stock appreciation right term will be further extended in the event that exercise of the stock appreciation right following such a termination of service is prohibited by applicable securities laws. If a participant’s service relationship with us, or any of our affiliates, ceases due to disability or death, or a participant dies within a certain period following cessation of service, the participant or a beneficiary may generally exercise any vested stock appreciation right for a period of 12 months in the event of disability and 18 months in the event of death. In the event of a termination for cause, stock appreciation rights generally terminate immediately upon the occurrence of the event giving rise to the termination of the individual for cause. In no event may a stock appreciation right be exercised beyond the expiration of its term.
Unless the plan administrator provides otherwise, stock appreciation rights generally are not transferable except by will, the laws of descent and distribution or pursuant to a domestic relations order. A stock appreciation right holder may designate a beneficiary, however, who may exercise the stock appreciation right following the holder’s death.
117
Table of Contents
Performance Awards. The 2018 Plan permits the grant of performance-based stock and cash awards. Our compensation committee can structure such awards so that stock or cash will be issued or paid pursuant to such award only after the achievement of certain pre-established performance goals during a designated performance period.
The performance goals that may be selected include one or more of the following: (i) earnings (including earnings per share and net earnings); (ii) earnings before interest, taxes and depreciation; (iii) earnings before interest, taxes, depreciation and amortization; (iv) earnings before interest, taxes, depreciation, amortization and legal settlements; (v) earnings before interest, taxes, depreciation, amortization, legal settlements and other income (expense); (vi) earnings before interest, taxes, depreciation, amortization, legal settlements, other income (expense) and stock-based compensation; (vii) earnings before interest, taxes, depreciation, amortization, legal settlements, other income (expense), stock-based compensation and changes in deferred revenue; (viii) total stockholder return; (ix) return on equity or average stockholders’ equity; (x) return on assets, investment, or capital employed; (xi) stock price; (xii) margin (including gross margin); (xiii) income (before or after taxes); (xiv) operating income; (xv) operating income after taxes; (xvi) pre-tax profit; (xvii) operating cash flow; (xviii) sales or revenue targets; (xix) increases in revenue or product revenue; (xx) expenses and cost reduction goals; (xxi) improvement in or attainment of working capital levels; (xxii) economic value added (or an equivalent metric); (xxiii) market share; (xxiv) cash flow; (xxv) cash flow per share; (xxvi) share price performance; (xxvii) debt reduction; (xxviii) implementation or completion of projects or processes; (xxix) stockholders’ equity; (xxx) capital expenditures; (xxxi) debt levels; (xxxii) operating profit or net operating profit; (xxxiii) workforce diversity; (xxxiv) growth of net income or operating income; (xxxv) billings; (xxxvi) bookings; (xxxvii) employee retention; (xxxviii) user satisfaction, including customer satisfaction or net promoter score measures; (xxxix) the number of users, including unique users; (xl) budget management; (xli) partner satisfaction; (xlii) entry into or completion of strategic partnerships or transactions (including in-licensing and out-licensing of intellectual property); (xliii) active clients; (xliv) keep rate; (xlv) average order value; (xlvi) client signups; (xlvii) client retention; (xlviii) conversion metrics; (xlix) client order metrics; (xlx) inventory metrics; and (xlxi) other measures of performance selected by our board of directors.
The performance goals may be based on company-wide performance or performance of one or more business units, divisions, affiliates or business segments, and may be either absolute or relative to the performance of one or more comparable companies or the performance of one or more relevant indices. Our board of directors is authorized at any time in its sole discretion to adjust or modify the calculation of a performance goal for the applicable performance period in order to prevent the dilution or enlargement of the rights of participants, (a) in the event of, or in anticipation of, any unusual or extraordinary corporate item, transaction, event or development; (b) in recognition of, or in anticipation of, any other unusual or nonrecurring events affecting us, or our financial statements in response to, or in anticipation of, changes in applicable laws, regulations, accounting principles, or business conditions; or (c) in view of our board of director’s assessment of our business strategy, performance of comparable organizations, economic and business conditions, and any other circumstances deemed relevant. Specifically, our board of directors is authorized to make adjustment in the method of calculating attainment of performance goals and objectives for a performance period as follows: (i) to exclude the dilutive effects of acquisitions or joint ventures; (ii) to assume that any business divested by us achieved performance objectives at targeted levels during the balance of a performance period following such divestiture; and (iii) to exclude the effect of any change in the outstanding shares of our common stock by reason of any stock dividend or split, stock repurchase, reorganization, recapitalization, merger, consolidation, spin-off, combination or exchange of shares or other similar corporate change, or any distributions to common stockholders other than regular cash dividends. In addition, the Board is authorized to make adjustment in the method of calculating attainment of performance goals and objectives for a performance period as follows: (i) to exclude restructuring and/or other nonrecurring charges; (ii) to exclude exchange rate effects, as applicable, for non-U.S. dollar denominated net sales and operating earnings; (iii) to exclude the effects of changes to generally accepted accounting standards required by the Financial Accounting Standards Board; (iv) to exclude the effects of any items that are “unusual” in nature or occur “infrequently” as determined under generally accepted
118
Table of Contents
accounting principles; (v) to exclude the effects to any statutory adjustments to corporate tax rates; and (vi) to make other appropriate adjustments determined by our board of directors.
Other Stock Awards. The plan administrator may grant other awards based in whole or in part by reference to our common stock. The plan administrator will set the number of shares under the stock award and all other terms and conditions of such awards.
Changes to Capital Structure. In the event that there is a specified type of change in our capital structure, such as a stock split or recapitalization, appropriate adjustments will be made to (1) the class and maximum number of shares reserved for issuance under the 2018 Plan, (2) the class and maximum number of shares by which the share reserve may increase automatically each year, (3) the class and maximum number of shares that may be issued upon the exercise of incentive stock options and (4) the class and number of shares and exercise price, strike price, or purchase price, if applicable, of all outstanding stock awards.
Corporate Transactions. In the event of certain specified significant corporate transactions, the plan administrator has the discretion to take any of the following actions with respect to stock awards:
| • | arrange for the assumption, continuation or substitution of a stock award by a surviving or acquiring entity or parent company; |
| • | arrange for the assignment of any reacquisition or repurchase rights held by us to the surviving or acquiring entity or parent company; |
| • | accelerate the vesting of the stock award and provide for its termination prior to the effective time of the corporate transaction; |
| • | arrange for the lapse of any reacquisition or repurchase right held by us; |
| • | cancel or arrange for the cancellation of the stock award in exchange for such cash consideration, if any, as our board of directors may deem appropriate or for no consideration; or |
| • | make a payment equal to the excess of (1) the value of the property the participant would have received upon exercise of the stock award over (2) the exercise price or strike price otherwise payable in connection with the stock award. |
The plan administrator is not obligated to treat all stock awards, even those that are of the same type, in the same manner.
Under the 2018 Plan, a significant corporate transaction is generally the consummation of (1) a sale or other disposition of all or substantially all of our consolidated assets, (2) a sale or other disposition of at least 50% of our outstanding securities, (3) a merger, consolidation or similar transaction following which we are not the surviving corporation or (4) a merger, consolidation or similar transaction following which we are the surviving corporation but the shares of our common stock outstanding immediately prior to such transaction are converted or exchanged into other property by virtue of the transaction.
Change in Control. The plan administrator may provide, in an individual award agreement or in any other written agreement between a participant and us, that the stock award will be subject to additional acceleration of vesting and exercisability or settlement in the event of a change in control. Under the 2018 Plan, a change in control is generally (1) the acquisition by a person or entity of more than 50% of our combined voting power other than by merger, consolidation or similar transaction; (2) a consummated merger, consolidation or similar transaction immediately after which our stockholders cease to own more than 50% of the combined voting power of the surviving entity; (3) a consummated sale, lease or exclusive license or other disposition of all or substantially all of our consolidated assets or (4) certain changes to a majority of the members of our board of directors.
119
Table of Contents
Amendment and Termination. Our board of directors has the authority to amend, suspend or terminate our 2018 Plan, provided that such action does not materially impair the existing rights of any participant without such participant’s written consent and provided further that certain types of amendments will require the approval of our stockholders. No incentive stock options may be granted after the tenth anniversary of the date our board of directors adopted our 2018 Plan.
2016 Stock Incentive Plan
General. Our 2016 Stock Incentive Plan, or our 2016 Plan, was approved by our board of directors and stockholders in May 2016 and was amended and restated in January 2017. We subsequently amended our 2016 plan in February 2017, February 2018 and June 2018 to increase the number of shares available for issuance. Our stockholders approved the most recent amendment in June 2018. Our 2016 Plan will be terminated in connection with our adoption of our 2018 Plan; however, awards outstanding under our 2016 Plan continue in full effect in accordance with their existing terms.
Share Reserve. As of March 31, 2018, we have reserved 14,700,000 shares of our common stock for issuance under our 2016 Plan plus any shares that are cancelled, forfeited or undelivered pursuant to awards granted under our 2012 Stock Incentive Plan or our 2002 Stock Incentive Plan. As of March 31, 2018, options to purchase 12,049,023 shares of common stock, at exercise prices ranging from $4.15 to $10.97 per share, or a weighted-average exercise price of $5.58 per share, were outstanding under our 2016 Plan. In June 2018, our board of directors and stockholders approved the amendment of our 2016 Plan to increase the share reserve under the 2016 Plan to 18,700,000 shares of common stock. Subsequent to March 31, 2018, we have granted, under the 2016 Plan, options to purchase an aggregate of 4,748,648 shares of common stock at exercise prices of $14.06 to $16.21 per share, and restricted stock units for an aggregate of 973,800 shares.
Administration. Our board of directors or our compensation committee, collectively the plan administrator, administers our 2016 Plan. The plan administrator has full authority and discretion to make any determinations and take any actions it deems necessary or advisable for the administration of our 2016 Plan and may select eligible persons to become participants, grant awards, determine the terms and conditions of such awards, prescribe award agreements, determine rules and regulations for administration, construe and interpret the 2016 Plan and award agreements, correct defects, supply omissions and reconcile inconsistencies therein and suspend the right to exercise awards as it deems appropriate.
Types of Awards. Our 2016 Plan provides for the award of restricted stock and for the grant of incentive stock options and nonstatutory stock options to purchase shares of our common stock and other stock-based awards to employees, members of our board of directors and consultants. Incentive stock options may be granted only to employees.
Options. The exercise price of options granted under our 2016 Plan will generally not be less than 100% of the fair market value of our common stock on the grant date. Options expire at the time determined by the plan administrator, but in no event more than ten years after they are granted, and generally expire earlier if the optionee’s service terminates.
Restricted Stock. The plan administrator determines the terms and conditions of restricted stock awards, including vesting and forfeiture terms. If a participant’s service relationship with us ceases for any reason, we may receive any or all of the shares of our common stock held by the participant that have not vested as of the date the participant terminates service with us through a forfeiture condition or a repurchase right.
Other Stock-Based Awards. Other stock-based awards are awards that may be denominated or payable in, valued in whole or in party by reference to, otherwise based on or related to shares of our common stock, including restricted stock units. The plan administrator determines the terms of other stock-based awards, including vesting and forfeiture terms.
120
Table of Contents
Capitalization Adjustments. In the event of any stock dividend, stock split, reverse stock split, recapitalization, reorganization, merger, amalgamation, consolidation, combination, exchange or other relevant change in our capitalization and certain other transactions, our board of directors will equitably and proportionately adjust the number and class of shares of stock that may be delivered under the 2016 Plan and/or the number, class, and price of shares of stock covered by each outstanding award.
Corporate Events. In the event of a merger, amalgamation or consolidation involving the Company, a change in control or a reorganization or liquidation of our company, the plan administrator may, except as provided in an award agreement, in its discretion provide for any one or more of the following:
| • | the assumption or substitution of any or all awards with appropriate adjustments; |
| • | the acceleration of vesting of any or all awards; |
| • | the cancellation of any or all awards (whether vested or unvested) together with payment to holders of vested awards (including any awards that would vest upon the corporate event but for such cancellation) of an amount based upon the per-share consideration paid for our common stock in connection with the corporate event, less any applicable exercise price; |
| • | the cancellation for no consideration of any awards with an exercise price greater than the per-share consideration paid for our common stock in connection with the corporate transaction; |
| • | the cancellation of any or all options and other awards subject to exercise (whether vested or unvested) as of the consummation of such corporate event; provided, that, all options and other awards to be so cancelled are first exercisable for a period of at least ten (10) days prior to such corporate event, with any exercise during such period of any unvested options or other awards to be (A) contingent upon and subject to the occurrence of the corporate event and (B) effectuated by such means as are approved by the plan administrator; and |
| • | the replacement of any or all awards (other than awards that are intended to qualify as “stock rights” that do not provide for a “deferral of compensation” within the meaning of Section 409A of the Code) with a cash incentive program that preserves the value of the awards so replaced (determined as of the consummation of the corporate event), with subsequent payment of cash incentives subject to the same vesting conditions as applicable to the awards so replaced and payment to be made within thirty (30) days of the applicable vesting date. |
The plan administrator is not obligated to take the same action or actions with respect to all awards or portions thereof or with respect to all participants and may take different actions with respect to the vested and unvested portions of an award.
Under our 2016 Plan, a change in control is generally the occurrence of (1) a change in ownership or control of our company effected through a transaction or series of transactions (other than an offering of our common stock to the general public through a registration statement filed with the Securities and Exchange Commission or similar non–United States regulatory agency) whereby any person or group directly or indirectly acquires “beneficial ownership” (within the meaning of Rule 13d-3 under the Securities Exchange Act of 1934, as amended) of securities possessing more than 50% of the total combined voting power of our securities outstanding immediately after such acquisition and pursuant to which certain investors cease to own, directly or indirectly, at least 50% of the securities issued to those investors on or before May 13, 2016; or (2) the sale or disposition, in one or a series of related transactions, of all or substantially all of our assets to any person or group.
Transferability. A participant generally may not transfer stock awards under our 2016 Plan other than by will, the laws of descent and distribution or as otherwise provided under our 2016 Plan.
Plan Amendment or Termination. Our board of directors has the authority to amend our 2016 Plan and any awards granted thereunder, provided that such action is approved by our stockholders to the extent stockholder
121
Table of Contents
approval is necessary and that such action does not materially impair the existing rights of any participant without such participant’s written consent. Our board of directors may provide for the repricing of awards granted under the 2016 Plan without stockholder approval. As described above, our 2016 Plan will terminate upon the effective date of our 2018 Plan.
2012 Stock Incentive Plan
General. Our 2012 Stock Incentive Plan, or our 2012 Plan, was originally adopted by our subsidiary Tenable, Inc. in August 2012 and subsequently amended and restated in December 2015. We assumed our 2012 Plan in its entirety in connection with our recapitalization described in “Prospectus Summary—Corporate Information.” All references to our 2012 Plan refer to our 2012 Plan as amended and restated, unless context otherwise requires. No additional awards may be granted under the 2012 Plan; however, outstanding awards continue in full effect in accordance with their existing terms.
Share Reserve. 6,188,309 shares of common stock were reserved for issuance under our 2012 Plan. As of March 31, 2018, options to purchase 2,143,209 shares of common stock, at exercise prices ranging from $1.58 to $6.37 per share, or a weighted-average exercise price of $3.34 per share, were outstanding under our 2012 Plan.
Administration. Our board of directors or our compensation committee, collectively the plan administrator, administers our 2012 Plan. The 2012 Plan was administered by the board of directors or a committee of the board of directors of Tenable, Inc. prior to our assumption of the 2012 Plan in December 2015. The plan administrator has full authority to (1) construe and interpret all provisions of the 2012 Plan and agreements thereunder, (2) determine the fair market value of our common stock, (3) select eligible participants, (4) determine the number of shares of our common stock covered by awards, (5) accelerate the time at which an award may be exercisable, transferable or nonforfeitable, (6) amend, cancel, extend, renew, accept the surrender of, modify or accelerate the vesting of or the lapse of restrictions on all or any portion of an outstanding award or reduce the exercise price of an option, (7) prescribe form award agreements, adopt policies and procedures regarding the exercise of awards, adopt, amend and rescind policies and procedures pertaining the administration of our 2012 Plan and (8) make all other determinations necessary or advisable for administration of our 2012 Plan.
Types of Awards. Our 2012 Plan provides for the grant of incentive stock options and nonstatutory stock options to purchase shares of our common stock, stock bonus awards, restricted stock awards and stock appreciation rights to employees, members of our board of directors and consultants. Incentive stock options may be granted only to employees.
Options. The exercise price of options granted under our 2012 Plan may not be less than 100% of the fair market value of a share of common stock on the grant date. Options expire at the time determined by the plan administrator, but in the case of incentive stock options, no more than ten years after they are granted, and generally expire earlier if the optionee’s service terminates.
Changes in Capitalization. In the event of any subdivision, consolidation or reclassification of shares or other capital readjustment, a stock split, a reverse stock split, the payment of a dividend in stock, a spin-off, the payment of an extraordinary dividend or distribution in a form other than stock in an amount that has a material effect on the fair market value of our common stock, or other increase or reduction of the number of shares of our common stock outstanding, without receiving consideration therefore in money, services or property, then the number, class and per share price of our common stock subject to outstanding awards will be appropriately and proportionately adjusted.
Merger, Consolidation or Asset Sale. In the event of a merger or other consolidation, or in the event of a transaction providing for the sale of all or substantially all of our stock or assets, outstanding awards will be
122
Table of Contents
subject to the agreement of merger, consolidation or sale. Such agreement may provide for one or more of the following:
| • | the continuation of outstanding awards; |
| • | the assumption of outstanding awards by the surviving entity or its parent; |
| • | the substitution of outstanding awards with new awards with substantially the same terms; |
| • | exercisability of outstanding awards to the extent vested and exercisable followed by the cancellation of such award (whether or not then exercisable); or |
| • | settlement of the full value of the outstanding awards to the extent vested and exercisable, with payment made in cash, cash equivalents or other property as determined by the plan administrator, and the cancellation of such awards (whether or not then exercisable). |
Transferability. A participant generally may not transfer stock awards under our 2012 Plan other than by will, the laws of descent and distribution or as otherwise provided under our 2012 Plan or an award agreement.
Plan Amendment or Termination. Our board of directors has the authority to amend our 2012 Plan, provided that such action is approved by our stockholders to the extent stockholder approval is necessary and that such action does not adversely affect the existing rights of any participant without such participant’s consent.
2002 Stock Incentive Plan
General. Our 2002 Stock Incentive Plan, or our 2002 Plan, was originally adopted by our subsidiary Tenable, Inc. in May 2003. We amended and restated the 2002 Plan and assumed it in its entirety in December 2015 in connection with our recapitalization described in “Prospectus Summary—Corporate Information.” All references to our 2002 Plan refer to our 2002 Plan as amended and restated, unless context otherwise requires. No additional awards may be granted under the 2002 Plan; however, outstanding awards continue in full effect in accordance with their existing terms.
Share Reserve. 6,771,579 shares of common stock were reserved for issuance under our 2002 Plan. As of March 31, 2018, options to purchase 1,025,120 shares of common stock, at exercise prices ranging from $0.21 to $0.81 per share, or a weighted-average exercise price of $0.62 per share, were outstanding under our 2002 Plan.
Administration. Our board of directors or our compensation committee, collectively the plan administrator, administers our 2002 Plan. The 2002 Plan was administered by the board of directors or a committee of the board of directors of Tenable, Inc. prior to our assumption of the 2002 Plan in December 2015. The plan administrator has full authority to (1) construe and interpret all provisions of the 2002 Plan and agreements thereunder, (2) determine the fair market value of our common stock, (3) select eligible participants, (4) determine the number of shares of our common stock covered by awards, (5) accelerate the time at which an award may be exercisable, transferable or nonforfeitable, (6) determine whether and under what circumstances an option may be settled in cash, shares of common stock or other property, (7) amend, cancel, extend, renew, accept the surrender of, modify or accelerate the vesting of or the lapse of restrictions on all or any portion of an outstanding award or reduce the exercise price of an option, (8) prescribe form award agreements, adopt policies and procedures regarding the exercise of awards, adopt, amend and rescind policies and procedures pertaining the administration of our 2002 Plan and (9) make all other determinations necessary or advisable for administration of our 2002 Plan.
Types of Awards. Our 2002 Plan provided for the grant of incentive stock options and nonstatutory stock options to purchase shares of our common stock, stock bonus awards, restricted stock awards and stock appreciation rights to employees, members of our board of directors and consultants.
123
Table of Contents
Options. Options expire at the time determined by the plan administrator, but in the case of incentive stock options, no more than ten years after they are granted, and generally expire earlier if the optionee’s service terminates.
Changes in Capitalization. In the event of any subdivision or consolidation of shares or other capital readjustment, the payment of a stock dividend, or other increase or reduction of the number of shares of our common stock outstanding, without receiving consideration therefore in money, services or property, then the number, class and per share price of shares of our common stock subject to outstanding awards will be appropriately and proportionately adjusted.
Merger, Consolidation or Asset Sale. If our company is merged or consolidated with another entity or sells or otherwise disposes of substantially all of its assets while awards remain outstanding under the 2002 Plan, unless provisions are made in connection with such transaction for the continuance of the 2002 Plan and/or the assumption or substitution of such awards with new awards covering the stock of the successor company, or parent or subsidiary thereof, with appropriate adjustments as to the number and kind of shares and prices, then all outstanding awards which have not been continued, assumed or for which a substituted award has not been granted will, whether or not vested or then exercisable, terminate immediately as of the effective date of any such merger, consolidation or sale.
Transferability. A participant generally may not transfer stock awards under our 2002 Plan other than by will, the laws of descent and distribution, or as otherwise provided under our 2002 Plan or an award agreement.
Plan Amendment or Termination. Our board of directors has the authority to amend our 2002 Plan, provided that such action is approved by our stockholders to the extent stockholder approval is necessary and that such action does not adversely affect the existing rights of any participant without such participant’s consent.
2018 Employee Stock Purchase Plan
In June 2018 our board of directors adopted, and in , 2018 our stockholders approved, our 2018 Employee Stock Purchase Plan, or our 2018 ESPP. The 2018 ESPP will become effective immediately upon the execution of the underwriting agreement related to this offering. The purpose of the ESPP is to secure the services of new employees, to retain the services of existing employees and to provide incentives for such individuals to exert maximum efforts toward our success and that of our affiliates. The ESPP is intended to qualify as an “employee stock purchase plan” within the meaning of Section 423 of Internal Revenue Code of 1986, as amended, or the Code, for U.S. employees. In addition, the ESPP authorizes grants of purchase rights that do not comply with Section 423 of the Code under a separate non-423 component. In particular, where such purchase rights are granted to employees who are employed or located outside the United States, our board of directors may adopt rules that are beyond the scope of Section 423 of the Code.
Share Reserve. The maximum number of shares of our common stock that may be issued under our 2018 ESPP is 4,000,000 shares. Additionally, the number of shares of our common stock reserved for issuance under our 2018 ESPP will automatically increase on January 1 of each year, beginning on January 1, 2019 (assuming the 2018 ESPP becomes effective before such date) and continuing through and including January 1, 2028, by the lesser of (1) 1.5% of the total number of shares of our common stock outstanding on December 31 of the preceding calendar year, (2) 8,000,000 shares of our common stock or (3) such lesser number of shares of common stock as determined by our board of directors. Shares subject to purchase rights granted under our 2018 ESPP that terminate without having been exercised in full will not reduce the number of shares available for issuance under our 2018 ESPP. As of the date hereof, no shares of our common stock have been purchased under the ESPP.
Administration. Our board of directors, or a duly authorized committee thereof, will administer our 2018 ESPP. Our board of directors has delegated its authority to administer our 2018 ESPP to our compensation committee under the terms of the compensation committee’s charter.
124
Table of Contents
Limitations. Our employees, including executive officers, and the employees of any of our designated affiliates will be eligible to participate in our 2018 ESPP, provided they may have to satisfy one or more of the following service requirements before participating in our 2018 ESPP, as determined by the administrator: (1) customary employment with us or one of our affiliates for more than 20 hours per week and five or more months per calendar year or (2) continuous employment with us or one of our affiliates for a minimum period of time, not to exceed two years, prior to the first date of an offering. An employee may not be granted rights to purchase stock under our 2018 ESPP (1) if such employee immediately after the grant would own stock possessing 5% or more of the total combined voting power or value of all classes of our common stock or (2) to the extent that such rights would accrue at a rate that exceeds $25,000 worth of our stock for each calendar year that the rights remain outstanding.
The administrator may specify offerings with a duration of not more than 27 months, and may specify one or more shorter purchase periods within each offering. Each offering will have one or more purchase dates on which shares of our common stock will be purchased for the employees who are participating in the offering. The administrator, in its discretion, will determine the terms of offerings under our 2018 ESPP. A participant may not transfer purchase rights under our 2018 ESPP other than by will, the laws of descent and distribution or as otherwise provided under our 2018 ESPP.
Payroll Deductions. Our 2018 ESPP permits participants to purchase shares of our common stock through payroll deductions up to 15% of their earnings. Unless otherwise determined by the administrator, the purchase price of the shares will be 85% of the lower of the fair market value of our common stock on the first day of an offering or on the date of purchase. Participants may end their participation at any time during an offering and will be paid their accrued contributions that have not yet been used to purchase shares. Participation ends automatically upon termination of employment with us.
Corporate Transactions. In the event of certain specified significant corporate transactions, such as a merger or change in control, a successor corporation may assume, continue or substitute each outstanding purchase right. If the successor corporation does not assume, continue or substitute for the outstanding purchase rights, the offering in progress will be shortened and a new exercise date will be set. The participants’ purchase rights will be exercised on the new exercise date and such purchase rights will terminate immediately thereafter.
Amendment and Termination. Our board of directors has the authority to amend, suspend or terminate our 2018 ESPP, at any time and for any reason, provided certain types of amendments will require the approval of our stockholders. Our 2018 ESPP will remain in effect until terminated by our board of directors in accordance with the terms of our 2018 ESPP.
Limitations on Liability and Indemnification Matters
Upon the closing of this offering, our amended and restated certificate of incorporation will contain provisions that limit the liability of our current and former directors for monetary damages to the fullest extent permitted by Delaware law. Delaware law provides that directors of a corporation will not be personally liable for monetary damages for any breach of fiduciary duties as directors, except liability for:
| • | any breach of the director’s duty of loyalty to the corporation or its stockholders; |
| • | any act or omission not in good faith or that involves intentional misconduct or a knowing violation of law; |
| • | unlawful payments of dividends or unlawful stock repurchases or redemptions as provided in Section 174 of the Delaware General Corporation Law; or |
| • | any transaction from which the director derived an improper personal benefit. |
This limitation of liability does not apply to liabilities arising under federal securities laws and does not affect the availability of equitable remedies such as injunctive relief or rescission.
125
Table of Contents
Our amended and restated bylaws to be in effect upon the closing of this offering will provide that we are required to indemnify our directors and executive officers to the fullest extent permitted by Delaware law. Our amended and restated bylaws will also provide that, upon satisfaction of certain conditions, we are required to advance expenses incurred by a director or executive officer in advance of the final disposition of any action or proceeding, and permit us to secure insurance on behalf of any officer, director, employee or other agent for any liability arising out of his or her actions in that capacity regardless of whether we would otherwise be permitted to indemnify him or her under the provisions of Delaware law. Our amended and restated bylaws will also provide our board of directors with discretion to indemnify our other officers and employees when determined appropriate by our board of directors. We have entered and expect to continue to enter into agreements to indemnify our directors, executive officers and other employees as determined by the board of directors. With certain exceptions, these agreements provide for indemnification for related expenses, including, among other things, attorneys’ fees, judgments, fines and settlement amounts incurred by any of these individuals in any action or proceeding. We believe that these provisions and agreements are necessary to attract and retain qualified persons as directors and officers. We also maintain customary directors’ and officers’ liability insurance.
The limitation of liability and indemnification provisions in our amended and restated certificate of incorporation and amended and restated bylaws to be in effect upon the closing of this offering may discourage stockholders from bringing a lawsuit against our directors for breach of their fiduciary duty. They may also reduce the likelihood of derivative litigation against our directors and officers, even though an action, if successful, might benefit us and other stockholders. Further, a stockholder’s investment may be adversely affected to the extent that we pay the costs of settlement and damage awards against directors and officers as required by these indemnification provisions. At present, there is no pending litigation or proceeding involving any of our directors, officers or employees for which indemnification is sought, and we are not aware of any threatened litigation that may result in claims for indemnification.
Rule 10b5-1 Sales Plans
Our directors and executive officers may adopt written plans, known as Rule 10b5-1 plans, in which they will contract with a broker to buy or sell shares of our common stock on a periodic basis. Under a Rule 10b5-1 plan, a broker executes trades pursuant to parameters established by the director or executive officer when entering into the plan, without further direction from them. The director or executive officer may amend a Rule 10b5-1 plan in some circumstances and may terminate a plan at any time. Our directors and executive officers also may buy or sell additional shares outside of a Rule 10b5-1 plan when they are not in possession of material nonpublic information subject to compliance with the terms of our insider trading policy. Prior to 180 days after the date of this offering, subject to early termination, the sale of any shares under such plan would be subject to the lock-up agreement that the director or executive officer has entered into with the underwriters.
Emerging Growth Company Status
As an emerging growth company we will be exempt from certain requirements related to executive compensation, including the requirements to hold a nonbinding advisory vote on executive compensation and to provide information relating to the ratio of total compensation of our President and Chief Executive Officer to the median of the annual total compensation of all of our employees, each as required by the Investor Protection and Securities Reform Act of 2010, which is part of the Dodd-Frank Wall Street Reform and Consumer Protection Act.
126
Table of Contents
CERTAIN RELATIONSHIPS AND RELATED PARTY TRANSACTIONS
The following is a summary of transactions since January 1, 2015 to which we have been a participant in which the amount involved exceeded or will exceed $120,000, and in which any of our then directors, executive officers or holders of more than 5% of any class of our capital stock at the time of such transaction, or any members of their immediate family, had or will have a direct or indirect material interest, other than compensation arrangements which are described under the section titled ‘‘Executive Compensation.’’
Sale of Series B Redeemable Convertible Preferred Stock and Stock Repurchases
In December 2015, we sold an aggregate of 39,538,354 shares of our Series B redeemable convertible preferred stock at a price of $5.81735 per share to entities associated with Accel and Insight Venture Partners, who are each beneficial owners of more than 5% of our capital stock, for aggregate proceeds of approximately $230.0 million, or our Series B Offering.
The following table summarizes the purchases in our Series B Offering by entities associated with Accel and Insight Venture Partners:
| Purchaser |
Shares of Series B Preferred Stock |
Total Purchase Price |
||||||
| Entities affiliated with Accel(1) |
11,173,477 | $ | 65,000,026 | |||||
| Entities affiliated with Insight Venture Partners(2) |
28,364,877 | 165,008,417 | ||||||
| (1) | Affiliates of Accel whose shares are aggregated for purposes of reporting share ownership information are: Accel Growth Fund III L.P., Accel Growth Fund III Strategic Partners L.P., Accel Growth Fund Investors 2014 L.L.C., Accel Investors 2013 L.L.C., Accel XI L.P. and Accel XI Strategic Partners L.P. |
| (2) | Affiliates of Insight Venture Partners whose shares are aggregated for purposes of reporting share ownership information are: Insight Venture Partners (Cayman) IX, L.P., Insight Venture Partners (Delaware) IX, L.P., Insight Venture Partners Growth-Buyout Coinvestment Fund, L.P., Insight Venture Partners Growth-Buyout Coinvestment Fund (B), L.P., Insight Venture Partners Growth-Buyout Coinvestment Fund (Cayman), L.P., Insight Venture Partners Growth-Buyout Coinvestment Fund (Delaware), L.P., Insight Venture Partners IX, L.P. and Insight Venture Partners IX (Co-Investors), L.P. |
We used the proceeds from the Series B Offering to repurchase shares of our common stock held by certain investors of our predecessor entity Tenable, Inc., including certain of our executive officers, directors and beneficial owners of more than 5% of our capital stock. We repurchased 9,551,150 shares and 21,503,622 shares from individuals and entities associated with John C. Huffard Jr. and Ronald Gula, respectively, at a price of $5.81735 per share.
Consulting Agreement with Capellas Partners
On August 31, 2015, we entered into a consulting agreement with Capellas Partners, LLC. At that time, Michael Capellas served as a director of our predecessor entity, Tenable, Inc., as well as chief executive officer of Capellas Partners. Pursuant to a statement of work issued under the consulting agreement, Capellas Partners received a fee of $2.0 million for its role in identifying investors, negotiating and closing our Series B Offering. Capellas Partners was also reimbursed for certain expenses pursuant to the terms of this statement of work in the amount of $7,250. Upon completion of the Series B Offering, the statement of work automatically terminated. In accordance with an additional statement of work issued in January 2016, Capellas Partners also received a fee of $250,000 for providing various advisory services. Capellas Partners was also reimbursed for certain expenses pursuant to the terms of this statement of work in the amount of $2,908.
127
Table of Contents
Employment Arrangements with Messrs. Schonberger and Vintz
We have employed Ron Schonberger, the brother of our President, Chief Executive Officer and Chairman Amit Yoran, as our Associate General Counsel since October 2017, and Frank Vintz, the brother of our Chief Financial Officer Stephen A. Vintz, as our Manager of Customer Success since March 2017. We expect that total compensation for each of Mr. Schonberger and Mr. Frank Vintz, including salary, bonus and commissions, as applicable, will exceed $120,000 in 2018.
Investors’ Rights, Management Rights, Voting and Co-Sale Agreements
In connection with our preferred stock sales, we entered into investors’ rights, management rights, voting and right of first refusal and co-sale agreements containing registration rights, information rights, voting rights and rights of first refusal, among other things, with certain holders of our preferred and common stock, including entities affiliated with Insight Venture Partners and Accel, as well as Ronald Gula, Renaud Deraison and John Huffard Jr., or trusts for which such persons or their immediate family members serve as trustees. Each of these persons and entities is a beneficial owner of more than 5% of our common stock. Mr. Huffard is also an executive officer and director of our company. The voting agreement entered into in connection with our Series B Offering entitles Accel and Insight Venture Partners to each designate two directors to our board. Each of these agreements will terminate upon the closing of this offering, except that the registration rights granted under our investors’ rights agreement, as more fully described in “Description of Capital Stock—Registration Rights,” will survive this offering.
Indemnification Agreements
We plan to enter into indemnification agreements with each of our directors and executive officers in connection with this offering. The indemnification agreements and our amended and restated bylaws, each to be in effect upon the closing of this offering, will require us to indemnify our directors and executive officers to the fullest extent permitted by Delaware law. For more information regarding these agreements, see “Executive Compensation—Limitations on Liability and Indemnification Matters.”
Participation in this Offering
, each a member of our board of directors, have indicated an interest in purchasing, directly or through associated entities, up to an aggregate of approximately $ million of shares of our common stock in this offering (or an aggregate of shares based on the midpoint of the price range set forth on the cover page of this prospectus) at the initial public offering price. To the extent these affiliates purchase any such shares from us, the number of shares to be sold to the underwriters will accordingly be reduced. Because these indications of interest are not binding agreements or commitments to purchase, the underwriters could determine to sell more, less or no shares to any of these potential investors and any of these potential investors could determine to purchase more, less or no shares in this offering. The underwriters will receive the same discount from any shares sold to these potential investors as they will from any other shares sold to the public in this offering. Any shares purchased by such potential investors will be subject to lock-up restrictions described in “Shares Eligible for Future Sale.”
Directed Share Program
Furthermore, at our request, the underwriters have reserved up to shares of common stock offered by this prospectus, or up to 5% of the shares of common stock offered by this prospectus, for sale, at the initial public offering price, to friends, professional contacts and family members of executive officers and directors. The directed share program will not limit the ability of such persons to purchase more than $120,000 in value of our common stock. We do not currently know the extent to which these related persons will participate in the directed share program, if at all.
Related Person Transaction Policy
Prior to this offering, we have not had a formal policy regarding approval of transactions with related parties. Prior to the closing of this offering, we expect to adopt a written related person transaction policy that
128
Table of Contents
sets forth our procedures for the identification, review, consideration and approval or ratification of related person transactions. The policy will become effective immediately upon the execution of the underwriting agreement for this offering. For purposes of our policy only, a related person transaction is a transaction, arrangement or relationship, or any series of similar transactions, arrangements or relationships, in which we and any related person are, were or will be participants and in which the amount involved exceeds $120,000. Transactions involving compensation for services provided to us as an employee or director are not covered by this policy. A related person is any executive officer, director or beneficial owner of more than 5% of any class of our voting securities, including any of their immediate family members and any entity owned or controlled by such persons.
Under the policy, if a transaction has been identified as a related person transaction, including any transaction that was not a related person transaction when originally consummated or any transaction that was not initially identified as a related person transaction prior to consummation, our management must present information regarding the related person transaction to our audit committee, or, if audit committee approval would be inappropriate, to another independent body of our board of directors, for review, consideration and approval or ratification. The presentation must include a description of, among other things, the material facts, the interests, direct and indirect, of the related persons, the benefits to us of the transaction and whether the transaction is on terms that are comparable to the terms available to or from, as the case may be, an unrelated third party or to or from employees generally. Under the policy, we will collect information that we deem reasonably necessary from each director, executive officer and, to the extent feasible, significant stockholder to enable us to identify any existing or potential related-person transactions and to effectuate the terms of the policy.
In addition, under our Code of Conduct, which we intend to adopt in connection with this offering, our employees and directors have an affirmative responsibility to disclose any transaction or relationship that reasonably could be expected to give rise to a conflict of interest.
In considering related person transactions, our audit committee, or other independent body of our board of directors, will take into account the relevant available facts and circumstances including, but not limited to:
| • | the risks, costs and benefits to us; |
| • | the impact on a director’s independence in the event that the related person is a director, immediate family member of a director or an entity with which a director is affiliated; |
| • | the availability of other sources for comparable services or products; and |
| • | the terms available to or from, as the case may be, unrelated third parties or to or from employees generally. |
The policy requires that, in determining whether to approve, ratify or reject a related person transaction, our audit committee, or other independent body of our board of directors, must consider, in light of known circumstances, whether the transaction is in, or is not inconsistent with, our best interests and those of our stockholders, as our audit committee, or other independent body of our board of directors, determines in the good faith exercise of its discretion.
All of the transactions described above were entered into prior to the adoption of the written policy, but all were approved by our board of directors considering similar factors to those described above.
129
Table of Contents
The following table sets forth the beneficial ownership of our common stock as of June 1, 2018 and as adjusted to reflect the sale of common stock offered by us in this offering, for:
| • | each person, or group of affiliated persons, who is known by us to beneficially own more than 5% of our common stock; |
| • | each of our named executive officers; |
| • | each of our directors; and |
| • | all of our executive officers and directors as a group. |
The percentage ownership information shown in the table prior to this offering is based upon 80,277,109 shares of common stock outstanding as of June 1, 2018, after giving effect to the conversion of all outstanding shares of preferred stock into an aggregate of 55,385,854 shares of our common stock. The percentage ownership information shown in the table after this offering is based upon shares of common stock outstanding as of June 1, 2018, assuming the sale of shares of common stock by us in the offering and no exercise of the underwriters’ over-allotment option.
We have determined beneficial ownership in accordance with the rules of the SEC. These rules generally attribute beneficial ownership of securities to persons who possess sole or shared voting power or investment power with respect to those securities. In addition, the rules include shares of common stock issuable pursuant to the exercise of stock options or warrants that are either immediately exercisable or exercisable on or before July 31, 2018, which is 60 days after June 1, 2018. These shares are deemed to be outstanding and beneficially owned by the person holding those options or warrants for the purpose of computing the percentage ownership of that person, but they are not treated as outstanding for the purpose of computing the percentage ownership of any other person. The information contained in the following table is not necessarily indicative of beneficial ownership for any other purpose, and the inclusion of any shares in the table does not constitute an admission of beneficial ownership of those shares. Unless otherwise indicated, the persons or entities identified in this table have sole voting and investment power with respect to all shares shown as beneficially owned by them, subject to applicable community property laws.
130
Table of Contents
Except as otherwise noted below, the address for persons listed in the table is c/o Tenable Holdings, Inc., 7021 Columbia Gateway Drive, Suite 500, Columbia, Maryland 21046.
| Number of Shares Beneficially Owned |
Percentage of Shares Beneficially Owned |
|||||||||||
| Name of Beneficial Owner |
Prior to the Offering |
After the Offering |
||||||||||
| 5% or greater stockholders: |
| |||||||||||
| Entities affiliated with Insight Venture Partners(1) |
28,364,877 | 35.3 | % | |||||||||
| Entities affiliated with Accel(2) |
27,598,537 | 34.4 | ||||||||||
| Ronald Gula(3) |
9,215,838 | 11.5 | ||||||||||
| John C. Huffard Jr.(4) |
4,093,350 | 5.1 | ||||||||||
| Named executive officers and directors: |
||||||||||||
| Amit Y. Yoran(5) |
2,647,506 | 3.3 | ||||||||||
| Stephen A. Vintz(6) |
801,750 | 1.0 | ||||||||||
| John G. Negron(7) |
193,749 | * | ||||||||||
| Stephen A. Riddick(7) |
156,250 | * | ||||||||||
| Arthur W. Coviello, Jr. |
— | — | ||||||||||
| Kimberly L. Hammonds |
— | — | ||||||||||
| Jerry M. Kennelly |
— | — | ||||||||||
| Ping Li(2) |
27,598,537 | 34.4 | ||||||||||
| A. Brooke Seawell |
— | — | ||||||||||
| Richard M. Wells |
— | — | ||||||||||
| All current executive officers and directors as a group (11 persons)(8) |
35,500,142 | 41.2 | ||||||||||
| * | Represents beneficial ownership of less than 1%. |
| (1) | Consists of (a) 8,739,118 shares of common stock issuable upon conversion of the Series B redeemable convertible preferred stock held by Insight Venture Partners IX, L.P., or IVP IX, (b) 4,342,255 shares of common stock issuable upon conversion of the Series B redeemable convertible preferred stock held by Insight Venture Partners (Cayman) IX, L.P., or IVP (Cayman) IX, (c) 925,908 shares of common stock issuable upon conversion of the Series B redeemable convertible preferred stock held by Insight Venture Partners (Delaware) IX, L.P., or IVP (Delaware) IX, (d) 174,441 shares of common stock issuable upon conversion of the Series B redeemable convertible preferred stock held by Insight Venture Partners IX (Co-Investors), L.P., or IVP IX (Co-Investors), and, collectively with IVP IX, IVP (Cayman) IX and IVP (Delaware) IX, the “IVP IX Funds”, (e) 4,107,504 shares of common stock issuable upon conversion of the Series B redeemable convertible preferred stock held by Insight Venture Partners Growth-Buyout Coinvestment Fund, L.P., or IVP Coinvestment, (f) 3,302,193 shares of common stock issuable upon conversion of the Series B redeemable convertible preferred stock held by Insight Venture Partners Growth-Buyout Coinvestment Fund (Cayman), L.P., or IVP Coinvestment (Cayman), (g) 3,036,378 shares of common stock issuable upon conversion of the Series B redeemable convertible preferred stock held by Insight Venture Partners Growth-Buyout Coinvestment Fund (Delaware), L.P., or IVP Coinvestment (Delaware), and (h) 3,737,080 shares of common stock issuable upon conversion of the Series B redeemable convertible preferred stock held by Insight Venture Partners Growth-Buyout Coinvestment Fund (B), L.P., or IVP Coinvestment (B), and, collectively with IVP Coinvestment, IVP Coinvestment (Cayman) and IVP Coinvestment (Delaware), the “IVP Coinvestment Funds” and, together with the IVP IX Funds, the “IVP Funds.” Insight Venture Associates IX, Ltd., or IVA IX Ltd., is the general partner of Insight Venture Associates IX, L.P., which is the general partner of each of the IVP IX Funds. Insight Venture Associates Growth-Buyout Coinvestment, Ltd., or IVA Coinvestment Ltd., is the general partner of Insight Venture Associates Growth-Buyout Coinvestment, L.P., which is the general partner of each of the IVP Coinvestment Funds. Insight Holdings Group, LLC, or Insight Holdings, is the sole shareholder of each of IVA IX Ltd. and IVA Coinvestment Ltd. Each of Jeffrey L. Horing, Deven Parekh, Peter Sobiloff, Jeffrey |
131
Table of Contents
| Lieberman and Michael Triplett is a member of the board of managers of Insight Holdings and as such may be deemed to have shared voting and dispositive power over the shares held by each of the IVP Funds. Richard Wells is a Managing Director at Insight Venture Management, LLC, an entity affiliated with the IVP Funds, but does not have voting and dispositive power over the shares held by IVP Funds. |
The principal business address for all entities and individuals affiliated with Insight Venture Partners is c/o Insight Venture Partners, 1114 Avenue of the Americas, 36th Floor, New York, New York, 10036.
| (2) | Consists of (a) 417,636 shares of common stock held by Accel Growth Fund II L.P., or AGF II, (b) 30,240 shares of common stock held by Accel Growth Fund II Strategic Partners L.P., or AGF II Strategic, (c) 79,967 shares of common stock held by Accel Growth Fund III L.P., or AGF III, (d) 3,775 shares of common stock held by Accel Growth Fund III Strategic Partners L.P., or AGF III Strategic, (e) 40,644 shares of common stock held by Accel Growth Fund Investors 2012 L.L.C., or AGFI 2012, (f) 5,298 shares of common stock held by Accel Growth Fund Investors 2014 L.L.C., or AGFI 2014, (g) 13,548,060 shares of common stock issuable upon conversion of the Series A redeemable convertible preferred stock held by AGF II, (h) 980,940 shares of common stock issuable upon conversion of the Series A redeemable convertible preferred stock held by AGF II Strategic, (i) 1,318,500 shares of common stock issuable upon conversion of the Series A redeemable convertible preferred stock held by AGFI 2012, (j) 7,719,155 shares of common stock issuable upon conversion of the Series B redeemable convertible preferred stock held by AGF III, (k) 364,427 shares of common stock issuable upon conversion of the Series B redeemable convertible preferred stock held by AGF III Strategic, (l) 511,401 shares of common stock issuable upon conversion of the Series B redeemable convertible preferred stock held by AGFI 2014, (m) 2,182,696 shares of common stock issuable upon conversion of the Series B redeemable convertible preferred stock held by Accel XI L.P., or Accel XI, (n) 163,992 shares of common stock issuable upon conversion of the Series B redeemable convertible preferred stock held by Accel XI Strategic Partners L.P., or Accel XI Strategic, and (o) 231,806 shares of common stock issuable upon conversion of the Series B redeemable convertible preferred stock held by Accel Investors 2013 L.L.C., or AI 2013. Accel Growth Fund II Associates L.L.C., or AGF II Associates, is the general partner of AGF II and AGF II Strategic and has the sole voting and investment power. Andrew G. Braccia, Sameer K. Gandhi, Ping Li, one of our directors, Tracy L. Sedlock, Ryan J. Sweeney and Richard P. Wong are the Managing Members of AGF II Associates and AGFI 2012 and share voting and investment powers over such shares. Accel Growth Fund III Associates L.L.C., or AGF III Associates, is the general partner of AGF III and AGF III Strategic and has the sole voting and investment power. Andrew G. Braccia, Sameer K. Gandhi, Ping Li, one of our directors, Tracy L. Sedlock, Ryan J. Sweeney and Richard P. Wong are the Managing Members of AGF III Associates and AGFI 2014 and share voting and investment powers over such shares. Accel XI Associates L.L.C., or Accel XI Associates, is the General Partner of Accel XI and Accel XI Strategic and has the sole voting and investment power. Andrew G. Braccia, Sameer K. Gandhi, Ping Li, one of our directors, Tracy L. Sedlock and Richard P. Wong are the Managing Members of Accel XI Associates and AI 2013 and share voting and investment powers over such shares. |
The principal business address for all entities and individuals affiliated with Accel is 500 University Avenue, Palo Alto, California 94301.
| (3) | Consists of (a) 1,960,775 shares of common stock held by Mr. Gula, (b) 398,446 shares of common stock held by Mr. Gula’s spouse, Cynthia Y. Gula, (c) 637,887 shares of common stock held by The Ronald J. Gula 2015 Grantor Retained Annuity Trust #4 dated March 31, 2015, (d) 108,730 shares of common stock held by The Cynthia Y. Gula 2015 Grantor Retained Annuity Trust #2 dated March 31, 2015, (e) 2,000,000 shares of common stock held by Cynthia Y. Gula, as Trustee of the Ronald J. Gula 2017 Grantor Retained Annuity Trust dated as of October 19, 2017 and (f) 4,110,000 shares of common stock held by Ronald J. Gula, as Trustee of the Cynthia Y. Gula 2016 Family Trust dated as of November 7, 2016. The address for Mr. Gula is c/o Gula Tech Adventures, P.O. Box 335, Woodstock, Maryland 21163. |
| (4) | Consists of (a) 82,260 shares of common stock held by Mr. Huffard’s spouse, Mary Kathryn Braden Huffard, (b) 3,116,729 shares of common stock held by Mary Kathryn Braden Huffard and Jonathan M. Forster, as Trustees of The Three Suns Exempt Irrevocable Trust U/T/A dated March 2, 2012 and |
132
Table of Contents
| (c) 894,361 shares of common stock held by Mary Kathryn Braden Huffard and Jonathan M. Forster, as Trustees of The Three Suns Non-Exempt Irrevocable Trust U/T/A dated March 2, 2012. |
| (5) | Consists of (a) 1,582,685 shares of restricted common stock, 593,507 of which will have vested within 60 days of June 1, 2018, and (b) 1,064,821 shares of common stock issuable upon the exercise of outstanding options exercisable within 60 days of June 1, 2018. |
| (6) | Consists of (a) 505,500 shares of common stock and (b) 305,250 shares of common stock issuable upon the exercise of outstanding options exercisable within 60 days of June 1, 2018. |
| (7) | Consists of shares of common stock issuable upon the exercise of outstanding options exercisable within 60 days of June 1, 2018. |
| (8) | Consists of (a) 33,780,072 shares of common stock and (b) 1,720,070 shares of common stock issuable upon the exercise of outstanding options exercisable within 60 days of June 1, 2018. |
, each a member of our board of directors, have indicated an interest in purchasing, directly or through associated entities, up to an aggregate of approximately $ million of shares of our common stock in this offering (or an aggregate of shares based on the midpoint of the price range set forth on the cover page of this prospectus) at the initial public offering price. To the extent these affiliates purchase any such shares from us, the number of shares to be sold to the underwriters will accordingly be reduced. Because these indications of interest are not binding agreements or commitments to purchase, the underwriters could determine to sell more, less or no shares to any of these potential investors and any of these potential investors could determine to purchase more, less or no shares in this offering. These indications of interest, however, are not binding agreements or commitments to purchase, the foregoing table and related footnotes do not reflect the potential purchase of any shares in this offering by entities associated with these potential investors. If any shares are purchased by such entities, the number of shares of our capital stock beneficially owned by the entities affiliated with these potential investors after this offering and the percentage of our capital stock beneficially owned by the entities affiliated with these potential investors after this offering will differ from that set forth in the foregoing table.
133
Table of Contents
The following description of our capital stock, certain provisions of our amended and restated certificate of incorporation and amended and restated bylaws, as each will be in effect upon the closing of this offering, and certain provisions of Delaware law are summaries. You should also refer to the amended and restated certificate of incorporation and the amended and restated bylaws, which are filed as exhibits to the registration statement of which this prospectus is a part. We refer in this section to our amended and restated certificate of incorporation and amended and restated bylaws that we intend to adopt in connection with this offering as our certificate of incorporation and bylaws, respectively.
General
Upon the completion of this offering, our amended and restated certificate of incorporation will authorize us to issue up to shares of common stock, $0.01 par value per share, and shares of preferred stock, $0.01 par value per share, all of which shares of preferred stock will be undesignated. Our board of directors may establish the rights and preferences of the preferred stock from time to time.
As of March 31, 2018, there were outstanding 24,793,600 shares of our common stock, 15,847,500 of our Series A redeemable convertible preferred stock and 39,538,354 shares of our Series B redeemable convertible preferred stock. After giving effect to the conversion of all outstanding shares of our preferred stock into 55,385,854 shares of common stock in connection with the closing of this offering, there would have been 80,179,454 shares of common stock issued and outstanding, held by 127 stockholders of record.
Common Stock
Voting Rights
Each holder of our common stock is entitled to one vote for each share on all matters submitted to a vote of the stockholders, including the election of directors. Under our amended and restated certificate of incorporation and amended and restated bylaws, our stockholders will not have cumulative voting rights. Because of this, the holders of a majority of the shares of common stock entitled to vote in any election of directors can elect all of the directors standing for election, if they should so choose.
Dividends
Subject to preferences that may be applicable to any then-outstanding preferred stock, holders of common stock are entitled to receive ratably those dividends, if any, as may be declared from time to time by the board of directors out of legally available funds.
Liquidation
In the event of our liquidation, dissolution or winding up, holders of common stock will be entitled to share ratably in the net assets legally available for distribution to stockholders after the payment of all of our debts and other liabilities and the satisfaction of any liquidation preference granted to the holders of any then-outstanding shares of preferred stock.
Rights and Preferences
Holders of common stock have no preemptive, conversion or subscription rights and there are no redemption or sinking fund provisions applicable to the common stock. The rights, preferences and privileges of the holders of common stock are subject to, and may be adversely affected by, the rights of the holders of shares of any series of preferred stock that we may designate in the future.
134
Table of Contents
Stock Options
As of March 31, 2018, options to purchase an aggregate of 15,217,352 shares of common stock were outstanding at a weighted-average exercise price of $4.93 per share. For additional information regarding the terms of our equity incentive plans, see “Executive Compensation—Equity Incentive Plans.”
Restricted Stock
As of March 31, 2018, we had 1,582,685 shares of restricted common stock outstanding granted pursuant to our 2016 Plan. For additional information regarding the terms of our 2016 Plan, see “Executive Compensation—Equity Incentive Plans—2016 Stock Incentive Plan.”
Preferred Stock
Upon the closing of this offering, our board of directors may, without further action by our stockholders, fix the rights, preferences, privileges and restrictions of up to an aggregate of shares of preferred stock in one or more series and authorize their issuance. These rights, preferences and privileges could include dividend rights, conversion rights, voting rights, terms of redemption, liquidation preferences, sinking fund terms and the number of shares constituting any series or the designation of such series, any or all of which may be greater than the rights of our common stock. The issuance of our preferred stock could adversely affect the voting power of holders of our common stock and the likelihood that such holders will receive dividend payments and payments upon liquidation. In addition, the issuance of preferred stock could have the effect of delaying, deterring or preventing a change of control or other corporate action. Upon the closing of this offering, no shares of preferred stock will be outstanding, and we have no present plan to issue any shares of preferred stock.
Registration Rights
After the closing of this offering, certain holders of the common stock, including holders of the shares of our common stock that will be issued upon conversion of our preferred stock in connection with this offering, will be entitled to certain rights with respect to registration of such shares under the Securities Act pursuant to the terms of an investors’ rights agreement. These shares are collectively referred to herein as registrable securities.
The investors’ rights agreement provides the holders of registrable securities with demand, piggyback and S-3 registration rights as described more fully below. As of March 31, 2018, after giving effect to the conversion of all outstanding shares of preferred stock into shares of our common stock in connection with the closing of the offering, there would have been an aggregate of 70,927,042 registrable securities that were entitled to registration rights.
Demand Registration Rights
At any time beginning 180 days after the effective date of the registration statement of which this prospectus forms a part, the holders of not less than 60% of the registrable securities then outstanding have the right to make a demand that we file a registration statement under the Securities Act covering registrable securities then outstanding having an aggregate offering price of at least $30 million, subject to specified exceptions.
Piggyback Registration Rights
If we register any securities for public sale, the holders of our registrable securities then outstanding will each be entitled to notice of the registration and will have the right to include their shares in the registration statement.
The underwriters of any underwritten offering will have the right to limit the number of shares having registration rights to be included in the registration statement, but not below 20% of the total number of securities included in such registration.
135
Table of Contents
Registration on Form S-3
If we are eligible to file a registration statement on Form S-3, the holders of our registrable securities have the right to demand that we file registration statements on Form S-3; provided, that the aggregate price to the public of the securities to be sold under the registration statement is at least $10 million. The right to have such shares registered on Form S-3 is further subject to other specified conditions and limitations.
Expenses of Registration
We will pay all expenses relating to any demand, piggyback or Form S-3 registration, other than underwriting discounts and commissions, subject to specified conditions and limitations.
Termination of Registration Rights
The registration rights will terminate five years following the closing of this offering and, with respect to any particular stockholder, when such stockholder is able to sell all of his, her or its shares during a 90-day period pursuant to Rule 144 under the Securities Act.
Anti-Takeover Provisions
Section 203 of the Delaware General Corporation Law
We are subject to Section 203 of the Delaware General Corporation Law, or Section 203, which prohibits a Delaware corporation from engaging in any business combination with any interested stockholder for a period of three years after the date that such stockholder became an interested stockholder, with the following exceptions:
| • | before such date, the board of directors of the corporation approved either the business combination or the transaction that resulted in the stockholder becoming an interested stockholder; |
| • | upon completion of the transaction that resulted in the stockholder becoming an interested stockholder, the interested stockholder owned at least 85% of the voting stock of the corporation outstanding at the time the transaction began, excluding for purposes of determining the voting stock outstanding (but not the outstanding voting stock owned by the interested stockholder) those shares owned (1) by persons who are directors and also officers and (2) employee stock plans in which employee participants do not have the right to determine confidentially whether shares held subject to the plan will be tendered in a tender or exchange offer; or |
| • | on or after such date, the business combination is approved by the board of directors and authorized at an annual or special meeting of the stockholders, and not by written consent, by the affirmative vote of at least 66 2/3% of the outstanding voting stock that is not owned by the interested stockholder. |
In general, Section 203 defines a “business combination” to include the following:
| • | any merger or consolidation involving the corporation and the interested stockholder; |
| • | any sale, transfer, pledge or other disposition of 10% or more of the assets of the corporation involving the interested stockholder; |
| • | subject to certain exceptions, any transaction that results in the issuance or transfer by the corporation of any stock of the corporation to the interested stockholder; |
| • | any transaction involving the corporation that has the effect of increasing the proportionate share of the stock or any class or series of the corporation beneficially owned by the interested stockholder; or |
| • | the receipt by the interested stockholder of the benefit of any loans, advances, guarantees, pledges or other financial benefits by or through the corporation. |
136
Table of Contents
In general, Section 203 defines an “interested stockholder” as an entity or person who, together with the person’s affiliates and associates, beneficially owns, or within three years prior to the time of determination of interested stockholder status did own, 15% or more of the outstanding voting stock of the corporation.
A Delaware corporation may “opt out” of these provisions with an express provision in its original certificate of incorporation or an express provision in its amended and restated certificate of incorporation or amended and restated bylaws resulting from a stockholders’ amendment approved by at least a majority of the outstanding voting shares. We have not opted out of these provisions. As a result, mergers or other takeover or change in control attempts of us may be discouraged or prevented.
Certificate of Incorporation and Bylaws to be in Effect Upon the Closing of this Offering
Our amended and restated certificate of incorporation to be in effect upon the closing of this offering will provide for our board of directors to be divided into three classes with staggered three-year terms. Only one class of directors will be elected at each annual meeting of our stockholders, with the other classes continuing for the remainder of their respective three-year terms. Because our stockholders do not have cumulative voting rights, stockholders holding a majority of the shares of our common stock outstanding will be able to elect all of our directors. Our amended and restated certificate of incorporation and our amended and restated bylaws to be effective upon the closing of this offering will also provide that directors may be removed by the stockholders only for cause upon the vote of 66 2/3% of our outstanding common stock. Furthermore, the authorized number of directors may be changed only by resolution of the board of directors, and vacancies and newly created directorships on the board of directors may, except as otherwise required by law or determined by the board, only be filled by a majority vote of the directors then serving on the board, even though less than a quorum.
Our amended and restated certificate of incorporation and amended and restated bylaws will also provide that all stockholder actions must be effected at a duly called meeting of stockholders and will eliminate the right of stockholders to act by written consent without a meeting. Our amended and restated bylaws will also provide that only our chairman of the board, chief executive officer or the board of directors pursuant to a resolution adopted by a majority of the total number of authorized directors may call a special meeting of stockholders.
Our amended and restated bylaws will also provide that stockholders seeking to present proposals before a meeting of stockholders or to nominate candidates for election as directors at a meeting of stockholders must provide timely advance notice in writing, and will specify requirements as to the form and content of a stockholder’s notice.
Our amended and restated certificate of incorporation and amended and restated bylaws will provide that the stockholders cannot amend many of the provisions described above except by a vote of 66 2/3% or more of our outstanding common stock.
The combination of these provisions will make it more difficult for our existing stockholders to replace our board of directors as well as for another party to obtain control of us by replacing our board of directors. Since our board of directors has the power to retain and discharge our officers, these provisions could also make it more difficult for existing stockholders or another party to effect a change in management. In addition, the authorization of undesignated preferred stock makes it possible for our board of directors to issue preferred stock with voting or other rights or preferences that could delay or impede the success of any attempt to change our control.
These provisions are intended to facilitate our continued innovation and the risk-taking that it requires, permit us to continue to prioritize our long-term goals rather than short-term results, enhance the likelihood of continued stability in the composition of our board of directors and its policies. These provisions could discourage potential takeover attempts. These provisions are also designed to reduce our vulnerability to an unsolicited acquisition proposal and to discourage certain tactics that may be used in proxy fights. However, such
137
Table of Contents
provisions could have the effect of discouraging others from making tender offers for our shares and may have the effect of deterring hostile takeovers or delaying changes in our control or management. As a consequence, these provisions may also inhibit increases in the market price of our stock that could result from actual or rumored takeover attempts.
Corporate Opportunities
Our amended and restated certificate of incorporation will provide that no officer or director of ours who is also an officer, director, managing director or other employee of Accel or Insight (including any portfolio company thereof) will be liable to us or our stockholders for breach of any fiduciary duty by reason of the fact that any such individual directs a corporate opportunity to any member of Accel or Insight (including any portfolio company thereof), instead of to us, or does not communicate information regarding a corporate opportunity to us that the officer, director, employee, managing director or other affiliate has directed to any member of Accel or Insight (including any portfolio company thereof), unless such corporate opportunity is expressly offered to such officer or director in his or her capacity as an officer or director of our company.
Choice of Forum
Our amended and restated certificate of incorporation will provide that the Court of Chancery of the State of Delaware will be the exclusive forum for: (1) any derivative action or proceeding brought on our behalf; (2) any action asserting a breach of fiduciary duty owed by any director, officer or other employee to us or our stockholders; (3) any action asserting a claim against us or any director or officer or other employee arising pursuant to the Delaware General Corporation Law, our amended and restated certificate of incorporation or amended and restated bylaws; or (4) any action asserting a claim against us or any director or officer or other employee that is governed by the internal affairs doctrine. Our amended and restated certificate of incorporation further provides that the federal district courts of the United States of America will be the exclusive forum for resolving any complaint asserting a cause of action arising under the Securities Act.
Transfer Agent and Registrar
The transfer agent and registrar for our common stock is . The transfer agent’s address is .
Listing
We have applied for listing of our common stock on the Nasdaq Global Market under the symbol “TENB.”
138
Table of Contents
SHARES ELIGIBLE FOR FUTURE SALE
Prior to this offering, no public market existed for our capital stock, and although we expect that our common stock will be approved for listing on the Nasdaq Global Market, we cannot assure investors that there will be an active public market for our common stock following this offering. We cannot predict what effect, if any, sales of our shares in the public market or the availability of shares for sale will have on the market price of our common stock. Future sales of substantial amounts of common stock in the public market, the availability of shares for future sale or the perception that such sales may occur, however, could adversely affect the market price of our common stock and also could adversely affect our future ability to raise capital through the sale of our common stock or other equity-related securities at times and prices we believe appropriate.
Based on our shares outstanding as of March 31, 2018, upon the closing of this offering, shares of our common stock will be outstanding, or shares of common stock if the underwriters exercise their over-allotment option in full.
All of the shares of common stock sold in this offering will be freely tradable without restrictions or further registration under the Securities Act, except for any shares sold to our “affiliates,” as that term is defined under Rule 144 under the Securities Act. The outstanding shares of common stock held by existing stockholders are “restricted securities,” as that term is defined in Rule 144 under the Securities Act. Restricted securities may be sold in the public market only if the offer and sale is registered under the Securities Act or if the offer and sale of those securities qualifies for exemption from registration, including exemptions provided by Rules 144 or 701 promulgated under the Securities Act.
As a result of lock-up agreements and market standoff provisions described below and the provisions of Rules 144 and 701, shares of our common stock will be available for sale in the public market as follows:
| • | shares of our common stock will be eligible for immediate sale upon the closing of this offering; and |
| • | approximately shares of our common stock will be eligible for sale upon expiration of lock-up agreements and market standoff provisions described below, beginning 180 days after the date of this prospectus, subject in certain circumstances to the volume, manner of sale and other limitations under Rule 144 and Rule 701. |
We may issue shares of our capital stock from time to time for a variety of corporate purposes, including in capital-raising activities through future public offerings or private placements, in connection with the exercise of stock options and warrants, vesting of restricted stock units and other issuances relating to our employee benefit plans and as consideration for future acquisitions, investments or other purposes. The number of shares of our capital stock that we may issue may be significant, depending on the events surrounding such issuances. In some cases, the shares we issue may be freely tradable without restriction or further registration under the Securities Act; in other cases, we may grant registration rights covering the shares issued in connection with these issuances, in which case the holders of the shares will have the right, under certain circumstances, to cause us to register any resale of such shares to the public.
Rule 144
In general, persons who have beneficially owned restricted shares of our common stock for at least six months, and any affiliate of ours who owns either restricted or unrestricted shares of our common stock, are entitled to sell their securities without registration with the SEC under an exemption from registration provided by Rule 144 under the Securities Act.
139
Table of Contents
Non-Affiliates
Any person who is not deemed to have been one of our affiliates at the time of, or at any time during the three months preceding, a sale may sell an unlimited number of restricted securities under Rule 144 if:
| • | the restricted securities have been held for at least six months, including the holding period of any prior owner other than one of our affiliates; |
| • | we have been subject to the Exchange Act periodic reporting requirements for at least 90 days before the sale; and |
| • | we are current in our Exchange Act reporting at the time of sale. |
Any person who is not deemed to have been an affiliate of ours at the time of, or at any time during the three months preceding, a sale and has held the restricted securities for at least one year, including the holding period of any prior owner other than one of our affiliates, will be entitled to sell an unlimited number of restricted securities without regard to the length of time we have been subject to Exchange Act periodic reporting or whether we are current in our Exchange Act reporting.
Affiliates
Persons seeking to sell restricted securities who are our affiliates at the time of, or any time during the three months preceding, a sale, would be subject to the restrictions described above. Sales of restricted or unrestricted shares of our common stock by affiliates are also subject to additional restrictions, by which such person would be required to comply with the manner of sale and notice provisions of Rule 144 and would be entitled to sell within any three-month period only that number of securities that does not exceed the greater of either of the following:
| • | 1% of the number of shares of our common stock then outstanding, which will equal approximately shares immediately after the closing of this offering based on the number of shares outstanding as of March 31, 2018, or |
| • | the average weekly trading volume of our common stock on the Nasdaq Global Market during the four calendar weeks preceding the filing of a notice on Form 144 with respect to the sale. |
Rule 701
In general, under Rule 701, a person who purchased shares of our common stock pursuant to a written compensatory plan or contract and who is not deemed to have been one of our affiliates during the immediately preceding 90 days may sell these shares in reliance upon Rule 144, but without being required to comply with the holding period, notice, manner of sale, public information requirements or volume limitation provisions of Rule 144. Rule 701 also permits affiliates to sell their Rule 701 shares under Rule 144 without complying with the holding period requirements of Rule 144. All holders of Rule 701 shares, however, are subject to the expiration of the lock-up agreements and market standoff provisions described below.
Form S-8 Registration Statements
As of March 31, 2018, options to purchase an aggregate of 15,217,352 shares of our common stock and 1,582,685 shares of our restricted common stock were outstanding. As soon as practicable after the closing of this offering, we intend to file with the SEC one or more registration statements on Form S-8 under the Securities Act to register the shares of our common stock that are issuable pursuant to our equity incentive plans, including pursuant to outstanding options. See “Executive Compensation—Equity Incentive Plans” for a description of our equity incentive plans. These registration statements will become effective immediately upon filing. Shares covered by these registration statements will then be eligible for sale in the public markets, subject to vesting restrictions, any applicable lock-up agreements described below and Rule 144 limitations applicable to affiliates.
140
Table of Contents
Lock-Up Agreements
In connection with this offering, we, our directors and officers, and the holders of substantially all of our equity securities outstanding immediately prior to this offering have agreed, subject to certain exceptions, not to offer, sell, or transfer any common stock or securities convertible into or exchangeable for our common stock for 180 days after the date of this prospectus without the prior written consent of Morgan Stanley & Co. LLC and J.P. Morgan Securities LLC on behalf of the underwriters.
The agreements do not contain any pre-established conditions to the waiver by Morgan Stanley & Co. LLC and J.P. Morgan Securities LLC on behalf of the underwriters of any terms of the lock-up agreements. Any determination to release shares subject to the lock-up agreements would be based on a number of factors at the time of determination, including but not necessarily limited to the market price of the common stock, the liquidity of the trading market for the common stock, general market conditions, the number of shares proposed to be sold and the timing, purpose and terms of the proposed sale.
In addition to the restrictions contained in the lock-up agreements described above, we have entered into agreements with certain of our security holders, including our investors’ rights agreement and agreements governing our equity awards, that contain market stand-off provisions imposing restrictions on the ability of such security holders to offer, sell or transfer our equity securities for a period of 180 days following the date of this prospectus.
Registration Rights
Upon the closing of this offering, the holders of 70,927,042 shares of our common stock will be entitled to certain rights with respect to the registration of the offer and sale of their shares under the Securities Act. Registration of the offer and sale of these shares under the Securities Act would result in the shares becoming freely tradable without restriction under the Securities Act immediately upon the effectiveness of the registration. See “Description of Capital Stock—Registration Rights” for additional information.
141
Table of Contents
MATERIAL U.S. FEDERAL INCOME TAX CONSIDERATIONS FOR NON-U.S. HOLDERS
The following summary describes the material U.S. federal income tax consequences of the acquisition, ownership and disposition of our common stock acquired in this offering by Non-U.S. Holders (as defined below). This discussion does not address all aspects of U.S. federal income taxation and does not address any non-U.S., state or local tax consequences that may be relevant to Non-U.S. Holders in light of their particular circumstances, nor does it address U.S. federal tax consequences other than income taxes, such as gift or estate taxes. Rules different from those described below may apply to certain Non-U.S. Holders that are subject to special treatment under the Internal Revenue Code of 1986, as amended, or the Code, such as financial institutions, insurance companies, tax-exempt organizations, broker-dealers and traders in securities, government organizations, certain former citizens or long-term residents of the United States, “controlled foreign corporations,” “passive foreign investment companies,” corporations that accumulate earnings to avoid U.S. federal income tax, persons that hold our common stock as part of a “straddle,” “hedge,” “conversion transaction,” “synthetic security” or integrated investment or other risk reduction strategy, persons that own, or are deemed to own, more than five percent of our common stock (except to the extent specifically set forth below), persons who hold or receive our common stock pursuant to the exercise of an employee stock option or otherwise as compensation, persons deemed to sell our common stock under the constructive sale provisions of the Code, persons subject to the alternative minimum tax or federal Medicare contribution tax on net investment income, persons who have a functional currency other than the U.S. dollar, accrual method taxpayers subject to special tax accounting rules under Section 451(b) of the Code, real estate investment trusts, regulated investment companies partnerships and other pass-through entities and investors in such pass-through entities. Such Non-U.S. Holders are urged to consult their own tax advisors to determine the U.S. federal, state, local and other tax consequences that may be relevant to them. Furthermore, the discussion below is based upon the provisions of the Code and Treasury regulations, rulings and judicial decisions promulgated thereunder as of the date hereof, and such authorities may be repealed, revoked or modified, perhaps retroactively, so as to result in U.S. federal income tax consequences different from those discussed below. We have not requested a ruling from the U.S. Internal Revenue Service, or IRS, with respect to the statements made and the conclusions reached in the following summary, and there can be no assurance that the IRS will agree with such statements and conclusions. This discussion assumes that the Non-U.S. Holder holds our common stock as a “capital asset” within the meaning of Section 1221 of the Code (generally, property held for investment).
Persons considering purchasing our common stock pursuant to this offering should consult their own tax advisors concerning the U.S. federal income, estate and other tax consequences of acquiring, owning and disposing of our common stock in light of their particular situations as well as any consequences arising under the laws of any other taxing jurisdiction, including any state, local or non-U.S. tax consequences. You should also consult with your tax advisor with respect to recently enacted changes in U.S. tax law as well as potential conforming changes in state tax laws.
For the purposes of this discussion, a “Non-U.S. Holder” is, for U.S. federal income tax purposes, a beneficial owner of our common stock that is neither a U.S. Holder nor a partnership (or other entity treated as a partnership for U.S. federal income tax purposes regardless of its place of organization or formation). A “U.S. Holder” means a beneficial owner of our common stock that is, for U.S. federal income tax purposes, (1) an individual who is a citizen or resident of the United States, (2) a corporation or other entity treated as a corporation created or organized in or under the laws of the United States, any state thereof or the District of Columbia, (3) an estate the income of which is subject to U.S. federal income taxation regardless of its source or (4) a trust if it (a) is subject to the primary supervision of a court within the United States and one or more U.S. persons have the authority to control all substantial decisions of the trust or (b) has a valid election in effect under applicable Treasury regulations to be treated as a U.S. person.
Distributions on Our Common Stock
Distributions (other than certain pro rata distributions of our stock), if any, made in respect of our common stock to a Non-U.S. Holder to the extent made out of our current or accumulated earnings and profits (as
142
Table of Contents
determined under U.S. federal income tax principles) generally will constitute dividends for U.S. tax purposes. Subject to the discussion below regarding backup withholding and foreign accounts, such dividends will be subject to withholding tax at a 30% rate or such lower rate as may be specified by an applicable income tax treaty. To obtain a reduced rate of withholding tax under a treaty, a Non-U.S. Holder generally will be required to provide us with a properly executed IRS Form W-8BEN (in the case of individuals), IRS Form W-8BEN-E (in the case of entities) or other appropriate form, including a U.S. taxpayer identification number and certifying the Non-U.S. Holder’s entitlement to benefits under that treaty. This certification must be provided to us or our paying agent prior to the payment of dividends and must be updated periodically. In the case of a Non-U.S. Holder that is an entity, Treasury regulations and the relevant tax treaty provide rules to determine whether, for purposes of determining the applicability of a tax treaty, dividends will be treated as paid to the entity or to those holding an interest in that entity. If a Non-U.S. Holder holds stock through a financial institution or other agent acting on the holder’s behalf, the holder will be required to provide appropriate documentation to such agent. The holder’s agent will then be required to provide certification to us or our paying agent, either directly or through other intermediaries. If you are eligible for a reduced rate of U.S. federal withholding tax under an income tax treaty and you do not timely provide the required certification, you may be able to obtain a refund or credit of any excess amounts withheld by timely filing an appropriate claim for a refund with the IRS.
We generally are not required to withhold tax on dividends paid to a Non-U.S. Holder that are effectively connected with the Non-U.S. Holder’s conduct of a trade or business within the United States (and, if required by an applicable income tax treaty, are attributable to a permanent establishment that such holder maintains in the United States) if a properly executed IRS Form W-8ECI or other applicable IRS Form W-8, stating that the dividends are so connected, is furnished to us (or, if stock is held through a financial institution or other agent, to such agent). In general, such effectively connected dividends will be subject to U.S. federal income tax, on a net income basis at the regular graduated rates applicable to U.S. residents. A corporate Non-U.S. Holder receiving effectively connected dividends may also be subject to an additional “branch profits tax” which is imposed, under certain circumstances, at a rate of 30% (or such lower rate as may be specified by an applicable treaty) on the corporate Non-U.S. Holder’s effectively connected earnings and profits, subject to certain adjustments. Non-U.S. Holders should consult their tax advisors regarding any applicable income tax treaties that may provide for different rules.
To the extent distributions on our common stock, if any, exceed our current and accumulated earnings and profits, they will first reduce the Non-U.S. Holder’s adjusted basis in our common stock, but not below zero, and then will be treated as gain to the extent of any excess and taxed in the same manner as gain realized from a sale or other disposition of common stock as described in the next section.
Gain on Disposition of Our Common Stock
Subject to the discussion below regarding backup withholding and foreign accounts, a Non-U.S. Holder generally should not be subject to U.S. federal income tax with respect to gain realized on a sale or other disposition of our common stock unless (1) the gain is effectively connected with a trade or business of such holder in the United States (and, if required by an applicable income tax treaty, is attributable to a permanent establishment that such holder maintains in the United States), (2) the Non-U.S. Holder is a nonresident alien individual and is present in the United States for 183 or more days in the taxable year of the disposition and certain other conditions are met or (3) we are or have been a “United States real property holding corporation” within the meaning of Section 897(c)(2) of the Code at any time within the shorter of the five-year period preceding such disposition or such holder’s holding period. In general, we would be a U.S. real property holding corporation if interests in U.S. real estate comprised at least half of the fair market value of our business assets. We believe that we are not, and do not anticipate becoming, a U.S. real property holding corporation. However, because the determination of whether we are a U.S. real property holding corporation depends on the fair market value of our U.S. real property relative to the fair market value of our other business assets, there can be no assurance that we will not become a U.S. real property holding corporation in the future. Even if we are treated as
143
Table of Contents
a U.S. real property holding corporation, gain realized by a Non-U.S. Holder on a disposition of our common stock will not be subject to U.S. federal income tax so long as (a) the Non-U.S. Holder owned, directly, indirectly and constructively, no more than five percent of our common stock at all times within the shorter of (i) the five-year period preceding the disposition or (ii) the holder’s holding period and (b) our common stock is regularly traded on an established securities market. There can be no assurance that our common stock will qualify as regularly traded on an established securities market. If any gain on your disposition is taxable because we are a U.S. real property holding corporation and your ownership of our common stock exceeds 5%, you will be taxed on such disposition generally in the manner applicable to U.S. persons and, in addition, a purchaser of your common stock may be required to withhold tax with respect to that obligation.
If you are a Non-U.S. Holder described in (1) above, you will be required to pay tax on the net gain derived from the sale at regular graduated U.S. federal income tax rates, and corporate Non-U.S. Holders described in (1) above may be subject to the additional branch profits tax at a 30% rate or such lower rate as may be specified by an applicable income tax treaty. If you are an individual Non-U.S. Holder described in (2) above, you will be required to pay a flat 30% (or such lower rate as may be specified by an applicable treaty) tax on the gain derived from the sale, and such gain may be offset by U.S.-source capital losses if you timely file U.S. tax returns reporting the losses (even though you are not considered a resident of the U.S.).
Information Reporting Requirements and Backup Withholding
Generally, we must report information to the IRS with respect to any dividends we pay on our common stock (even if the payments are not subject to withholding) including the amount of any such dividends, the name and address of the recipient and the amount, if any, of tax withheld. A similar report is sent to dividend recipients. The IRS may make its reports available to tax authorities in the recipient’s country of residence pursuant to tax treaties or certain other agreements.
Dividends paid by us or by our paying agents to a Non-U.S. Holder may also be subject to U.S. backup withholding at a current rate of 24%. U.S. backup withholding generally will not apply to a Non-U.S. Holder who provides a properly executed IRS Form W-8BEN (in the case of individuals) or IRS Form W-8BEN-E (in the case of entities), IRS Form W-8ECI or otherwise establishes an exemption. Notwithstanding the foregoing, backup withholding may apply if the payor has actual knowledge, or reason to know, that the holder is a U.S. person who is not an exempt recipient.
Under current U.S. federal income tax law, U.S. information reporting and backup withholding requirements generally will apply to the proceeds of a disposition of our common stock effected by or through a U.S. office of any broker, U.S. or foreign, except that information reporting and such requirements may be avoided if the holder provides a properly executed IRS Form W-8BEN (in the case of individuals) or IRS Form W-8BEN-E (in the case of entities) or otherwise satisfies documentary evidence requirements for establishing Non-U.S. Holder status or otherwise establishes an exemption. Generally, U.S. information reporting and backup withholding requirements will not apply to a payment of disposition proceeds to a Non-U.S. Holder where the transaction is effected outside the U.S. through a non-U.S. office of a non-U.S. broker. Information reporting and backup withholding requirements may, however, apply to a payment of disposition proceeds if the broker has actual knowledge, or reason to know, that the holder is, in fact, a U.S. person. For information reporting purposes, certain brokers with substantial U.S. ownership or operations will generally be treated in a manner similar to U.S. brokers.
Any amounts of tax withheld under the backup withholding rules may be credited against the tax liability of persons subject to backup withholding, provided that the required information is timely furnished to the IRS.
Foreign Accounts
A U.S. federal withholding tax of 30% may apply to dividends on and the gross proceeds of a disposition of our common stock paid to a foreign financial institution (as specifically defined by applicable rules), unless such
144
Table of Contents
institution enters into an agreement with the U.S. government to withhold on certain payments and to collect and provide to the U.S. tax authorities substantial information regarding U.S. account holders of such institution (which includes certain equity holders of such institution, as well as certain account holders that are foreign entities with U.S. owners). This U.S. federal withholding tax of 30% will also apply to dividends on and the gross proceeds of a disposition of our common stock to a non-financial foreign entity, unless such entity provides the withholding agent with either a certification that it does not have any substantial direct or indirect U.S. owners or provides information regarding substantial direct and indirect U.S. owners of the entity. The withholding tax described above will not apply if the foreign financial institution or non-financial foreign entity otherwise qualifies for an exemption from the rules. Under certain circumstances, a Non-U.S. Holder might be eligible for refunds or credits of such taxes. Holders are encouraged to consult with their own tax advisors regarding the possible implications of these rules to their investment in our common stock.
The withholding provisions described above apply currently to payments of dividends and will apply to payments of gross proceeds from a sale or other disposition of common stock on or after January 1, 2019.
EACH PROSPECTIVE INVESTOR SHOULD CONSULT ITS OWN TAX ADVISOR REGARDING THE TAX CONSEQUENCES OF PURCHASING, HOLDING AND DISPOSING OF OUR COMMON STOCK, INCLUDING THE CONSEQUENCES OF ANY RECENT AND PROPOSED CHANGE IN APPLICABLE LAW.
145
Table of Contents
Under the terms and subject to the conditions in an underwriting agreement dated the date of this prospectus, the underwriters named below, for whom Morgan Stanley & Co. LLC and J.P. Morgan Securities LLC are acting as representatives, have severally agreed to purchase, and we have agreed to sell to each of them, severally, the number of shares indicated below:
| Name |
Number of Shares |
|||
| Morgan Stanley & Co. LLC |
||||
| J.P. Morgan Securities LLC |
||||
| Allen & Company LLC |
||||
| Deutsche Bank Securities Inc. |
||||
| Stifel, Nicolaus & Company, Incorporated |
||||
| William Blair & Company, L.L.C. |
||||
| BTIG, LLC |
||||
|
|
|
|||
| Total: |
||||
|
|
|
|||
The underwriters and the representatives are collectively referred to as the “underwriters” and the “representatives,” respectively. The underwriters are offering the shares of common stock subject to their acceptance of the shares from us and subject to prior sale. The underwriting agreement provides that the obligations of the several underwriters to pay for and accept delivery of the shares of common stock offered by this prospectus are subject to the approval of certain legal matters by their counsel and to certain other conditions. The underwriters are obligated to take and pay for all of the shares of common stock offered by this prospectus if any such shares are taken. However, the underwriters are not required to take or pay for the shares covered by the underwriters’ over-allotment option described below. The underwriting agreement also provides that if an underwriter defaults, the purchase commitment of non-defaulting underwriters may be increased or the offering terminated. The underwriting agreement also provides that if an underwriter defaults, the purchase commitment of non-defaulting underwriters may be increased or the offering terminated.
The underwriters initially propose to offer part of the shares of common stock directly to the public at the offering price listed on the cover page of this prospectus and part to certain dealers. After the initial offering of the shares of common stock, if all of the shares of common stock are not sold at the initial public offering price, the offering price and other selling terms may from time to time be varied by the underwriters.
We have granted to the underwriters an option, exercisable for 30 days from the date of this prospectus, to purchase up to additional shares of common stock at the public offering price listed on the cover page of this prospectus, less underwriting discounts and commissions. The underwriters may exercise this option solely for the purpose of covering over-allotments, if any, made in connection with the offering of the shares of common stock offered by this prospectus. To the extent the option is exercised, each underwriter will become obligated, subject to certain conditions, to purchase about the same percentage of the additional shares of common stock as the number listed next to the underwriter’s name in the preceding table bears to the total number of shares of common stock listed next to the names of all underwriters in the preceding table.
146
Table of Contents
The following table shows the per share and total public offering price, underwriting discounts and commissions, and proceeds before expenses to us. These amounts are shown assuming both no exercise and full exercise of the underwriters’ option to purchase up to an additional shares of common stock.
| Total | ||||||||||||
| Per Share |
No Exercise | Full Exercise |
||||||||||
| Public offering price |
$ | $ | $ | |||||||||
| Underwriting discounts and commissions to be paid by us |
$ | $ | $ | |||||||||
| Proceeds, before expenses, to us |
$ | $ | $ | |||||||||
The estimated offering expenses payable by us, exclusive of the underwriting discounts and commissions, are approximately $ . We have agreed to reimburse the underwriters for expense relating to clearance of this offering with the Financial Industry Regulatory Authority up to $ . The underwriters have agreed to reimburse us for certain expenses incurred by us in connection with this offering.
The underwriters have informed us that they do not intend sales to discretionary accounts to exceed 5% of the total number of shares of common stock offered by them.
We have applied to list our common stock on the Nasdaq Global Market under the trading symbol “TENB.”
We and all directors and officers and the holders of all of our outstanding stock and stock options have agreed that, without the prior written consent of Morgan Stanley & Co. LLC and J.P. Morgan Securities LLC on behalf of the underwriters, we and they will not, during the period ending 180 days after the date of this prospectus (the “restricted period”):
| • | offer, pledge, sell, contract to sell, sell any option or contract to purchase, purchase any option or contract to sell, grant any option, right or warrant to purchase, lend or otherwise transfer or dispose of, directly or indirectly, any shares of common stock or any securities convertible into or exercisable or exchangeable for shares of common stock; |
| • | file any registration statement with the Securities and Exchange Commission relating to the offering of any shares of common stock or any securities convertible into or exercisable or exchangeable for common stock; or |
| • | enter into any swap or other arrangement that transfers to another, in whole or in part, any of the economic consequences of ownership of the common stock |
whether any such transaction described above is to be settled by delivery of common stock or such other securities, in cash or otherwise. In addition, we and each such person agrees that, without the prior written consent of Morgan Stanley & Co. LLC and J.P. Morgan Securities LLC on behalf of the underwriters, we or such other person will not, during the restricted period, make any demand for, or exercise any right with respect to, the registration of any shares of common stock or any security convertible into or exercisable or exchangeable for common stock.
The restrictions described in the immediately preceding paragraph to do not apply to:
| • | the sale of shares to the underwriters; |
| • | transactions by any person other than us relating to shares of common stock or other securities acquired in open market transactions of the shares; provided that no filing under Section 16(a) of the Securities Exchange Act of 1934, as amended, or the Exchange Act, is required or voluntarily made in connection with subsequent sales of the common stock or other securities acquired in such open market transactions; |
| • | transfers of shares of Common Stock or any security convertible into or exercisable or exchangeable for Common Stock (i) as a bona fide gift, (ii) to an immediate family member (as defined below) or to |
147
Table of Contents
| any trust for the direct or indirect benefit of the holder or an immediate family member of the holder, (iii) to any corporation, partnership, limited liability company, investment fund or other entity controlled or managed, or under common control or management by, the holder or (iv) by will, other testamentary document or intestate succession to the legal representative, heir, beneficiary or an immediate family member of the holder, provided that, (a) each transferee shall sign and deliver a lock-up agreement and (b) no filing under Section 16(a) of the Exchange Act reporting a reduction in beneficial ownership of shares of Common Stock shall be required or shall be voluntarily made other than any required Form 5 filing during the restricted period; |
| • | dispositions, transfers or distributions to (i) another corporation, partnership, limited liability company, trust or other business entity that is an affiliate, or to any investment fund or other entity controlled or managed by the holder or its affiliates, or (ii) as part of a distribution, transfer or disposition without consideration by the holder to its stockholders, current or former partners (general or limited), members, beneficiaries or other equity holders, or to the estates of any such stockholders, partners, beneficiaries or other equity holders; provided that (a) each transferee, recipient or distributee shall sign and deliver a lock-up letter and (b) no filing under Section 16(a) of the Exchange Act, reporting a reduction in beneficial ownership of shares of Common Stock, shall be required or shall be voluntarily made other than any required Form 5 filing during the restricted period; |
| • | (i) the issuance or receipt of shares of common stock upon the exercise of options or warrants or vesting of restricted stock awards, insofar as such options, restricted stock awards or warrants are outstanding as of the date of the final prospectus for this offering and granted under any warrant, award, equity incentive plan or stock purchase plan described herein, provided that the shares received upon exercise of such option or warrant or vesting of such restricted stock award shall remain subject to this agreement, or (ii) the transfer of shares or any securities convertible thereto upon a vesting event of securities or upon the exercise of options or warrants to purchase securities on a “cashless” or “net exercise” basis to the extent permitted by the instruments representing such options, restricted stock awards or warrants insofar as such options, restricted stock awards or warrants are outstanding as of the date of the final prospectus for this offering and granted under any warrant, award, equity incentive plan or stock purchase plan described in herein and so long as such “cashless” exercise or “net exercise” is effected solely by the surrender of outstanding options or warrants or other securities to us and our cancellation of all or a portion thereof to pay the exercise price (including the payment of taxes due as a result of such vesting event or exercise) and/or withholding tax obligations, but for the avoidance of doubt, excluding all methods of exercise that would involve a sale of any shares relating to options or warrants, whether to cover the applicable exercise price, withholding tax obligations or otherwise, provided that in the case of either (i) or (ii), no filing under Section 16(a) of the Exchange Act, or any other public filing or disclosure of such receipt or transfer by or on behalf of the holder shall be required or shall be voluntarily made within 60 days after the date of the final prospectus for this offering, and after such 60th day, any filing under Section 16(a) of the Exchange Act shall clearly indicate in the footnotes thereto that (A) the filing relates to the circumstances described in (i) or (ii), as the case may be, (B) no shares were sold by the reporting person and (C) in the case of (i), the shares received upon exercise of the option are subject to a lock-up letter; |
| • | the establishment of a trading plan pursuant to Rule 10b5-1 under the Exchange Act, provided that (i) such plan does not provide for the transfer during the period subject to the lock up and (ii) to the extent a public announcement or filing under the Exchange Act, if any, is required of or voluntarily made regarding the establishment of such plan, such announcement or filing shall include a statement to such effect; |
| • | the transfer of shares pursuant to a qualified domestic order or in connection with a divorce settlement, provided that (i) each such transferee shall sign and deliver a lock-up letter and (ii) any filing required under Section 16(a) of the Exchange Act shall clearly indicate in the footnotes thereto that the filing relates to the circumstances described above and (iii) the holder does not otherwise voluntarily effect any other public filing or announcement regarding such transfers; |
148
Table of Contents
| • | the conversion of our outstanding preferred stock into shares of common stock; and |
| • | the transfer of shares of pursuant to a bona fide third-party tender offer, merger, consolidation or other similar transaction that is approved by our board of directors, made to all of our stockholders involving a change of control. |
Morgan Stanley & Co. LLC and J.P. Morgan Securities LLC, in their sole discretion, may release the common stock and other securities subject to the lock-up agreements described above in whole or in part at any time.
In order to facilitate the offering of the common stock, the underwriters may engage in transactions that stabilize, maintain or otherwise affect the price of the common stock. Specifically, the underwriters may sell more shares than they are obligated to purchase under the underwriting agreement, creating a short position. A short sale is covered if the short position is no greater than the number of shares available for purchase by the underwriters under the over-allotment option. The underwriters can close out a covered short sale by exercising the over-allotment option or purchasing shares in the open market. In determining the source of shares to close out a covered short sale, the underwriters will consider, among other things, the open market price of shares compared to the price available under the over-allotment option. The underwriters may also sell shares in excess of the over-allotment option, creating a naked short position. The underwriters must close out any naked short position by purchasing shares in the open market. A naked short position is more likely to be created if the underwriters are concerned that there may be downward pressure on the price of the common stock in the open market after pricing that could adversely affect investors who purchase in this offering. As an additional means of facilitating this offering, the underwriters may bid for, and purchase, shares of common stock in the open market to stabilize the price of the common stock.
The underwriters have advised us that, pursuant to Regulation M of the Securities Act of 1933, they may also engage in other activities that stabilize, maintain or otherwise affect the price of the common stock, including the imposition of penalty bids. This means that if the representatives of the underwriters purchase common stock in the open market in stabilizing transactions or to cover short sales, the representatives can require the underwriters that sold those shares as part of this offering to repay the underwriting discount received by them.
These activities may raise or maintain the market price of the common stock above independent market levels or prevent or retard a decline in the market price of the common stock. The underwriters are not required to engage in these activities and may end any of these activities at any time. The underwriters may carry out these transactions on the Nasdaq Global Market, in the over-the-counter market or otherwise.
We and the underwriters have agreed to indemnify each other against certain liabilities, including liabilities under the Securities Act.
A prospectus in electronic format may be made available on websites maintained by one or more underwriters, or selling group members, if any, participating in this offering. The representatives may agree to allocate a number of shares of common stock to underwriters for sale to their online brokerage account holders. Internet distributions will be allocated by the representatives to underwriters that may make Internet distributions on the same basis as other allocations.
The underwriters and their respective affiliates are full service financial institutions engaged in various activities, which may include securities trading, commercial and investment banking, financial advisory, investment management, investment research, principal investment, hedging, financing and brokerage activities. Certain of the underwriters and their respective affiliates have, from time to time, performed, and may in the future perform, various financial advisory and investment banking services for us, for which they received or will receive customary fees and expenses.
149
Table of Contents
In addition, in the ordinary course of their various business activities, the underwriters and their respective affiliates may make or hold a broad array of investments and actively trade debt and equity securities (or related derivative securities) and financial instruments (including bank loans) for their own account and for the accounts of their customers and may at any time hold long and short positions in such securities and instruments. Such investment and securities activities may involve our securities and instruments. The underwriters and their respective affiliates may also make investment recommendations or publish or express independent research views in respect of such securities or instruments and may at any time hold, or recommend to clients that they acquire, long or short positions in such securities and instruments.
Directed Share Program
Furthermore, at our request, the underwriters have reserved up to shares of common stock offered by this prospectus, or up to 5% of the shares of common stock offered by this prospectus, for sale, at the initial public offering price, to friends, professional contacts and family members of executive officers and directors. The number of shares of common stock available for sale to the general public will be reduced by the number of reserved shares sold to these individuals. Any reserved shares of our common stock that are not so purchased will be offered by the underwriters to the general public on the same terms as the other shares of our common stock offered by this prospectus. We have agreed to indemnify the underwriters against certain liabilities and expenses, including liabilities under the Securities Act, in connection with sales of the reserved shares.
Pricing of the Offering
Prior to this offering, there has been no public market for our common stock. The initial public offering price will be determined by negotiations between us and the representatives. Among the factors considered in determining the initial public offering price will be our future prospects and those of our industry in general, assessment of our management, conditions of the securities markets at the time of this offering, our sales, earnings and certain other financial and operating information in recent periods, and the price-earnings ratios, price-sales ratios, market prices of securities, certain financial and operating information of companies engaged in activities similar to ours and other factors deemed relevant by the underwriters and us.
Neither we nor the underwriters can assure investors that an active trading market will develop for our common shares, or that the shares will trade in the public market at or above the initial public offering price.
Selling Restrictions
Canada
The shares may be sold only to purchasers purchasing, or deemed to be purchasing, as principal that are accredited investors, as defined in National Instrument 45-106 Prospectus Exemptions or subsection 73.3(1) of the Securities Act (Ontario), and are permitted clients, as defined in National Instrument 31-103 Registration Requirements, Exemptions and Ongoing Registrant Obligations. Any resale of the shares must be made in accordance with an exemption from, or in a transaction not subject to, the prospectus requirements of applicable securities laws.
Securities legislation in certain provinces or territories of Canada may provide a purchaser with remedies for rescission or damages if this prospectus (including any amendment thereto) contains a misrepresentation, provided that the remedies for rescission or damages are exercised by the purchaser within the time limit prescribed by the securities legislation of the purchaser’s province or territory. The purchaser should refer to any applicable provisions of the securities legislation of the purchaser’s province or territory for particulars of these rights or consult with a legal advisor.
Pursuant to section 3A.3 (or, in the case of securities issued or guaranteed by the government of a non-Canadian jurisdiction, section 3A.4) of National Instrument 33-105 Underwriting Conflicts (NI 33-105), the underwriters are not required to comply with the disclosure requirements of NI 33-105 regarding underwriter conflicts of interest in connection with this offering.
150
Table of Contents
European Economic Area
In relation to each Member State of the European Economic Area which has implemented the Prospectus Directive (each, a “Relevant Member State”) an offer to the public of any shares of our common stock may not be made in that Relevant Member State, except that an offer to the public in that Relevant Member State of any shares of our common stock may be made at any time under the following exemptions under the Prospectus Directive, if they have been implemented in that Relevant Member State:
| (a) | to any legal entity which is a qualified investor as defined in the Prospectus Directive; |
| (b) | to fewer than 100 or, if the Relevant Member State has implemented the relevant provision of the 2010 PD Amending Directive, 150, natural or legal persons (other than qualified investors as defined in the Prospectus Directive), as permitted under the Prospectus Directive, subject to obtaining the prior consent of the representatives for any such offer; or |
| (c) | in any other circumstances falling within Article 3(2) of the Prospectus Directive, provided that no such offer of shares of our common stock shall result in a requirement for the publication by us or any underwriter of a prospectus pursuant to Article 3 of the Prospectus Directive. |
For the purposes of this provision, the expression an “offer to the public” in relation to any shares of our common stock in any Relevant Member State means the communication in any form and by any means of sufficient information on the terms of the offer and any shares of our common stock to be offered so as to enable an investor to decide to purchase any shares of our common stock, as the same may be varied in that Member State by any measure implementing the Prospectus Directive in that Member State, the expression “Prospectus Directive” means Directive 2003/71/EC (and amendments thereto, including the 2010 PD Amending Directive, to the extent implemented in the Relevant Member State), and includes any relevant implementing measure in the Relevant Member State, and the expression “2010 PD Amending Directive” means Directive 2010/73/EU.
United Kingdom
Each underwriter has represented and agreed that:
| (a) | it has only communicated or caused to be communicated and will only communicate or cause to be communicated an invitation or inducement to engage in investment activity (within the meaning of Section 21 of the Financial Services and Markets Act 2000 (“FSMA”) received by it in connection with the issue or sale of the shares of our common stock in circumstances in which Section 21(1) of the FSMA does not apply to us; and |
| (b) | it has complied and will comply with all applicable provisions of the FSMA with respect to anything done by it in relation to the shares of our common stock in, from or otherwise involving the United Kingdom. |
Hong Kong
Shares of our common stock may not be offered or sold by means of any document other than (i) in circumstances which do not constitute an offer to the public within the meaning of the Companies Ordinance (Cap.32, Laws of Hong Kong), or (ii) to “professional investors” within the meaning of the Securities and Futures Ordinance (Cap.571, Laws of Hong Kong) and any rules made thereunder, or (iii) in other circumstances which do not result in the document being a “prospectus” within the meaning of the Companies Ordinance (Cap.32, Laws of Hong Kong), and no advertisement, invitation or document relating to shares of our common stock may be issued or may be in the possession of any person for the purpose of issue (in each case whether in Hong Kong or elsewhere), which is directed at, or the contents of which are likely to be accessed or read by, the public in Hong Kong (except if permitted to do so under the laws of Hong Kong) other than with respect to shares of our common stock which are or are intended to be disposed of only to persons outside Hong Kong or only to “professional investors” within the meaning of the Securities and Futures Ordinance (Cap.571, Laws of Hong Kong) and any rules made thereunder.
151
Table of Contents
Japan
No registration pursuant to Article 4, paragraph 1 of the Financial Instruments and Exchange Law of Japan (Law No. 25 of 1948, as amended) (the “FIEL”) has been made or will be made with respect to the solicitation of the application for the acquisition of the shares of common stock.
Accordingly, the shares of common stock have not been, directly or indirectly, offered or sold and will not be, directly or indirectly, offered or sold in Japan or to, or for the benefit of, any resident of Japan (which term as used herein means any person resident in Japan, including any corporation or other entity organized under the laws of Japan) or to others for re-offering or re-sale, directly or indirectly, in Japan or to, or for the benefit of, any resident of Japan except pursuant to an exemption from the registration requirements, and otherwise in compliance with, the FIEL and the other applicable laws and regulations of Japan.
For Qualified Institutional Investors (“QII”)
Please note that the solicitation for newly-issued or secondary securities (each as described in Paragraph 2, Article 4 of the FIEL) in relation to the shares of common stock constitutes either a “QII only private placement” or a “QII only secondary distribution” (each as described in Paragraph 1, Article 23-13 of the FIEL). Disclosure regarding any such solicitation, as is otherwise prescribed in Paragraph 1, Article 4 of the FIEL, has not been made in relation to the shares of common stock. The shares of common stock may only be transferred to QIIs.
For Non-QII Investors
Please note that the solicitation for newly-issued or secondary securities (each as described in Paragraph 2, Article 4 of the FIEL) in relation to the shares of common stock constitutes either a “small number private placement” or a “small number private secondary distribution” (each as is described in Paragraph 4, Article 23-13 of the FIEL). Disclosure regarding any such solicitation, as is otherwise prescribed in Paragraph 1, Article 4 of the FIEL, has not been made in relation to the shares of common stock. The shares of common stock may only be transferred en bloc without subdivision to a single investor.
Singapore
This prospectus has not been registered as a prospectus with the Monetary Authority of Singapore. Accordingly, this prospectus and any other document or material in connection with the offer or sale, or invitation for subscription or purchase, of shares of our common stock may not be circulated or distributed, nor may the shares of our common stock be offered or sold, or be made the subject of an invitation for subscription or purchase, whether directly or indirectly, to persons in Singapore other than (i) to an institutional investor under Section 274 of the Securities and Futures Act, Chapter 289 of Singapore (the “SFA”), (ii) to a relevant person, or any person pursuant to Section 275(1A), and in accordance with the conditions, specified in Section 275 of the SFA or (iii) otherwise pursuant to, and in accordance with the conditions of, any other applicable provision of the SFA.
Where shares of our common stock are subscribed or purchased under Section 275 by a relevant person which is: (a) a corporation (which is not an accredited investor) the sole business of which is to hold investments and the entire share capital of which is owned by one or more individuals, each of whom is an accredited investor; or (b) a trust (where the trustee is not an accredited investor) whose sole purpose is to hold investments and each beneficiary is an accredited investor, shares, debentures and units of shares and debentures of that corporation or the beneficiaries’ rights and interest in that trust shall not be transferable for 6 months after that corporation or that trust has acquired shares of our common stock under Section 275 except: (1) to an institutional investor under Section 274 of the SFA or to a relevant person, or any person pursuant to Section 275(1A), and in accordance with the conditions, specified in Section 275 of the SFA; (2) where no consideration is given for the transfer; or (3) by operation of law.
152
Table of Contents
The validity of the shares of common stock being offered by this prospectus will be passed upon for us by Cooley LLP, Reston, Virginia. Wilson Sonsini Goodrich & Rosati, Professional Corporation, Washington, District of Columbia, is representing the underwriters in connection with this offering.
Ernst & Young LLP, independent registered public accounting firm, has audited our consolidated financial statements at December 31, 2016 and 2017, and for each of the years then ended, as set forth in their report. We have included our financial statements in the prospectus and elsewhere in the registration statement in reliance on Ernst & Young LLP’s report, given on their authority as experts in accounting and auditing.
WHERE YOU CAN FIND ADDITIONAL INFORMATION
We have filed with the SEC a registration statement on Form S-1 under the Securities Act, with respect to the shares of common stock being offered by this prospectus, which constitutes a part of the registration statement. This prospectus does not contain all of the information in the registration statement and its exhibits. For further information with respect to us and the common stock offered by this prospectus, we refer you to the registration statement and its exhibits. Statements contained in this prospectus as to the contents of any contract or any other document referred to are not necessarily complete, and in each instance, we refer you to the copy of the contract or other document filed as an exhibit to the registration statement. Each of these statements is qualified in all respects by this reference.
You can read our SEC filings, including the registration statement, over the internet at the SEC’s website at www.sec.gov. You may also read and copy any document we file with the SEC at its public reference facilities at 100 F Street, N.E., Washington, D.C. 20549. You may also obtain copies of these documents at prescribed rates by writing to the Public Reference Section of the SEC at 100 F Street, N.E., Washington, D.C. 20549. Please call the SEC at 1-800-SEC-0330 for further information on the operation of the public reference facilities.
Upon completion of this offering, we will be subject to the information reporting requirements of the Exchange Act, and we will file reports, proxy statements and other information with the SEC. These reports, proxy statements and other information will be available for inspection and copying at the public reference room and web site of the SEC referred to above. We also maintain a website at www.tenable.com, at which you may access these materials free of charge as soon as reasonably practicable after they are electronically filed with, or furnished to, the SEC. However, the information contained in or accessible through our website is not part of this prospectus or the registration statement of which this prospectus forms a part, and investors should not rely on such information in making a decision to purchase our common stock in this offering.
153
Table of Contents
TENABLE HOLDINGS, INC.
INDEX TO CONSOLIDATED FINANCIAL STATEMENTS
| F-2 | ||||
| F-3 | ||||
| Consolidated Statements of Operations and Comprehensive Loss |
F-4 | |||
| Consolidated Statements of Redeemable Convertible Preferred Stock and Stockholders’ Deficit |
F-5 | |||
| F-6 | ||||
| F-7 |
F-1
Table of Contents
REPORT OF INDEPENDENT REGISTERED PUBLIC ACCOUNTING FIRM
To the Stockholders and Board of Directors of Tenable Holdings, Inc.
Opinion on the Financial Statements
We have audited the accompanying consolidated balance sheets of Tenable Holdings, Inc. (the Company) as of December 31, 2016 and 2017, the related consolidated statements of operations and comprehensive loss, redeemable convertible preferred stock and stockholders’ deficit and cash flows for the years then ended, and the related notes (collectively referred to as the “consolidated financial statements”). In our opinion, the consolidated financial statements present fairly, in all material respects, the financial position of the Company at December 31, 2016 and 2017, and the results of its operations and its cash flows for the years then ended in conformity with U.S. generally accepted accounting principles.
Adoption of ASU No. 2014-09, Revenue From Contracts With Customers (“Topic 606”)
As discussed in Note 2 to the consolidated financial statements, the Company changed its method for recognizing revenue and its accounting for incremental costs of obtaining a contract as a result of the adoption of FASB Accounting Standards Codification Topic 606, Revenue From Contracts With Customers, effective January 1, 2017.
Basis for Opinion
These financial statements are the responsibility of the Company’s management. Our responsibility is to express an opinion on the Company’s financial statements based on our audits. We are a public accounting firm registered with the Public Company Accounting Oversight Board (United States) (PCAOB) and are required to be independent with respect to the Company in accordance with the U.S. federal securities laws and the applicable rules and regulations of the Securities and Exchange Commission and the PCAOB.
We conducted our audits in accordance with the standards of the PCAOB. Those standards require that we plan and perform the audit to obtain reasonable assurance about whether the financial statements are free of material misstatement, whether due to error or fraud. The Company is not required to have, nor were we engaged to perform, an audit of its internal control over financial reporting. As part of our audits we are required to obtain an understanding of internal control over financial reporting but not for the purpose of expressing an opinion on the effectiveness of the Company’s internal control over financial reporting. Accordingly, we express no such opinion.
Our audits included performing procedures to assess the risks of material misstatement of the financial statements, whether due to error or fraud, and performing procedures that respond to those risks. Such procedures included examining, on a test basis, evidence regarding the amounts and disclosures in the financial statements. Our audits also included evaluating the accounting principles used and significant estimates made by management, as well as evaluating the overall presentation of the financial statements. We believe that our audits provide a reasonable basis for our opinion.
/s/ Ernst & Young LLP
We have served as the Company’s auditor since 2014.
Tysons, Virginia
April 27, 2018
except for Note 2 and Note 14, as to which the date is
June 29, 2018
F-2
Table of Contents
TENABLE HOLDINGS, INC.
| December 31, | March 31, 2018 |
Pro Forma March 31, 2018 |
||||||||||||||
| (in thousands, except per share data) | 2016 | 2017 | ||||||||||||||
| (unaudited) | (unaudited) | |||||||||||||||
| Assets |
||||||||||||||||
| Current assets: |
||||||||||||||||
| Cash and cash equivalents |
$ | 34,470 | $ | 27,210 | $ | 26,424 | ||||||||||
| Accounts receivable, net of allowance for doubtful accounts of $200, $160 and $160 at December 31, 2016, 2017, and March 31, 2018 (unaudited) |
36,072 | 50,881 | 43,088 | |||||||||||||
| Deferred commissions |
9,628 | 17,170 | 18,125 | |||||||||||||
| Prepaid expenses and other current assets |
7,541 | 15,994 | 14,795 | |||||||||||||
|
|
|
|
|
|
|
|||||||||||
| Total current assets |
87,711 | 111,255 | 102,432 | |||||||||||||
| Property and equipment, net |
9,861 | 10,754 | 11,015 | |||||||||||||
| Construction in progress |
— | 2,252 | 3,595 | |||||||||||||
| Deferred commissions (net of current portion) |
3,881 | 33,006 | 32,326 | |||||||||||||
| Intangible assets, net |
1,634 | 1,031 | 880 | |||||||||||||
| Goodwill |
265 | 265 | 265 | |||||||||||||
| Other assets |
2,142 | 5,774 | 5,132 | |||||||||||||
|
|
|
|
|
|
|
|||||||||||
| Total assets |
$ | 105,494 | $ | 164,337 | $ | 155,645 | ||||||||||
|
|
|
|
|
|
|
|||||||||||
| Liabilities, Redeemable Convertible Preferred Stock and
Stockholders’ |
||||||||||||||||
| Current liabilities: |
||||||||||||||||
| Accounts payable |
$ | 651 | $ | 338 | $ | 1,639 | ||||||||||
| Accrued expenses |
2,448 | 4,878 | 6,273 | |||||||||||||
| Accrued compensation |
14,184 | 18,482 | 14,178 | |||||||||||||
| Deferred revenue |
88,011 | 154,898 | 160,503 | |||||||||||||
| Other current liabilities |
955 | 1,750 | 1,822 | |||||||||||||
|
|
|
|
|
|
|
|||||||||||
| Total current liabilities |
106,249 | 180,346 | 184,415 | |||||||||||||
| Deferred revenue (net of current portion) |
19,436 | 70,920 | 70,111 | |||||||||||||
| Financing obligation |
— | 1,802 | 3,145 | |||||||||||||
| Other liabilities |
4,755 | 5,199 | 4,914 | |||||||||||||
|
|
|
|
|
|
|
|||||||||||
| Total liabilities |
130,440 | 258,267 | 262,585 | |||||||||||||
| Commitments and contingencies (Note 6) |
||||||||||||||||
| Redeemable convertible Series A preferred stock - par value: $0.01; 15,848 shares authorized, issued, and outstanding with liquidation preference of $50,000 at December 31, 2016, 2017, and March 31, 2018 (unaudited) |
49,913 | 49,935 | 49,940 | $ | — | |||||||||||
| Redeemable convertible Series B preferred stock - par value: $0.01; 42,000 shares authorized, 39,538 issued and outstanding with liquidation preference of $230,008 at December 31, 2016, 2017, and March 31, 2018 (unaudited) |
227,059 | 227,800 | 227,983 | — | ||||||||||||
| Stockholders’ deficit: |
||||||||||||||||
| Common stock - par value: $0.01; 94,000, 93,855 and 93,855 shares authorized at December 31, 2016, 2017, and March 31, 2018 (unaudited); 21,165, 24,472 and 24,794 shares issued and outstanding at December 31, 2016, 2017, and March 31, 2018 (unaudited); 80,360 shares issued and outstanding, pro forma, as of March 31, 2018 (unaudited) |
212 | 246 | 249 | 803 | ||||||||||||
| Additional paid-in capital |
11,017 | 20,676 | 23,363 | 300,732 | ||||||||||||
| Accumulated deficit |
(313,147 | ) | (392,587 | ) | (408,475 | ) | (408,475 | ) | ||||||||
|
|
|
|
|
|
|
|
|
|||||||||
| Total stockholders’ deficit |
(301,918 | ) | (371,665 | ) | (384,863 | ) | $ | (106,940 | ) | |||||||
|
|
|
|
|
|
|
|
|
|||||||||
| Total liabilities, redeemable convertible preferred stock and stockholders’ deficit |
$ | 105,494 | $ | 164,337 | $ | 155,645 | ||||||||||
|
|
|
|
|
|
|
|||||||||||
The accompanying notes are an integral part of these consolidated financial statements.
F-3
Table of Contents
TENABLE HOLDINGS, INC.
CONSOLIDATED STATEMENTS OF OPERATIONS AND COMPREHENSIVE LOSS
| Year Ended December 31, |
Three Months Ended March 31, |
|||||||||||||||
| (in thousands, except per share data) | 2016 | 2017 | 2017 | 2018 | ||||||||||||
| (unaudited) | (unaudited) | |||||||||||||||
| Revenue |
$ | 124,371 | $ | 187,727 | $ | 40,481 | $ | 59,107 | ||||||||
| Cost of revenue |
14,219 | 25,588 | 4,438 | 8,728 | ||||||||||||
|
|
|
|
|
|
|
|
|
|||||||||
| Gross profit |
110,152 | 162,139 | 36,043 | 50,379 | ||||||||||||
| Operating expenses: |
||||||||||||||||
| Sales and marketing |
85,736 | 116,299 | 26,168 | 39,588 | ||||||||||||
| Research and development |
40,085 | 57,673 | 12,458 | 17,185 | ||||||||||||
| General and administrative |
20,164 | 28,927 | 6,163 | 9,055 | ||||||||||||
|
|
|
|
|
|
|
|
|
|||||||||
| Total operating expenses |
145,985 | 202,899 | 44,789 | 65,828 | ||||||||||||
|
|
|
|
|
|
|
|
|
|||||||||
| Loss from operations |
(35,833 | ) | (40,760 | ) | (8,746 | ) | (15,449 | ) | ||||||||
| Other expense, net |
532 | 91 | 29 | 8 | ||||||||||||
|
|
|
|
|
|
|
|
|
|||||||||
| Loss before income taxes |
(36,365 | ) | (40,851 | ) | (8,775 | ) | (15,457 | ) | ||||||||
| Provision for income taxes |
843 | 171 | 51 | 431 | ||||||||||||
|
|
|
|
|
|
|
|
|
|||||||||
| Net loss and comprehensive loss |
(37,208 | ) | (41,022 | ) | (8,826 | ) | (15,888 | ) | ||||||||
| Accretion of Series A and B redeemable convertible preferred stock |
763 | 763 | 187 | 188 | ||||||||||||
|
|
|
|
|
|
|
|
|
|||||||||
| Net loss attributable to common stockholders |
$ | (37,971 | ) | $ | (41,785 | ) | $ | (9,013 | ) | $ | (16,076 | ) | ||||
|
|
|
|
|
|
|
|
|
|||||||||
| Net loss per share attributable to common stockholders, basic and diluted |
$ | (1.81 | ) | $ | (1.88 | ) | $ | (0.42 | ) | $ | (0.68 | ) | ||||
|
|
|
|
|
|
|
|
|
|||||||||
| Weighted-average shares used to compute net loss per share attributable to common stockholders, basic and diluted |
20,974 | 22,211 | 21,257 | 23,495 | ||||||||||||
|
|
|
|
|
|
|
|
|
|||||||||
| Pro forma net loss per share, basic and diluted (unaudited) |
$ | (0.53 | ) | $ | (0.20 | ) | ||||||||||
|
|
|
|
|
|||||||||||||
| Weighted-average shares used in computing pro forma net loss per share, basic and diluted (unaudited) |
77,597 | 78,881 | ||||||||||||||
|
|
|
|
|
|||||||||||||
The accompanying notes are an integral part of these consolidated financial statements.
F-4
Table of Contents
TENABLE HOLDINGS, INC.
CONSOLIDATED STATEMENTS OF REDEEMABLE CONVERTIBLE PREFERRED STOCK AND STOCKHOLDERS’ DEFICIT
| Redeemable Convertible Preferred Stock A |
Redeemable Convertible Preferred Stock B |
Common Stock |
Additional Paid-in Capital |
Accumulated Deficit |
Total Stockholders’ Deficit |
|||||||||||||||||||||||||||||||
| (in thousands) | Shares | Amount | Shares | Amount | Shares | Amount | ||||||||||||||||||||||||||||||
| Balance at December 31, 2015 |
15,848 | $ | 49,891 | 39,538 | $ | 226,318 | 20,670 | $ | 207 | $ | 8,870 | $ | (275,939 | ) | $ | (266,862 | ) | |||||||||||||||||||
| Accretion of Series A and B redeemable convertible preferred stock |
— | 22 | — | 741 | — | — | (763 | ) | — | (763 | ) | |||||||||||||||||||||||||
| Exercise of stock options |
— | — | — | — | 495 | 5 | 490 | — | 495 | |||||||||||||||||||||||||||
| Stock-based compensation |
— | — | — | — | — | — | 2,447 | — | 2,447 | |||||||||||||||||||||||||||
| Income tax benefit from stock options |
— | — | — | — | — | — | (27 | ) | — | (27 | ) | |||||||||||||||||||||||||
| Net loss |
— | — | — | — | — | — | — | (37,208 | ) | (37,208 | ) | |||||||||||||||||||||||||
|
|
|
|
|
|
|
|
|
|
|
|
|
|
|
|
|
|
|
|||||||||||||||||||
| Balance at December 31, 2016 |
15,848 | 49,913 | 39,538 | 227,059 | 21,165 | 212 | 11,017 | (313,147 | ) | (301,918 | ) | |||||||||||||||||||||||||
| Cumulative effect of adoptions of new accounting standards |
— | — | — | — | — | — | 61 | (38,418 | ) | (38,357 | ) | |||||||||||||||||||||||||
| Accretion of Series A and B redeemable convertible preferred stock |
— | 22 | — | 741 | — | — | (763 | ) | — | (763 | ) | |||||||||||||||||||||||||
| Issuance of restricted stock award |
— | — | — | — | 1,583 | 16 | (16 | ) | — | — | ||||||||||||||||||||||||||
| Exercise of stock options |
— | — | — | — | 1,870 | 19 | 3,001 | — | 3,020 | |||||||||||||||||||||||||||
| Repurchase of common stock |
— | — | — | — | (146 | ) | (1 | ) | (384 | ) | — | (385 | ) | |||||||||||||||||||||||
| Stock-based compensation |
— | — | — | — | — | — | 7,760 | — | 7,760 | |||||||||||||||||||||||||||
| Net loss |
— | — | — | — | — | — | — | (41,022 | ) | (41,022 | ) | |||||||||||||||||||||||||
|
|
|
|
|
|
|
|
|
|
|
|
|
|
|
|
|
|
|
|||||||||||||||||||
| Balance at December 31, 2017 |
15,848 | 49,935 | 39,538 | 227,800 | 24,472 | 246 | 20,676 | (392,587 | ) | (371,665 | ) | |||||||||||||||||||||||||
| Accretion of Series A and B redeemable convertible preferred stock (unaudited) |
— | 5 | — | 183 | — | — | (188 | ) | — | (188 | ) | |||||||||||||||||||||||||
| Exercise of stock options (unaudited) |
— | — | — | — | 322 | 3 | 476 | — | 479 | |||||||||||||||||||||||||||
| Stock-based compensation (unaudited) |
— | — | — | — | — | — | 2,399 | — | 2,399 | |||||||||||||||||||||||||||
| Net loss (unaudited) |
— | — | — | — | — | — | — | (15,888 | ) | (15,888 | ) | |||||||||||||||||||||||||
|
|
|
|
|
|
|
|
|
|
|
|
|
|
|
|
|
|
|
|||||||||||||||||||
| Balance at March 31, 2018 (unaudited) |
15,848 | $ | 49,940 | 39,538 | $ | 227,983 | 24,794 | $ | 249 | $ | 23,363 | $ | (408,475 | ) | $ | (384,863 | ) | |||||||||||||||||||
|
|
|
|
|
|
|
|
|
|
|
|
|
|
|
|
|
|
|
|||||||||||||||||||
The accompanying notes are an integral part of these consolidated financial statements.
F-5
Table of Contents
TENABLE HOLDINGS, INC.
CONSOLIDATED STATEMENTS OF CASH FLOWS
| Year Ended December 31, |
Three Months Ended March 31, |
|||||||||||||||
| (in thousands) | 2016 | 2017 | 2017 | 2018 | ||||||||||||
| (unaudited) |
(unaudited) | |||||||||||||||
| Cash flows from operating activities: |
||||||||||||||||
| Net loss |
$ | (37,208 | ) | $ | (41,022 | ) | $ | (8,826 | ) | $ | (15,888 | ) | ||||
| Adjustments to reconcile net loss to net cash (used in) provided by operating activities: |
||||||||||||||||
| Deferred income taxes |
635 | (873 | ) | 96 | — | |||||||||||
| Depreciation and amortization |
3,060 | 4,692 | 1,036 | 1,454 | ||||||||||||
| Stock-based compensation |
2,532 | 7,760 | 1,626 | 2,399 | ||||||||||||
| Other |
318 | 125 | (10 | ) | 80 | |||||||||||
| Changes in operating assets and liabilities: |
||||||||||||||||
| Accounts receivable |
(13,560 | ) | (14,769 | ) | 5,198 | 7,792 | ||||||||||
| Prepaid expenses and other current assets |
(605 | ) | (8,345 | ) | 691 | 1,196 | ||||||||||
| Deferred commissions |
(9,777 | ) | (20,058 | ) | (1,788 | ) | (276 | ) | ||||||||
| Other assets |
(1,856 | ) | (3,267 | ) | 169 | 730 | ||||||||||
| Accounts payable and accrued expenses |
825 | 1,922 | 1,004 | 2,612 | ||||||||||||
| Accrued compensation |
10,957 | 4,298 | (2,602 | ) | (4,303 | ) | ||||||||||
| Deferred revenue |
44,228 | 63,404 | 4,915 | 4,797 | ||||||||||||
| Other current liabilities |
(1,749 | ) | 421 | (195 | ) | 79 | ||||||||||
| Other liabilities |
(585 | ) | (554 | ) | (127 | ) | (168 | ) | ||||||||
|
|
|
|
|
|
|
|
|
|||||||||
| Net cash (used in) provided by operating activities |
(2,785 | ) | (6,266 | ) | 1,187 | 504 | ||||||||||
| Cash flows from investing activities: |
||||||||||||||||
| Purchases of property and equipment |
(5,776 | ) | (2,755 | ) | (460 | ) | (1,596 | ) | ||||||||
| Business combination |
(2,075 | ) | — | — | — | |||||||||||
|
|
|
|
|
|
|
|
|
|||||||||
| Net cash used in investing activities |
(7,851 | ) | (2,755 | ) | (460 | ) | (1,596 | ) | ||||||||
| Cash flows from financing activities: |
||||||||||||||||
| Proceeds from grant agreement |
1,000 | — | — | — | ||||||||||||
| Principal payments of capital lease obligations |
(47 | ) | (306 | ) | (39 | ) | (116 | ) | ||||||||
| Credit facility issuance costs |
— | (238 | ) | — | — | |||||||||||
| Proceeds from the exercise of stock options |
495 | 3,020 | 1,621 | 479 | ||||||||||||
| Repurchases of common stock |
(85 | ) | (385 | ) | (174 | ) | — | |||||||||
|
|
|
|
|
|
|
|
|
|||||||||
| Net cash provided by financing activities |
1,363 | 2,091 | 1,408 | 363 | ||||||||||||
| Effect of exchange rate changes on cash and cash equivalents |
— | (68 | ) | 7 | (57 | ) | ||||||||||
|
|
|
|
|
|
|
|
|
|||||||||
| Net (decrease) increase in cash, cash equivalents and restricted cash |
(9,273 | ) | (6,998 | ) | 2,142 | (786 | ) | |||||||||
| Cash, cash equivalents and restricted cash at beginning of period |
43,743 | 34,470 | 34,470 | 27,472 | ||||||||||||
|
|
|
|
|
|
|
|
|
|||||||||
| Cash, cash equivalents and restricted cash at end of period |
$ | 34,470 | $ | 27,472 | $ | 36,612 | $ | 26,686 | ||||||||
|
|
|
|
|
|
|
|
|
|||||||||
| Supplemental disclosure of cash flow information: |
||||||||||||||||
| Cash paid for interest |
$ | 6 | $ | 79 | $ | 4 | $ | 27 | ||||||||
| Cash paid for income taxes |
$ | 307 | $ | 642 | $ | 150 | $ | 197 | ||||||||
| Supplemental disclosure of non-cash investing and financing activities: |
||||||||||||||||
| Assets acquired under capital leases |
$ | 527 | $ | 1,311 | $ | 62 | $ | 9 | ||||||||
| Asset retirement obligations |
$ | — | $ | 764 | $ | 448 | $ | — | ||||||||
| Construction in progress |
$ | — | $ | 2,252 | $ | — | $ | 1,343 | ||||||||
The accompanying notes are an integral part of these consolidated financial statements.
F-6
Table of Contents
NOTES TO CONSOLIDATED FINANCIAL STATEMENTS
1. Business Description
Tenable Holdings, Inc. (the “Company,” “we,” or “our”) is a provider of Cyber Exposure solutions, which is a discipline for managing and measuring cybersecurity risk in the digital era. Our enterprise software platform enables broad visibility into an organization’s cyber exposure across the modern attack surface and deep insights that help organizations translate technical data into business insights to understand and reduce their cybersecurity risk.
2. Summary of Significant Accounting Policies
Basis of Presentation
The accompanying consolidated financial statements include the accounts of the Company and its wholly owned subsidiaries and have been prepared in conformity with United States generally accepted accounting principles (“U.S. GAAP”). All intercompany accounts and transactions have been eliminated in consolidation.
Use of Estimates
The preparation of consolidated financial statements in conformity with U.S. GAAP requires management to make estimates and assumptions that affect the amounts reported in the consolidated financial statements and accompanying notes. These estimates include, but are not limited to, the determination of the estimated economic life of perpetual licenses for revenue recognition, the estimated period of benefit for deferred commissions, useful lives of long-lived assets, the valuation of stock-based compensation, including the estimated underlying fair value of our common stock, and the valuation of deferred tax assets. We base these estimates on historical experience and on various other assumptions that are believed to be reasonable. Actual results could differ significantly from these estimates.
Unaudited Interim Consolidated Financial Information
The accompanying interim consolidated balance sheet as of March 31, 2018, the consolidated statements of operations and comprehensive loss and cash flows for the three months ended March 31, 2017 and 2018, and the consolidated statement of redeemable convertible preferred stock and stockholders’ deficit for the three months ended March 31, 2018 are unaudited. These interim consolidated financial statements have been prepared on a basis consistent with the annual consolidated financial statements and, in the opinion of management, include all adjustments necessary to fairly state our financial position as of March 31, 2018 and the results of our operations and cash flows for the three months ended March 31, 2017 and 2018. The financial data and other financial information disclosure in the notes to these consolidated financial statements related to the three-month periods are also unaudited. The results for the three months ended March 31, 2018 are not necessarily indicative of the operating results expected for the year ending December 31, 2018 or any future period.
Pro Forma Balance Sheet and Pro Forma Net Loss per Share (Unaudited)
All currently outstanding shares of redeemable convertible preferred stock will automatically convert into common stock upon the closing of a qualifying initial public offering. The accompanying pro forma consolidated balance sheet information has been prepared assuming the conversion of all outstanding shares of redeemable convertible preferred stock into 55,385,854 shares of common stock as of March 31, 2018. The unaudited pro forma net loss per share attributable to common stockholders has been computed to give effect to the conversion of the redeemable convertible preferred stock into common stock as though such qualifying initial public offering had occurred as of the beginning of the period presented.
F-7
Table of Contents
Foreign Currency
The functional currency for all of our foreign subsidiaries is the U.S. dollar. Assets and liabilities denominated in other currencies are remeasured into U.S. dollars at current exchange rates for monetary assets and liabilities and at historical exchange rates for non-monetary assets and liabilities. We bill our customers in U.S. dollars. Expenses incurred in non U.S. dollar currencies are remeasured into U.S. dollars when incurred. Remeasurement gains and losses in currencies other than the functional currency were $0.5 million and $0.1 million in 2016 and 2017, respectively, and are included as a component of other expense, net in the consolidated statements of operations and comprehensive loss. Remeasurement gains and losses were not material in the three months ended March 31, 2017 and 2018 (unaudited).
Fair Value of Financial Instruments
Fair value is defined as the price that would be received from selling an asset, or paid to transfer a liability, in an orderly transaction between market participants at the measurement date. We apply fair value accounting for all financial assets and liabilities that are recognized or disclosed at fair value in the financial statements on a recurring basis. The carrying amounts reported in the consolidated financial statements approximate fair value for cash and cash equivalents, accounts receivable, accounts payable and accrued expenses due to their short-term nature.
Concentrations
We sell our products and services through a channel network of distributors and resellers, along with our own sales teams. We derived 80%, 83%, 80% and 86% of revenue through our channel network in 2016, 2017 and the three months ended March 31, 2017 and 2018 (unaudited), respectively. One of our distributors accounted for 42%, 45%, 41% and 45% of revenue in 2016, 2017 and the three months ended March 31, 2017 and 2018 (unaudited), respectively. That same distributor accounted for 51% of accounts receivable at each of December 31, 2016 and 2017 and 45% at March 31, 2018 (unaudited).
Revenue Recognition
We early adopted Accounting Standards Codification (“ASC”) Topic 606, Revenue From Contracts With Customers (“ASC 606”), on January 1, 2017 using the modified retrospective method and applying the guidance to all contracts as of January 1, 2017. The most significant impact of adopting ASC 606 was the deferral of perpetual license revenue over an estimated economic life, including estimated maintenance renewal periods, whereas under the previous guidance we recognized perpetual license revenue upon delivery of the perpetual license. Additionally, the incremental costs of obtaining a contract with a customer are deferred, and will be amortized over a longer estimated period of benefit, whereas under previous guidance we amortized such costs over the contract term.
The adoption of ASC 606 resulted in a cumulative adjustment to increase our accumulated deficit by $38.4 million at January 1, 2017, which included a $55.0 million increase to deferred revenue, primarily related to the deferral of perpetual license revenue, offset by a $16.6 million increase to deferred commissions related to the longer estimated period of benefit compared to our historical practice. Of the $55.0 million increase to deferred revenue at January 1, 2017, $19.0 million was recognized as revenue in 2017, and $16.7 million, $11.8 million, $5.6 million and $1.9 million will be recognized as revenue in 2018, 2019, 2020 and 2021, respectively. The impact to revenue in 2017 was a net increase of $3.5 million after giving effect to the recognition of perpetual license revenue from prior year sales and the deferral of perpetual license revenue from 2017 sales.
The core principle of ASC 606 is that revenue should be recognized to depict the transfer of promised goods or services to customers in an amount that reflects the consideration to which the entity expects to be entitled in exchange for those goods or services. To achieve the core principle of ASC 606, we apply the following steps:
| • | Identify the contract with a customer |
F-8
Table of Contents
| • | Identify the performance obligations in the contract |
| • | Determine the transaction price |
| • | Allocate the transaction price to the performance obligations in the contract |
| • | Recognize revenue when or as performance obligations are satisfied |
We generate revenue from subscription arrangements for software and cloud-based solutions, perpetual licenses, maintenance associated with perpetual licenses, and professional services and other revenue. We begin to recognize revenue when control of our software or services is transferred to the customer, which for sales made through distributors is concurrent with the transfer to the end user.
The following table presents a summary of revenue (in thousands):
| Year Ended December 31, |
Three Months Ended March 31, |
|||||||||||||||
| 2016 | 2017 | 2017 | 2018 | |||||||||||||
| (unaudited) | ||||||||||||||||
| Subscription revenue |
$ | 80,399 | $ | 132,873 | $ | 27,702 | $ | 44,332 | ||||||||
| Perpetual license and maintenance revenue |
40,328 | 50,337 | 11,989 | 13,477 | ||||||||||||
| Professional services and other revenue |
3,644 | 4,517 | 790 | 1,298 | ||||||||||||
|
|
|
|
|
|
|
|
|
|||||||||
| Total revenue |
$ | 124,371 | $ | 187,727 | $ | 40,481 | $ | 59,107 | ||||||||
|
|
|
|
|
|
|
|
|
|||||||||
Subscription Revenue
Subscription arrangements generally have annual or multi-year contractual terms and allow customers to use our software or cloud solutions, including ongoing software updates and the ability to identify the latest cyber security vulnerabilities. Revenue is recognized ratably over the subscription term given the critical utility provided by the ongoing updates that are released throughout the contract period.
Perpetual License and Maintenance Revenue
Perpetual licenses are generally sold with one or more years of maintenance, which include ongoing software updates and the ongoing ability to identify the latest cyber security vulnerabilities. Given the critical utility provided by the ongoing software updates and updated ability to identify network vulnerabilities included in maintenance, we combine the perpetual license and the maintenance into a single performance obligation. Perpetual license arrangements generally contain a material right related to the customer’s ability to renew maintenance at a price that is less than the initial license fee. We apply a practical alternative to allocating a portion of the transaction price to the material right and estimate a hypothetical transaction price which includes fees for expected maintenance renewals based on the estimated economic life of the perpetual license contracts. We recognize the amount allocated to the combined license and maintenance performance obligation and the amount allocated to the material right over a five-year period, which represents the combination of the initial contractual period (generally one year) and the estimated number of contract renewals (generally four years). We have estimated this five-year economic life of perpetual license contracts based on historical contract attrition, expected renewal periods, the lifecycle of the our technology and other factors. We allocate the transaction price between the cybersecurity subscription provided in the initial contract and the material right related to expected contract renewals based on the hypothetical transaction price.
Professional Services and Other Revenue
Professional services and other revenue is primarily comprised of advisory services and training related to the deployment and optimization of our products. These services do not result in significant customization of our products. Professional services and other revenue is recognized as the services are performed.
Contracts with Multiple Performance Obligations
In cases where our contracts with customers contain multiple performance obligations, the contract transaction price is allocated on a relative standalone selling price basis. We typically determine standalone selling price based on observable selling prices of our products and services.
F-9
Table of Contents
Variable Consideration
We record revenue from sales at the net sales price, which is the transaction price, including estimates of variable consideration when applicable. Certain of our customers may be entitled to receive credits and in certain circumstances, refunds, if service level commitments are not met. We have not historically experienced significant incidents affecting the ability to meet these service level commitments and any estimated refunds related to these agreements have not been material.
Sales through our channel network of distributors and resellers are generally discounted as compared to the price that we would sell to an end user. Revenue for sales through our channel network is recorded net of any distributor or reseller margin.
Contract Balances
We generally bill our customers in advance and accounts receivable are recorded when we have the right to invoice the customer. Contract liabilities consist of deferred revenue and include customer billings and payments received in advance of performance under the contract. In 2017, we recognized revenue of $106.8 million that was included in the deferred revenue balance at the beginning of 2017. In the three months ended March 31, 2017 and 2018 (unaudited), we recognized revenue of $37.3 million and $54.2 million that was included in the deferred revenue balance at the beginning of 2017 and 2018, respectively.
Remaining Performance Obligations
At December 31, 2017 and March 31, 2018 (unaudited), the future estimated revenue related to unsatisfied performance obligations was $228.9 million and $237.1 million, respectively, with 69% of each such amount expected to be recognized as revenue over the succeeding twelve months, with the remainder expected to be recognized over the four years thereafter.
Impact of Adoption of ASC 606 on the 2017 Financial Statements
The following summarizes the impact of adopting ASC 606 on our consolidated statement of operations and comprehensive loss and balance sheet (in thousands):
| Year Ended December 31, 2017 | ||||||||||||
| Without Adoption of ASC 606 |
Effect of Change | As Reported | ||||||||||
| Statement of Operations and Comprehensive Loss |
||||||||||||
| Revenue |
$ | 184,263 | $ | 3,464 | $ | 187,727 | ||||||
| Operating expenses: |
||||||||||||
| Sales and marketing |
125,126 | (8,827 | ) | 116,299 | ||||||||
| Net loss and comprehensive loss |
(53,313 | ) | 12,291 | (41,022 | ) | |||||||
| December 31, 2017 | ||||||||||||
| Without Adoption of ASC 606 |
Effect of Change | As Reported | ||||||||||
| Balance Sheet |
||||||||||||
| Assets: |
||||||||||||
| Deferred commissions (current) |
$ | 15,779 | $ | 1,391 | $ | 17,170 | ||||||
| Deferred commissions (net of current portion) |
9,156 | 23,850 | 33,006 | |||||||||
| Liabilities: |
||||||||||||
| Deferred revenue (current) |
135,014 | 19,884 | 154,898 | |||||||||
| Deferred revenue (net of current portion) |
39,497 | 31,423 | 70,920 | |||||||||
| Stockholders’ deficit: |
||||||||||||
| Accumulated deficit |
(366,521 | ) | (26,066 | ) | (392,587 | ) | ||||||
F-10
Table of Contents
Legacy Revenue Accounting Policies
For periods prior to January 1, 2017, we recognized revenue when all the following criteria were met: (1) persuasive evidence of an arrangement exists, (2) delivery has occurred, (3) the fee is fixed or determinable and (4) collectability is reasonably assured.
We recognized subscription revenue ratably over the term of the subscription period in accordance with ASC 605, Revenue Recognition. When subscription arrangements involved multiple elements that qualified as separate units of accounting, we allocated arrangement consideration at the inception of the arrangement to all deliverables based on the relative selling price method in accordance with the selling price hierarchy, which included (i) vendor-specific objective evidence (VSOE) if available, (ii) third-party evidence (TPE) if VSOE was not available, and (iii) best estimate of selling price (BESP) if neither VSOE nor TPE were available. When VSOE could not be established for deliverables within subscription arrangements, we utilized BESP in our allocation of arrangement consideration, as we generally could not establish TPE. BESP was determined by considering multiple factors including, but not limited to, prices charged for similar offerings, market conditions, competitive landscape, and pricing practices.
We recognized perpetual license revenue upon delivery of the license in accordance with ASC 985-605, Software—Revenue Recognition. We established VSOE of fair value for substantially all products and services with the exception of new subscription agreements and perpetual licenses. VSOE was established for maintenance and support based upon actual renewals and historical pricing when sold separately. Revenue from maintenance agreements was deferred and recognized ratably over the term of the maintenance period. The VSOE of fair value for professional services was based on the price for these same services when they were sold separately.
Other services revenue was recognized as the services were performed.
Cash and Cash Equivalents
We consider all highly liquid financial instruments with an original maturity of three months or less when purchased to be cash equivalents.
Accounts Receivable
Accounts receivable are recorded at the invoiced amount, less an allowance for doubtful accounts, and do not bear interest. We maintain an allowance for doubtful accounts at an amount estimated to be sufficient to cover the risk of collecting less than full payment of the receivables. At each balance sheet date, we evaluate our receivables and assess the allowance for doubtful accounts based on specific customer collection issues and historical write-off trends.
Deferred Commissions
In connection with our adoption of ASC 606, sales commissions, including related incremental fringe benefit costs, are considered to be incremental costs of obtaining a contract. Sales commissions on initial sales are not commensurate with sales commissions on contract renewals and therefore are recognized over an estimated period of benefit, which ranges between three and four years for subscription arrangements and five years for perpetual license arrangements. We estimated the period of benefit based on the expected contract term including renewal periods, the lifecycle of our technology, and other factors. Sales commissions on contract renewals are capitalized and amortized ratably over the contract term, with the exception of contracts with renewal periods that are one year or less, in which case the incremental costs are expensed as incurred.
F-11
Table of Contents
The following summarizes the activity of deferred incremental costs of obtaining a contract (in thousands):
| Year Ended December 31, |
Three Months Ended March 31, |
|||||||||||
| 2017 | 2017 | 2018 | ||||||||||
| (unaudited) | ||||||||||||
| Beginning balance |
$ | 30,118 | $ | 30,118 | $ | 50,176 | ||||||
| Capitalization of contract acquisition costs |
34,632 | 4,604 | 5,147 | |||||||||
| Amortization of deferred contract acquisition costs |
(14,574 | ) | (2,816) | (4,872 | ) | |||||||
|
|
|
|
|
|
|
|||||||
| Ending balance |
$ | 50,176 | $ | 31,906 | $ | 50,451 | ||||||
|
|
|
|
|
|
|
|||||||
Amortization of deferred contract acquisition costs is included in sales and marketing expense in the consolidated statements of operations and comprehensive loss.
Prior to January 1, 2017, we capitalized sales commissions and recognized the expense over the corresponding period in which the related revenue was recognized. Commissions on perpetual license sales were recognized upon the delivery of the license.
Property and Equipment, net
Property and equipment, net is stated at historical cost less accumulated depreciation. Depreciation is computed using the straight-line method over the estimated useful lives of the assets: three years for computer software and equipment and five years for furniture and fixtures. Assets acquired under capital leases and leasehold improvements are amortized using the straight-line method over the shorter of the estimated useful lives of the assets or the terms of the respective leases. Amortization of assets acquired under capital leases is included in depreciation expense. Repairs and maintenance costs are expensed as incurred.
Construction in Progress
In October 2017, we entered into a lease for our new corporate headquarters, which is currently being constructed in Columbia, Maryland. The lease has an anticipated start date in the third quarter of 2019 with a 12-year initial term and $68.2 million of lease payments. Under current accounting guidance for build-to-suit lease arrangements, we concluded that we are the deemed owner of the building during the construction period. Accordingly, we recorded a construction-in-progress asset of $2.3 million and $3.6 million for which there is a corresponding construction financing obligation of $1.8 million and $3.1 million, in each case net of a $0.5 million deposit, recorded in the consolidated balance sheets at December 31, 2017 and March 31, 2018 (unaudited), respectively. We will continue to increase the construction-in-progress asset and corresponding long-term liability as additional building costs are incurred by the landlord during the construction period. Upon completion of the construction, we will evaluate whether or not this arrangement meets the criteria for sale-leaseback accounting treatment.
Impairment of Long-Lived Assets
We evaluate our long-lived assets for impairment whenever events or changes in circumstance indicate that the carrying amount may not be fully recoverable. Recoverability of the long-lived assets is measured by a comparison of the carrying amount of the assets to future undiscounted net cash flows expected to be generated by the assets. If such assets are considered to be impaired, the impairment to be recognized is measured as the excess of the carrying amount over the fair value. There was no impairment of long-lived assets in 2016, 2017 and the three months ended March 31, 2018 (unaudited).
F-12
Table of Contents
Business Combinations
We account for business combinations by recognizing the fair value of acquired assets and liabilities. The excess purchase consideration over the fair value of acquired assets and liabilities is recorded as goodwill. Acquisition-related transaction costs are expensed as incurred.
When determining the fair value of assets acquired and liabilities assumed, we make estimates and assumptions, especially with respect to intangible assets. Estimates in valuing certain identifiable assets include, but are not limited to, expected long-term market growth, future expected operating expenses, costs of capital, and appropriate discount rates. Our estimate of fair value is based upon assumptions we believe to be reasonable, but which are inherently uncertain and, as a result, actual results may differ from estimates.
In September 2016, we purchased the technology and related assets of a company whose software performs vulnerability and malware detection, along with continuous monitoring, for containers. The purchase consideration was $2.1 million in cash, which included $1.8 million of purchased technology and $0.3 million of goodwill. No tangible assets were acquired. Acquisition-related costs were not material.
Goodwill
We perform our annual impairment assessment on October 1, or more frequently, when events or circumstances indicate impairment may have occurred. We operate as one reporting unit, and have elected to first assess qualitative factors to determine whether it is more likely than not that the fair value of the Company as a whole is less than its carrying amount, including goodwill. The qualitative assessment includes an evaluation of relevant events and circumstances, including macroeconomic, industry and market conditions, our overall financial performance, and trends in the value of our common stock. Based on our annual impairment test on October 1, 2017, we concluded it was not more likely than not that goodwill was impaired.
Advertising
Advertising costs are expensed as they are incurred. We incurred advertising costs of $1.1 million, $3.2 million, $0.6 million and $0.8 million in 2016, 2017 and the three months ended March 31, 2017 and 2018 (unaudited), respectively, which was included in sales and marketing expense in the consolidated statements of operations and comprehensive loss.
Software Development Costs
Research and development costs to develop software to be sold, leased or marketed are expensed as incurred up to the point of technological feasibility for the related software product. We have not capitalized development costs for software to be sold, leased or marketed to date, as the software development process is essentially completed concurrent with the establishment of technological feasibility. As such, these costs are expensed as incurred and recognized in research and development costs in the consolidated statements of operations and comprehensive loss.
Software developed for internal use, with no substantive plans to market such software at the time of development, are capitalized. Costs incurred during the preliminary planning and evaluation and post implementation stages of the project are expensed as incurred. Costs incurred during the application development stage of the project are capitalized. In 2016 and 2017, capitalized costs related to software developed for internal use were immaterial. In the three months ended March 31, 2018 (unaudited), we capitalized $0.5 million of development costs related to internal use software.
Stock-Based Compensation
Stock-based compensation expense is calculated based on the fair value of the awards granted and is recognized on a straight-line basis over the requisite service period, which is generally three to four years. The
F-13
Table of Contents
fair value of each stock option award is estimated on the grant date using the Black-Scholes option pricing model, which requires us to make assumptions and judgements, including the fair value of the underlying common stock, expected term, expected volatility, and risk-free interest rates. The fair value of restricted stock is based on the estimated fair value of our common stock at the date of the grant.
Prior to January 1, 2017, we recognized stock-based compensation expense net of estimated forfeitures. We adopted Accounting Standards Update (“ASU”) No. 2016-09 – Compensation-Stock Compensation (Topic 718) (“ASU 2016-09”) on January 1, 2017 and made an accounting policy election to account for forfeitures as they occur. This election was applied on a modified retrospective basis resulting in a cumulative-effect adjustment to increase accumulated deficit by $0.1 million. ASU 2016-09 also requires excess tax benefits and tax deficiencies to be recorded in the income statement as opposed to additional paid-in capital when the awards vest or are settled, and we applied this on a prospective basis beginning on January 1, 2017. In addition, ASU 2016-09 eliminated the requirement that excess tax benefits be realized before they can be recorded. As a result, on January 1, 2017, we recorded a deferred tax asset of $1.9 million attributable to excess tax benefits from stock-based compensation, which had not been previously recognized, with a corresponding increase to the valuation allowance.
Leases and Asset Retirement Obligations
We lease facilities and equipment under operating or capital lease arrangements and recognize rent expense on a straight-line basis over the lease term beginning on the date that the legal right to use and control the facility or equipment is obtained. Rent holidays, scheduled rent increases and lease incentives are included in the determination of rent expense to be recorded over the lease term.
A liability is established at the inception of a lease, as needed, for the present value of estimated future costs to return the leased space to its original condition at the termination or expiration of a lease. A corresponding asset is recorded as a fixed asset in the period in which the obligation is incurred. Such assets are amortized over the estimated useful life of the asset and the recorded liabilities are accreted to the future value of the estimated retirement costs.
Net Loss per Share
We calculate basic and diluted net loss per share attributable to common stockholders in conformity with the two-class method required for participating securities. We consider our Series A and B redeemable convertible preferred stock to be participating securities as in the event a dividend is paid on common stock, the holders of our Series A and B redeemable convertible preferred stock would be entitled to receive dividends on a basis consistent with the common stockholders. Under the two-class method, the net loss attributable to common stockholders is not allocated to the redeemable convertible preferred stock as the holders of our redeemable convertible preferred stock do not have a contractual obligation to share in losses.
Under the two-class method, basic net loss per share attributable to common stockholders is computed by dividing the net loss attributable to common stockholders by the weighted-average number of shares of common stock outstanding during the period. Net loss attributable to common stockholders is calculated by adjusting net loss by the current period accretion of redeemable convertible preferred stock. Diluted earnings per share attributable to common stockholders is computed by giving effect to all potentially dilutive common stock equivalents in the period, including stock options, unvested restricted shares and redeemable convertible preferred stock. As we have reported losses for all periods presented, all potentially dilutive securities have been excluded from the calculation of diluted net loss per share attributable to common stockholders as their effect would be antidilutive.
Segment Information
We operate as one operating segment as our chief executive officer, who is our chief operating decision maker, reviews financial information on a consolidated basis for purposes of making operating decisions,
F-14
Table of Contents
allocating resources, and evaluating financial performance. We have presented geographical information about revenue and long-lived assets in Note 11.
Income Taxes
Income taxes are accounted for under the asset and liability method. This method requires recognition of deferred tax assets and liabilities for the expected future tax consequences of temporary differences between the financial statement carrying amounts and the tax basis of existing assets and liabilities, net operating loss carryforwards, and tax credit carryforwards. A valuation allowance is provided if it is more likely than not that some or all of the deferred tax assets will not be realized.
We recognize tax benefits from an uncertain tax position if it is more likely than not to be sustained upon audit by the relevant taxing authority. Interest and penalties associated with such uncertain tax positions are classified as a component of income tax expense.
Recently Adopted Accounting Pronouncements
On January 1, 2018, we adopted ASU No. 2016-18, “Restricted Cash” (“ASU 2016-18”), which requires that amounts generally described as restricted cash and restricted cash equivalents be presented with cash and cash equivalents when reconciling the beginning-of-period and end-of-period total amounts presented on an entity’s statement of cash flows. ASU No. 2016-18 must be applied using a retrospective transition method to each comparative period presented in an entity’s financial statements.
As a result of the adoption of ASU No. 2016-18, our restricted cash balance is now included in the beginning-of-period and end-of-period total amounts presented on the accompanying consolidated statements of cash flows. When compared to our previously issued statement of cash flows for 2017, the adoption of ASU No. 2016-18 resulted in: (i) a reduction of $0.3 million in cash used in operating activities and (ii) an increase of $0.3 million in the end-of-period total cash amount. Below is a table reconciling the beginning-of-period and end-of-period total cash amounts included in the consolidated balance sheets to the amounts presented in the consolidated cash flow statements (in thousands):
| December 31, | March 31, | |||||||||||||||
| 2016 | 2017 | 2017 | 2018 | |||||||||||||
| (unaudited) | ||||||||||||||||
| Cash and cash equivalents |
$ | 34,470 | $ | 27,210 | $ | 36,612 | $ | 26,424 | ||||||||
| Restricted cash classified in other assets (1): |
— | 262 | — | 262 | ||||||||||||
|
|
|
|
|
|
|
|||||||||||
| Cash and cash equivalents and restricted cash per the condensed consolidated statements of cash flows |
$ | 34,470 | $ | 27,472 | $ | 36,612 | $ | 26,686 | ||||||||
|
|
|
|
|
|
|
|
|
|||||||||
| (1) | Restricted cash pertains to an account established as collateral for a lease obligation. |
Recent Accounting Pronouncements Not Yet Adopted
In February 2016, the FASB issued ASU No. 2016-02 – Leases (Topic 842), which will require, among other items, lessees to recognize a right-of-use asset and a lease liability for most leases. ASU 2016-02 will be effective for fiscal years beginning after December 15, 2018 for public business entities and for fiscal years beginning after December 15, 2019 for private companies. Early adoption is permitted. We are currently evaluating the impact this guidance will have on our consolidated financial statements.
F-15
Table of Contents
3. Property and Equipment, Net
Property and equipment, net consisted of the following (in thousands):
| December 31, | March 31, | |||||||||||
| 2016 | 2017 | 2018 | ||||||||||
| (unaudited) | ||||||||||||
| Computer software and equipment |
$ | 9,485 | $ | 9,089 | $ | 10,056 | ||||||
| Furniture and fixtures |
1,806 | 2,102 | 2,211 | |||||||||
| Leasehold improvements |
5,051 | 6,452 | 6,659 | |||||||||
| Equipment under capital leases |
528 | 1,839 | 1,830 | |||||||||
|
|
|
|
|
|
|
|||||||
| Total |
16,870 | 19,482 | 20,756 | |||||||||
| Less: accumulated depreciation and amortization |
(7,009 | ) | (8,728 | ) | (9,741 | ) | ||||||
|
|
|
|
|
|
|
|||||||
| Property and equipment, net |
$ | 9,861 | $ | 10,754 | $ | 11,015 | ||||||
|
|
|
|
|
|
|
|||||||
Depreciation and amortization expense related to property and equipment was $2.9 million, $4.1 million, $0.9 million and $1.3 million in 2016, 2017 and the three months ended March 31, 2017 and 2018 (unaudited), respectively.
4. Intangible Assets, Net
Intangible assets consisted of $1.8 million of purchased technology, which is amortized over a three-year period. Accumulated amortization was $0.2 million, $0.8 million and $0.9 million at December 31, 2016 and 2017 and March 31, 2018 (unaudited), respectively.
Amortization of intangible assets was $0.2 million, $0.6 million, $0.2 million and $0.2 million in 2016, 2017 and the three months ended March 31, 2017 and 2018 (unaudited), respectively. As of December 31, 2017, estimated future amortization of intangible assets was $0.6 million and $0.4 million in 2018 and 2019, respectively. As of March 31, 2018 (unaudited), estimated future amortization was $0.4 million in each of the remainder of 2018 and 2019.
5. Debt
On May 4, 2017, we entered into a $25.0 million revolving credit facility (“Credit Facility”) with Silicon Valley Bank, which is available for use until May 4, 2020. The Credit Facility is intended to fund working capital and to provide increased liquidity and financial flexibility and bears interest at either LIBOR plus 2%, or the Prime Rate plus 1%. In addition, we pay quarterly in arrears 0.25% of the average unused portion. The Credit Facility is secured by a first priority security interest in all of our assets, with a negative pledge on our Intellectual Property, as defined in the credit agreement.
The Credit Facility contains certain restrictive covenants customary for facilities of this type including restrictions on indebtedness, liens, acquisitions and investments, restricted payments and dispositions. If, as of the last day of any quarter, the outstanding balance of the Credit Facility exceeds $5.0 million, there are financial covenants that require us to maintain a minimum level of earnings before income taxes, interest, depreciation and amortization (“EBITDA”) adjusted to add changes in deferred revenue for the period, and a minimum current ratio level. There were no borrowings under the Credit Facility in 2017 or the three months ended March 31, 2018 (unaudited).
F-16
Table of Contents
6. Commitments and Contingencies
Operating and Capital Leases
We have entered into various non-cancelable operating leases, primarily related to office real estate, that expire through 2022 and generally contain renewal options for up to five years. Rent expense was $2.5 million, $3.6 million, $0.7 million and $1.1 million in 2016, 2017 and the three months ended March 31, 2017 and 2018 (unaudited), respectively.
We also lease computer and office equipment under non-cancelable capital leases that expire through 2022. The total obligations for capital lease arrangements were $0.5 million, $1.5 million and $1.4 million at December 31, 2016 and 2017 and March 31, 2018 (unaudited), respectively.
Future minimum lease payments under non-cancelable operating and capital leases at December 31, 2017 were as follows (in thousands):
| Years ending December 31: |
||||
| 2018 |
$ | 4,397 | ||
| 2019 |
4,329 | |||
| 2020 |
4,375 | |||
| 2021 |
7,477 | |||
| 2022 |
6,207 | |||
| Thereafter |
57,852 | |||
|
|
|
|||
| Total future minimum lease payments |
$ | 84,637 | ||
|
|
|
Total future minimum lease payments at December 31, 2017 includes $68.2 million of future lease payments related to the lease of our new headquarters, which is currently being constructed in Columbia, Maryland. These lease payments are expected to commence in the first quarter of 2021.
Grant Agreements
We entered into a grant agreement in the form of a loan for $1.0 million with the State of Maryland in 2016 with a term ending on December 31, 2025. The borrowings bear interest at 3.0%. In addition, we entered into a grant agreement for $0.1 million with the Howard County Economic Development Authority in 2015 with a term ending on December 31, 2020. The total $1.1 million balance is included in other liabilities in our consolidated balance sheets. The proceeds of these grants were used as part of the further expansion of our current corporate headquarters. The conditions of these grants stipulate that principal and accrued interest will be forgiven if we achieve and maintain specified employment levels and we maintain our headquarters location in Howard County, Maryland through the end of the term.
7. Redeemable Convertible Preferred Stock and Common Stock
Redeemable Convertible Preferred Stock
In October 2012, Tenable, Inc. (now a wholly owned subsidiary of Tenable Holdings, Inc.) issued 15,847,500 shares of Series A redeemable convertible preferred stock at a price of $3.155067 per share, for an aggregate purchase price of $50 million, less $0.1 million in transaction costs. In December 2015, we issued 15,847,500 shares, par value of $0.01, of Series A redeemable convertible preferred stock (“Series A”) in exchange for Series A Convertible Preferred Stock of Tenable, Inc., in connection with a recapitalization. This exchange was made on a one for one basis. In addition, we authorized 42,000,000 shares and issued 39,538,354 shares, par value of $0.01, of Series B Convertible Preferred Stock (“Series B”) to certain investors at a price of $5.81735 per share. The gross purchase price was $230.0 million and we incurred transaction costs of $3.7 million. These proceeds were used to repurchase 39,387,322 shares of Tenable, Inc.’s common stock from its former stockholders in connection with the recapitalization.
F-17
Table of Contents
Series A and Series B (together, the “Redeemable Convertible Preferred Stock”) convert 1:1 to common stock at the option of the holder, subject to adjustments for stock dividends, splits, combinations and similar events. In the event of any liquidation, dissolution or winding up of the Company, the proceeds would be paid such that Series A will receive one times the Series A original purchase price plus declared and unpaid dividends on each share. Thereafter, Series B will receive one times the Series B original purchase price, plus declared and unpaid dividends on each share. No dividends have been declared or paid to date, and there are no cumulative dividends. The Redeemable Convertible Preferred Stock will be entitled to dividends at the discretion of the Board of Directors. Thereafter, Series A participates with common stock pro rata on an as-converted basis until the holders of Series A receive an aggregate of three times the Series A original purchase price. Thereafter, the remaining proceeds will be paid to the holders of common stock on a pro-rata basis including any conversions of Redeemable Convertible Preferred Stock to common stock.
A dissolution, merger or consolidation (other than one in which our stockholders own a majority by voting power of the outstanding shares of the surviving or acquiring corporation), a sale, lease, transfer, exclusive license or other disposition of all or substantially all of our assets, or a series of related transactions in which a majority of the total of outstanding voting power is transferred will be treated as a liquidation event, thereby triggering payment of the liquidation preferences described above unless the holders of 60% of the Redeemable Convertible Preferred Stock elect otherwise.
The shares of Redeemable Convertible Preferred Stock vote together with the common stock on an as-converted basis and not as a separate class.
In the event that we issue additional securities at a purchase price less than the Series A or Series B conversion price, such conversion price shall be adjusted pursuant to a broad-based weighted average anti-dilution formula. Each share of Redeemable Convertible Preferred Stock will automatically convert into common stock at the then applicable conversion rate in the event of the closing of a qualifying firm commitment underwritten public offering, which is defined as an offering of our common stock to the public at a price of at least $17.45 per share, that results in gross proceeds of at least $75 million. In addition, each share of a series of Redeemable Convertible Preferred Stock will automatically convert into common stock at the then applicable conversion rate for such series upon the vote or written consent of holders of at least 60% of such series.
The Redeemable Convertible Preferred Stock is redeemable after December 18, 2020 at the option of at least 60% of the holders of Series A or Series B at an amount equal to the Series A original purchase price for Series A holders or Series B original purchase price for Series B holders, plus all declared but unpaid dividends. If redeemed, redemption would occur in three equal annual installments. All shares of Series A or Series B Convertible Preferred Stock would be redeemed in any such redemption.
We are accreting the Redeemable Convertible Preferred Stock to the redemption price at the redemption date using the effective interest method.
Common Stock
The voting, dividend, and liquidation rights of common stockholders are subject to, and qualified by, the rights of preferred stockholders. The common stockholders are entitled to receive dividends when, as and if, declared by the Board of Directors, subject to preferential dividend rights of preferred stockholders. Upon dissolution or liquidation, our common stockholders will be entitled to receive all assets available for distribution to stockholders, subject to preferential rights of preferred stockholders.
8. Stock-Based Compensation
We have various stock incentive plans under which we have issued stock-based awards. Stock options granted under our stock incentive plans have a maximum term of ten years, generally vest over a period of three to four years, and the exercise price cannot be less than the fair market value on the date of grant. There were
F-18
Table of Contents
522,759 shares available for grant at December 31, 2017. In February 2018, the Board of Directors approved an increase of 3.0 million shares available for grant under the 2016 Plan. There were 2,557,234 shares available for grant at March 31, 2018 (unaudited).
A summary of our stock option activity is presented below:
| Number of Shares |
Weighted Average Exercise Price |
Weighted Average Remaining Contractual Term (in years) |
Aggregate Intrinsic Value |
|||||||||||||
| (dollars in thousands, except for per share data and years) | ||||||||||||||||
| Outstanding at December 31, 2015 |
7,616 | $ | 2.15 | 7.4 | $ | 17,237 | ||||||||||
| Granted |
2,800 | 4.15 | ||||||||||||||
| Exercised |
(495 | ) | 1.00 | 1,567 | ||||||||||||
| Forfeited/canceled |
(585 | ) | 2.84 | |||||||||||||
|
|
|
|||||||||||||||
| Outstanding at December 31, 2016 |
9,336 | 2.77 | 7.2 | 15,374 | ||||||||||||
| Granted |
9,022 | 5.22 | ||||||||||||||
| Exercised |
(1,870 | ) | 1.62 | 7,667 | ||||||||||||
| Forfeited/canceled |
(1,915 | ) | 3.21 | |||||||||||||
|
|
|
|||||||||||||||
| Outstanding at December 31, 2017 |
14,573 | 4.38 | 8.2 | 77,020 | ||||||||||||
| Granted (unaudited) |
1,165 | 10.97 | ||||||||||||||
| Exercised (unaudited) |
(322 | ) | 1.49 | 3,049 | ||||||||||||
| Forfeited/canceled (unaudited) |
(199 | ) | 5.04 | |||||||||||||
|
|
|
|||||||||||||||
| Outstanding at March 31, 2018 (unaudited) |
15,217 | 4.93 | 8.2 | 91,880 | ||||||||||||
|
|
|
|||||||||||||||
| Exercisable at December 31, 2017 |
3,557 | 2.50 | 5.7 | 25,468 | ||||||||||||
|
|
|
|||||||||||||||
| Exercisable at March 31, 2018 (unaudited) |
4,818 | 3.10 | 6.7 | 37,890 | ||||||||||||
At December 31, 2017 and March 31, 2018 (unaudited), there were 14.6 million and 15.2 million stock options that were vested and expected to vest, respectively, with a weighted average exercise price of $4.38 and $4.93 per share, respectively, a weighted average remaining contractual term of 8.2 years and an aggregate intrinsic value of $77.0 million and $91.9 million, respectively.
We granted stock options to employees in 2016, 2017 and the three months ended March 31, 2017 and 2018 (unaudited), that vest over three to four years and had a weighted average grant date fair value of $2.03, $2.48, $2.03 and $5.07, respectively. Estimating the fair value of stock options using the Black-Scholes option-pricing model require assumptions as to the fair value of our underlying common stock, the estimated term of the option, the risk free interest rates, the expected volatility of the price of our common stock, and the expected dividend yield.
Fair Value of Common Stock—The lack of an active public market for our common stock requires an estimate of the fair value of the common stock for granting stock options and restricted shares, and for determining stock-based compensation expense. Contemporaneous third-party valuations were obtained to assist in determining the fair value of our common stock. The contemporaneous valuations were performed in accordance with applicable methodologies, approaches and assumptions of the technical practice-aid issued by the American Institute of Certified Public Accountants Practice Aid entitled Valuation of Privately-Held Company Equity Securities Issued as Compensation. Factors considered in connection with estimating the fair value of our common stock included:
| • | The results of independent third-party valuations of our common stock |
| • | Recent arm’s length transactions involving the sale or transfer of our common stock |
F-19
Table of Contents
| • | The rights, preferences, and privileges of our Series A and Series B redeemable convertible preferred stock relative to those of our common stock |
| • | Our historical financial results and future financial projections |
| • | The market value of equity interests in substantially similar businesses, which equity interests can be valued through nondiscretionary, objective means |
| • | The lack of marketability of our common stock |
| • | The likelihood of achieving a liquidity event, such as an initial public offering given prevailing market conditions |
| • | Industry outlook |
| • | General economic outlook including economic growth, inflation and unemployment, interest rate environment and global economic trends |
Expected Term—This is the period of time that the options granted are expected to remain unexercised. We employ the simplified method to calculate the average expected term.
Expected Volatility—Volatility is a measure of the amount by which a financial variable, such as a share price, has fluctuated (historical volatility) or is expected to fluctuate (expected volatility) during a period. As we do not yet have sufficient history of our own volatility, we have identified several public entities of similar size, complexity, and stage of development and estimate volatility based on the volatility of these companies.
Risk-Free Interest Rate—This is the U.S. Treasury rate, having a term that most closely resembles the expected life of the stock option.
Expected Dividend Yield—We have never declared or paid dividends and has no plans to do so in the foreseeable future.
The fair value of each stock option was estimated on the grant date using the Black-Scholes option-pricing model, based on the following assumptions:
| Year Ended December 31, | Three Months Ended March 31, | |||||||||||||||
| 2016 | 2017 | 2017 | 2018 | |||||||||||||
| (unaudited) | ||||||||||||||||
| Expected term (in years) |
6.3 | 6.3 | 6.3 | 6.3 | ||||||||||||
| Expected volatility |
50.0%-50.1% | 45.2%-47.0% | 46.6%-47.0% | 43.30% | ||||||||||||
| Risk-free interest rate |
1.1%-1.5% | 1.9%-2.4% | 2.0%-2.1% | 2.7%-2.8% | ||||||||||||
| Expected dividend yield |
— | — | — | — | ||||||||||||
| Expected forfeiture rate |
1.4%-5.8% | — | — | — | ||||||||||||
In 2017, we granted 1.6 million shares of restricted stock with a weighted average grant date fair value of $4.25 per share. The grant date fair value was based on the estimated fair value of our common stock on the date of grant.
F-20
Table of Contents
Stock-based compensation expense included in the consolidated statements of operations and comprehensive loss was as follows (in thousands):
| Year Ended December 31, |
Three Months Ended March 31, |
|||||||||||||||
| 2016 | 2017 | 2017 | 2018 | |||||||||||||
| (unaudited) | ||||||||||||||||
| Cost of revenue |
$ | 223 | $ | 281 | $ | 54 | $ | 77 | ||||||||
| Sales and marketing |
969 | 1,579 | 270 | 602 | ||||||||||||
| Research and development |
602 | 1,782 | 394 | 527 | ||||||||||||
| General and administrative |
738 | 4,118 | 908 | 1,193 | ||||||||||||
|
|
|
|
|
|
|
|
|
|||||||||
| Total stock-based compensation expense |
$ | 2,532 | $ | 7,760 | $ | 1,626 | $ | 2,399 | ||||||||
|
|
|
|
|
|
|
|
|
|||||||||
At December 31, 2017 and March 31, 2018 (unaudited), the total unrecognized stock-based compensation expense related to outstanding stock options was $21.7 million, and $25.2 million, respectively, which was expected to be recognized over an estimated remaining weighted average period of 3.1 years.
At December 31, 2017 and March 31, 2018 (unaudited), the unrecognized stock-based compensation expense related to the unvested restricted stock expected to vest was $5.0 million, and $4.6 million, respectively, which was expected to be recognized over an estimated remaining period of 3.0 years and 2.8 years, respectively.
9. Net Loss Per Share Attributable to Common Stockholders
The following table sets forth the computation of basic and diluted net loss per share attributable to common stockholders (in thousands, except per share data):
| Year Ended December 31, |
Three Months Ended March 31, |
|||||||||||||||
| 2016 | 2017 | 2017 | 2018 | |||||||||||||
| (unaudited) | ||||||||||||||||
| Net loss attributable to common stockholders |
$ | (37,971 | ) | $ | (41,785 | ) | $ | (9,013 | ) | $ | (16,076 | ) | ||||
|
|
|
|
|
|
|
|
|
|||||||||
| Weighted-average common shares outstanding, basic and diluted |
20,974 | 22,211 | 21,257 | 23,495 | ||||||||||||
|
|
|
|
|
|
|
|
|
|||||||||
| Net loss per share attributable to common stockholders, basic and diluted |
$ | (1.81 | ) | $ | (1.88 | ) | $ | (0.42 | ) | $ | (0.68 | ) | ||||
|
|
|
|
|
|
|
|
|
|||||||||
The following potentially dilutive securities have been excluded, from the diluted per share calculations because they would have been antidilutive (in thousands):
| Year Ended December 31, |
Three Months Ended March 31, |
|||||||||||||||
| 2016 | 2017 | 2017 | 2018 | |||||||||||||
| (unaudited) | ||||||||||||||||
| Redeemable convertible preferred stock |
55,386 | 55,386 | 55,386 | 55,386 | ||||||||||||
| Stock options |
9,336 | 14,573 | 14,212 | 15,217 | ||||||||||||
| Restricted shares |
— | 1,583 | 1,583 | 1,187 | ||||||||||||
|
|
|
|
|
|
|
|
|
|||||||||
| Total |
64,722 | 71,542 | 71,181 | 71,790 | ||||||||||||
|
|
|
|
|
|
|
|
|
|||||||||
F-21
Table of Contents
Pro Forma Net Loss Per Share (Unaudited)
The following table presents the calculation of pro forma basic and diluted net loss per share attributable to common stockholders, giving effect to the conversion of our redeemable convertible preferred stock into common stock as though the conversion occurred at the beginning of the period (in thousands, except per share data):
| Year Ended December 31, 2017 |
Three Months Ended March 31, 2018 |
|||||||
| (unaudited) | (unaudited) | |||||||
| Numerator: |
||||||||
| Net loss attributable to common stockholders |
$ | (41,785 | ) | $ | (16,076 | ) | ||
| Accretion of redeemable convertible preferred stock |
763 | 188 | ||||||
|
|
|
|
|
|||||
| Net loss |
$ | (41,022 | ) | $ | (15,888 | ) | ||
|
|
|
|
|
|||||
| Denominator: |
||||||||
| Weighted-average common shares outstanding, basic and diluted |
22,211 | 23,495 | ||||||
| Pro forma adjustment to reflect conversion of redeemable convertible preferred stock |
55,386 | 55,386 | ||||||
|
|
|
|
|
|||||
| Weighted-average shares used to compute pro forma net loss per share attributable to common stockholders, basic and diluted |
77,597 | 78,881 | ||||||
|
|
|
|
|
|||||
| Pro forma net loss attributable to common stockholders, basic and diluted |
$ | (0.53 | ) | $ | (0.20 | ) | ||
|
|
|
|
|
|||||
10. Income Taxes
U.S. and international components of loss before income taxes were as follows (in thousands):
| Year Ended December 31, |
||||||||
| 2016 | 2017 | |||||||
| U.S. loss |
$ | (40,330 | ) | $ | (29,357 | ) | ||
| Foreign income (loss) |
3,965 | (11,494 | ) | |||||
|
|
|
|
|
|||||
| Total loss before income taxes |
$ | (36,365 | ) | $ | (40,851 | ) | ||
|
|
|
|
|
|||||
The components of the provision for income taxes were as follows (in thousands):
| Year Ended December 31, |
||||||||
| 2016 | 2017 | |||||||
| Current |
||||||||
| Federal |
$ | (71 | ) | $ | 140 | |||
| State |
(80 | ) | 6 | |||||
| Foreign |
359 | 898 | ||||||
|
|
|
|
|
|||||
| Total current tax expense |
208 | 1,044 | ||||||
| Deferred |
||||||||
| Foreign |
635 | (873 | ) | |||||
|
|
|
|
|
|||||
| Total deferred tax expense (benefit) |
635 | (873 | ) | |||||
|
|
|
|
|
|||||
| Total provision for income taxes |
$ | 843 | $ | 171 | ||||
|
|
|
|
|
|||||
F-22
Table of Contents
The items accounting for the difference between income taxes computed at the federal statutory rate and our effective tax rate were as follows:
| Year Ended December 31, |
||||||||
| 2016 | 2017 | |||||||
| U.S. federal statutory tax rate |
34.0 | % | 34.0 | % | ||||
| State and local taxes |
4.9 | 2.4 | ||||||
| Research and development tax credit |
2.2 | 3.0 | ||||||
| Uncertain tax positions |
0.5 | (0.2 | ) | |||||
| Foreign tax rate differential |
1.4 | (4.0 | ) | |||||
| Transition tax |
— | (2.7 | ) | |||||
| Revaluation of U.S. deferred income taxes |
— | (34.5 | ) | |||||
| Valuation allowance |
(43.3 | ) | 2.7 | |||||
| Other |
(2.0 | ) | (1.1 | ) | ||||
|
|
|
|
|
|||||
| Effective tax rate |
(2.3 | )% | (0.4 | )% | ||||
|
|
|
|
|
|||||
We maintain a valuation allowance on U.S. federal and state net deferred tax assets as the realization of our deferred tax assets is dependent upon future earnings, if any, the timing and amount of which are uncertain.
The components of the deferred tax assets and liabilities were as follows (in thousands):
| Year Ended December 31, |
||||||||
| 2016 | 2017 | |||||||
| Deferred tax assets: |
||||||||
| Net operating loss |
$ | 18,591 | $ | 29,227 | ||||
| Deferred revenue |
3,244 | 14,327 | ||||||
| Tax credits |
2,811 | 4,112 | ||||||
| Deferred rent |
1,025 | 567 | ||||||
| Stock-based compensation |
1,413 | 663 | ||||||
| Accrued compensation |
258 | 415 | ||||||
| Other |
156 | 37 | ||||||
|
|
|
|
|
|||||
| Total deferred tax assets |
27,498 | 49,348 | ||||||
| Valuation allowance |
(22,750 | ) | (36,403 | ) | ||||
|
|
|
|
|
|||||
| Net deferred tax assets |
4,748 | 12,945 | ||||||
| Deferred tax liabilities: |
||||||||
| Deferred commissions |
(4,474 | ) | (12,306 | ) | ||||
| Property and equipment |
(875 | ) | (367 | ) | ||||
| Intangible assets |
(273 | ) | — | |||||
| Other |
— | (272 | ) | |||||
|
|
|
|
|
|||||
| Total deferred tax liabilities |
(5,622 | ) | (12,945 | ) | ||||
|
|
|
|
|
|||||
| Net deferred tax liabilities |
$ | (874 | ) | $ | — | |||
|
|
|
|
|
|||||
At December 31, 2017, we had net operating loss (“NOL”) carryforwards for federal, state and foreign tax purposes of $103.7 million, $38.6 million, and $18.4 million, respectively, which will begin to expire in 2030, as well as $5.1 million of federal, state and foreign research and development tax credits, foreign tax credits, minimum tax credits and certain states’ job creation tax credits. The federal research and development and foreign tax credits will begin to expire in 2032 and the state job creation tax credits will begin to expire in 2018.
F-23
Table of Contents
We recorded deferred tax assets of $21.0 million related to deferred revenue previously recognized for tax purposes, deferred tax liabilities of $6.3 million related to capitalizing commission and fringe benefit costs previously expensed for tax purposes, and a corresponding valuation allowance of $14.7 million from adopting ASC 606.
In 2016 we recorded a $15.7 million increase in our valuation allowance to offset the net increase in our deferred tax asset balances at December 31, 2016, primarily related to net operating losses. In 2017, we recorded a $13.7 million increase in our valuation allowance to offset the net increase in our deferred tax asset balances at December 31, 2017, which was comprised of a $14.7 million increase related to the adoption of ASC 606 described above, an $11.2 million increase primarily related to the increase in net operating losses and a $1.9 million increase related to the adoption of ASU 2016-09, offset by a $14.1 million reduction in deferred tax assets from the remeasurement of U.S. federal and state deferred tax assets resulting from the 2017 Tax Cuts and Jobs Act described below.
We are currently subject to the annual limitation under Section 382 and 383 of the Internal Revenue Code. We will not be precluded from realizing the NOL carryforward and tax credits but may be limited in the amount we could utilize in any given tax year in the event that the federal and state taxable income will exceed the limitation imposed by Section 382. The amount of the annual limitation is determined based on our value immediately prior to the ownership change. Subsequent ownership changes may further affect the limitation in future years.
At December 31, 2016 and 2017, the total amount of gross unrecognized tax benefits was $0.7 million and $1.2 million, respectively, which, if recognized, would impact our effective tax rate by $0.1 million in each year. Interest and penalties associated with uncertain tax positions recognized as a component of income tax expense were immaterial in 2016 and 2017.
The change of gross unrecognized tax benefits, excluding accrued interest were as follows (in thousands):
| Year Ended December 31, |
||||||||
| 2016 | 2017 | |||||||
| Unrecognized tax benefits at the beginning of the period |
$ | 663 | $ | 736 | ||||
| Additions for tax positions in the current year |
233 | 446 | ||||||
| Increase in prior year positions |
— | 30 | ||||||
| Decrease in prior year positions |
(160 | ) | (13 | ) | ||||
|
|
|
|
|
|||||
| Unrecognized tax benefits at the end of the period |
$ | 736 | $ | 1,199 | ||||
|
|
|
|
|
|||||
We file income tax returns in the United States, including various state jurisdictions. Our subsidiaries file income tax returns in various foreign jurisdictions. The tax years 2014 to 2017 remain open to examination by the major taxing jurisdictions in which we are subject to tax. At December 31, 2017, we were not under examination by the Internal Revenue Service or any state or foreign tax jurisdiction.
U.S. 2017 Tax Cuts and Jobs Act
On December 22, 2017, the Tax Cuts and Jobs Act (the “2017 Tax Act”) was enacted into law, and contains several significant changes, including the reduction of the corporate income tax rate from 35% to 21% effective January 1, 2018. As a result, we re-measured our U.S. federal and state deferred tax assets and liabilities to reflect the reduction to the federal tax rate. The re-measurement resulted in a reduction of $14.1 million to the U.S. federal and state deferred tax assets and a corresponding change in our valuation allowance.
The new legislation also includes a variety of other changes, such as a one-time repatriation tax on accumulated foreign earnings (“transition tax”), acceleration of business asset expensing and reduction in the amount of executive pay that could qualify as a tax deduction.
F-24
Table of Contents
The 2017 Tax Act also included international tax provisions that will affect us, including the favorable tax regime for taxing foreign derived intangible income. Additional international provisions include the global intangible low taxed income (“GILTI”) regime and the base erosion anti-abuse tax (“BEAT”).
The 2017 Tax Act includes a mandatory one-time tax on accumulated earnings of foreign subsidiaries, and as a result, all previously unremitted earnings are no longer subject to U.S. tax after 2017. We did not incur any cash taxes related to the one-time transition tax on the mandatory deemed repatriation of foreign earnings due to current period tax loss that the U.S. group generated. In determining the U.S. group taxable loss, we included the one-time deemed repatriation income of $1.8 million.
Depending on the jurisdiction, distributions of earnings could be subject to withholding taxes at rates applicable to the distributing jurisdiction. As we intend to continue to reinvest the earnings of foreign subsidiaries indefinitely, we did not provide for a U.S. income tax liability and foreign withholding taxes on undistributed foreign earnings of foreign subsidiaries. Our share of undistributed earnings of foreign subsidiaries that could be subject to foreign withholding taxes was immaterial at December 31, 2016 and 2017. As a result of the 2017 Tax Act, companies are no longer required to pay U.S. tax on dividends from foreign subsidiaries.
We are following the guidance in Securities and Exchange Commission Staff Accounting Bulletin 118 (“SAB 118”), which provides a company with the ability to record provisional amounts based on reasonable estimates that are subject to a measurement period of up to one year. At December 31, 2017, we have not yet completed the accounting for the tax effects of the enactment of the 2017 Tax Act; however, in certain cases, as described above, we have made a reasonable estimate of the effects on existing deferred tax balances and the one-time transition tax. No changes were made to these provisional amounts in the three months ended March 31, 2018. We will continue to evaluate the transition tax obligation and application of GILTI and have not yet made an election with regard to GILTI. Subsequent adjustments resulting from additional analysis may be recorded in 2018 when our analysis is expected to be completed.
11. Geographic Information
The following table summarizes the revenue by region based on address of the end user as specified in our subscription, license or service agreements (in thousands):
| Year Ended December 31, |
Three Months Ended March 31, |
|||||||||||||||
| 2016 | 2017 | 2017 | 2018 | |||||||||||||
| (unaudited) | ||||||||||||||||
| Americas |
$ | 92,377 | $ | 138,876 | $ | 30,474 | $ | 42,762 | ||||||||
| Europe, Middle East and Africa |
22,211 | 34,121 | 7,032 | 11,666 | ||||||||||||
| Asia Pacific |
9,783 | 14,730 | 2,975 | 4,679 | ||||||||||||
|
|
|
|
|
|
|
|
|
|||||||||
| Total revenue |
$ | 124,371 | $ | 187,727 | $ | 40,481 | $ | 59,107 | ||||||||
|
|
|
|
|
|
|
|
|
|||||||||
Customers located in the United States accounted for 69%, 69%, 71% and 67% of total revenue in 2016, 2017 and the three months ended March 31, 2017 and 2018, respectively. No other country accounted for 10% or more of revenue for the periods presented.
Our property and equipment, net by geographic area is summarized as follows:
| December 31, | March 31, | |||||||||||
| 2016 | 2017 | 2018 | ||||||||||
| (unaudited) | ||||||||||||
| United States |
$ | 7,154 | $ | 6,581 | $ | 6,500 | ||||||
| International |
2,707 | 4,173 | 4,515 | |||||||||
|
|
|
|
|
|
|
|||||||
| Total property and equipment, net |
$ | 9,861 | $ | 10,754 | $ | 11,015 | ||||||
|
|
|
|
|
|
|
|||||||
F-25
Table of Contents
12. Benefit Plans
We maintain a contributory defined contribution 401(k) plan for our U.S. employees. We adopted a Safe Harbor Plan effective January 1, 2016, and as a result, company-matched contributions are fully vested. Additional contributory plans are in effect internationally. Our contribution expense for such plans was $2.7 million, $3.3 million, $0.9 million and $1.2 million in 2016, 2017 and the three months ended March 31, 2017 and 2018 (unaudited), respectively.
13. Subsequent Events - Originally Issued Financial Statements
We have evaluated subsequent events through April 27, 2018, the date on which the accompanying consolidated financial statements were available to be issued.
14. Subsequent Events - Revised Financial Statements
As disclosed in Note 2, we revised our consolidated financial statements in connection with the retrospective adoption of ASU 2016-18. We have evaluated subsequent events through June 29, 2018, the date on which the revised financial statements were available to be issued.
In May 2018, we granted stock options to employees to purchase an aggregate of 736,500 shares of our common stock with an exercise price of $14.06 per share. The estimated future stock-based compensation expense of $4.6 million will be recognized over the four-year vesting period.
In June 2018, our Board of Directors and our stockholders approved an increase in the number of shares reserved for issuance under our 2016 Stock Incentive Plan by 4.0 million shares.
In June 2018, we granted stock options to employees to purchase an aggregate of 4,012,148 shares of our common stock with an exercise price of $16.21 per share. The estimated future stock-based compensation expense of $29.2 million will be recognized over the four-year vesting period.
In June 2018, we granted restricted stock units to employees for 973,800 shares of our common stock. The restricted stock units have both service-based and performance-based vesting conditions. The performance-based vesting condition will be satisfied upon the expiration of the lock-up period following the completion of an initial public offering of our common stock. If the performance condition is met, then a portion of the restricted stock units will vest in August 2019, with the remainder vesting in August 2020, in each case based on the employee’s continued service through the applicable vesting date. The estimated future stock-based compensation expense of $15.8 million will be recognized only if it is probable the performance-based vesting condition will be met, at which time the cumulative expense will be recognized for the portion related to prior service and the remaining stock-based compensation expense will be recognized over the remaining service period.
F-26
Table of Contents
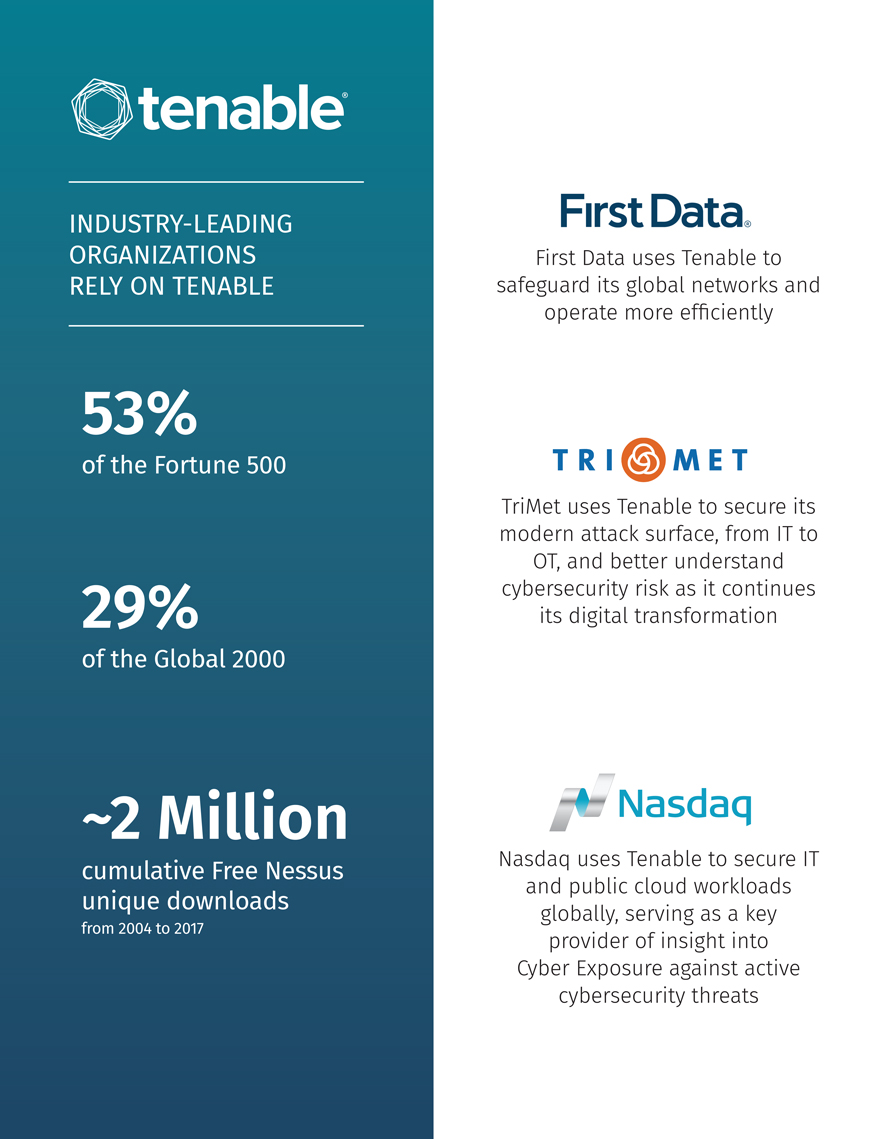
tenable® First Data uses Tenable to safeguard its global networks and operate more efficiently Nasdaq uses Tenable to secure IT and public cloud workloads globally, serving as a key provider of insight into Cyber Exposure against active cybersecurity threats TriMet uses Tenable to secure its modern attack surface, from IT to OT, and better understand cybersecurity risk as it continues its digital transformation First data, Nasdaq
Table of Contents
tenable®
Table of Contents
PART II
INFORMATION NOT REQUIRED IN PROSPECTUS
| Item 13. | Other Expenses of Issuance and Distribution. |
The following table sets forth all costs and expenses, other than underwriting discounts and commissions, payable by us in connection with the sale of the common stock being registered. All amounts shown are estimates except for the Securities and Exchange Commission, or SEC, registration fee, the Financial Industry Regulatory Authority, or FINRA, filing fee and the Nasdaq Global Market listing fee.
| Amount to be Paid |
||||
| SEC registration fee |
$ | 12,450 | ||
| FINRA filing fee |
15,500 | |||
| Nasdaq Global Market initial listing fee |
225,000 | |||
| Printing and engraving expenses |
* | |||
| Legal fees and expenses |
* | |||
| Accounting fees and expenses |
* | |||
| Transfer agent and registrar fees |
* | |||
| Miscellaneous fees and expenses |
* | |||
|
|
|
|||
| Total |
$ | * | ||
|
|
|
|||
| * | To be filed by amendment. |
| Item 14. | Indemnification of Directors and Officers. |
We are incorporated under the laws of the State of Delaware. Section 102 of the Delaware General Corporation Law permits a corporation to eliminate the personal liability of directors of a corporation to the corporation or its stockholders for monetary damages for a breach of fiduciary duty as a director, except where the director breached his or her duty of loyalty, failed to act in good faith, engaged in intentional misconduct or knowingly violated a law, authorized the payment of a dividend or approved a stock repurchase in violation of Delaware corporate law or obtained an improper personal benefit.
Section 145 of the Delaware General Corporation Law provides that a corporation has the power to indemnify a director, officer, employee or agent of the corporation and certain other persons serving at the request of the corporation in related capacities against expenses (including attorneys’ fees), judgments, fines and amounts paid in settlements actually and reasonably incurred by the person in connection with an action, suit or proceeding to which he or she is or is threatened to be made a party by reason of such position, if such person acted in good faith and in a manner he or she reasonably believed to be in or not opposed to the best interests of the corporation, and, in any criminal action or proceeding, had no reasonable cause to believe his or her conduct was unlawful, except that, in the case of actions brought by or in the right of the corporation, no indemnification shall be made with respect to any claim, issue or matter as to which such person shall have been adjudged to be liable to the corporation unless and only to the extent that the Court of Chancery or other adjudicating court determines that, despite the adjudication of liability but in view of all of the circumstances of the case, such person is fairly and reasonably entitled to indemnity for such expenses which the Court of Chancery or such other court shall deem proper.
As permitted by the Delaware General Corporation Law, our amended and restated bylaws will provide that: (1) we are required to indemnify our directors and executive officers to the fullest extent permitted by the Delaware General Corporation Law; (2) we may, in our discretion, indemnify our other officers, employees and agents as set forth in the Delaware General Corporation Law; (3) we are required, upon satisfaction of certain conditions, to advance all expenses incurred by our directors and executive officers in connection with certain
II-1
Table of Contents
legal proceedings; (4) the rights conferred in the bylaws are not exclusive; (5) we are authorized to enter into indemnification agreements with our directors, officers, employees and agents and (6) we may secure insurance on behalf of any director, officer, employee or other agent for any liability arising out of his or her actions in that capacity regardless of whether we would otherwise be permitted to indemnify him or her under the provisions of Delaware law.
Our policy is to enter into agreements with our directors and executive officers that require us to indemnify them against expenses, judgments, fines, settlements and other amounts that any such person becomes legally obligated to pay (including with respect to a derivative action) in connection with any proceeding, whether actual or threatened, to which such person may be made a party by reason of the fact that such person is or was a director or officer of us or any of our affiliates, provided such person acted in good faith and in a manner such person reasonably believed to be in, or not opposed to, our best interests. These indemnification agreements also set forth certain procedures that will apply in the event of a claim for indemnification thereunder. At present, no litigation or proceeding is pending that involves any of our directors or officers regarding which indemnification is sought, nor are we aware of any threatened litigation that may result in claims for indemnification.
We maintain a directors’ and officers’ liability insurance policy. The policy insures directors and officers against unindemnified losses arising from certain wrongful acts in their capacities as directors and officers and reimburses us for those losses for which we have lawfully indemnified the directors and officers. The policy contains various exclusions.
In addition, the underwriting agreement filed as Exhibit 1.1 to this registration statement provides for indemnification by the underwriters of us and our officers and directors for certain liabilities arising under the Securities Act of 1933, as amended, or the Securities Act, or otherwise. Our amended and restated investors’ rights agreement with certain stockholders filed as Exhibit 4.2 to this registration statement also provides for cross-indemnification in connection with the registration of our common stock on behalf of such investors.
See the undertakings set forth in response to Item 17 herein.
| Item 15. | Recent Sales of Unregistered Securities. |
The following list sets forth information regarding all unregistered securities issued by us since January 1, 2015 through the date of the prospectus that is a part of this registration statement. In December 2015, we effected a recapitalization in which we issued common stock and preferred stock in exchange for shares of our predecessor company, Tenable, Inc., and assumed certain options to purchase shares of common stock of Tenable, Inc., which became options to purchase shares of the registrant. The issuances both pursuant to and after our recapitalization are reflected below.
Issuances of Capital Stock
| • | In December 2015, we issued an aggregate of 20,670,193 shares of our common stock to accredited investors in exchange for the same number of shares of common stock of Tenable, Inc. in connection with our recapitalization. See “Prospectus Summary—Corporate Information” of the prospectus that is part of this registration statement. |
| • | In December 2015, we issued an aggregate of 15,847,500 shares of our Series A redeemable convertible preferred stock to accredited investors affiliated with Accel in exchange for the same number of shares of Series A redeemable convertible preferred stock of Tenable, Inc. in connection with our recapitalization further discussed in “Prospectus Summary—Corporate Information” of the prospectus that is part of this registration statement. |
| • | In December 2015, we issued an aggregate of 39,538,354 shares of our Series B redeemable convertible preferred stock to accredited investors affiliated with Accel and Insight Venture Partners, at a price per share of $5.81735, for aggregate consideration of $230.0 million. |
II-2
Table of Contents
The offers, sales and issuances of the securities described in this section were exempt from registration under the Securities Act in reliance on Section 4(a)(2) of the Securities Act or Rule 506 of Regulation D promulgated thereunder as a transaction by an issuer not involving a public offering. The recipients of securities in each of these transactions acquired the securities for investment only and not with a view to or for sale in connection with any distribution thereof, and appropriate legends were affixed to the securities issued in these transactions. Each of the recipients of securities in these transactions was either an accredited investor within the meaning of Rule 501 of Regulation D under the Securities Act or had adequate access, through employment, business or other relationships, to information about us.
Issuances of Equity Awards
From January 1, 2015 through the date of this registration statement:
| • | in connection with the recapitalization, options to purchase shares of common stock of Tenable, Inc. were assumed and converted into options to purchase an aggregate of 7,616,253 shares of our common stock to a total of 209 employees, consultants and directors; and |
| • | since the recapitalization, we have granted under our 2016 Plan options to purchase an aggregate of 17,735,839 shares of our common stock to a total of 557 employees, consultants and directors, having exercise prices ranging from $4.15 to $16.21 per share, a restricted stock award for 1,582,685 shares of our common stock to one employee and 973,800 restricted stock units to 932 employees. |
Of these, options to purchase an aggregate of 4,059,872 shares have been cancelled without being exercised and 5,358,128 shares were issued upon the exercise of stock options, at a weighted average exercise price of $1.17 per share, for aggregate proceeds of $6,290,340. In addition, restricted stock units for 1,800 shares have been cancelled prior to settlement. The offers, sales and issuances of the securities described in this section were exempt from registration either under Rule 701 promulgated under the Securities Act, in that the transactions were under written compensatory benefit plans and contracts relating to compensation, or under Section 4(a)(2) of the Securities Act in that the transactions were between an issuer and accredited investors and did not involve any public offering within the meaning of Section 4(a)(2). The recipients of such securities were our employees, directors or consultants and received the securities under our equity incentive plans. Appropriate legends were affixed to the securities issued in these transactions.
| Item 16. | Exhibits and Financial Statement Schedules. |
(a) Exhibits
| 1.1† | Form of Underwriting Agreement. | |
| 3.1 | Amended and Restated Certificate of Incorporation of Tenable Holdings, Inc., as amended and as currently in effect. | |
| 3.2 | Form of Amended and Restated Certificate of Incorporation of Tenable Holdings, Inc. to be effective upon closing of this offering. | |
| 3.3 | Bylaws of Tenable Holdings, Inc., as amended and as currently in effect. | |
| 3.4 | Form of Amended and Restated Bylaws of Tenable Holdings, Inc. to be effective upon closing of this offering. | |
| 4.1† | Form of Common Stock Certificate of Tenable Holdings, Inc. | |
| 4.2 | Investors’ Rights Agreement by and among Tenable Holdings, Inc. and certain of its stockholders, dated December 18, 2015. | |
| 5.1† | Opinion of Cooley LLP. | |
II-3
Table of Contents
| † | To be filed by amendment. |
| + | Indicates management contract or compensatory plan. |
| # | Confidential treatment requested as to certain portions, which portions have been omitted and filed separately with the Securities and Exchange Commission. |
(b) Financial Statement Schedules
No financial statement schedules are provided because the information called for is not required, not present in material amounts or is shown either in the consolidated financial statements or related notes, which are incorporated herein by reference.
II-4
Table of Contents
| Item 17. | Undertakings. |
The undersigned Registrant hereby undertakes to provide to the underwriters at the closing specified in the underwriting agreement, certificates in such denominations and registered in such names as required by the underwriters to permit prompt delivery to each purchaser.
Insofar as indemnification by the registrant for liabilities arising under the Securities Act may be permitted to directors, officers and controlling persons of the registrant pursuant to the foregoing provisions, or otherwise, the registrant has been advised that in the opinion of the SEC such indemnification is against public policy as expressed in the Securities Act and is, therefore, unenforceable. In the event that a claim for indemnification against such liabilities (other than the payment by the registrant of expenses incurred or paid by a director, officer or controlling person of the registrant in the successful defense of any action, suit or proceeding) is asserted by such director, officer or controlling person in connection with the securities being registered, the registrant will, unless in the opinion of its counsel the matter has been settled by controlling precedent, submit to a court of appropriate jurisdiction the question whether such indemnification by it is against public policy as expressed in the Securities Act and will be governed by the final adjudication of such issue.
The undersigned registrant hereby undertakes that:
(1) For purposes of determining any liability under the Securities Act, the information omitted from the form of prospectus filed as part of this Registration Statement in reliance upon Rule 430A and contained in a form of prospectus filed by the registrant pursuant to Rule 424(b)(1) or (4) or 497(h) under the Securities Act shall be deemed to be part of this Registration Statement as of the time it was declared effective.
(2) For the purpose of determining any liability under the Securities Act, each post-effective amendment that contains a form of prospectus shall be deemed to be a new registration statement relating to the securities offered therein, and the offering of such securities at that time shall be deemed to be the initial bona fide offering thereof.
II-5
Table of Contents
Pursuant to the requirements of the Securities Act of 1933, as amended, the Registrant has duly caused this Registration Statement to be signed on its behalf by the undersigned, thereunto duly authorized, in Columbia, Maryland, on the 29th day of June, 2018.
| By: | TENABLE HOLDINGS, INC. /s/ Amit Y. Yoran Amit Y. Yoran President, Chief Executive Officer and Chairman |
KNOW ALL BY THESE PRESENTS, that each person whose signature appears below hereby constitutes and appoints Amit Yoran, Stephen Vintz and Stephen A. Riddick, and each of them, his or her true and lawful agent, proxy and attorney-in-fact, with full power of substitution and resubstitution, for him or her and in his or her name, place and stead, in any and all capacities, to (1) act on, sign and file with the Securities and Exchange Commission any and all amendments (including post-effective amendments) to this registration statement together with all schedules and exhibits thereto and any subsequent registration statement filed pursuant to Rule 462(b) under the Securities Act of 1933, as amended, together with all schedules and exhibits thereto, (2) act on, sign and file such certificates, instruments, agreements and other documents as may be necessary or appropriate in connection therewith, (3) act on and file any supplement to any prospectus included in this registration statement or any such amendment or any subsequent registration statement filed pursuant to Rule 462(b) under the Securities Act of 1933, as amended, and (4) take any and all actions which may be necessary or appropriate to be done, as fully for all intents and purposes as he or she might or could do in person, hereby approving, ratifying and confirming all that such agent, proxy and attorney-in-fact or any of his substitutes may lawfully do or cause to be done by virtue thereof.
Pursuant to the requirements of the Securities Act of 1933, as amended, this Registration Statement has been signed by the following persons in the capacities and on the dates indicated.
| Signature |
Title |
Date | ||
| /s/ Amit Y. Yoran Amit Y. Yoran |
President, Chief Executive Officer and Chairman (Principal Executive Officer) |
June 29, 2018 | ||
| /s/ Stephen A. Vintz Stephen A. Vintz |
Chief Financial Officer (Principal Financial Officer and Principal Accounting Officer) |
June 29, 2018 | ||
| /s/ Arthur W. Coviello, Jr. Arthur W. Coviello, Jr. |
Director |
June 29, 2018 | ||
| /s/ Kimberly L. Hammonds Kimberly L. Hammonds |
Director |
June 29, 2018 | ||
| /s/ John C. Huffard Jr. John C. Huffard Jr. |
Chief Operating Officer, Co-Founder and Director | June 29, 2018 | ||
| /s/ Jerry M. Kennelly Jerry M. Kennelly |
Director |
June 29, 2018 | ||
| /s/ Ping Li Ping Li |
Director |
June 29, 2018 | ||
| /s/ A. Brooke Seawell A. Brooke Seawell |
Director |
June 29, 2018 | ||
| /s/ Richard M. Wells Richard M. Wells |
Director |
June 29, 2018 | ||