Attached files
| file | filename |
|---|---|
| EX-99.2 - EXHIBIT 99.2 - American Finance Trust, Inc | tv497757_ex99-2.htm |
| 8-K - FORM 8-K - American Finance Trust, Inc | tv497757_8k.htm |
Exhibit 99.1

June 2018 American Finance Trust Announces Listing (Ticker: AFIN)

American Finance Trust, Inc. 2 AFIN EXPECTS TO LIST ON NASDAQ Listing Overview NASDAQ: AFIN Anticipated listing to occur on or about July 19, 2018 $1.10 per share annual distribution (paid monthly) 50% of AFIN’s common shares will be freely tradable upon listing • 25% of AFIN’s common shares will be freely tradable 90 days following initial listing • Final 25% of AFIN’s common shares will be freely tradable 180 days following initial listing No shares will be sold in connection with the listing • Fully - Diluted Share Count: 106 million shares (1) The Board has authorized a share repurchase program of up to $200 million that the Company may implement, from time to time, following the listing (2) • The Company will have the ability to repurchase shares up to this amount at its discretion (2) Ticker Phased Liquidity Buyback Program Listing Date Distribution Rate No Capital Raise American Finance Trust expects to list its shares on NASDAQ to create liquidity and drive shareholder value x Superior portfolio of high - quality real estate assets with contractually embedded rent growth x Listing will provide liquidity, giving shareholders the option to sell shares for cash over time x Anticipated near - term index inclusions are expected to provide additional market support 1) As of 3/31/2018. Includes basic share count plus unvested restricted shares, OP Units, and Class B Units. 2) Subject to authorization by the Board prior to any repurchase. See Definitions and Forward Looking Statements in the appendix fo r further discussion.

American Finance Trust, Inc. 3 INVESTMENT HIGHLIGHTS High - Quality , Diversified Portfolio x Leases with high - quality, creditworthy tenants, reflected in the Company’s leading investment grade rated tenant metrics (1) x Diversification of single - tenant and multi - tenant assets mitigates exposure to individual property sector cycles Servic e Retail Property Focus x 82% of the single - tenant net lease portfolio is focused on service retail properties (restaurant, grocery, convenience store, etc.) that are more resistant to e - commerce vs. traditional retail (2) x Multi - tenant portfolio includes a proven balance of store concepts needed for a successful retail center, with 48% of rent from experiential / defensive properties vs. other traditional retail types Strong, Creditworthy Tenant Base x 88% of AFIN’s top ten tenants are investment grade rated (1) x Diverse tenant roster of top national tenants Scaled Platform Positioned for Growth x $3.5 billion in book value of assets x Rent escalators in 91% (3) of leases provide dependable, contractual rent growth x Multi - tenant portfolio occupancy of 88% provides embedded growth potential x Attractive acquisition pipeline of approximately $80 million net lease assets currently under contract Conservative Balance Sheet x Ample liquidity with sizable cash position and significant capacity from the Company’s newly upsized $415 million credit facility (4) x Conservative leverage of 36% net debt / gross asset value (5) x Strategically locked in attractive, long - term interest rates and mitigated interest rate risk with 95% fixed rate debt (6) Experienced Management Team x Proven track record with significant public REIT market experience x Fully - aligned management structure designed to reward strong operating performance x Lincoln Property Company is an experienced and proven property manager for the multi - tenant portfolio 1) As used herein, “Investment Grade Rating” for AFIN includes both actual investment grade ratings of the tenant or Implied Inv est ment Grade. Peers report tenants with actual investment grade ratings. See Definitions in the appendix for a full description . 2) Represents 56% of AFIN’s single - tenant portfolio using straight line rent (SLR) as of March 31, 2018. See Definitions in the appendix for a full description of this term. 3) As used herein, contractual rent increases include fixed percent or actual increases, or CPI - indexed increases. Based on SLR as of March 31, 2018. 4) See slide 21 for further detail. 5) Net debt is defined as total debt less cash and cash equivalents. Gross asset value is defined as total assets plus accumulat ed depreciation and amortization. Balance sheet metrics as of March 31, 2018. 6) Inclusive of variable rate debt fixed via an interest rate swap. As of March 31, 2018.
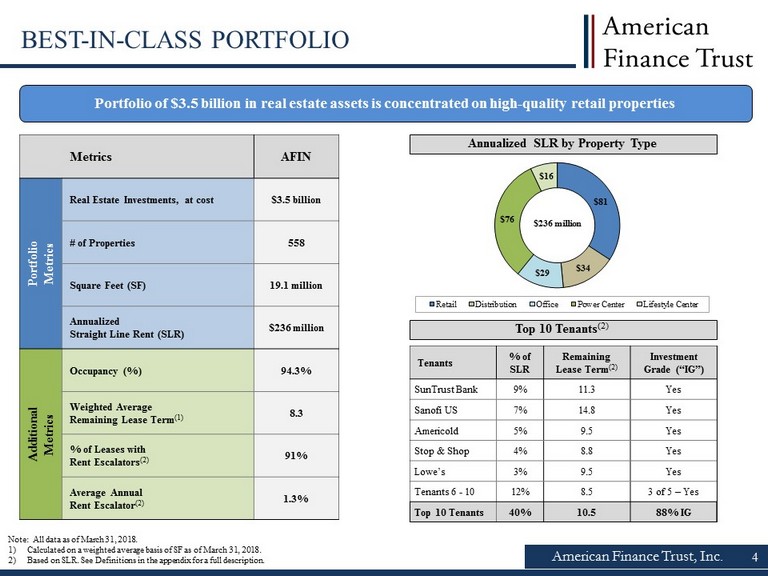
$81 $34 $29 $76 $16 Retail Distribution Office Power Center Lifestyle Center $236 million American Finance Trust, Inc. 4 Portfolio of $3.5 billion in real estate assets is concentrated on high - quality retail properties Note: All data as of March 31, 2018. 1) Calculated on a weighted average basis of SF as of March 31, 2018. 2) Based on SLR. See Definitions in the appendix for a full description. Metrics AFIN Portfolio Metrics Real Estate Investments, at cost $3.5 billion # of Properties 558 Square Feet (SF) 19.1 million Annualized Straight Line Rent (SLR) $236 million Additional Metrics Occupancy (%) 94.3% Weighted Average Remaining Lease Term (1) 8.3 % of Leases with Rent Escalators (2) 91% Average Annual Rent Escalator (2) 1.3% Annualized SLR by Property Type BEST - IN - CLASS PORTFOLIO Top 10 Tenants (2) Tenants % of SLR Remaining Lease Term (2) Investment Grade (“IG”) SunTrust Bank 9% 11.3 Yes Sanofi US 7% 14.8 Yes Americold 5% 9.5 Yes Stop & Shop 4% 8.8 Yes Lowe’s 3% 9.5 Yes Tenants 6 - 10 12% 8.5 3 of 5 – Yes Top 10 Tenants 40% 10.5 88% IG

91% 9% Leases with Rent Escalators Without % Investment Grade (1) (Top 10 Tenants) 52% 88% Net Lease Peer Average AFIN 82% 18% Service Retail Traditional Retail American Finance Trust, Inc. HIGH - QUALITY ASSETS WITH EMBEDDED GROWTH Property Type by Sector (Total Portfolio) High - quality portfolio with embedded growth drivers to increase rents within the existing portfolio % of Leases with Rent Escalators (2) (Total Portfolio) % of Total Retail (3) (Single - Tenant) » Superior mix of investment grade tenants compared to its Net Lease peers, especially amongst its top - 10 tenants » Within AFIN’s single - tenant retail portfolio, 82% focus on service retail gives the Company large exposure to ‘e - commerce resistant’ real estate (restaurant, grocery, convenience store, etc.) Average Rent Escalator 1 .3% Annually Note: See definitions in the appendix. All data in charts above are based on SLR as of March 31, 2018. 1) Net Lease Peer average consists of O, ADC, VER, SRC, NNN, STOR, FCPT. Peer data shows tenants with actual investment grade ratings. AFIN’s top 10 tenants are 75% actual investment grade rated and 13% implied investment grade rated. 2) Contractual rent increases include fixed percent or actual increases, or CPI - indexed increases. 3) Represents 56% of AFIN’s single - tenant portfolio using SLR as of March 31, 2018. » Total portfolio has contractual rent escalators built into 91 % of its leases, providing dependable rent within the existing portfolio 74% 14% 12% Retail Distribution Office » We believe combination of single - tenant and multi - tenant assets creates a diverse portfolio and mitigates exposure to individual property sector cycles 5

American Finance Trust, Inc. 6 Single - tenant portfolio of diversified, investment grade tenant base with conservative leverage Source: Company filings, Green Street Advisors. Note: See Definitions in the appendix for a full description. Metrics as of March 31, 2018. 1) AFIN’s single - tenant portfolio is comprised of 53% actual investment grade rated tenants and 27% implied investment grade rated tenants. Peers report tenants with actual investment grade ratings. Service as % of Retail Exposure (Single - Tenant) Net Debt / Gross Asset Value (Total Portfolio) WELL - POSITIONED COMPARED TO SINGLE - TENANT PEERS 14.0 12.7 11.4 10.6 10.3 9.6 9.4 9.3 STOR FCPT NNN AFIN ADC SRC O VER 87% 80% 51% 46% 43% 43% 19% 0% FCPT AFIN O ADC SRC VER NNN STOR 100% 82% 72% 71% 54% 52% 44% n.a. FCPT AFIN STOR NNN SRC O VER ADC 28% 34% 34% 35% 36% 39% 40% 46% FCPT VER ADC NNN AFIN O STOR SRC % Investment Grade Tenants (1) (Single - Tenant) Weighted Average Lease Term (Single - Tenant)

American Finance Trust, Inc. 7 WELL - POSITIONED COMPARED TO MULTI - TENANT PEERS Multi - tenant portfolio of large, well - located shopping centers with significant leasing upside Source: Company filings. 1) See Definitions in the appendix for a full description. Metrics as of March 31, 2018. 242 214 198 184 182 137 128 RPT AFIN KRG RPAI DDR KIM WRI 32% 35% 35% 36% 40% 42% 42% RPAI WRI KIM AFIN KRG RPT DDR 96% 95% 95% 94% 94% 94% 88% KIM WRI KRG RPAI DDR RPT AFIN 49% 45% 45% 41% 40% 37% 36% WRI DDR RPAI RPT KIM KRG AFIN % of Rent Expiring through 2021 (Multi - Tenant) Average Asset Size in SF (Multi - Tenant) Net Debt / Gross Asset Value (1) (Total Portfolio) Significant Leasing Upside 95% peer average % Leased (Multi - Tenant) (in thousands)

Confidential – Not for Distribution 8 8 Real Estate Portfolio Overview

High - quality service - focused portfolio with long term leases to investment grade tenants Portfolio Metrics Real Estate Investments, at cost $2.0 billion # of Properties 523 Square Feet (SF) 11.6 million Annualized Straight Line Rent (SLR) $143 million SLR per Leased Sq. Ft. (1) $12.63 Additional Metrics Occupancy (%) 98.1% Weighted Average Remaining Lease Term (1) 10.6 % Investment Grade (1) 80% % of Leases with Rent Escalators (1) 88% Average Annual Rent Escalator (1) 1.2% American Finance Trust, Inc. 9 SINGLE - TENANT PORTFOLIO 1) Based on annualized SLR as of March 31, 2018. See Definitions in the appendix for a full description. Net Lease Property / Tenant Type (% of SLR) Retail Banking 17% Restaurant 13% Grocery 7% Pharmacy 4% Gas/Convenience 4% Fitness 1% Auto Services 1% Discount Retail 4% Home Improvement 3% Furniture 1% Specialty Retail 1% Auto Retail 1% Sporting Goods 0% 23% 20% 10% 47% Industrial / Distribution Office Retail Service- Oriented Traditional Retail Geographic Exposure

American Finance Trust, Inc. 10 MULTI - TENANT PORTFOLIO Well - positioned shopping centers with substantial leasing upside Portfolio Metrics Real Estate Investments, at cost $1.5 billion # of Properties 35 Square Feet (SF) 7.5 million Annualized Straight Line Rent (SLR) $92 million SLR per Leased Sq. Ft. (1) $13.91 Additional Metrics Occupancy (%) 88.3% Weighted Average Remaining Lease Term (1) 5.1 % of Leases with Rent Escalators (1) 97% Average Annual Rent Escalator (1) 1.5% Multi - Tenant Property / Tenant Type (% of SLR) Geographic Exposure Power Center Lifestyle Center 1) Based on annualized SLR as of March 31, 2018. See Definitions in the appendix for a full description. Restaurant 14% Entertainment 10% Discount Retail 10% Salon / Beauty 5% Grocery 3% Healthcare 3% Services 2% Retail Banking 1% Financial Services 0% Specialty Retail 31% Wireless / Electronics 6% Department Store 5% Sporting Goods / Fitness 4% Home Improvement 4% Furniture 2% Other Traditional Retail 52% Experiential / E - Commerce Defensive 48%

0% 0% 1% 3% 0% 4% 2% 4% 4% 42% 1% 5% 4% 4% 4% 4% 5% 4% 2% 5% 0% 10% 20% 30% 40% 50% 2018 2019 2020 2021 2022 2023 2024 2025 2026 Thereafter 9% 7% 5% 4% 3% 3% 3% 2% 2% 2% 60% 0% 20% 40% 60% 80% Baa1 A1 A1 Baa2 A3 A2 BB- Baa2 A3 n.a. x 88% of AFIN’s top ten tenants are investment grade rated (1)(2) x AFIN’s largest tenant is SunTrust, an investment grade credit with a weighted average lease term of 11.3 years (1) • Comparable SunTrust properties have recently traded at significant premiums to AFIN’s original purchase price (3) American Finance Trust, Inc. PORTFOLIO TENANT OVERVIEW 1) Based on annualized SLR as of March 31, 2018. 2) See Definitions in the appendix for a full description of investment grade rating. AFIN’s top 10 tenants are 75% investment g rad e rated and 13% implied investment grade rated. 3) Source: Stan Johnson Company, using 2018 sales comparison data. 4) See comparison to multi - tenant peers on page 7 for details on peer set. Top Tenant Overview (1) Portfolio Lease Expiration Schedule (1) Remaining Tenants Moody’s Credit Rating: Single - Tenant Properties - 10.6 years weighted - average lease term Multi - Tenant Properties - 5.1 years weighted - average lease term x The single - tenant portfolio has limited lease expirations through 2022 x Multi - tenant portfolio has less lease expirations through 2021 than its multi - tenant peers (4) 11

American Finance Trust, Inc. EXTENSIVE MULTI - TENANT LEASING ACTIVITY The Company executed 791,000 square feet of lease renewals in 2017 and has 226,000 square feet of new leases commencing in 2018 12 2017 Lease Renewal Summary Multi - Tenant Number of Leases 68 Leases Rentable Square Feet (SF) 791,000 SF GAAP Rent Releasing Spread (%) 4% Lease Renewal Commentary x 4% increase in rental revenue for its renewal tenants in 2017 x AFIN had broad success with its lease renewals (including larger anchor tenants and smaller in - line tenants) x High proportion of lease renewals is a positive indicator of portfolio quality, as vast majority of tenants are choosing to extend their leases 226,000 Square Feet of Anchor Spaces (1) with New Leases Commencing in 2018: 791,000 Square Feet of Lease Renewals in 2017: New Lease Commencement Summary Multi - Tenant Number of New Leases 6 Leases Rentable Square Feet (SF) 226,000 SF Lease Renewal Commentary x New leases are with leading national tenants, including Kohl’s, Aldi, Big Lots and Hobby Lobby x AFIN has been able to replace former tenants with new tenants that are either investment grade or improved operators x All of these new leases have an initial lease term of 10 years or more 1) Anchor is defined as leases with 10,000 square feet or greater.

American Finance Trust, Inc. 13 RE - LEASING CASE STUDY: JEFFERSON COMMONS – LOUISVILLE, KY Jefferson Commons Case Study: Re - Leasing Anchor Space ▪ Capitalized on strong leasing demand to quickly backfill tenant bankruptcy ▪ Improved merchandising mix by adding a grocer ▪ Realized double - digit rental revenue increase on new lease Significant value creation opportunities from backfilling strip center vacancies Tenant Rating Bankrupt Re - leased to implied i nvestment grade tenant Investment Grade Timeline Vacated May 2017 Backfilled space in 9 months Lease Commenced February 2018 Rent per SF $9.40 Increased cash rent per SF by 17% (1) $11.00 Square Feet ~24,000 No Change ~24,000 New Lease x Improved Tenant x Increased Rent 1) Represents annualized cash rent prior to termination of existing lease compared to the annualized cash rent upon rent commenc eme nt.

American Finance Trust, Inc. 14 SELECT UPCOMING LEASE COMMENCEMENTS New Lease Vacated May 2017 Lease to commence August 2018 Square Feet: ~35,000 Previous Rent per SF: $6.00 New Cash Rent per SF: $7.50 Cash Re - Leasing Spread: 25% Re - Leasing Timeline: 14 months New Lease Term: 10 years New Lease with Big Lots to Commence August 2018 ▪ An existing under - market lease terminated and was replaced with a long - term lease at market rate ▪ This new lease represents a 25% increase in cash rent x Improved Tenant x Increased Rent Strong pipeline of executed leases that are set to commence in 2018 Square Feet: ~55,000 Previous Rent per SF: $10.60 New Cash Rent per SF: $11.00 Cash Re - Leasing Spread: 4% Re - Leasing Timeline: 17 months New Lease Term: 10 years New Lease x Improved Tenant x Increased Rent Vacated April 2017 Lease to commence October 2018 New Lease with Hobby Lobby to Commence October 2018 ▪ Able to replace an important anchor space with a better performing tenant ▪ New long - term lease is locked in for 10 years and is at a higher rental rate than the previous tenant
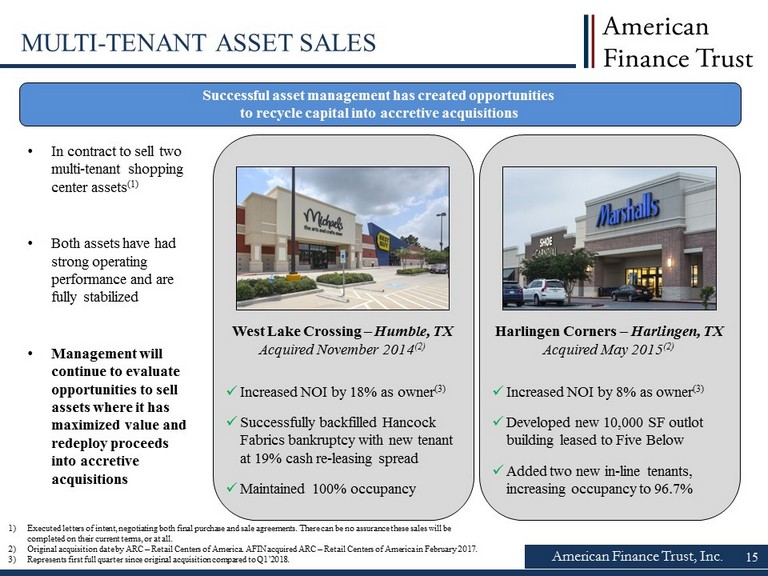
American Finance Trust, Inc. 15 Successful asset management has created opportunities to recycle capital into accretive acquisitions MULTI - TENANT ASSET SALES 1) Executed letters of intent, negotiating both final purchase and sale agreements. There can be no assurance these sales will b e completed on their current terms, or at all. 2) Original acquisition date by ARC – Retail Centers of America. AFIN acquired ARC – Retail Centers of America in February 2017. 3) Represents first full quarter since original acquisition compared to Q1’2018. • In contract to sell two multi - tenant shopping center assets (1) • Both assets have had strong operating performance and are fully stabilized • Management will continue to evaluate opportunities to sell assets where it has maximized value and redeploy proceeds into accretive acquisitions Harlingen Corners – Harlingen, TX Acquired May 2015 (2) x Increased NOI by 8% as owner (3) x Developed new 10,000 SF outlot building leased to Five Below x Added two new in - line tenants, increasing occupancy to 96.7% West Lake Crossing – Humble, TX Acquired November 2014 (2) x Increased NOI by 18% as owner (3) x Successfully backfilled Hancock Fabrics bankruptcy with new tenant at 19% cash re - leasing spread x Maintained 100% occupancy

Confidential – Not for Distribution 16 16 Investment Strategy

American Finance Trust, Inc. 17 2018 ACQUISITION ACTIVITY & PIPELINE Closed on $71 million of high - quality, single - tenant acquisitions and continue to identify superior properties within the $78 million pipeline ($ in millions, SF in thousands, lease term remaining in years) Note: Pipeline as of June 25, 2018. There can be no assurance these acquisitions will be completed on their current terms, o r a t all. Deal Name - Closed Property Type Square Feet Purchase Price GAAP Cap Rate Lease Term Remaining Closed Sonny's BBQ 3 - Pack Service Retail 19 $8.4 8.2% 15.6 Q1’18 Mountain Express 9 - Pack Service Retail 30 $17.9 8.3% 19.6 Q1’18 Kum & Go Service Retail 5 $3.3 7.0% 9.9 Q1’18 DaVita 2 - Pack Medical Office 13 $2.3 7.7% 7.7 Q1’18 White Oak 9 - Pack Service Retail 22 $11.8 9.3% 19.7 Q1’18 Mountain Express 15 - Pack Service Retail 59 $27.4 8.5% 20.0 Q2’18 2018: Total Closed 148 $71.1 8.5% 18.6 Deal Name – Pipeline Property Type Square Feet Purchase Price GAAP Cap Rate Lease Term Remaining Status Dialysis Portfolio 7 - Pack Medical Office 64 $16.3 7.5% 10.1 PSA Executed Pizza Hut 15 - Pack Service Retail 40 $16.6 7.7% 15.0 PSA Executed Burger King Service Retail 3 $1.9 7.8% 15.0 LOI Executed White Oak 9 - Pack Service Retail 18 $5.8 9.0% 19.4 LOI Executed Children of America 2 - Pack Education 25 $8.5 8.2% 15.0 LOI Executed Mountain Express 14 - Pack Service Retail 46 $29.2 8.7% 20.0 LOI Executed 2018: Total Pipeline 196 $78.3 8.2% 16.4 2018: Total Closed + Pipeline 344 $149.5 8.3% 17.5

American Finance Trust, Inc. 18 SUCCESSFUL ACQUISITION TRACK RECORD 2017 CLOSED ACQUISITIONS Note: Excludes ARC – Retail Centers of America merger in February 2017. 1) See Definitions in the appendix for a full description of this term. 2) Comprised of 65% implied investment grade rated tenants and 7% actual investment grade rated tenants. Closed on $149 million of high - quality acquisitions in 2017 x 75 single - tenant properties x 72% of tenants rated investment grade (1)(2) x 7.9% GAAP cap rate (1) x 16 - year average lease - term Key Acquisitions – 2017 » Acquisition team leveraged relationships and reputation to source attractive deals » Sonic and Bob Evans represented $72 million » Highly desirable characteristics: (i) 20 year long - term leases (ii) attractive cap rates with significant embedded rent growth (iii) strong credits within the restaurant sector (greater insulation from e - commerce) Property Location Number of Properties Purchase Price GAAP Cap Rate (1) (%) Acquisition Date Initial Lease Term Bob Evans 23 - Pack Various 23 $47 8.7% Apr. 2017 20 years Sonic 20 - Pack FL (5), MS (15) 20 $24 7.6% Nov. 2017 20 years ($ in millions)

American Finance Trust, Inc. IMPROVED SINGLE - TENANT PORTFOLIO We continue to improve AFIN’s portfolio by opportunistically acquiring service - oriented retail properties with long term leases while disposing of unlike assets Note: Data as of 6/25/18 and includes pipeline. See page 17 for acquisition pipeline; disposition pipeline includes 5 assets with executed purchase and sale agreements. Weighted by SLR. There can be no assurance these acquisitions and dispositions will be completed on their current terms, or a t a ll. 19 Metrics 2017 & 2018 Dispositions 2017 & 2018 Acquisitions # of Properties 47 162 Lease Term Remaining 6 Years 17 Years Service Retail 1% 86% Traditional Retail 20% 5% Distribution 31% 9% Office 48% 0% 2017 & 2018 Transaction Summary 6 Years 17 Years 2017 & 2018 Dispositions 2017 & 2018 Acquisitions 1% 86% 2017 & 2018 Dispositions 2017 & 2018 Acquisitions Lease Term Remaining % Service Retail Increasing Lease Duration Increasing Service Retail Concentration

Confidential – Not for Distribution 20 20 Financial Overview

Fixed 95% Floating 5% American Finance Trust, Inc. 21 CONSERVATIVE BALANCE SHEET Debt Capitalization (as of 3/31/2018) ($mm) Single - Tenant Mortgages $979 Multi - Tenant Mortgages $318 Total Secured Debt $1,298 Revolving Credit Facility $70 Total Unsecured Debt $70 Total Debt $1,368 Weighted Average Interest Rate 4.5% Key Capitalization Metrics (as of 3/31/2018) ($bn) Net Debt $1.3 Real Estate Assets, at cost $3.5 Net Debt / EBITDA (2) 7.1x Net Debt / Gross Asset Value (3) 36% 1) The maturity date is April 26, 2020 and the maturity date will be automatically extended by two years if a Listing occurs. In ad dition, if a Listing occurs, then the Company will have a one - time right to extend the maturity date for an additional term of one year. 2) See Definitions in the appendix for a full description of this term. 3) Net debt is defined as total debt less cash and cash equivalents. Gross asset value is defined as total assets plus accumulat ed depreciation and amortization. Metrics as of March 31, 2018. 4) Interest rate fixed via swap at 5.16%. 5) Inclusive of variable rate debt fixed via an interest rate swap. Recently Completed Debt Financings Fixed vs. Floating Rate Exposure (5) Closed on a new $415 million credit facility in April 2018, which has over $200 million available for additional borrowing and matures in 2023 (1) ▪ Credit Facility: Successfully completed a new $415 million revolving credit facility in April 2018 ▪ Secured Mortgage Financing: Closed a $210 million CMBS financing at 4.19% maturing in 2028 in December 2017 ▪ Secured Mortgage Financing: Closed a $33 million CMBS financing at 4.07% with a maturity in 2028 in December 2017 ▪ Balance Sheet Financing: Closed a $30 million balance sheet loan at 5.16% with a maturity in 2025 in March 2018 (4)

American Finance Trust, Inc. DIVIDEND SUPPORTS GROWTH Higher Retained Earnings Additional Investments Improved Growth Higher Multiples ▪ Annual Dividend Rate Lowered to $1.10 per share: The Board of Directors lowered the dividend rate to more closely align the Company’s payout ratio with public peers ▪ Positioned for Stronger Future Growth and Potential to Increase Retained Earnings: Higher retained earnings will provide the Company with additional capital to invest, driving earnings growth to support future dividend increases ▪ Competitive Public Market Dividend: Dividend rate more closely aligns payout ratio with other public companies while providing a compelling dividend yield ▪ Higher Growth Leads to Higher Multiples: Public markets generally reward higher growth companies, and can lead to higher multiples Sustainable dividend provides support for future growth 22

American Finance Trust, Inc. ESTIMATED PER - SHARE NAV OF $23.56 ▪ Duff & Phelps, an independent valuation firm, was hired to perform a detailed appraisal of each Real Estate Asset in AFIN’s portfolio using three separate valuation methods: − Income Capitalization Approach − Market or Sales Comparison Approach − Contract Sales Price for assets either under purchase and sale agreements or letters of intent ▪ The Independent members of the Board of Directors makes a final determination regarding AFIN’s Estimated Per - Share NAV ▪ The table below summarizes the individual components of the Estimated - Per - Share NAV: ▪ AFIN has published an updated estimated per share value on an annual basis, as required of all public non - listed REITs by FINRA Rule 2310 (the “Customer Account Statement Rule”) ▪ Once listed, AFIN will no longer publish an estimated per share NAV as the market price for AFIN’s shares will serve as the value presented on client account statements Duff & Phelps, an independent third - party valuation firm, performed appraisals of each Real Estate Asset in AFIN’s portfolio to help determine the Company’s Estimated Net Asset Value of $23.56 (1) as of 12/31/17 (amounts per share) 12/31/2017 Real Estate Assets $36.20 Other Assets $1.38 Fair Value of Debt ($13.57) Other Liabilities ($0.45) Estimated Per - Share NAV $23.56 1) See further assumptions and limitations in AFIN’s publicly filed Form 8 - K on 3/20/2018. Additional disclosures in Forward Looking Statements. 23

American Finance Trust, Inc. IMPACT OF POTENTIAL INDEX INCLUSIONS ▪ Index inclusions can provide significant inflows from institutional funds − Inflows can provide additional demand for shares − Key index investors have included Vanguard, Blackrock, Charles Schwab, and State Street − Institutional investors often become some of the largest stockholders following index inclusion ▪ The Russell U.S. Indices have over $9 billion in institutional capital benchmarked against them − Stocks that are added or removed from the indices typically see trading volume increase 45 times higher than average on the rebalancing date (annually in June) − Current Russell 2000 Index inclusion criteria is market cap between $159 million and $3.7 billion ▪ The MSCI US REIT Index (“RMZ”) includes 99% of the public U.S. REIT market cap − Next semi - annual rebalancing in November 2018 − No guarantee of inclusion at a given time, but precedent listings of comparable size suggest AFIN should be eligible after listing Recent Non - Traded REIT Listings ▪ In three previous non - traded REIT listings (1) , the REITs witnessed substantial inflows in the quarter after the RMZ inclusion took effect − Top institutional buyers increased their positions on average by over $200 million, or ~9% of total shares outstanding in the quarter of the index inclusion 1) Global Net Lease Inc., Healthcare Trust of America and Columbia Property Trust. Index inclusions may provide increased demand for shares after listing 24

Confidential – Not for Distribution 25 25 Management and Key Partners

American Finance Trust, Inc. 26 EXPERIENCED MANAGEMENT Jason Slear Executive Vice President of Real Estate Acquisitions and Dispositions ▪ Responsible for sourcing, negotiating, and closing AR Global's real estate acquisitions and dispositions ▪ Oversaw the acquisition of over $3.5 billion of real estate assets and the lease - up of over 10 million square feet during professional career Michael Weil Chief Executive Officer, President and Chairman of the Board of Directors ▪ Founding partner of AR Global ▪ Previously served as Senior VP of sales and leasing for American Financial Realty Trust ▪ Served as president of the Board of Directors of the Real Estate Investment Securities Association Katie Kurtz Chief Financial Officer, Treasurer and Secretary ▪ Previously served as chief accounting officer at Carlyle GMS Finance, Inc., The Carlyle Group’s business development company, Director of Finance and Controller for New Mountain Finance Corporation, and Controller at Solar Capital Ltd ▪ Mrs. Kurtz began her career at PricewaterhouseCoopers, LLP and is a certified public accountant in New York State Zachary Pomerantz Senior Vice President of Asset Management ▪ Former Asset Manager for New York REIT (“NYRT”), a nearly 2 million square foot portfolio of New York City properties ▪ Previously worked at ProMed Properties, Swig Equities, Tishman Speyer and Mall Properties Boris Korotkin Senior Vice President of Capital Markets and Corporate Strategy ▪ Responsible for leading all debt capital market transactions ▪ Former Executive Vice President of Transaction Structuring for American Financial Realty Trust

American Finance Trust, Inc. 27 STRONG CORPORATE GOVERNANCE x Majority independent Board of Directors, with additional oversight provided by an audit committee comprised solely of independent directors x KPMG currently acts as the independent auditor for AFIN x Deloitte & Touche serves as the company’s internal auditor; making reports directly to the audit committee x The company is supported by a financial accounting and reporting team, and maintains financial reporting processes, controls and procedures x Alignment of management and shareholder interests Board of Directors Lisa Kabnick Lead Independent Director ¨ Independent director of the Company since August 2015 ¨ Mrs. Kabnick has served as AFIN’s nominating and corporate governance committee chair since April 2016 and also has served as lead independent director since March 2018 Leslie Michelson Independent Director ¨ Independent director of the Company since February 2017 ¨ Chairman and CEO of Private Health Management ¨ Vice Chairman and Chief Executive Officer of the Prostate Cancer Foundation, the world’s largest private source of prostate cancer research funding, from April 2002 until December 2006 and served on its board of directors from January 2002 until April 2013 Stanley Perla Independent Director ¨ Independent director of the Company since April 2013 ¨ Extensive real estate, accounting, and audit background having worked in these industries for over 40 years Michael Weil Chairman of the Board ¨ Founding partner of AR Global ¨ Previously served as Senior VP of sales and leasing for American Financial Realty Trust ¨ Served as president of the Board of Directors of the Real Estate Investment Securities Association Corporate Governance Edward Rendell Independent Director ¨ Independent director of the Company since February 2017 ¨ 45th Governor of the Commonwealth of Pennsylvania from 2003 through 2011 ¨ Mayor of Philadelphia from 1992 through 2000
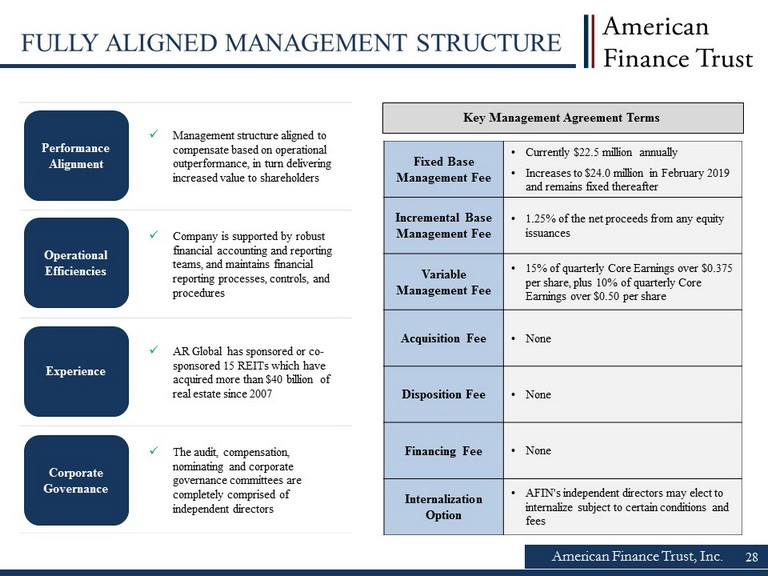
x Management structure aligned to compensate based on operational outperformance, in turn delivering increased value to shareholders x Company is supported by robust financial accounting and reporting teams, and maintains financial reporting processes, controls, and procedures x AR Global has sponsored or co - sponsored 15 REITs which have acquired more than $40 billion of real estate since 2007 x The audit, compensation, nominating and corporate governance committees are completely comprised of independent directors American Finance Trust, Inc. 28 FULLY ALIGNED MANAGEMENT STRUCTURE Performance Alignment Fixed Base Management Fee • Currently $22.5 million annually • Increases to $24.0 million in February 2019 and remains fixed thereafter Incremental Base Management Fee • 1.25% of the net proceeds from any equity issuances Variable Management Fee • 15% of quarterly Core Earnings over $0.375 per share, plus 10% of quarterly Core Earnings over $0.50 per share Acquisition Fee • None Disposition Fee • None Financing Fee • None Internalization Option • AFIN's independent directors may elect to internalize subject to certain conditions and fees Experience Operational Efficiencies Corporate Governance Key Management Agreement Terms

American Finance Trust, Inc. 29 EXPERIENCED PROPERTY MANAGER Lincoln is an experienced and proven property manager that services AFIN’s multi - tenant portfolio Lincoln Property Company ▪ Founded in 1965 ▪ Among Largest Private Diversified Real Estate Firms in U.S. ▪ Full Service – development, sales, advisory and property management ▪ $63 Billion Real Estate Assets Under Management ▪ Properties located in more than 200 U.S. cities and 10 countries throughout Europe ▪ 6,000 Employees ▪ 40 Administrative Offices in U.S. and Europe ▪ 300 Management Offices in 32 States ▪ Lincoln currently functions as the service provider for AFIN’s multi - tenant retail properties: ▪ Day - to - day property management services ▪ Leasing services ▪ Portfolio oversight

American Finance Trust, Inc. 30 INVESTMENT HIGHLIGHTS High - Quality , Diversified Portfolio x Leases with high - quality, creditworthy tenants, reflected in the Company’s leading investment grade rated tenant metrics (1) x Diversification of single - tenant and multi - tenant assets mitigates exposure to individual property sector cycles Servic e Retail Property Focus x 82% of the single - tenant net lease portfolio is focused on service retail properties (restaurant, grocery, convenience store, etc.) that are more resistant to e - commerce vs. traditional retail (2) x Multi - tenant portfolio includes a proven balance of store concepts needed for a successful retail center, with 48% of rent from experiential / defensive properties vs. other traditional retail types Strong, Creditworthy Tenant Base x 88% of AFIN’s top ten tenants are investment grade rated (1) x Diverse tenant roster of top national tenants Scaled Platform Positioned for Growth x $3.5 billion in book value of assets x Rent escalators in 91% (3) of leases provide dependable, contractual rent growth x Multi - tenant portfolio occupancy of 88% provides embedded growth potential x Attractive acquisition pipeline of approximately $80 million net lease assets currently under contract Conservative Balance Sheet x Ample liquidity with sizable cash position and significant capacity from the Company’s newly upsized $415 million credit facility (4) x Conservative leverage of 36% net debt / gross asset value (5) x Strategically locked in attractive, long - term interest rates and mitigated interest rate risk with 95% fixed rate debt (6) Experienced Management Team x Proven track record with significant public REIT market experience x Fully - aligned management structure designed to reward strong operating performance x Lincoln Property Company is an experienced and proven property manager for the multi - tenant portfolio 1) As used herein, “Investment Grade Rating” for AFIN includes both actual investment grade ratings of the tenant or Implied Inv est ment Grade. Peers report tenants with actual investment grade ratings. See Definitions in the appendix for a full description . 2) Represents 56% of AFIN’s single - tenant portfolio using straight line rent (SLR) as of March 31, 2018. See Definitions in the appendix for a full description of this term. 3) As used herein, contractual rent increases include fixed percent or actual increases, or CPI - indexed increases. Based on SLR as of March 31, 2018. 4) See slide 21 for further detail. 5) Net debt is defined as total debt less cash and cash equivalents. Gross asset value is defined as total assets plus accumulat ed depreciation and amortization. Balance sheet metrics as of March 31, 2018. 6) Inclusive of variable rate debt fixed via an interest rate swap. As of March 31, 2018.

Confidential – Not for Distribution 31 31 Legal Notices

American Finance Trust, Inc. 32 DEFINITIONS Investment Grade Rating : Includes both actual investment grade ratings of the tenant or Implied Investment Grade. Implied Investment Grade includes ra tings of tenant parent (regardless of whether or not the parent has guaranteed the tenant’s obligation under the lease) or lease guarantor. I mpl ied Investment Grade ratings are determined using Moody’s proprietary analytical tool, which compares the risk metrics of the non - rated company to those of a company with a n actual rating. Ratings information is as of June 15, 2018. Gross Asset Value: Total assets plus accumulated depreciation and amortization. Net Debt: Total debt less cash and cash equivalents. Rent Escalators: Contractual rent increases include fixed percent or actual increases, or CPI - indexed increases. Based on SLR as of March 31, 20 18. Service Retail: AFIN definition of service retail includes single - tenant retail properties leased to tenants in the retail banking, restaurant, grocery, pharmacy, gas/convenience, fitness, and auto services sectors. Public REIT comparable service retail exposure is shown as calculated by Gr een Street Advisors. Traditional Retail: AFIN definition of traditional retail includes single - tenant retail properties leased to tenants in the discount retail, home im provement, furniture, specialty retail, auto retail, and sporting goods sectors. Public REIT comparable traditional retail exposure is shown as cal cul ated by Green Street Advisors. GAAP Cap Rate: GAAP Capitalization Rate is a rate of return on real estate investment property based on expected, straight - lined rental income that the property will generate under its existing lease, dividing the income the property will generate (before debt service and depreciation and a fte r fixed costs and variable costs) by the acquisition price of the property. FFO: We define FFO, a non - GAAP measure, consistent with the standards set forth in the White Paper on FFO approved by the Board of Go vernors of NAREIT, as revised in February 2004 (the “White Paper”). The White Paper defines FFO as net income or loss computed in accordance with G AAP , but excluding gains or losses from sales of property and real estate related impairments, plus real estate related depreciation and amortization, and after adju stm ents for unconsolidated partnerships and joint ventures. Net Debt / EBITDA: Represents ratio of net debt as of March 31, 2018 of $183 million, which represents an annualization of the Company’s calculation of its earnings before interest, tax, depreciation and amortization (“EBITDA”) for the three months ended March 31, 2018. EBITDA is defined a s F FO, and then adds back Interest Expense and Acquisition Expenses. The Company believes this amount is a reasonable estimate of the Company’s EBITDA for the y ear ending December 31, 2018. Share Repurchase Program: The Board has authorized a share repurchase program of up to $200 million that the Company may implement, from time to time, sub ject to authorization by the Board prior to any repurchase, following the listing through open market repurchases or in privately neg oti ated transactions based on the Board and management’s assessment of, among other things, market conditions prevailing at the particular time.
American Finance Trust, Inc. 33 PROJECTIONS This presentation includes estimated projections of future operating results. These projections were not prepared in accordan ce with published guidelines of the SEC or the guidelines established by the American Institute of Certified Public Accountants for preparation and presentation of financia l p rojections. This information is not fact and should not be relied upon as being necessarily indicative of future results; the projections were prepared in good faith by manageme nt and are based on numerous assumptions that may prove to be wrong. Important factors that may affect actual results and cause the projections to not be achieved include, but ar e not limited to, risks and uncertainties relating to the company and other factors described in the “Risk Factors” section of the Company's Annual Report on Form 10 - K for the year ended December 31, 2017, the Company's Quarterly Reports on Form 10 - Q and in future filings with the SEC. The projections also reflect assumptions as to certain business decisi ons that are subject to change. As a result, actual results may differ materially from those contained in the estimates. Accordingly, there can be no assurance that the estimate s w ill be realized. This presentation also contains estimates and information concerning our industry, including market position, market size, and growth rates of the markets in wh ich we participate, that are based on industry publications and reports. This information involves a number of assumptions and limitations, and you are cautioned not to giv e u ndue weight to these estimates. We have not independently verified the accuracy or completeness of the data contained in these industry publications and reports. The ind ust ry in which we operate is subject to a high degree of uncertainty and risk due to variety of factors, including those described in the “Risk Factors” section of the Company's A nnu al Report on Form 10 - K for the year ended December 31, 2017, the Company's Quarterly Reports on Form 10 - Q and in future filings with the SEC. These and other factors cou ld cause results to differ materially from those expressed in these publications and reports.

American Finance Trust, Inc. 34 FORWARD - LOOKING STATEMENTS Certain statements made in this presentation are “forward - looking statements” (as defined in Section 21E of the Exchange Act), w hich reflect the expectations of the Company regarding future events. The forward - looking statements involve a number of risks, uncertainties and other factors that could ca use actual results to differ materially from those contained in the forward - looking statements. Such forward - looking statements include, but are not limited to, market and other e xpectations, objectives, and intentions, as well as any other statements that are not historical facts. Our potential risks and uncertainties are presented in the section titled “Item 1A - Risk Factors” disclosed in our Annual Report on Form 10 - K for the year ended December 31, 2017 and our Quarterly Reports on Form 10 - Q filed from time to time. We disclaim any obligation to update and revise statements contained in these materials to reflect changed assumptions, the occurrence of unanticipated events or changes to future operating results over time, unless required by law. Th e following are some of the risks and uncertainties relating to us, although not all risks and uncertainties, that could cause our actual results to differ materially from those pr esented in our forward - looking statements: • The anticipated benefits from the merger with American Realty Capital - Retail Centers of America, Inc. (“RCA”) may not be reali zed or may take longer to realize than expected. • All of our executive officers are also officers, managers, employees or holders of a direct or indirect controlling interest in the Advisor or other entities under common control with AR Global Investments, LLC (the successor business to AR Capital, LLC, “AR Global”). As a result, our executive officers , t he Advisor and its affiliates face conflicts of interest, including significant conflicts created by the Advisor’s compensation arrangements with us and other investment pro gra ms advised by affiliates of AR Global and conflicts in allocating time among these entities and us, which could negatively impact our operating results. • The Company may not be able to list its common stock on NASDAQ on or about July 19, 2018, or at all. • There can be no assurance as to the price at which the Company’s common stock will trade following the listing. The trading p ric e of the Company’s common stock will be impacted by a number of factors, many of which are outside the Company’s control, including market volatility, or actual or p erc eived imbalances in trading volumes, and may fluctuate significantly. • Estimated Per - Share NAV does not represent the price at which shares of the Company’s common stock would trade at on a national securities exchange, and there can be no assurance the trading price of the Company’s common stock following the listing will equal or exceed our Estimated - Per Share NAV . • Any repurchases made pursuant to the new share repurchase program will be made in accordance with, and subject to, applicable ru les promulgated by the SEC as well as the Company’s charter and loan agreements. • Lincoln Retail REIT Services, LLC (“Lincoln”) and its affiliates, which provide services to the Advisor in connection with ou r r etail portfolio, faces conflicts of interest in allocating its employees’ time between providing real estate - related services to the Advisor and other programs and activities i n which they are presently involved or may be involved in the future. • The performance of our retail portfolio is linked to the market for retail space generally and factors that may impact our re tai l tenants, such as the increasing use of the Internet by retailers and consumers. • We depend on tenants for our rental revenue and, accordingly, our rental revenue is dependent upon the success and economic v iab ility of our tenants. • We have not generated, and in the future may not generate, operating cash flows sufficient to fund all of the distributions w e p ay our stockholders, and, as such, we may be forced to fund distributions from other sources, including borrowings, which may not be available on favorable terms, or at a ll. • We may be unable to pay or maintain cash distributions at the current rate or increase distributions over time. • We are obligated to pay fees, which may be substantial, to the Advisor and its affiliates. • We are subject to risks associated with any dislocation or liquidity disruptions that may exist or occur in the credit market s o f the United States of America. • We may fail to continue to qualify to be treated as a real estate investment trust for U.S. federal income tax purposes (“REI T”) , which would result in higher taxes, may adversely affect our operations and would reduce the value of an investment in our common stock and our cash available for di str ibutions. • We may be deemed by regulators to be an investment company under the Investment Company Act of 1940, as amended (the “Investm ent Company Act”), and thus subject to regulation under the Investment Company Act.