Attached files
| file | filename |
|---|---|
| EX-99.1 - EX-99.1 - BED BATH & BEYOND INC | a18-16156_1ex99d1.htm |
| 8-K - 8-K - BED BATH & BEYOND INC | a18-16156_18k.htm |
Forward Looking Statements This presentation may contain forward-looking statements. Many of these forward-looking statements can be identified by use of words such as may, will, expect, anticipate, approximate, estimate, assume, continue, model, project, plan, goal, and similar words and phrases. The Company’s actual results and future financial condition may differ materially from those expressed in any such forward-looking statements as a result of many factors. Such factors include, without limitation: general economic conditions including the housing market, a challenging overall macroeconomic environment and related changes in the retailing environment; consumer preferences, spending habits and adoption of new technologies; demographics and other macroeconomic factors that may impact the level of spending for the types of merchandise sold by the Company; civil disturbances and terrorist acts; unusual weather patterns and natural disasters; competition from existing and potential competitors across all channels; pricing pressures; liquidity; the ability to achieve anticipated cost savings, and to not exceed anticipated costs, associated with organizational changes; the ability to attract and retain qualified employees in all areas of the organization; the cost of labor, merchandise and other costs and expenses; potential supply chain disruption due to trade restrictions, political instability, labor disturbances, product recalls, financial or operational instability of suppliers or carriers, and other items; the ability to find suitable locations at acceptable occupancy costs and other terms to support the Company’s plans for new stores; the ability to establish and profitably maintain the appropriate mix of digital and physical presence in the markets it serves; the ability to assess and implement technologies in support of the Company’s development of its omnichannel capabilities; uncertainty in financial markets; volatility in the price of the Company’s common stock and its effect, and the effect of other factors, on the Company’s capital allocation strategy; disruptions to the Company’s information technology systems including but not limited to security breaches of systems protecting consumer and employee information; reputational risk arising from challenges to the Company’s or a third party supplier’s compliance with various laws, regulations or standards, including those related to labor, health, safety, privacy or the environment; reputational risk arising from third-party merchandise or service vendor performance in direct home delivery or assembly of product for customers; changes to statutory, regulatory and legal requirements, including without limitation proposed changes affecting international trade; changes to, or new, tax laws or interpretation of existing tax laws; new, or developments in existing, litigation, claims or assessments; changes to, or new, accounting standards; foreign currency exchange rate fluctuations; and the integration of acquired businesses. The Company does not undertake any obligation to update its forward-looking statements. 2
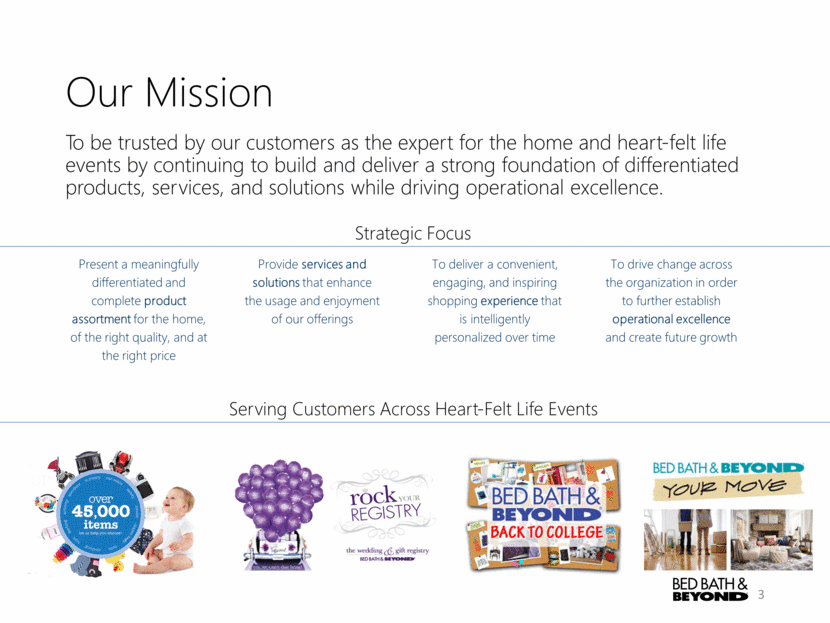
Our Mission To be trusted by our customers as the expert for the home and heart-felt life events by continuing to build and deliver a strong foundation of differentiated products, services, and solutions while driving operational excellence. Present a meaningfully differentiated and complete product assortment for the home, of the right quality, and at the right price Provide services and solutions that enhance the usage and enjoyment of our offerings To deliver a convenient, engaging, and inspiring shopping experience that is intelligently personalized over time To drive change across the organization in order to further establish operational excellence and create future growth Strategic Focus Serving Customers Across Heart-Felt Life Events 3
Our Vision for 2020 In Fiscal 2018: Grow comp sales In Fiscal 2018 and 2019: Moderate the declines in operating profit and net earnings per diluted share By Fiscal 2020: Grow net earnings per diluted share We remain on track with our annual and 3-year goals, while we continue to evolve our foundational structure 4
Q1 2018 Summary Remain on track with fiscal 2018 modeling assumptions and 3-year financial goals Sales of approximately $2.8 billion, up 0.4% versus Q1 2017 Continued strong growth in customer-facing digital channels Diluted EPS of $0.32 per share Retail inventory reduction of approximately $300 million (at cost) vs. Q1 2017 Continued growth of cash and investments, even after funding our operations, capital expenditures, dividends and share repurchases Declared quarterly dividend of $.16/share, payable on Oct. 16, 2018 to shareholders of record at the close of business on Sept. 14, 2018 5
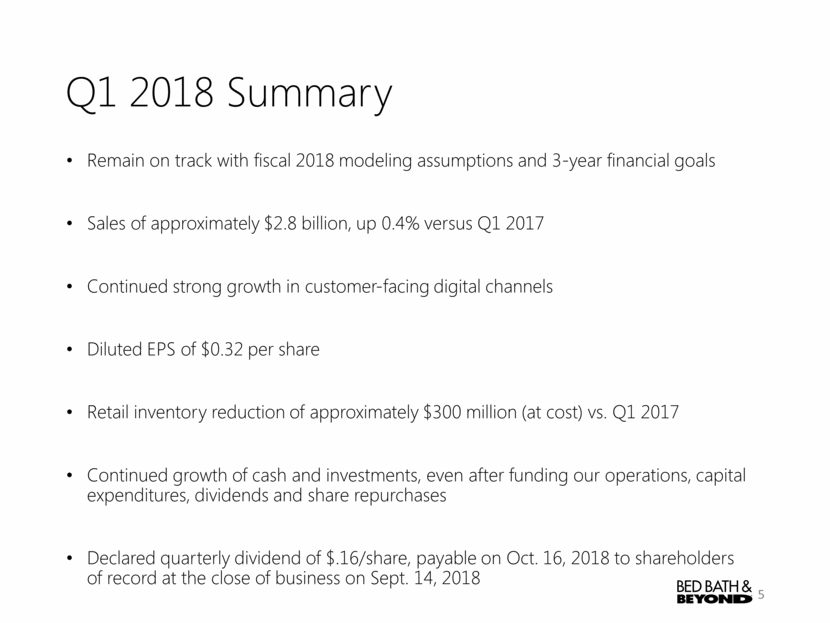
Strategic Investments Positioning Our Company for Long-Term Success Assortment Experiences Services Operational Excellence Our Mission: To be trusted as the expert for the home and heart-felt life events. 4 Broad Areas of Focus 6
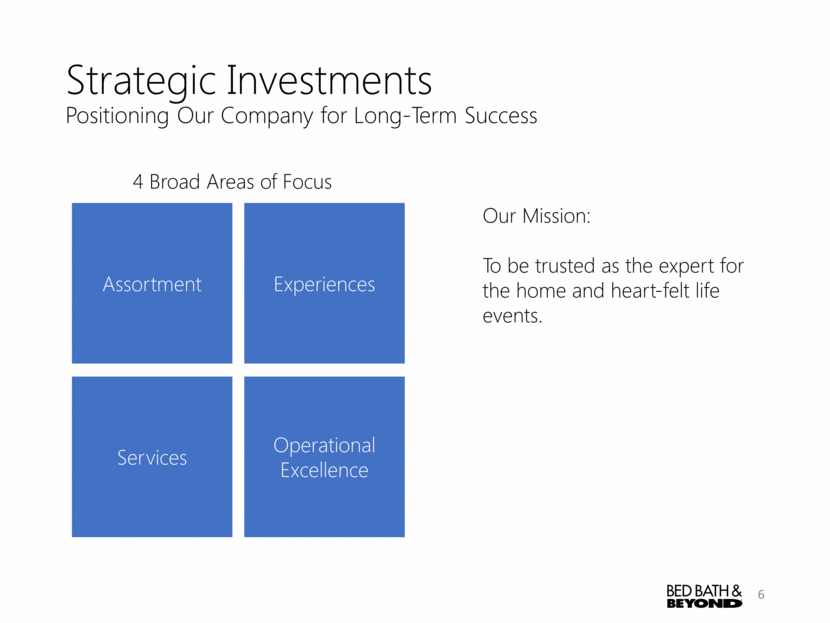
Key Focus Areas: Expansive Online Assortment, Differentiated Over Time Quality, Value & Competitive Pricing Convenient & Easy Shopping / Delivery Experience Increase Customer Awareness Supported by an Agile, Cross-Functional Team Decorative Furnishings (DF) Results (1Q 18 vs. 1Q 17): Strong DF sales growth (BBB/bbB – US/Canada) Significantly higher AOV for DF than overall AOV for BBB and bbB websites (BBB/bbB – US only) Accelerate Growth of Decorative Furnishings The Trusted Expert for Whole Home Decorating Assortment 7
Progress Update: Added >78,000 Decorative Furnishings SKUs* (FY 17); added 24,000 more in 1Q 2018 Increasing the productivity of the assortment using web performance data to edit existing assortment and identify opportunity Developing proprietary brands for launch in FY2019 Accelerate Growth of Decorative Furnishings Expansive Online Assortment Assortment * Online expansion for bedbathandbeyond.com (U.S.) 8
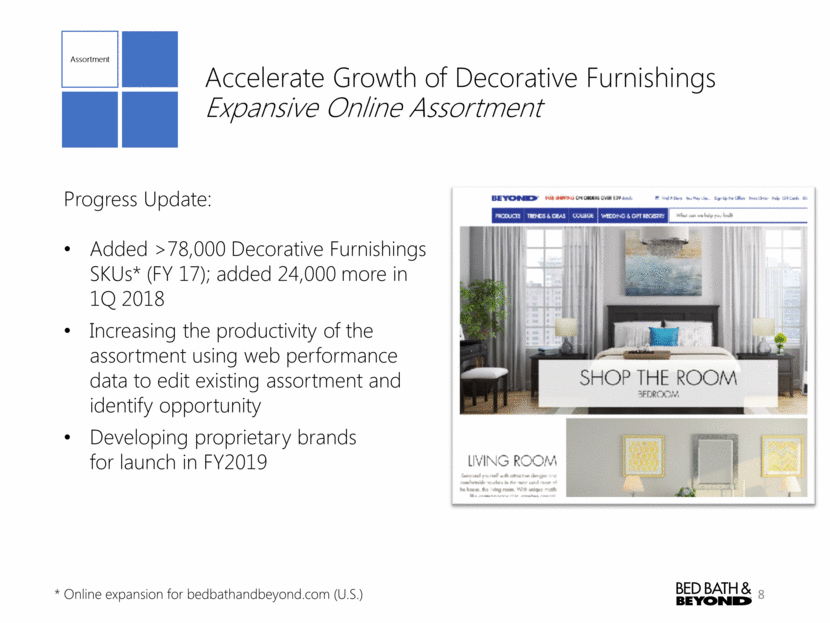
Accelerate Growth of Decorative Furnishings In-Store Pilot (Spring 2018) Key Focus Areas of Pilot: Raise awareness Build a scalable framework to: show furniture in our stores and support the associate and customer through their shopping journey Progress Update: Vignettes and featured item displays rolled out in 78 BBB stores Associate training conducted; testing tablets to better assist customers to ‘find more beyond the store’ Conducting customer awareness survey (pre and post launch) Early Results: Decorative Furnishings orders placed in-store and shipped directly to the customer grew 10.4% over the last 4 weeks vs. 3.6% in stores not participating in pilot Assortment 9
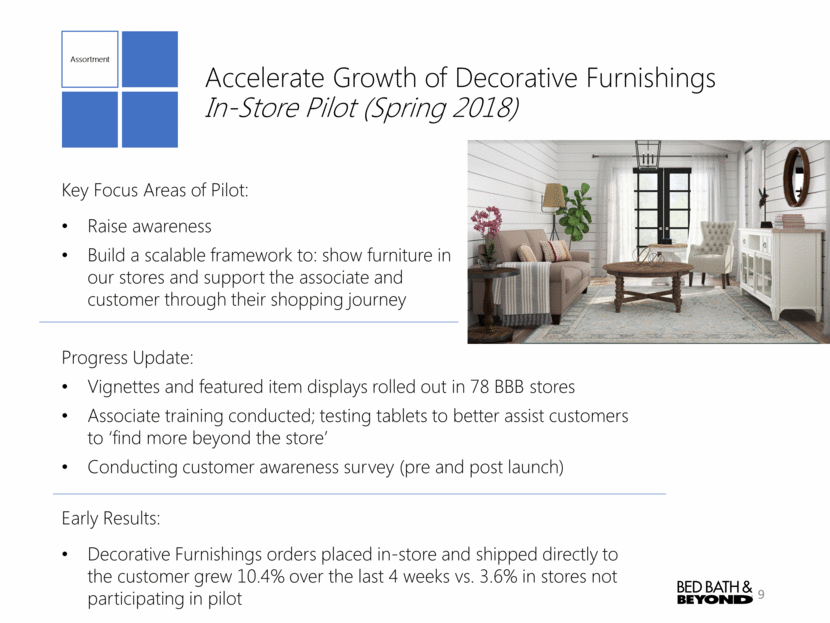
Key Focus Areas: Leveraging Real Estate Portfolio: Numerous near-term renewals provide opportunity to update existing selected stores Evolving and/or New Assortment: to increase shopping trips, transactions and transaction value Scarcity product: Seasonal, Decorative Furnishings Treasure Hunt, and Deep Value Commodity product: Food & Beverage, and Health & Beauty Care Making Stores More Efficient Next Generation Store Optimize Store Productivity Experiences 10
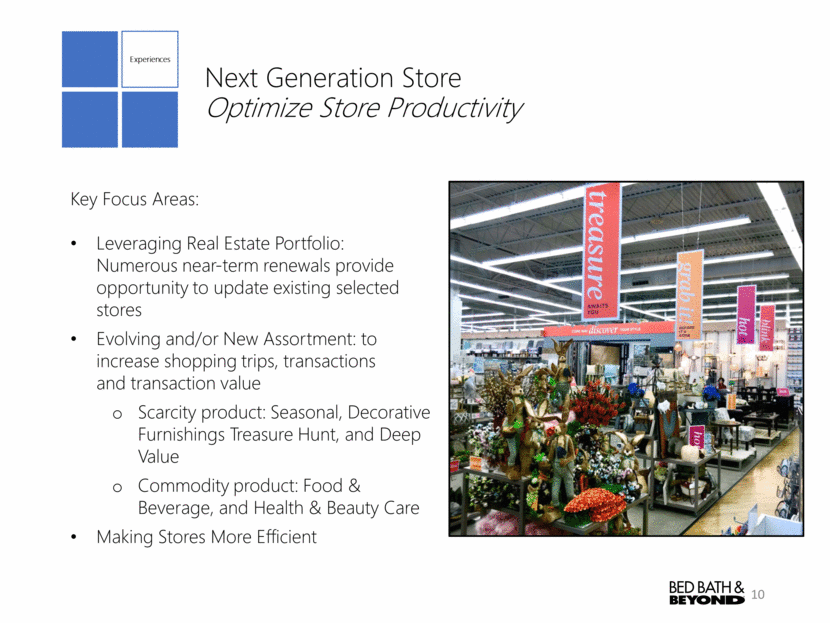
Progress Update: 4 remodels completed Plymouth Meeting, PA (March) Mount Vernon, NY (April) Summerlin, NV (May) Lubbock, TX (June) Iterate quickly after each remodel for continuous improvement and enhance merchandising and customer experience Plan to remodel another 15 stores by late Fall 2018 Another 20 stores to be remodeled by end of Spring 2019 Next Generation Store Store Remodels Underway Experiences 11
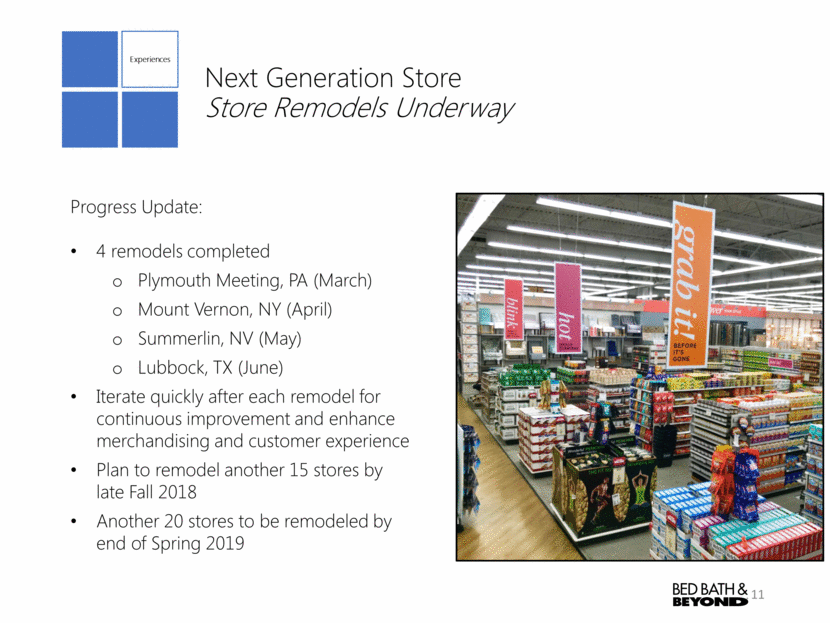
Early Results: Strong transaction growth in these stores Significant growth in transactions that include new and/or evolving merchandise assortment Core Department: Space reduced by ~10% in these stores; Sales outperforming rest of BBB stores Next Generation Store Favorable Customer Response Experiences 12
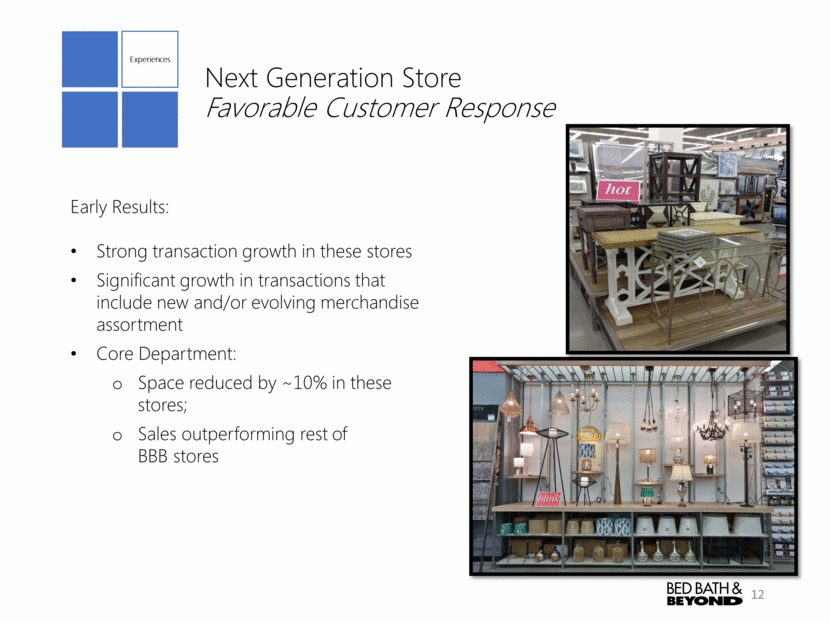
Inventory Optimization Inventory Initiatives Driving Benefits Operational Excellence Retail inventories (at cost) reduced ~$170 million Retail inventories (at cost) reduced ~$300 million 13
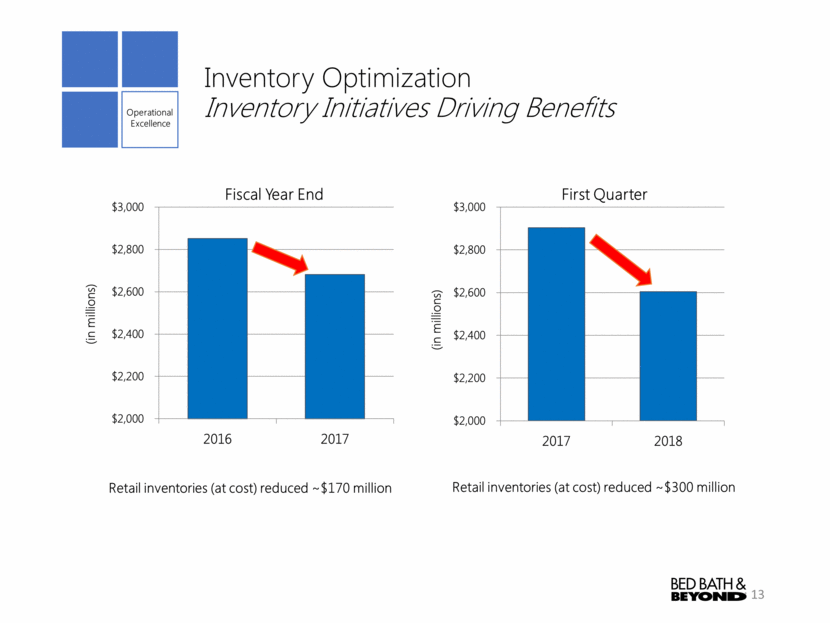
Marketing Personalization Driving Incremental Revenue & Optimizing Customer Experience Key Focus Area: Tailor timing, content and design of messaging to each customer, depending on their attributes, context, and behaviors Supported by an agile, cross-functional team Experiences 14 Progress Update: Launched first “Personalization Lab” in April 2018 Launched >20 email tests in <2 months Speed & throughput of our personalized marketing capabilities have grown 10X
Marketing Personalization Driving Incremental Revenue & Optimizing Customer Experience Experiences 15 Early Results: Customer engagement has grown ~15-20% on all marketing personalization tests Identified incremental revenue from marketing personalization initiative Identified enhanced technology tools to support marketing personalization – to be implemented over the next 12-18 months
Q1 2018 Financials 16
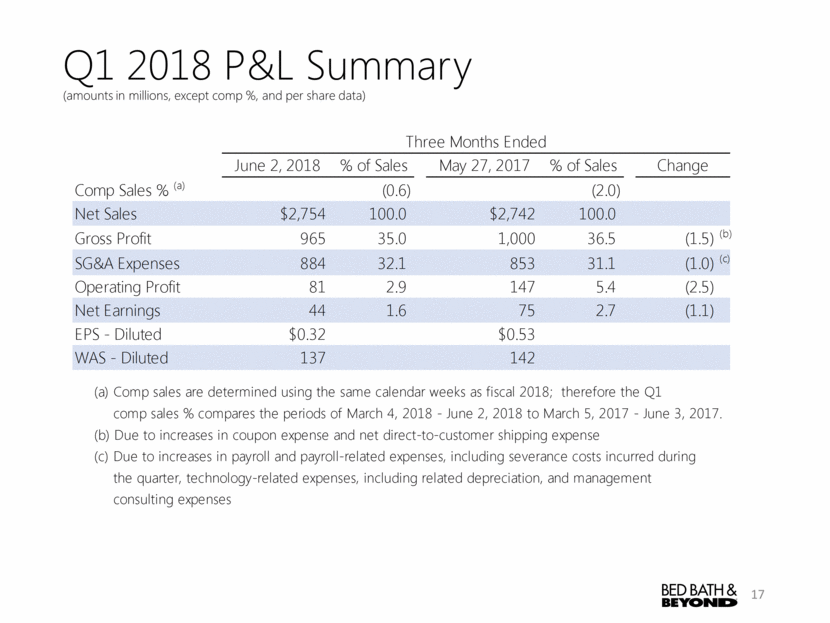
Q1 2018 P&L Summary (amounts in millions, except comp %, and per share data) 17 June 2, 2018 % of Sales May 27, 2017 % of Sales Comp Sales % (a) (0.6) (2.0) Net Sales $2,754 100.0 $2,742 100.0 Gross Profit 965 35.0 1,000 36.5 (1.5) (b) SG&A Expenses 884 32.1 853 31.1 (1.0) (c) Operating Profit 81 2.9 147 5.4 (2.5) Net Earnings 44 1.6 75 2.7 (1.1) EPS - Diluted $0.32 $0.53 WAS - Diluted 137 142 (c) Due to increases in payroll and payroll-related expenses, including severance costs incurred during the quarter, technology-related expenses, including related depreciation, and management consulting expenses (b) Due to increases in coupon expense and net direct-to-customer shipping expense Change Three Months Ended comp sales % compares the periods of March 4, 2018 - June 2, 2018 to March 5, 2017 - June 3, 2017. (a) Comp sales are determined using the same calendar weeks as fiscal 2018; therefore the Q1
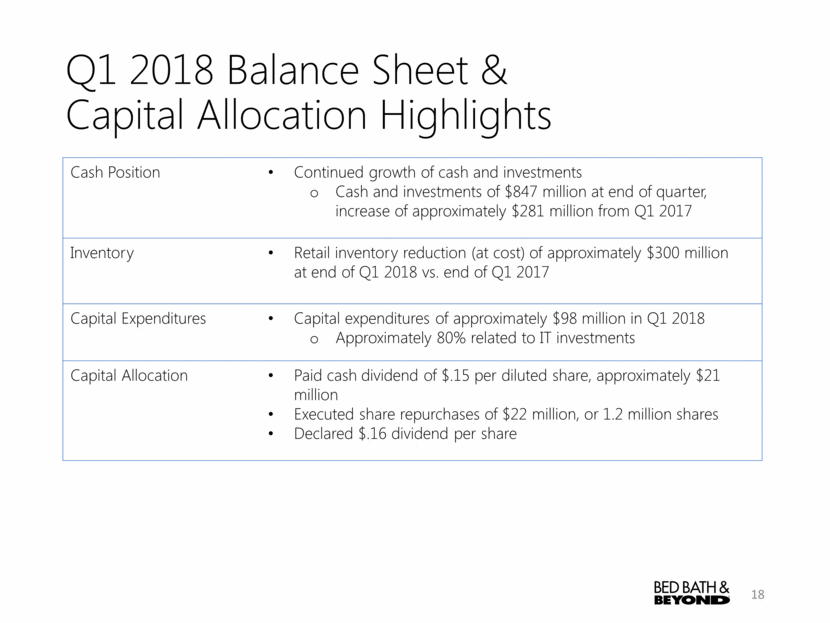
Q1 2018 Balance Sheet & Capital Allocation Highlights Cash Position Continued growth of cash and investments Cash and investments of $847 million at end of quarter, increase of approximately $281 million from Q1 2017 Inventory Retail inventory reduction (at cost) of approximately $300 million at end of Q1 2018 vs. end of Q1 2017 Capital Expenditures Capital expenditures of approximately $98 million in Q1 2018 Approximately 80% related to IT investments Capital Allocation Paid cash dividend of $.15 per diluted share, approximately $21 million Executed share repurchases of $22 million, or 1.2 million shares Declared $.16 dividend per share 18
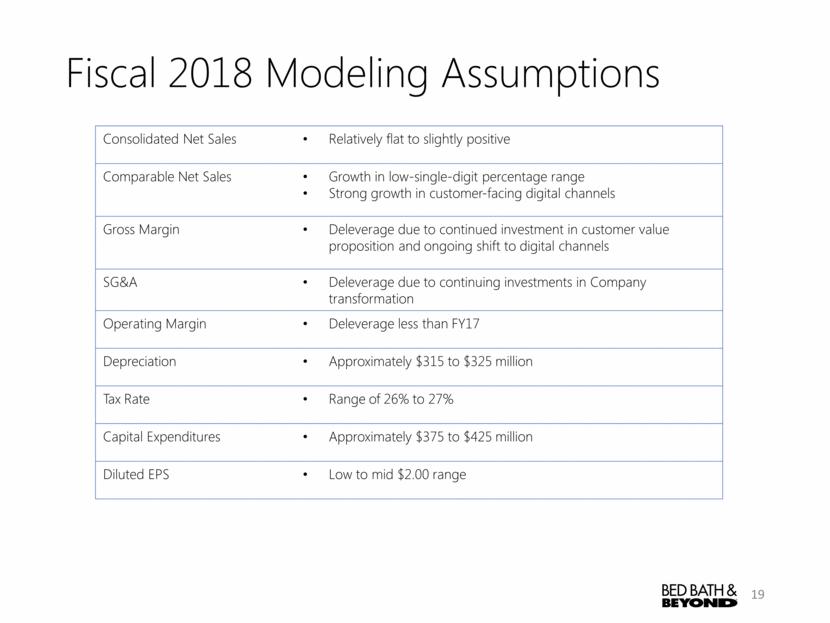
Fiscal 2018 Modeling Assumptions Consolidated Net Sales Relatively flat to slightly positive Comparable Net Sales Growth in low-single-digit percentage range Strong growth in customer-facing digital channels Gross Margin Deleverage due to continued investment in customer value proposition and ongoing shift to digital channels SG&A Deleverage due to continuing investments in Company transformation Operating Margin Deleverage less than FY17 Depreciation Approximately $315 to $325 million Tax Rate Range of 26% to 27% Capital Expenditures Approximately $375 to $425 million Diluted EPS Low to mid $2.00 range 19
