Attached files
| file | filename |
|---|---|
| 8-K - KIMBALL ELECTRONICS, INC. FORM 8-K - Kimball Electronics, Inc. | ke06262018investorpresenta.htm |

Investor Presentation June 2018

KIMBALL ELECTRONICS (Nasdaq: KE) // Safe Harbor Statement Certain statements contained within this presentation may be considered forward-looking under the Private Securities Litigation Reform Act of 1995 and are subject to risks and uncertainties including, but not limited to, successful integration of acquisitions and new operations, global economic conditions, geopolitical environment, significant reductions in volumes and order patterns from key contract customers, loss of key customers or suppliers, financial stability of key customers and suppliers, availability or cost of raw materials, and increased competitive pricing pressures reflecting excess industry capacities. Additional cautionary statements regarding other risk factors that could have an effect on the future performance of Kimball Electronics, Inc. (the “Company”) are contained in the Company’s Annual Report on Form 10-K for the fiscal year ended June 30, 2017 and other filings with the Securities and Exchange Commission (the “SEC”). This presentation contains non-GAAP financial measures. A non-GAAP financial measure is a numerical measure of a company’s financial performance that excludes or includes amounts so as to be different than the most directly comparable measure calculated and presented in accordance with Generally Accepted Accounting Principles (GAAP) in the United States in the statement of income, statement of comprehensive income, balance sheet, statement of cash flows, or statement of equity of the company. The non-GAAP financial measures contained herein include Adjusted Operating Income/Margin, Adjusted Net Income/Margin, Adjusted EBITDA/Margin, Tangible Book Value, Tangible Book Value per Share, Adjusted Earnings Per Share, and Return on Invested Capital (ROIC), which have been adjusted for spin-off expenses, restructuring charges, proceeds from a lawsuit settlement, a bargain purchase gain, and discrete tax items related to the U.S. Tax Cuts and Jobs Act (“Tax Reform”) enacted in December 2017. Management believes it is useful for investors to understand how its core operations performed without the effects of incremental costs related to the spin-off, restructuring charges, the lawsuit proceeds, the bargain purchase gain, and discrete tax items related to Tax Reform. Excluding these amounts allows investors to meaningfully trend, analyze, and benchmark the performance of the Company’s core operations. Many of the Company’s internal performance measures that management uses to make certain operating decisions use these and other non-GAAP measures to enable meaningful trending of core operating metrics.

KIMBALL ELECTRONICS (Nasdaq: KE) // Who We Are Global contract manufacturer Headquarters: of electronic components used in… Jasper, Indiana Automotive, Industrial, Medical & Public Safety Industries Established in 1961 Focused on non-commodity products and components that require … Nasdaq: KE complexity, quality, reliability, and durability Market Cap*: $511 MM TTM** Revenue: $1.0 B 5,400 employees, 9 manufacturing facilities in 6 countries * As of June 18, 2018 KIMBALL ELECTRONICS **TTM – Trailing twelve months ended March 2018, Unaudited 3

KIMBALL ELECTRONICS (Nasdaq: KE) // Why Invest? Expect high single-digit revenue Opportunities to expand growth from focus on end Above Average Opportunities profitability and returns as markets with strong secular Revenue to Expand utilization rates increase and growth opportunities, Profitability new customer programs mature, growth outsourcing trends, and and Returns as well as from contribution expected market share gains from new strategic investments Focus in areas that require complexity, regulatory approval, Strong balance sheet with track Sustainable and durable electronics provides Strong record of disciplined capital Competitive barriers to entry for competitors, Balance allocation decisions Advantage allowing for sustainable long- Sheet term customer relationships KIMBALL ELECTRONICS 4
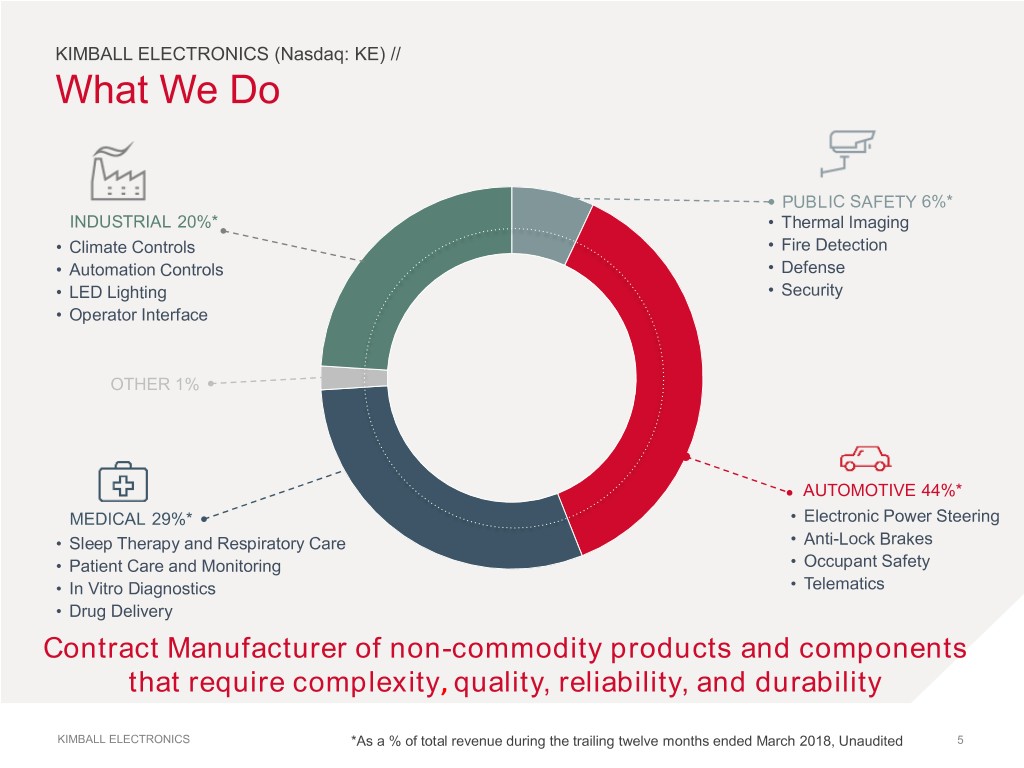
KIMBALL ELECTRONICS (Nasdaq: KE) // What We Do PUBLIC SAFETY 6%* INDUSTRIAL 20%* • Thermal Imaging • Climate Controls • Fire Detection • Automation Controls • Defense • LED Lighting • Security • Operator Interface OTHER 1% AUTOMOTIVE 44%* MEDICAL 29%* • Electronic Power Steering • Sleep Therapy and Respiratory Care • Anti-Lock Brakes • Patient Care and Monitoring • Occupant Safety • In Vitro Diagnostics • Telematics • Drug Delivery Contract Manufacturer of non-commodity products and components that require complexity, quality, reliability, and durability KIMBALL ELECTRONICS *As a % of total revenue during the trailing twelve months ended March 2018, Unaudited 5
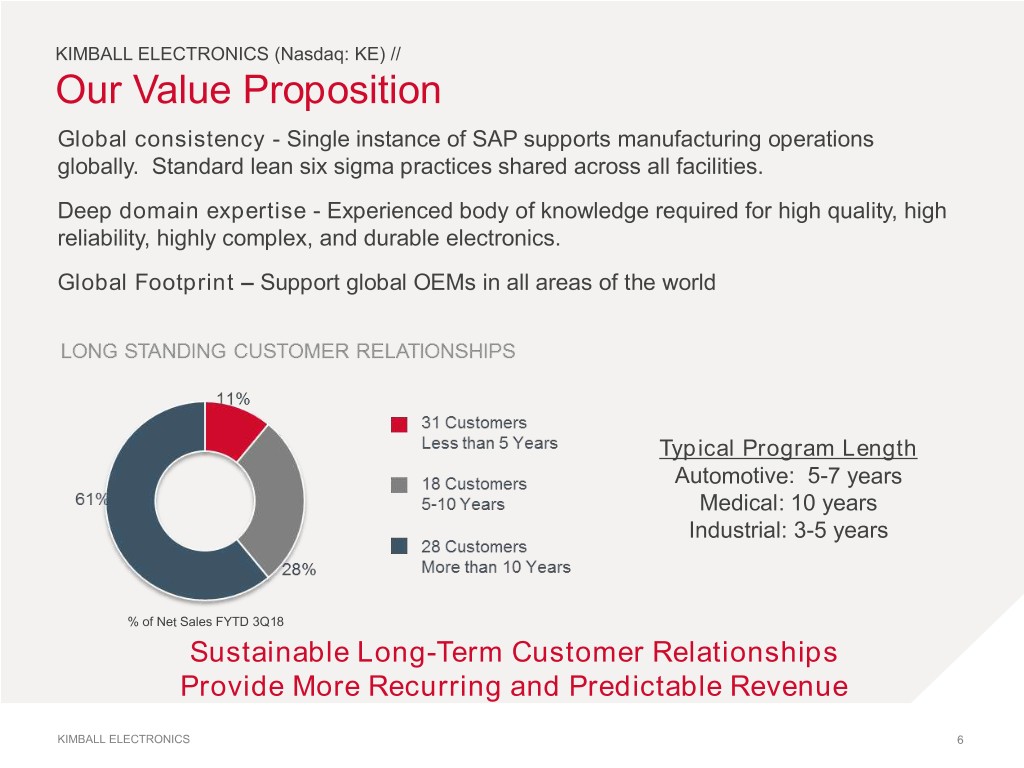
KIMBALL ELECTRONICS (Nasdaq: KE) // Our Value Proposition Global consistency - Single instance of SAP supports manufacturing operations globally. Standard lean six sigma practices shared across all facilities. Deep domain expertise - Experienced body of knowledge required for high quality, high reliability, highly complex, and durable electronics. Global Footprint – Support global OEMs in all areas of the world Typical Program Length Automotive: 5-7 years Medical: 10 years Industrial: 3-5 years % of Net Sales FYTD 3Q18 Sustainable Long-Term Customer Relationships Provide More Recurring and Predictable Revenue KIMBALL ELECTRONICS 6
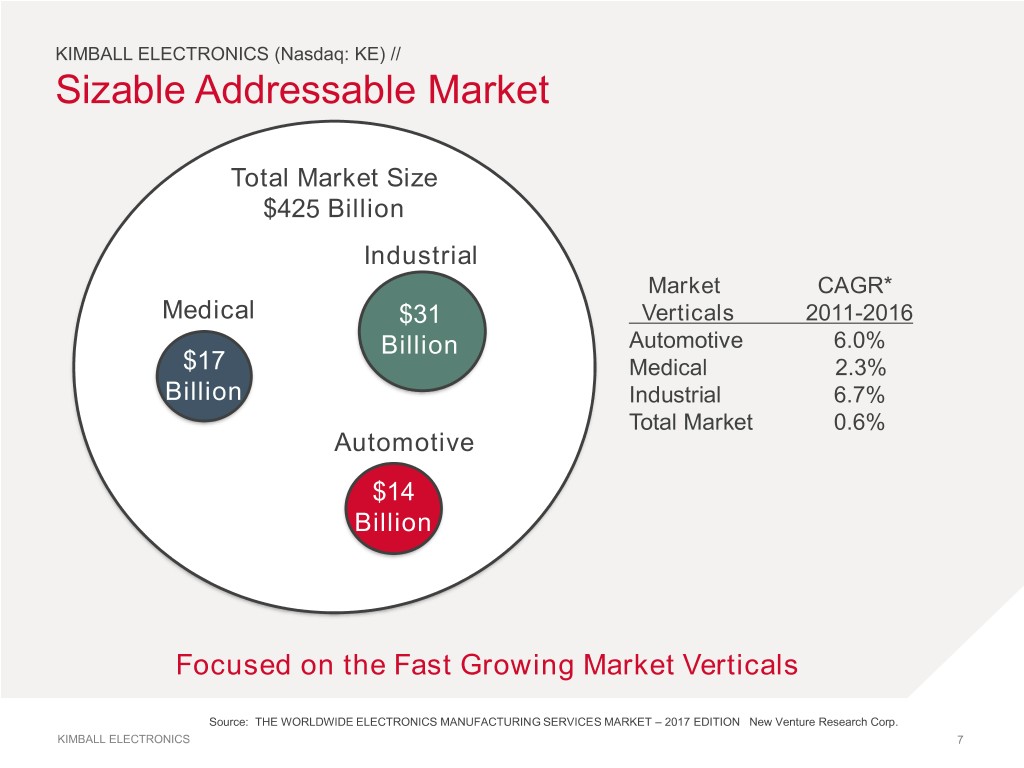
KIMBALL ELECTRONICS (Nasdaq: KE) // Sizable Addressable Market Total Market Size $425 Billion Industrial Market CAGR* Medical $31 Verticals 2011-2016 Billion Automotive 6.0% $17 Medical 2.3% Billion Industrial 6.7% Total Market 0.6% Automotive $14 Billion Focused on the Fast Growing Market Verticals Source: THE WORLDWIDE ELECTRONICS MANUFACTURING SERVICES MARKET – 2017 EDITION New Venture Research Corp. KIMBALL ELECTRONICS 7
KIMBALL ELECTRONICS (Nasdaq: KE) // Rapid Change for Traditional Manufacturing • Outsourcing is accelerating… – Faster Time to Market – Allocating resources to points of differentiation – Eco-system is becoming exponentially more complicated – Global Worker Shortage •Disruption is coming… – Automation – 3D Printing – Artificial Intelligence Creates Multiple Opportunities for Kimball Electronics KIMBALL ELECTRONICS 8
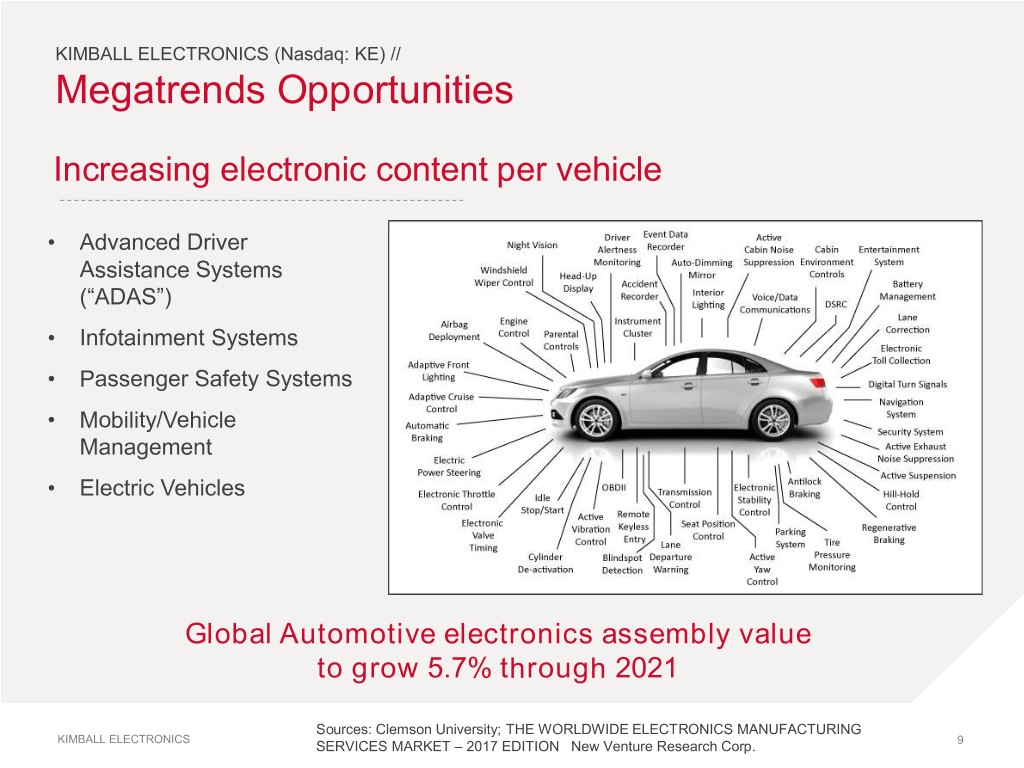
KIMBALL ELECTRONICS (Nasdaq: KE) // Megatrends Opportunities Increasing electronic content per vehicle • Advanced Driver Assistance Systems (“ADAS”) • Infotainment Systems • Passenger Safety Systems • Mobility/Vehicle Management • Electric Vehicles Global Automotive electronics assembly value to grow 5.7% through 2021 Sources: Clemson University; THE WORLDWIDE ELECTRONICS MANUFACTURING KIMBALL ELECTRONICS SERVICES MARKET – 2017 EDITION New Venture Research Corp. 9

KIMBALL ELECTRONICS (Nasdaq: KE) // Megatrends Opportunities Healthcare Growth Internet Connected Devices • Aging Population • Internet of Things • Increasing Access to Care • Smart Metering • Remote Patient Monitoring • Energy Efficient Lighting Global Medical electronics assembly value to grow 4.3% through 2021 Global Industrial electronics assembly value to grow 4.5% through 2021 KIMBALL ELECTRONICS * THE WORLDWIDE ELECTRONICS MANUFACTURING SERVICES MARKET – 2017 EDITION New Venture Research Corp. 10

KIMBALL ELECTRONICS (Nasdaq: KE) // Creating Shareholder Value Target end markets with strong secular growth Make investments that enable greater strategic customer engagement and enhance return profile Leveraging existing assets & continuously improving efficiencies KIMBALL ELECTRONICS 11
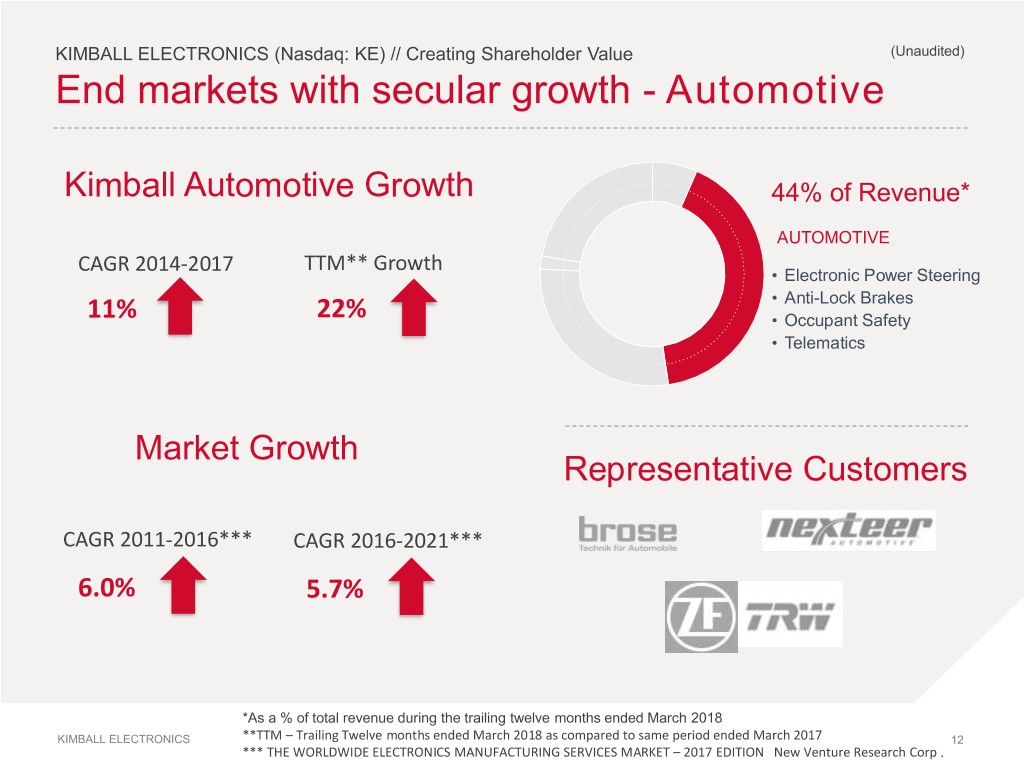
KIMBALL ELECTRONICS (Nasdaq: KE) // Creating Shareholder Value (Unaudited) End markets with secular growth - Automotive Kimball Automotive Growth 44% of Revenue* AUTOMOTIVE TTM** Growth CAGR 2014-2017 • Electronic Power Steering • Anti-Lock Brakes 11% 22% • Occupant Safety • Telematics Market Growth Representative Customers CAGR 2011-2016*** CAGR 2016-2021*** 6.0% 5.7% *As a % of total revenue during the trailing twelve months ended March 2018 KIMBALL ELECTRONICS **TTM – Trailing Twelve months ended March 2018 as compared to same period ended March 2017 12 *** THE WORLDWIDE ELECTRONICS MANUFACTURING SERVICES MARKET – 2017 EDITION New Venture Research Corp .
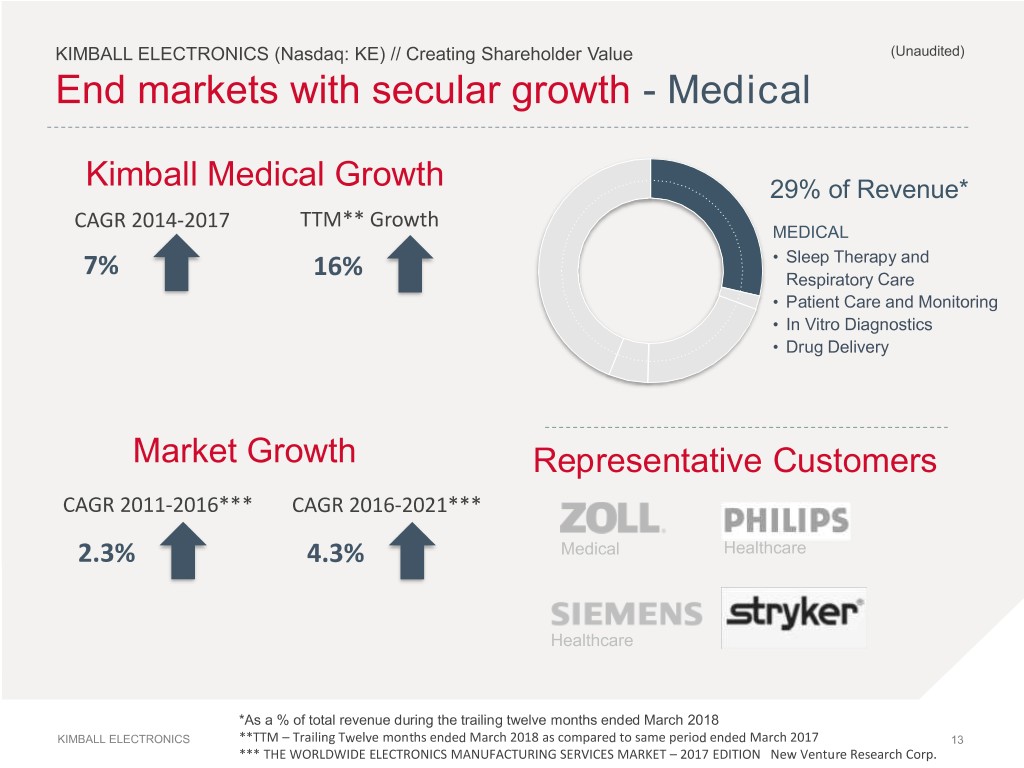
KIMBALL ELECTRONICS (Nasdaq: KE) // Creating Shareholder Value (Unaudited) End markets with secular growth - Medical Kimball Medical Growth 29% of Revenue* CAGR 2014-2017 TTM** Growth MEDICAL • Sleep Therapy and 7% 16% Respiratory Care • Patient Care and Monitoring • In Vitro Diagnostics • Drug Delivery Market Growth Representative Customers CAGR 2011-2016*** CAGR 2016-2021*** 2.3% 4.3% Medical Healthcare Healthcare *As a % of total revenue during the trailing twelve months ended March 2018 KIMBALL ELECTRONICS **TTM – Trailing Twelve months ended March 2018 as compared to same period ended March 2017 13 *** THE WORLDWIDE ELECTRONICS MANUFACTURING SERVICES MARKET – 2017 EDITION New Venture Research Corp.

KIMBALL ELECTRONICS (Nasdaq: KE) // Creating Shareholder Value (Unaudited) End markets with secular growth – Industrial 20% of Revenue* Kimball Industrial Growth INDUSTRIAL CAGR 2014-2017 TTM** Growth • Climate Controls • Automation Controls • LED Lighting 3% 5% • Operator Interface Market Growth Representative Customers CAGR 2011-2016*** CAGR 2016-2021*** 6.7% 4.5% *As a % of total revenue during the trailing twelve months ended March 2018 KIMBALL ELECTRONICS ** TTM – Trailing Twelve months ended March 2018 as compared to same period ended March 2017 14 *** THE WORLDWIDE ELECTRONICS MANUFACTURING SERVICES MARKET – 2017 EDITION New Venture Research Corp.

KIMBALL ELECTRONICS (Nasdaq: KE) // Creating Shareholder Value Investments that increase customer engagement Diversified Contract Manufacturing Services (DCMS) Offer manufacturing services for non-electronic components, plastics, and metal fabrication in existing markets/customers • Increase customer engagement - Offer turnkey and/or larger package of value to the customer • Enhance returns - Attractive margin and return profile Metal Fabrication Plastics KIMBALL ELECTRONICS 15
KIMBALL ELECTRONICS (Nasdaq: KE) // Creating Shareholder Value Investments that increase customer engagement Automation, Test & Measurement Systems (AT&M) Expand capabilities to manufacture, install, and service manufacturing systems • Enable greater strategic customer engagement – Engaged in the decision to build internally or contract, as well as the decision of How to build it • Enhance profitability/return with a business that includes proprietary products, software, and services • Improve existing operations - Leverage AT&M expertise to improve efficiencies of existing facilities
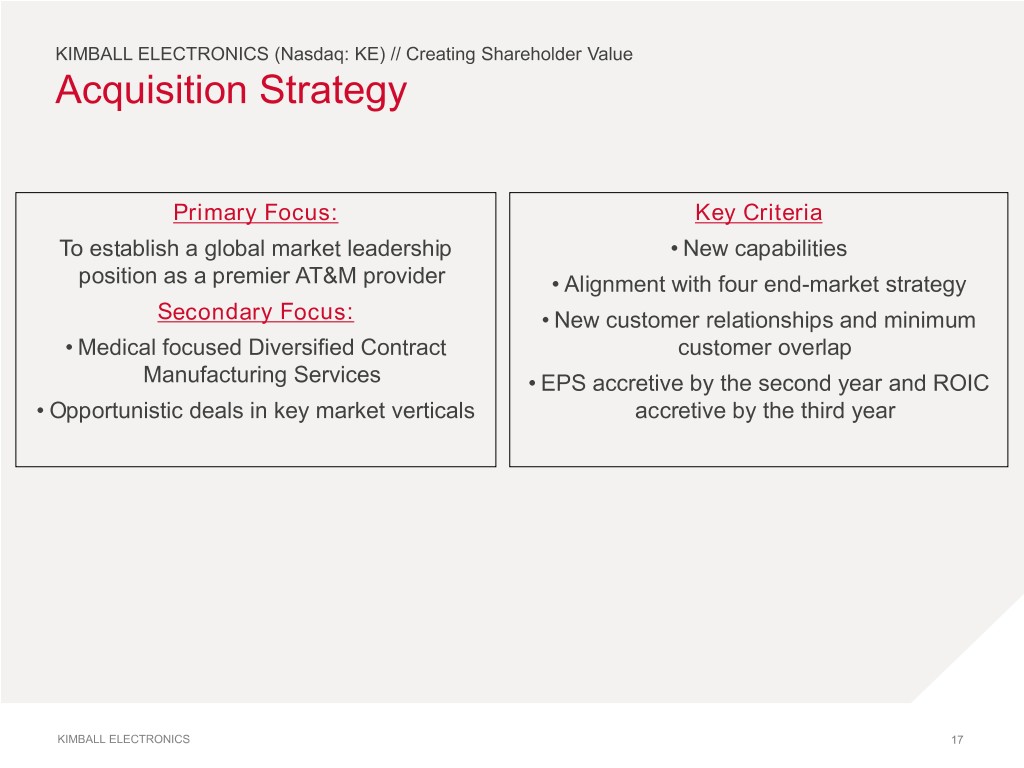
KIMBALL ELECTRONICS (Nasdaq: KE) // Creating Shareholder Value Acquisition Strategy Primary Focus: Key Criteria To establish a global market leadership • New capabilities position as a premier AT&M provider • Alignment with four end-market strategy Secondary Focus: • New customer relationships and minimum • Medical focused Diversified Contract customer overlap Manufacturing Services • EPS accretive by the second year and ROIC • Opportunistic deals in key market verticals accretive by the third year KIMBALL ELECTRONICS 17

KIMBALL ELECTRONICS (Nasdaq: KE) // Creating Shareholder Value Leveraging existing assets Greenfield Romania Plant Completed Construction in FY 2016 Expected to Operate Breakeven by FYE 2018 Poznan, Poland Greenfield China Plant Completed Construction in 2005 Indianapolis, IN Reach Target Contribution by 2010 Jasper, IN Timisoara, Romania Tampa, FL Nanjing, China Reynosa, Mexico Laem Chabang, Thailand 1.2 million square feet of owned manufacturing space KIMBALL ELECTRONICS 18 4,300+ Employees Worldwide 1,160,000 sq. ft. Total Facility Square Footage
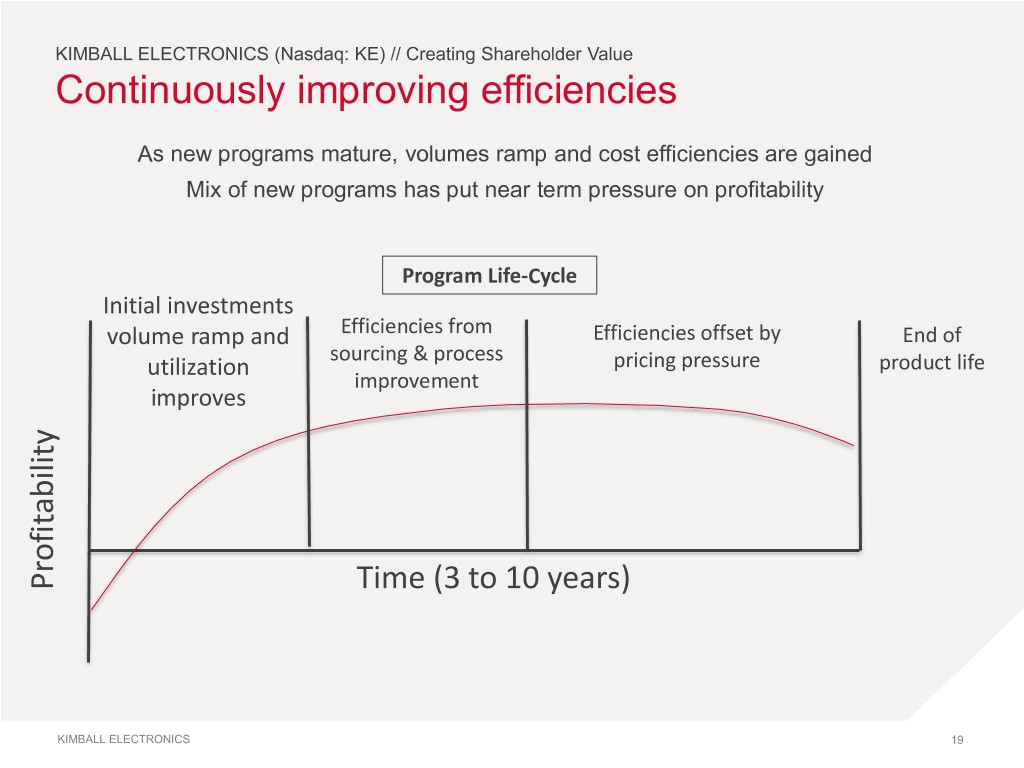
KIMBALL ELECTRONICS (Nasdaq: KE) // Creating Shareholder Value Continuously improving efficiencies As new programs mature, volumes ramp and cost efficiencies are gained Mix of new programs has put near term pressure on profitability Program Life-Cycle Initial investments volume ramp and Efficiencies from Efficiencies offset by End of sourcing & process utilization pricing pressure product life improvement improves Profitability Time (3 to 10 years) KIMBALL ELECTRONICS 19

KIMBALL ELECTRONICS (Nasdaq: KE) // Financial Review Revenue Growth, Margin Expansion, and Strong Financial Profile KIMBALL ELECTRONICS 20
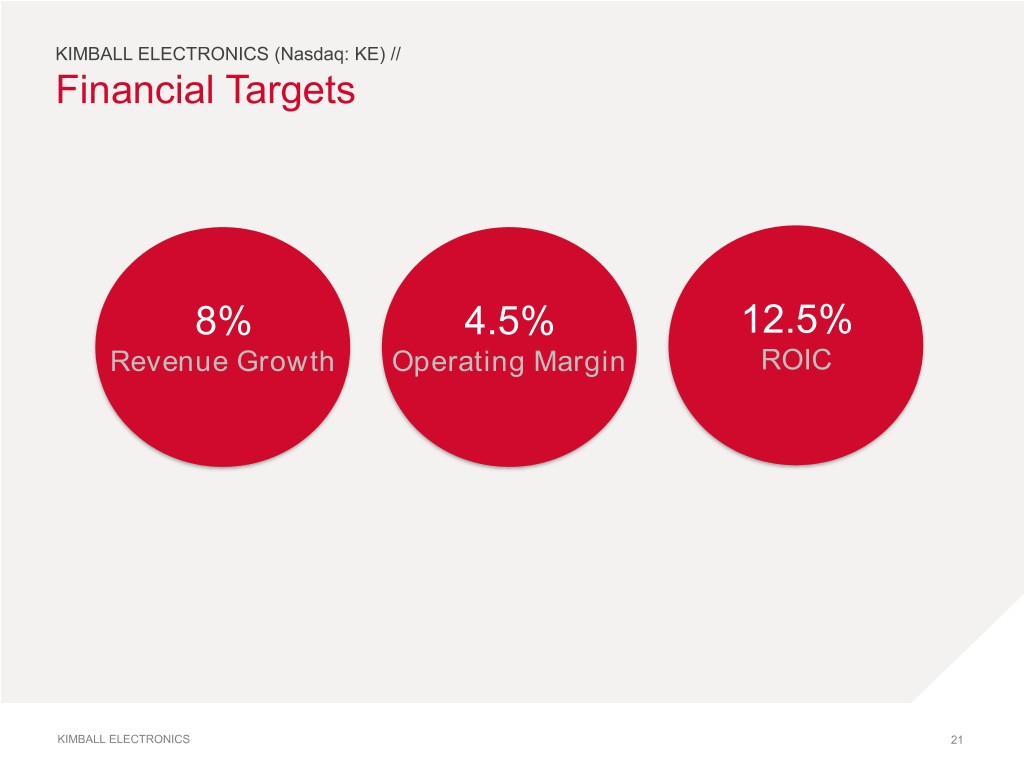
KIMBALL ELECTRONICS (Nasdaq: KE) // Financial Targets 8% 4.5% 12.5% Revenue Growth Operating Margin ROIC KIMBALL ELECTRONICS 21

KIMBALL ELECTRONICS (Nasdaq: KE) // Revenue Performance Target 8% - Achieving above target growth rates 8% - CAGR Fiscal Year 2014 to Fiscal Year 2017 14% growth during trailing twelve month (TTM) period ended fiscal 3Q18 (March) $1,100 $1,000 $900 $800 $700 $600 $500 $400 $300 In $ millions FY14 FY15 FY16 FY17 TTM TTM 3Q17 3Q18 (Unaudited) (Unaudited) KIMBALL ELECTRONICS 22

KIMBALL ELECTRONICS (Nasdaq: KE) // Profitability Trends (Unaudited) Adjusted Operating Income/Margin* Target 4.5% Operating Margin Expect improvement from ramping utilization of greenfield plant in Romania and maturity of new programs $45 4.8% 5.0% 4.3% 4.2% 3.8% 4.5% $40 3.6% 3.5% 4.0% $35 3.5% $30 3.0% 2.5% $25 2.0% $20 1.5% 1.0% $15 0.5% $10 0.0% In $ millions FY14 FY15 FY16 FY17 TTM TTM 3Q17 3Q18 • Adjusted Operating Income and Margin are Non-GAAP terms. A reconciliation is provided in the appendix of this presentation. KIMBALL ELECTRONICS 23

KIMBALL ELECTRONICS (Nasdaq: KE) // Profitability Trends (Unaudited) Adjusted EBITDA/Margin* Expect improvement from ramping utilization of greenfield plant in Romania and maturity of new programs $80 8.0% 6.9% 7.0% 6.9% 6.8% $70 6.3% 7.0% 5.7% $60 6.0% 5.0% $50 4.0% $40 3.0% $30 2.0% $20 1.0% $10 0.0% In $ millions FY14 FY15 FY16 FY17 TTM TTM 3Q17 3Q18 * Adjusted EBITDA and Margin are Non-GAAP terms. A reconciliation is provided in the appendix of this presentation. KIMBALL ELECTRONICS 24

KIMBALL ELECTRONICS (Nasdaq: KE) // (Unaudited) ROIC Trends Target 12.5% ROIC 2016 Investment in greenfield plant in Romania – Expect improvement from ramping utilization in Romania and maturity of new programs 14.0% $20 12.4% 12.5% 12.0% 10.7% 10.7% 10.4% 10.2% $16 9.6% 9.6% 10.0% 9.0% 9.0% 7.9% 8.7% 7.7% 8.0% $12 6.0% $8 4.0% $4 2.0% 0.0% $0 In $ millions Capex ROIC * ROIC is a Non-GAAP term. A reconciliation is provided in the appendix of this presentation. KIMBALL ELECTRONICS 25

KIMBALL ELECTRONICS (Nasdaq: KE) // (Unaudited) Growing Book Value Growth in Tangible Book Value Per Share/ $14 Adjusted Earnings Per Share* $13 $12 $1.01 $1.12 $11 $0.77 EPS $10 $0.97 Book Value $9 $8 $7 $6 FY15 FY16 FY17 YTD 3Q18 * Adjusted Earnings Per share and Tangible Book Value are Non-GAAP terms. A reconciliation is provided in the appendix of this presentation. KIMBALL ELECTRONICS 26

KIMBALL ELECTRONICS (Nasdaq: KE) // (Unaudited) Strong Balance Sheet As of 3/31/2018 $44M in cash No long-term debt $50M credit facility, with option to increase to $75 million 1.2 million square feet of owned manufacturing space Consistent Working Capital management DSO – 60 to 65 days Inventory Turns – 5.5x to 6x per year Cash Conversion Cycle – 58 to 62 days KIMBALL ELECTRONICS 27
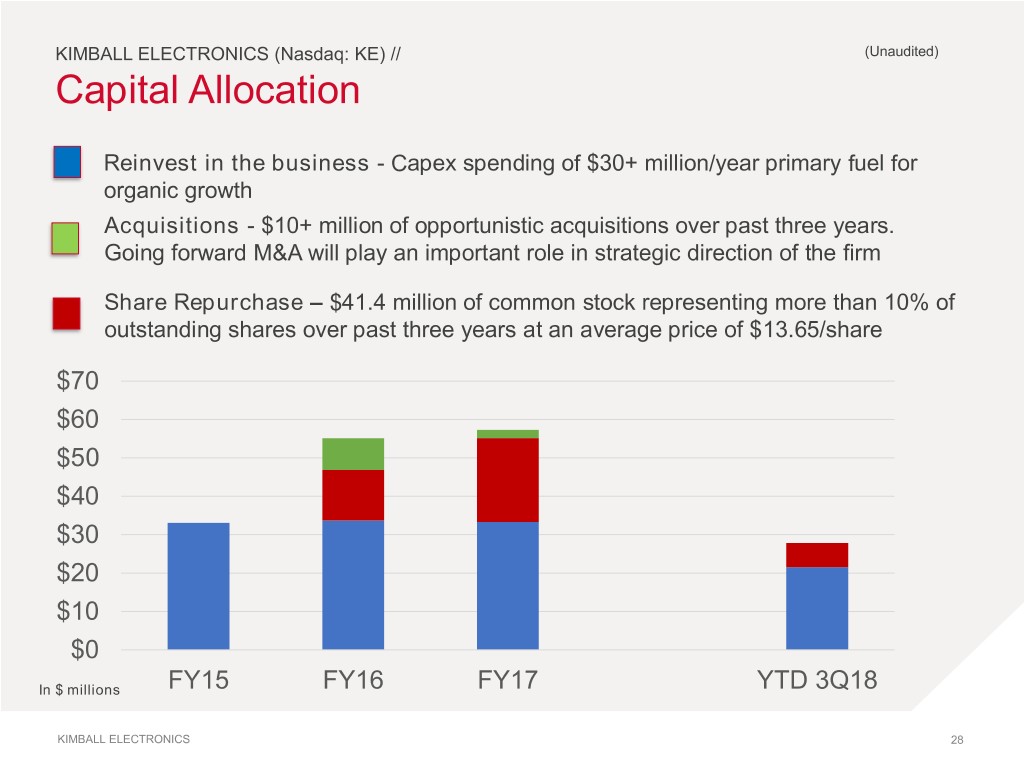
KIMBALL ELECTRONICS (Nasdaq: KE) // (Unaudited) Capital Allocation Reinvest in the business - Capex spending of $30+ million/year primary fuel for organic growth Acquisitions - $10+ million of opportunistic acquisitions over past three years. Going forward M&A will play an important role in strategic direction of the firm Share Repurchase – $41.4 million of common stock representing more than 10% of outstanding shares over past three years at an average price of $13.65/share $70 $60 $50 $40 $30 $20 $10 $0 In $ millions FY15 FY16 FY17 YTD 3Q18 KIMBALL ELECTRONICS 28

KIMBALL ELECTRONICS (Nasdaq: KE) // Why Invest? Expect high single-digit revenue Opportunities to expand growth from focus on end Above Average Opportunities profitability and returns as markets with strong secular Revenue to Expand utilization rates increase and growth opportunities, Profitability new customer programs mature, growth outsourcing trends, and and Returns as well as from contribution expected market share gains from new strategic investments Focus in areas that require complexity, regulatory approval Strong balance sheet with track Sustainable and durable electronics provides Strong record of disciplined capital Competitive barriers to entry for competitors, Balance allocation decisions Advantage allowing for sustainable long- Sheet term customer relationships KIMBALL ELECTRONICS 29

QUESTIONS KIMBALL ELECTRONICS 30

KIMBALL ELECTRONICS (Nasdaq: KE) // (Unaudited) Reconciliation of Non-GAAP Results (In Millions) FY14 FY15 FY16 FY17 TTM 3Q17 TTM 3Q18 Revenue, as reported $ 742 $ 819 $ 842 $ 931 $ 910 $ 1,037 Operating Income, as reported $ 29.930 $ 36.355 $ 29.722 $ 43.057 $ 43.392 $ 39.449 Add: Spin-off Expenses 2.233 2.594 0.137 - - - Add: Restructuring Charges 0.402 - - - - - Less: Lawsuit Proceeds 5.688 - - 4.005 4.005 - Adjusted Operating Income $ 26.877 $ 38.949 $ 29.859 $ 39.052 $ 39.387 $ 39.449 Adjusted Operating Margin 3.6% 4.8% 3.5% 4.2% 4.3% 3.8% Net Income, as reported $ 24.613 $ 26.205 $ 22.287 $ 34.179 $ 31.822 $ 19.096 Add: Spin-off Costs 2.233 2.426 0.085 - - - Add: Restructuring Charges 0.251 - - - - - Add: Discrete Tax Items from Tax Reform - - - - - 16.450 Less: Lawsuit Proceeds 3.549 - - 2.499 2.499 - Less: Bargain Purchase Gain - - - 0.925 0.925 - Adjusted Net Income $ 23.548 $ 28.631 $ 22.372 $ 30.755 $ 28.398 $ 35.546 Adjusted Net Income Margin 3.2% 3.5% 2.7% 3.3% 3.1% 3.4% Adjusted Net Income $ 23.548 $ 28.631 $ 22.372 $ 30.755 $ 28.398 $ 35.546 Add Interest, net (0.039) (0.025) 0.001 0.207 0.122 0.423 Add Depreciation & Amortization 17.889 19.607 19.869 23.904 23.034 25.982 Add Taxes 5.629 8.566 5.689 10.076 10.926 8.576 Adjusted EBITDA $ 47.027 $ 56.779 $ 47.931 $ 64.942 $ 62.480 $ 70.527 Adjusted EBITDA Margin 6.3% 6.9% 5.7% 7.0% 6.9% 6.8% KIMBALL ELECTRONICS 31

KIMBALL ELECTRONICS (Nasdaq: KE) // (Unaudited) Reconciliation of Non-GAAP Results (In Millions, except per share data) FY15 FY16 FY17 YTD 3Q18 Shareholders Equity, as reported $ 312.449 $ 324.369 $ 342.272 $ 357.118 Goodwill & Intangibles $ 7.073 $ 10.784 $ 10.772 $ 10.724 Tangible Book Value $ 305.376 $ 313.585 $ 331.500 $ 346.394 Average Shares Outstanding (Dilluted) 29.388 29.176 27.530 27.006 Tangible BV/Share $ 10.39 $ 10.75 $ 12.04 $ 12.83 Diluted Earnings per Share, as reported $ 0.89 $ 0.76 $ 1.24 $ 0.41 Add: Impact of Discrete Tax Items from Tax Reform - - - 0.60 Add: Impact of Spin-off Expenses 0.08 0.01 - - Less: Impact of Settlement Proceeds from Lawsuits - - 0.09 - Less: Bargain Purchase Gain - - 0.03 - Adjusted Diluted Earnings per Share $ 0.97 $ 0.77 $ 1.12 $ 1.01 KIMBALL ELECTRONICS 32
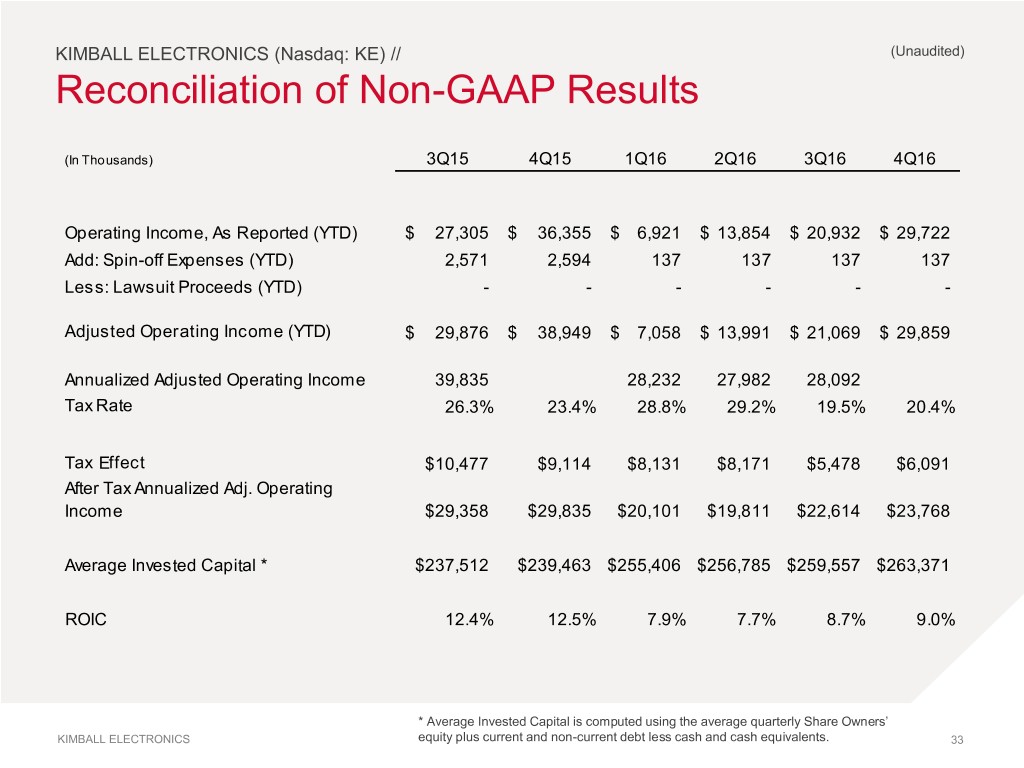
KIMBALL ELECTRONICS (Nasdaq: KE) // (Unaudited) Reconciliation of Non-GAAP Results (In Thousands) 3Q15 4Q15 1Q16 2Q16 3Q16 4Q16 Operating Income, As Reported (YTD) $ 27,305 $ 36,355 $ 6,921 $ 13,854 $ 20,932 $ 29,722 Add: Spin-off Expenses (YTD) 2,571 2,594 137 137 137 137 Less: Lawsuit Proceeds (YTD) - - - - - - Adjusted Operating Income (YTD) $ 29,876 $ 38,949 $ 7,058 $ 13,991 $ 21,069 $ 29,859 Annualized Adjusted Operating Income 39,835 28,232 27,982 28,092 Tax Rate 26.3% 23.4% 28.8% 29.2% 19.5% 20.4% Tax Effect $10,477 $9,114 $8,131 $8,171 $5,478 $6,091 After Tax Annualized Adj. Operating Income $29,358 $29,835 $20,101 $19,811 $22,614 $23,768 Average Invested Capital * $237,512 $239,463 $255,406 $256,785 $259,557 $263,371 ROIC 12.4% 12.5% 7.9% 7.7% 8.7% 9.0% * Average Invested Capital is computed using the average quarterly Share Owners’ KIMBALL ELECTRONICS equity plus current and non-current debt less cash and cash equivalents. 33
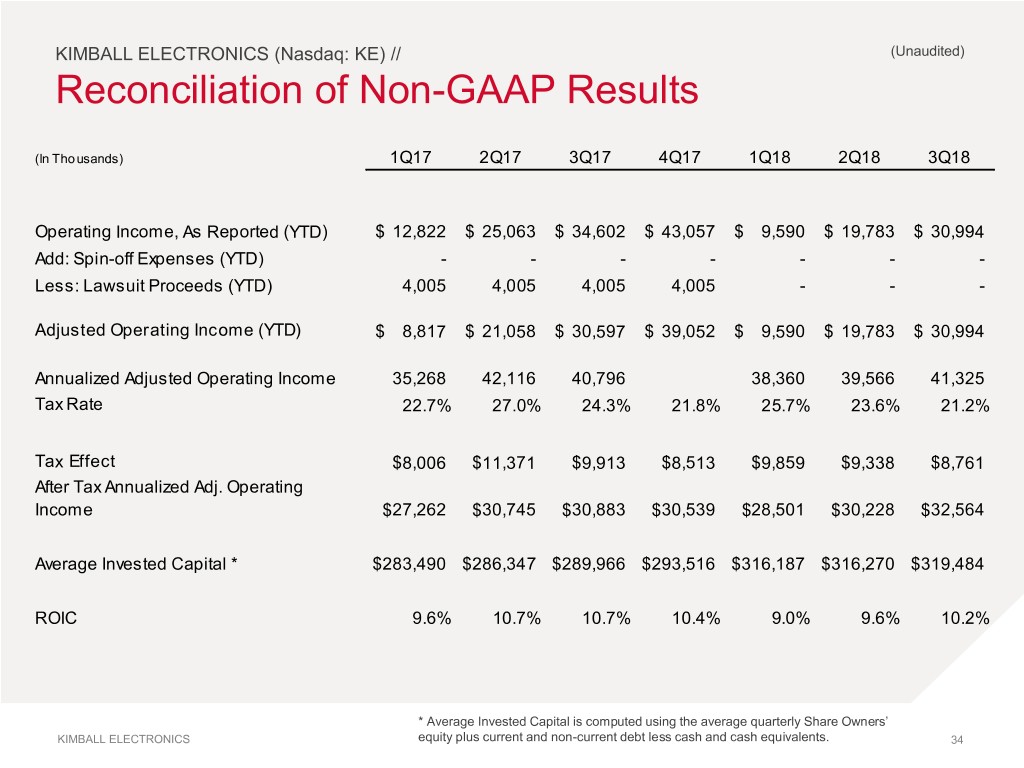
KIMBALL ELECTRONICS (Nasdaq: KE) // (Unaudited) Reconciliation of Non-GAAP Results (In Thousands) 1Q17 2Q17 3Q17 4Q17 1Q18 2Q18 3Q18 Operating Income, As Reported (YTD) $ 12,822 $ 25,063 $ 34,602 $ 43,057 $ 9,590 $ 19,783 $ 30,994 Add: Spin-off Expenses (YTD) - - - - - - - Less: Lawsuit Proceeds (YTD) 4,005 4,005 4,005 4,005 - - - Adjusted Operating Income (YTD) $ 8,817 $ 21,058 $ 30,597 $ 39,052 $ 9,590 $ 19,783 $ 30,994 Annualized Adjusted Operating Income 35,268 42,116 40,796 38,360 39,566 41,325 Tax Rate 22.7% 27.0% 24.3% 21.8% 25.7% 23.6% 21.2% Tax Effect $8,006 $11,371 $9,913 $8,513 $9,859 $9,338 $8,761 After Tax Annualized Adj. Operating Income $27,262 $30,745 $30,883 $30,539 $28,501 $30,228 $32,564 Average Invested Capital * $283,490 $286,347 $289,966 $293,516 $316,187 $316,270 $319,484 ROIC 9.6% 10.7% 10.7% 10.4% 9.0% 9.6% 10.2% * Average Invested Capital is computed using the average quarterly Share Owners’ KIMBALL ELECTRONICS equity plus current and non-current debt less cash and cash equivalents. 34
