Attached files
| file | filename |
|---|---|
| 8-K - FORM 8-K - Frontier Communications Parent, Inc. | d580868d8k.htm |
Exhibit 99.1

Amendment Proposal June 25, 2018 © 2018 Frontier Communications
Agenda 1 Transaction Overview 2 Business and Financial Overview © 2018 Frontier Communications
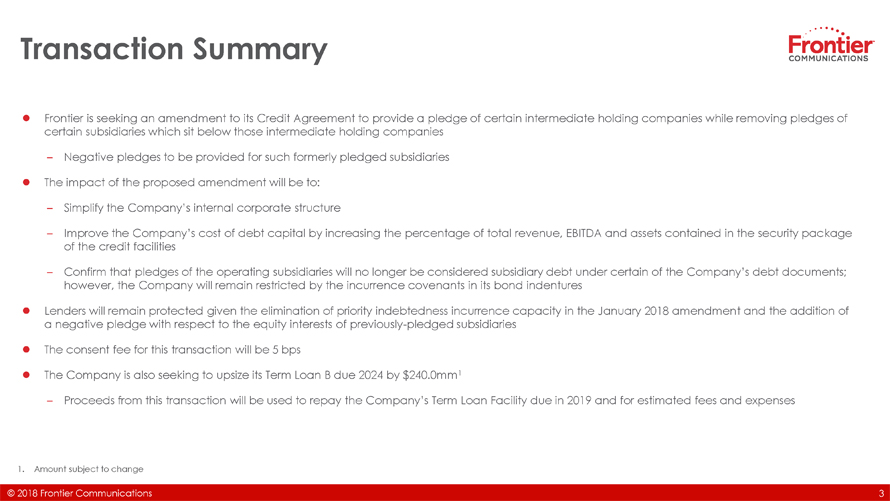
Transaction Summary ï¬ Frontier is seeking an amendment to its Credit Agreement to provide a pledge of certain intermediate holding companies while removing pledges of certain subsidiaries which sit below those intermediate holding companies – Negative pledges to be provided for such formerly pledged subsidiaries ï¬ The impact of the proposed amendment will be to: – Simplify the Company’s internal corporate structure – Improve the Company’s cost of debt capital by increasing the percentage of total revenue, EBITDA and assets contained in the security package of the credit facilities – Confirm that pledges of the operating subsidiaries will no longer be considered subsidiary debt under certain of the Company’s debt documents; however, the Company will remain restricted by the incurrence covenants in its bond indentures ï¬ Lenders will remain protected given the elimination of priority indebtedness incurrence capacity in the January 2018 amendment and the addition of a negative pledge with respect to the equity interests of previously-pledged subsidiaries ï¬ The consent fee for this transaction will be 5 bps ï¬ The Company is also seeking to upsize its Term Loan B due 2024 by $240.0mm1 – Proceeds from this transaction will be used to repay the Company’s Term Loan Facility due in 2019 and for estimated fees and expenses 1. Amount subject to change ***Footnote © 2018 Frontier Communications 3
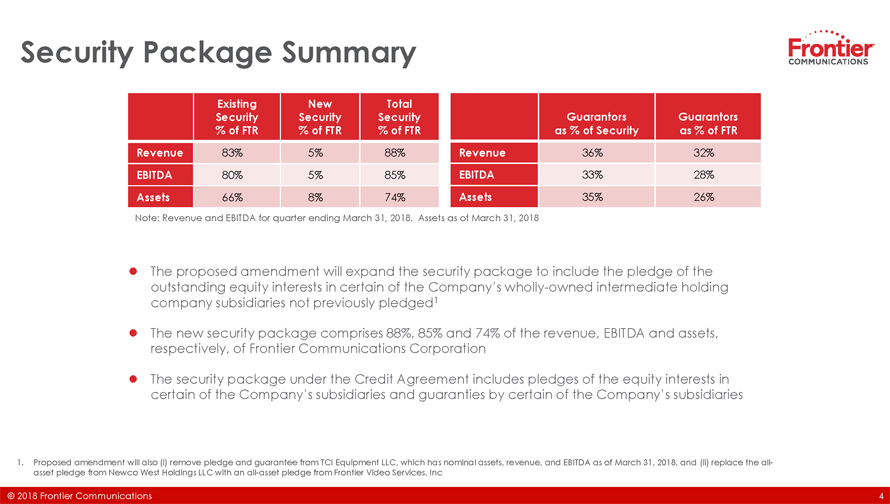
Security Package Summary Existing New Total Security Security Security Guarantors Guarantors % of FTR % of FTR % of FTR as % of Security as % of FTR Revenue 83% 5% 88% Revenue 36% 32% EBITDA 80% 5% 85% EBITDA 33% 28% Assets 66% 8% 74% Assets 35% 26% Note: Revenue and EBITDA for quarter ending March 31, 2018. Assets as of March 31, 2018 ï¬ The proposed amendment will expand the security package to include the pledge of the outstanding equity interests in certain of the Company’s wholly-owned intermediate holding company subsidiaries not previously pledged1 ï¬ The new security package comprises 88%, 85% and 74% of the revenue, EBITDA and assets, respectively, of Frontier Communications Corporation ï¬ The security package under the Credit Agreement includes pledges of the equity interests in certain of the Company’s subsidiaries and guaranties by certain of the Company’s subsidiaries 1. Proposed amendment will also remove pledge and guarantee from TCI Equipment LLC, which has nominal assets, revenue, and EBITDA as of March 31, 2018 ***Footnote © 2018 Frontier Communications
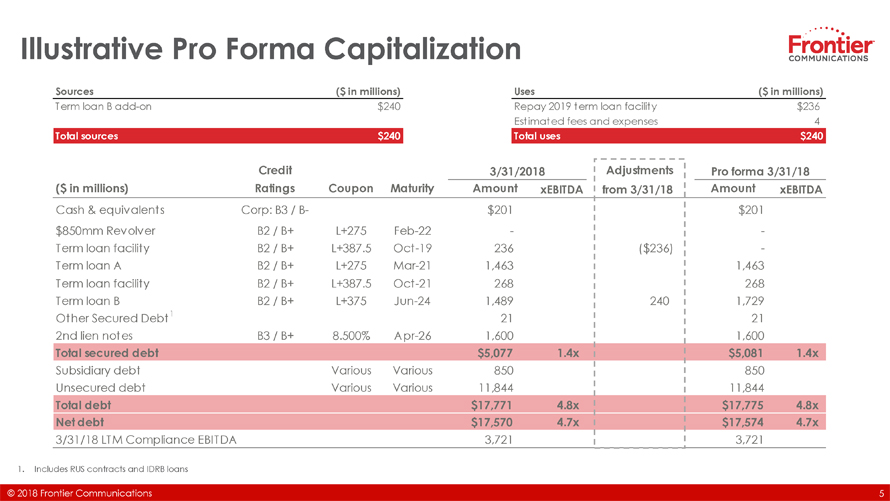
Illustrative Pro Forma Capitalization Sources ($ in millions) Uses ($ in millions) Term loan B add-on $240 Repay 2019 term loan facility $236 Estimated fees and expenses 4 Total sources $240 Total uses $240 Credit 3/31/2018 Adjustments Pro forma 3/31/18 ($ in millions) Ratings Coupon Maturity Amount xEBITDA from 3/31/18 Amount xEBITDA Cash & equivalents Corp: B3 / B- $201 $201 $850mm Revolver B2 / B+ L+275 Feb-22 — -Term loan facility B2 / B+ L+387.5 Oct-19 236 ($236) -Term loan A B2 / B+ L+275 Mar-21 1,463 1,463 Term loan facility B2 / B+ L+387.5 Oct-21 268 268 Term loan B B2 / B+ L+375 Jun-24 1,489 240 1,729 Other Secured Debt1 21 21 2nd lien notes B3 / B+ 8.500% Apr-26 1,600 1,600 Total secured debt $5,077 1.4x $5,081 1.4x Subsidiary debt Various Various 850 850 Unsecured debt Various Various 11,844 11,844 Total debt $17,771 4.8x $17,775 4.8x Net debt $17,570 4.7x $17,574 4.7x 3/31/18 LTM Compliance EBITDA 3,721 3,721 1. Includes RUS contracts and IDRB loans ***Footnote © 2018 Frontier Communications 5
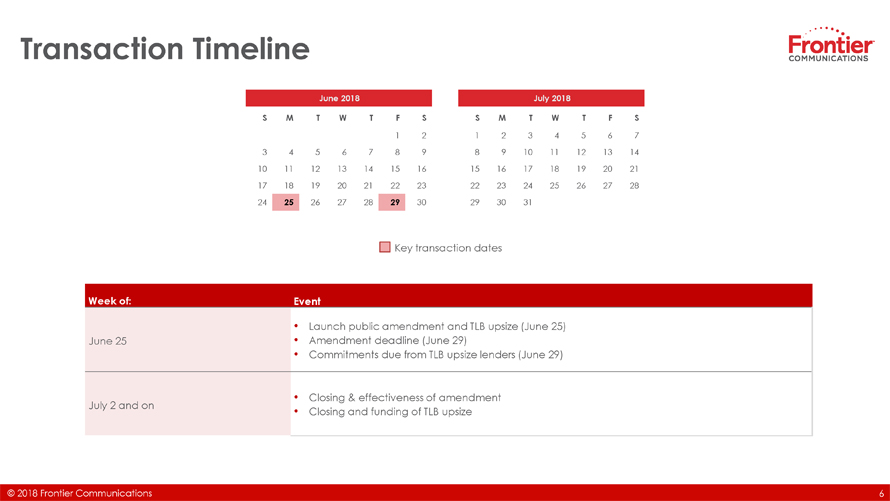
Transaction Timeline June 2018 July 2018 S M T W T F S S M T W T F S 1 2 1 2 3 4 5 6 7 3 4 5 6 7 8 9 8 9 10 11 12 13 14 10 11 12 13 14 15 16 15 16 17 18 19 20 21 17 18 19 20 21 22 23 22 23 24 25 26 27 28 24 25 26 27 28 29 30 29 30 31 Key transaction dates Week of: Event • Launch public amendment and TLB upsize (June 25) June 25 • Amendment deadline (June 29) • Commitments due from TLB upsize lenders (June 29) • Closing & effectiveness of amendment July 2 and on • Closing and funding of TLB upsize ***Footnote © 2018 Frontier Communications

Agenda 1 Transaction Overview 2 Business and Financial Overview © 2018 Frontier Communications
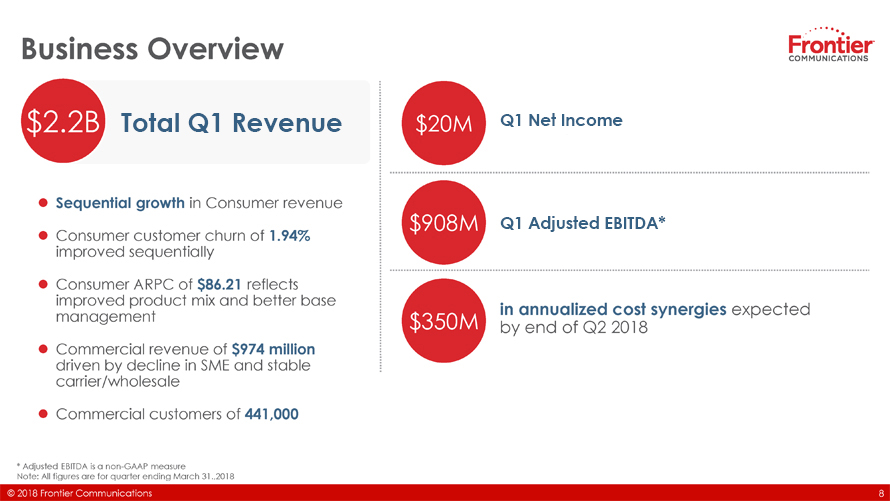
Business Overview $2.2B Total Q1 Revenue $20M Q1 Net Income ï¬ Sequential growth in Consumer revenue $908M Q1 Adjusted EBITDA* ï¬ Consumer customer churn of 1.94% improved sequentially ï¬ Consumer ARPC of $86.21 reflects improved product mix and better base annualized cost synergies management in expected $350M by end of Q2 2018 ï¬ Commercial revenue of $974 million driven by decline in SME and stable carrier/wholesale ï¬ Commercial customers of 441,000 * Adjusted EBITDA is a non-GAAP measure Note: All figures are for quarter ending March 31.,2018 © 2018 Frontier Communications 8
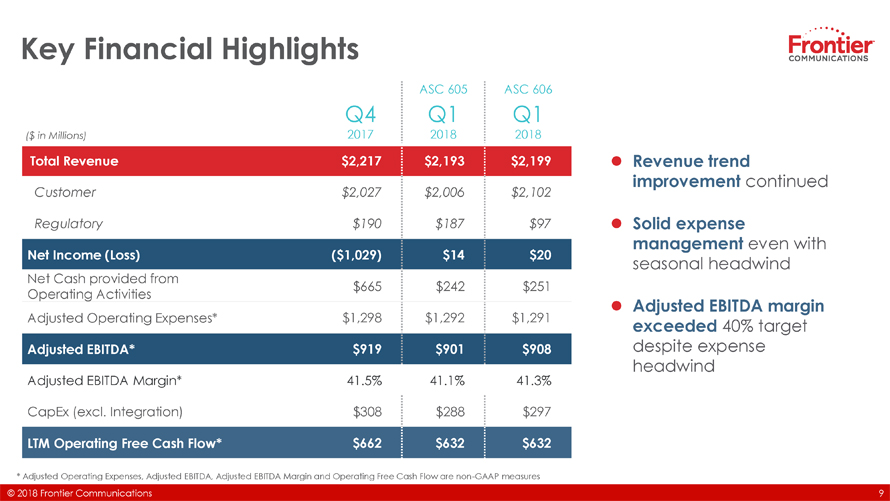
Key Financial Highlights ASC 605 ASC 606 Q4 Q1 Q1 ($ in Millions) 2017 2018 2018 Total Revenue $2,217 $2,193 $2,199 ï¬ Revenue trend improvement continued Customer $2,027 $2,006 $2,102 Regulatory $190 $187 $97 ï¬ Solid expense management even with Net Income (Loss) ($1,029) $14 $20 seasonal headwind Net Cash provided from $665 $242 $251 Operating Activities ï¬ Adjusted EBITDA margin Adjusted Operating Expenses* $1,298 $1,292 $1,291 exceeded 40% target Adjusted EBITDA* $919 $901 $908 despite expense headwind Adjusted EBITDA Margin* 41.5% 41.1% 41.3% CapEx (excl. Integration) $308 $288 $297 LTM Operating Free Cash Flow* $662 $632 $632 * Adjusted Operating Expenses, Adjusted EBITDA, Adjusted EBITDA Margin and Operating Free Cash Flow are non-GAAP measures © 2018 Frontier Communications 9
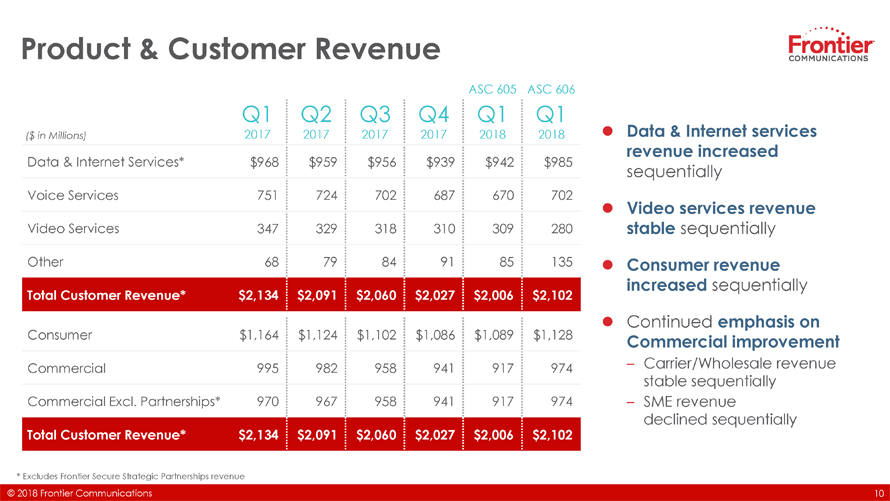
Product & Customer Revenue ASC 605 ASC 606 Q1 Q2 Q3 Q4 Q1 Q1 ($ in Millions) 2017 2017 2017 2017 2018 2018 Data & Internet Services* $968 $959 $956 $939 $942 $985 Voice Services 751 724 702 687 670 702 Video Services 347 329 318 310 309 280 Other 68 79 84 91 85 135 Total Customer Revenue* $2,134 $2,091 $2,060 $2,027 $2,006 $2,102 Consumer $1,164 $1,124 $1,102 $1,086 $1,089 $1,128 Commercial 995 982 958 941 917 974 Commercial Excl. Partnerships* 970 967 958 941 917 974 Total Customer Revenue* $2,134 $2,091 $2,060 $2,027 $2,006 $2,102 * Excludes Frontier Secure Strategic Partnerships revenue © 2018 Frontier Communications ï¬ Data & Internet services revenue increased sequentially ï¬ Video services revenue stable sequentially ï¬ Consumer revenue increased sequentially ï¬ Continued emphasis on Commercial improvement – Carrier/Wholesale revenue stable sequentially – SME revenue declined sequentially
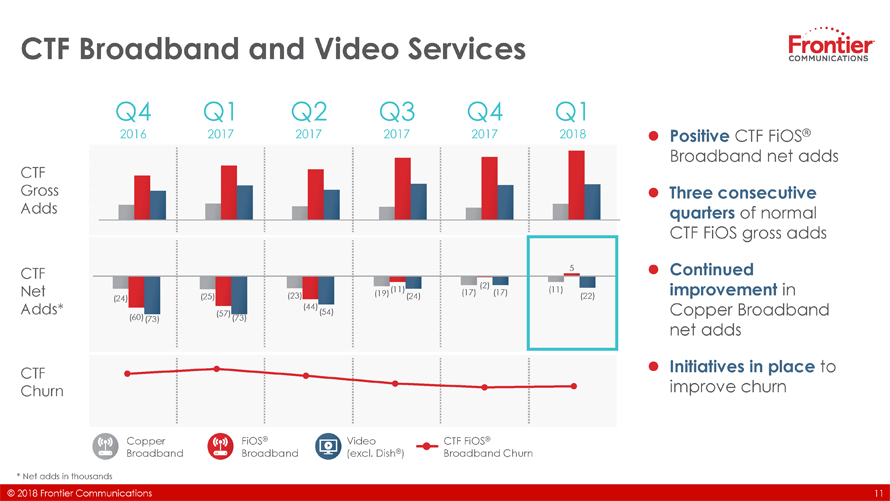
CTF Broadband and Video Services Q4 Q1 Q2 Q3 Q4 Q1 120000.0 2016 2017 2017 2017 2017 2018 100000.0 80000.0 CTF 60000.0 Gross 40000.0 Adds 20000.0 0.0 CTF 5 (11) (2) Net (19) (17) (17) (11) (24) (25) (23) (24) (22) Adds* (44) (57) (54) (60) (73) (73) 3.50% CTF 3.00% Churn2.50% 2.00% 1.50% 1.00% 0.50% 0.00% Copper FiOS® Video CTF FiOS® Broadband Broadband (excl. Dish®) Broadband Churn * Net adds in thousands © 2018 Frontier Communications ï¬ Positive CTF FiOS® Broadband net adds ï¬ Three consecutive quarters of normal CTF FiOS gross adds ï¬ Continued improvement in Copper Broadband net adds ï¬ Initiatives in place to improve churn
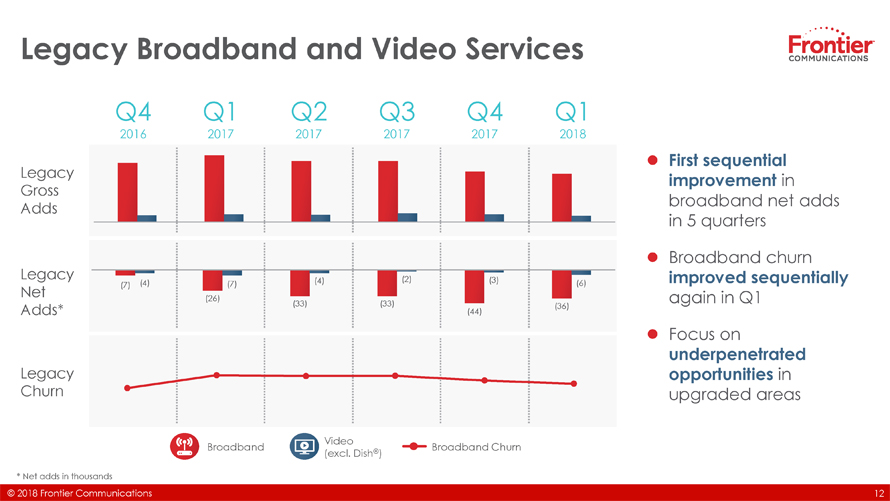
Legacy Broadband and Video Services Q4 Q1 Q2 Q3 Q4 Q1 2016 2017 2017 2017 2017 2018 160.0 140.0 120.0 Legacy100.0 80.0 Gross 60.0 Adds 40.0 20.0 0.0 Legacy (2) (3) (4) (7) (4) (6) Net (7) (26) Adds* (33) (33) (44) (36) Legacy 2.50% Churn2.00% 1.50% 1.00% 0.50% 0.00% Video Broadband ® Broadband Churn (excl. Dish ) * Net adds in thousands © 2018 Frontier Communications ï¬ First sequential improvement in broadband net adds in 5 quarters ï¬ Broadband churn improved sequentially again in Q1 ï¬ Focus on underpenetrated opportunities in upgraded areas
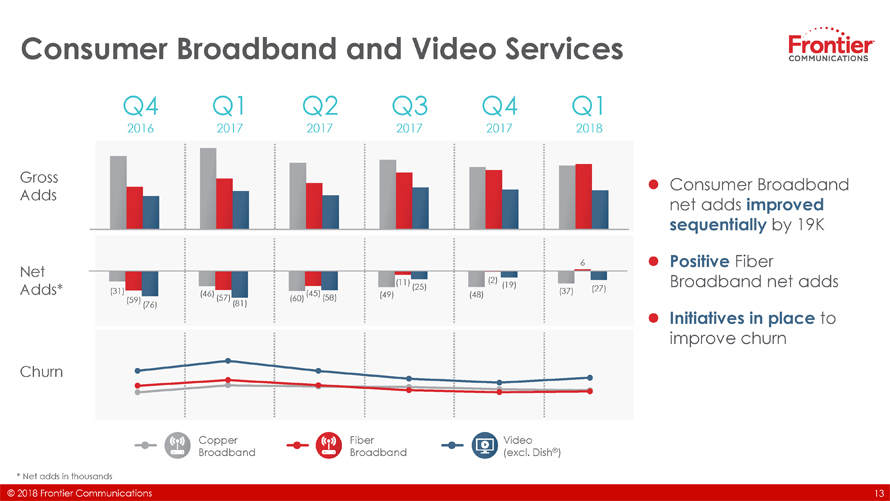
Consumer Broadband and Video Services Q4 Q1 Q2 Q3 Q4 Q1 2016 2017 2017 2017 2017 2018 140 120 100 Gross 80 Adds 60 40 20 0 6 Net (11) (2) (25) (19) (27) Adds* (31) (46) (45) (49) (48) (37) (59) (57) (60) (58) (76) (81) 5.00% Churn 4.00% 3.00% 2.00% 1.00% 0.00% Copper Fiber Video Broadband Broadband (excl. Dish®) * Net adds in thousands © 2018 Frontier Communications ï¬ Consumer Broadband net adds improved sequentially by 19K ï¬ Positive Fiber Broadband net adds ï¬ Initiatives in place to improve churn
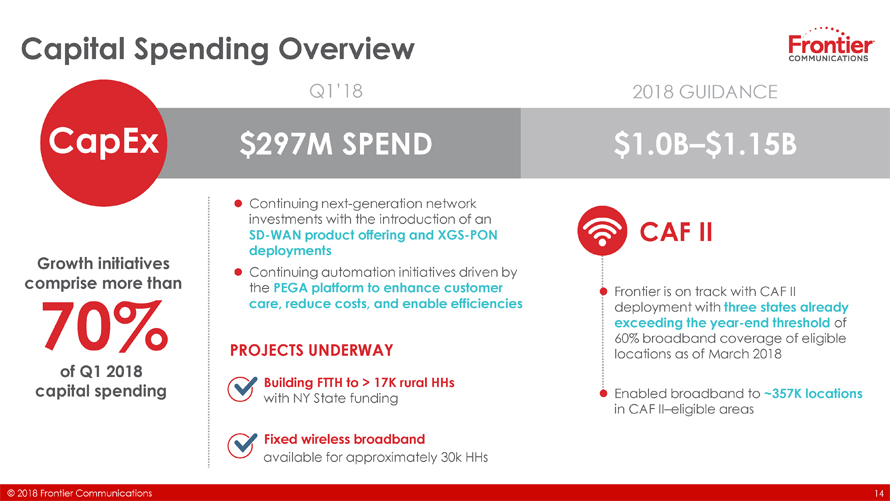
Capital Spending Overview Q1’18 2018 GUIDANCE CapEx $297M SPEND $1.0B–$1.15B Growth initiatives comprise more than 70% of Q1 2018 capital spending ï¬ Continuing next-generation network investments with the introduction of an SD-WAN product offering and XGS-PON deployments ï¬ Continuing automation initiatives driven by the PEGA platform to enhance customer care, reduce costs, and enable efficiencies PROJECTS UNDERWAY Building FTTH to > 17K rural HHs with NY State funding Fixed wireless broadband available for approximately 30k HHs CAF II ï¬ Frontier is on track with CAF II deployment with three states already exceeding the year-end threshold of 60% broadband coverage of eligible locations as of March 2018 ï¬ Enabled broadband to ~357K locations in CAF II–eligible areas
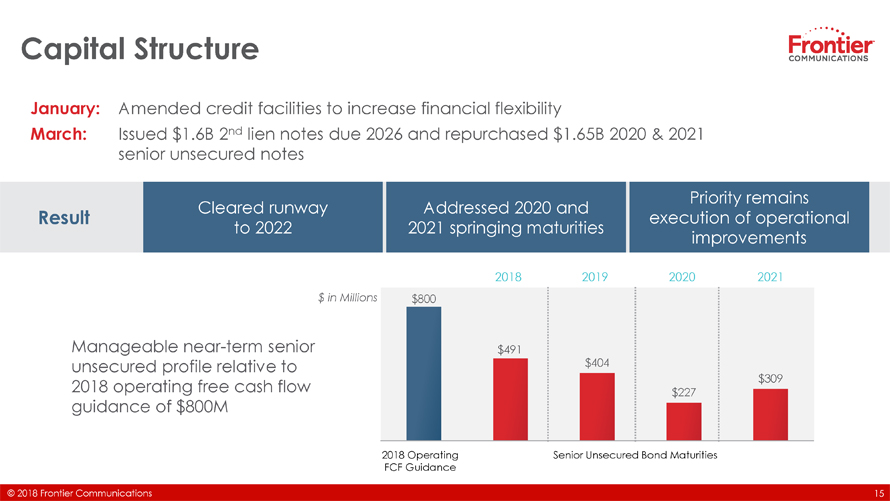
Capital Structure January: Amended credit facilities to increase financial flexibility March: Issued $1.6B 2nd lien notes due 2026 and repurchased $1.65B 2020 & 2021 senior unsecured notes Priority remains Cleared runway Addressed 2020 and Result execution of operational to 2022 2021 springing maturities improvements 2018 2019 2020 2021 $ in Millions $800 Manageable near-term senior $491 unsecured profile relative to $404 2018 operating free cash flow $309 guidance of $800M $227 2018 Operating Senior Unsecured Bond Maturities FCF Guidance © 2018 Frontier Communications 15
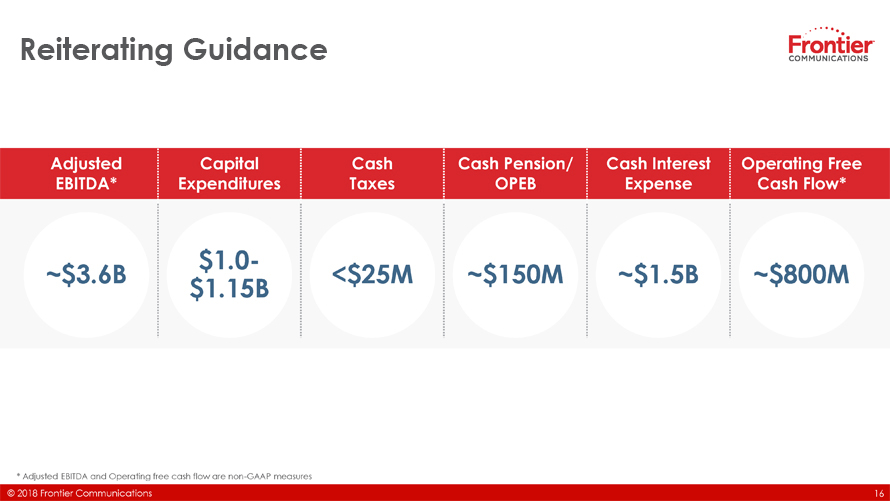
Reiterating Guidance Adjusted Capital Cash Cash Pension/ Cash Interest Operating Free EBITDA* Expenditures Taxes OPEB Expense Cash Flow* $1.0- ~$3.6B <$25M ~$150M ~$1.5B ~$800M $1.15B * Adjusted EBITDA and Operating free cash flow are non-GAAP measures © 2018 Frontier Communications 16

Appendix
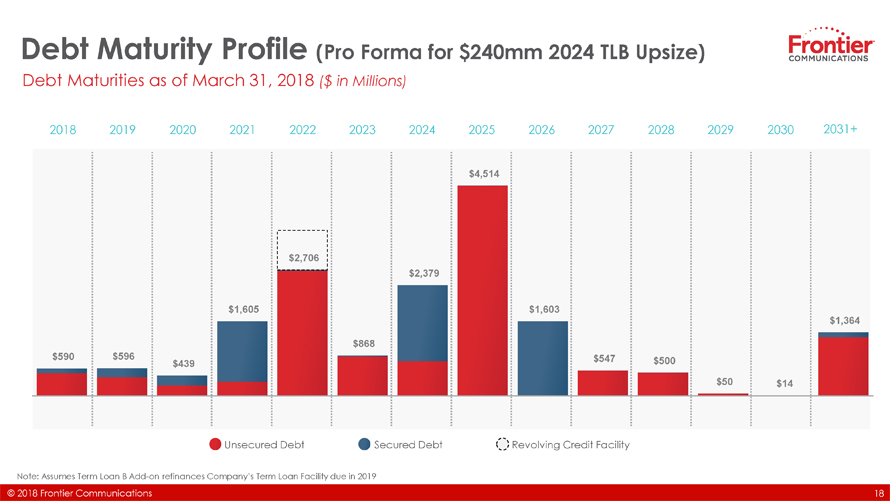
Debt Maturity Profile (Pro Forma for $240mm 2024 TLB Upsize) Debt Maturities as of March 31, 2018 ($ in Millions) 2018 2019 2020 2021 2022 2023 2024 2025 2026 2027 2028 2029 2030 2031+ $4,514 $2,706 $2,379 $1,605 $1,603 $1,364 $868 $590 $596 $547 $439 $500 $50 $14 Unsecured Debt Secured Debt Revolving Credit Facility Note: Assumes Term Loan B Add-on refinances Company’s Term Loan Facility due in 2019 © 2018 Frontier Communications 18

Security Package Detail ($ in millions) 3/31/2018 Q1 2018 Current Security Package Total Assets Revenue EBITDA Subsidiaries Pledged and Guarantors $6,472 $702 $245 Subsidiaries Pledged 9,768 1,114 452 Total Pledged (Guarantors and Non-Guarantors) $16,240 $1,816 $697 Proposed Additional Security New Pledged Subsidiaries $2,015 $118 $44 Pro Forma Pledged (Guarantors and Non-Guarantors) $18,255 $1,934 $741 Total Not Pledged $6,423 $265 $130 Total $24,678 $2,199 $871 % of Total Pledged (Guarantors and Non-Guarantors, Excluding Proposed Additional Security) 66% 83% 80% % of Total Pledged (Proposed Additional Security) 8% 5% 5% % of Total Pledged (Guarantors and Non-Guarantors, Including Proposed Additional Security) 74% 88% 85% Source: Company financials ***Footnote © 2018 Frontier Communications
Safe Harbor Statement Forward-looking Language This presentation contains “forward-looking statements,” related to future, not past, events. Forward-looking statements express management’s expectations regarding Frontier’s future business, financial performance, and financial condition, and contain words such as “expect,” “anticipate,” “intend,” “plan,” “believe,” “seek,” “see,” “may,” “will,” “would,” or “target.” Forward-looking statements by their nature address matters that are, to different degrees, uncertain. For Frontier, particular uncertainties that could cause actual results to be materially different than those expressed in such forward-looking statements include: competition from cable, wireless and wireline carriers, satellite, and OTT companies, and the risk that Frontier will not respond on a timely or profitable basis; Frontier’s ability to successfully adjust to changes in the communications industry, including the effects of technological changes and competition on its capital expenditures, products and service offerings; Frontier’s ability to implement organizational structure changes; risks related to the operation of Frontier’s properties and ability to retain or attract new customers; Frontier’s ability to realize anticipated cost savings and meet commitments made in connection with the Verizon acquisition; reductions in revenue from voice customers that Frontier cannot offset with increases in revenue from broadband and video subscribers and sales of other products and services; Frontier’s ability to maintain relationships with customers, employees or suppliers; Frontier’s ability to attract/retain key talent; the effects of governmental legislation and regulation on Frontier’s business; the impact of regulatory, investigative and legal proceedings and legal compliance risks; government infrastructure projects that impact capital expenditures; continued reductions in switched access revenue as a result of regulation, competition or technology substitutions; the effects of changes in the availability of federal and state universal service funding or other subsidies to Frontier and its competitors; Frontier’s ability to meet its remaining CAF II broadband buildout obligations on a timely basis; Frontier’s ability to effectively manage service quality and meet mandated service quality metrics; Frontier’s ability to successfully introduce new product offerings; the effects of changes in accounting policies or practices, including potential future impairment charges with respect to intangible assets; Frontier’s ability to effectively manage its operations, operating expenses, capital expenditures, debt service requirements and cash paid for income taxes and liquidity; the effects of changes in both general and local economic conditions in the markets that Frontier serves; the effects of increased medical expenses and pension and postemployment expenses; the effects of changes in income tax rates, tax laws, regulations or rulings, or federal or state tax assessments; Frontier’s ability to successfully renegotiate union contracts; changes in pension plan assumptions, interest rates, discount rates, regulatory rules and/or the value of Frontier’s pension plan assets, which could require Frontier to make increased contributions to its pension plans; adverse changes in the credit markets; adverse changes in the ratings given to Frontier’s debt securities by nationally accredited ratings organizations; the availability and cost of financing in the credit markets; covenants in Frontier’s indentures and credit agreements that may limit Frontier’s operational and financial flexibility as well as its ability to access the capital markets in the future; the effects of state regulatory cash management practices that could limit Frontier’s ability to transfer cash among its subsidiaries or dividend funds up to the parent company; the effects of severe weather events or other natural or man-made disasters, which may increase operating expenses or adversely impact customer revenue; the impact of potential information technology or data security breaches or other disruptions; and the risks and other factors contained in Frontier’s filings with the U.S. Securities and Exchange Commission, including its reports on Forms 10-K and 10-Q. These risks and uncertainties may cause actual future results to be materially different than those expressed in such forward-looking statements. Frontier has no obligation to update or revise these forward-looking statements and does not undertake to do so. © 2018 Frontier Communications 20
Non-GAAP Financial Measures Frontier uses certain non-GAAP financial measures in evaluating its performance, including EBITDA, EBITDA margin, adjusted EBITDA, adjusted EBITDA margin, operating free cash flow, and adjusted operating expenses, each of which is described below. Management uses these non-GAAP financial measures internally to (i) assist in analyzing Frontier’s underlying financial performance from period to period, (ii) analyze and evaluate strategic and operational decisions, (iii) establish criteria for compensation decisions, and (iv) assist in the understanding of Frontier’s ability to generate cash flow and, as a result, to plan for future capital and operational decisions. Management believes that the presentation of these non-GAAP financial measures provides useful information to investors regarding Frontier’s financial condition and results of operations because these measures, when used in conjunction with related GAAP financial measures (i) provide a more comprehensive view of Frontier’s core operations and ability to generate cash flow, (ii) provide investors with the financial analytical framework upon which management bases financial, operational, compensation, and planning decisions and (iii) present measurements that investors and rating agencies have indicated to management are useful to them in assessing Frontier and its results of operations. These non-GAAP financial measures are not measures of financial performance or liquidity under GAAP, nor are they alternatives to GAAP measures and they may not be comparable to similarly titled measures of other companies. EBITDA is defined as net income (loss) less income tax expense (benefit), interest expense, investment and other income, pension settlement costs, gains/losses on extinguishment of debt, and depreciation and amortization. EBITDA margin is calculated by dividing EBITDA by total revenue. Adjusted EBITDA is defined as EBITDA, as described above, adjusted to exclude acquisition and integration costs, certain pension/OPEB expenses, restructuring costs and other charges, stock-based compensation expense, goodwill impairment charges, and certain other non-recurring items (e.g., storm-related costs and work stoppage costs). Adjusted EBITDA margin is calculated by dividing adjusted EBITDA by total revenue. Management uses EBITDA, EBITDA margin, adjusted EBITDA and adjusted EBITDA margin to assist it in comparing performance from period to period and as measures of operational performance. Management believes that these non-GAAP measures provide useful information for investors in evaluating Frontier’s operational performance from period to period because they exclude depreciation and amortization expenses related to investments made in prior periods and are determined without regard to capital structure or investment activities. By excluding capital expenditures, debt repayments and dividends, among other factors, these non-GAAP financial measures have certain shortcomings. Management compensates for these shortcomings by utilizing these non-GAAP financial measures in conjunction with the comparable GAAP financial measures. Adjusted net income (loss) attributable to Frontier common shareholders is defined as net income (loss) attributable to Frontier common shareholders and excludes acquisition and integration costs, restructuring costs and other charges, pension settlement costs, goodwill impairment charges, certain income tax items and the income tax effect of these items, and certain non-recurring items (e.g., storm-related costs and work stoppage costs). Adjusting for these items allows investors to better understand and analyze Frontier’s financial performance over the periods presented. Management defines operating free cash flow, a non-GAAP measure, as net cash provided from operating activities less capital expenditures. Management uses operating free cash flow to assist it in comparing liquidity from period to period and to obtain a more comprehensive view of Frontier’s core operations and ability to generate cash flow. Management believes that this non-GAAP measure is useful to investors in evaluating cash available to service debt and pay dividends. This non-GAAP financial measure has certain shortcomings; it does not represent the residual cash flow available for discretionary expenditures, as items such as debt repayments and stock dividends are not deducted in determining such measure. Management compensates for these shortcomings by utilizing this non-GAAP financial measure in conjunction with the comparable GAAP financial measure. Adjusted operating expenses is defined as operating expenses adjusted to exclude depreciation and amortization, acquisition and integration costs, goodwill impairment charges, certain pension/OPEB expenses, stock-based compensation expense, one-time storm-related and work stoppage costs, and restructuring costs and other charges. Investors have indicated that this non-GAAP measure is useful in evaluating Frontier’s performance. The information in this presentation should be read in conjunction with the financial statements and footnotes contained in Frontier’s documents filed with the U.S. Securities and Exchange Commission, including the earnings release furnished with the Form 8- K filed on May 1, 2018.