Attached files
| file | filename |
|---|---|
| 8-K - FORM 8-K - SWISS HELVETIA FUND, INC. | d611735d8k.htm |
Stefan Frischknecht, Fund Manager Portfolio and Performance Review The Swiss Helvetia Fund, Inc. June 19, 2018
Agenda 01 Performance 02 Portfolio positioning 03 Outlook 04 Conclusion 05 Case for Swiss equities

Performance
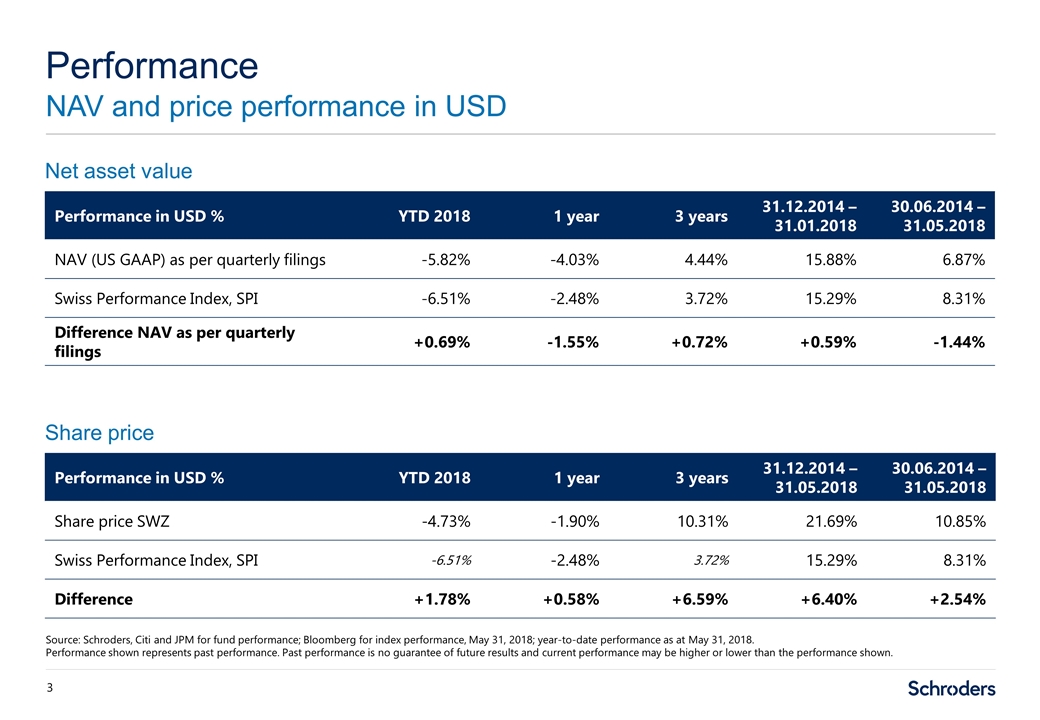
Performance NAV and price performance in USD Source: Schroders, Citi and JPM for fund performance; Bloomberg for index performance, May 31, 2018; year-to-date performance as at May 31, 2018. Performance shown represents past performance. Past performance is no guarantee of future results and current performance may be higher or lower than the performance shown. Performance in USD % YTD 2018 1 year 3 years 31.12.2014 – 31.01.2018 30.06.2014 – 31.05.2018 NAV (US GAAP) as per quarterly filings -5.82% -4.03% 4.44% 15.88% 6.87% Swiss Performance Index, SPI -6.51% -2.48% 3.72% 15.29% 8.31% Difference NAV as per quarterly filings +0.69% -1.55% +0.72% +0.59% -1.44% Performance in USD % YTD 2018 1 year 3 years 31.12.2014 – 31.05.2018 30.06.2014 – 31.05.2018 Share price SWZ -4.73% -1.90% 10.31% 21.69% 10.85% Swiss Performance Index, SPI -6.51% -2.48% 3.72% 15.29% 8.31% Difference +1.78% +0.58% +6.59% +6.40% +2.54% Net asset value Share price
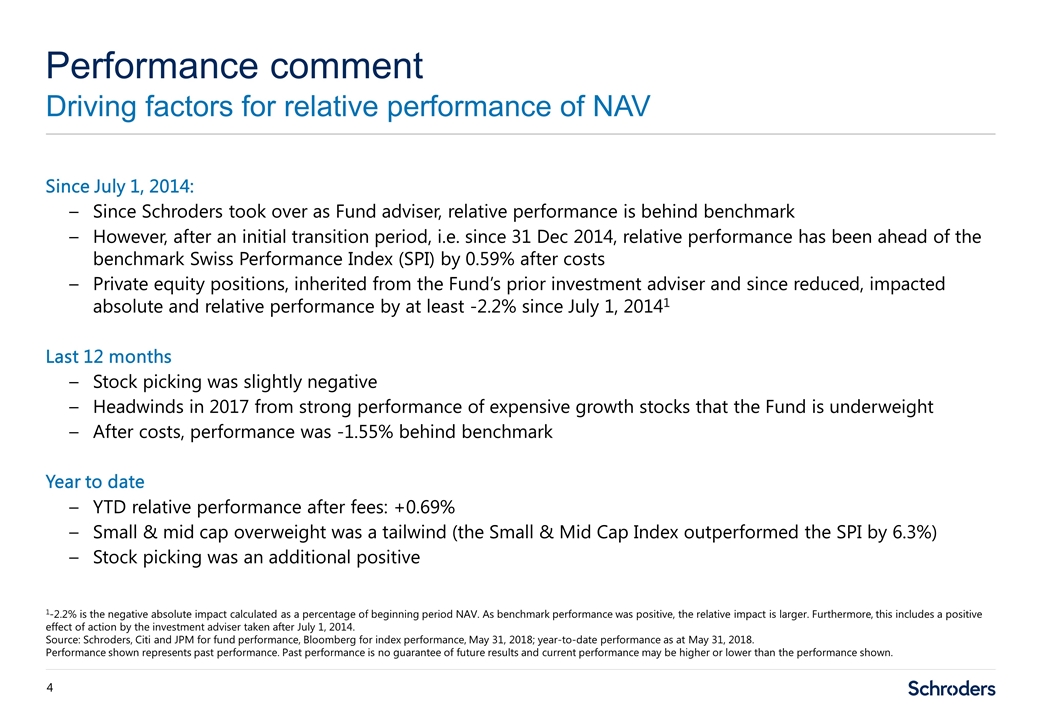
Since July 1, 2014: Since Schroders took over as Fund adviser, relative performance is behind benchmark However, after an initial transition period, i.e. since 31 Dec 2014, relative performance has been ahead of the benchmark Swiss Performance Index (SPI) by 0.59% after costs Private equity positions, inherited from the Fund’s prior investment adviser and since reduced, impacted absolute and relative performance by at least -2.2% since July 1, 20141 Last 12 months Stock picking was slightly negative Headwinds in 2017 from strong performance of expensive growth stocks that the Fund is underweight After costs, performance was -1.55% behind benchmark Year to date YTD relative performance after fees: +0.69% Small & mid cap overweight was a tailwind (the Small & Mid Cap Index outperformed the SPI by 6.3%) Stock picking was an additional positive Performance comment Driving factors for relative performance of NAV 1-2.2% is the negative absolute impact calculated as a percentage of beginning period NAV. As benchmark performance was positive, the relative impact is larger. Furthermore, this includes a positive effect of action by the investment adviser taken after July 1, 2014. Source: Schroders, Citi and JPM for fund performance, Bloomberg for index performance, May 31, 2018; year-to-date performance as at May 31, 2018. Performance shown represents past performance. Past performance is no guarantee of future results and current performance may be higher or lower than the performance shown.
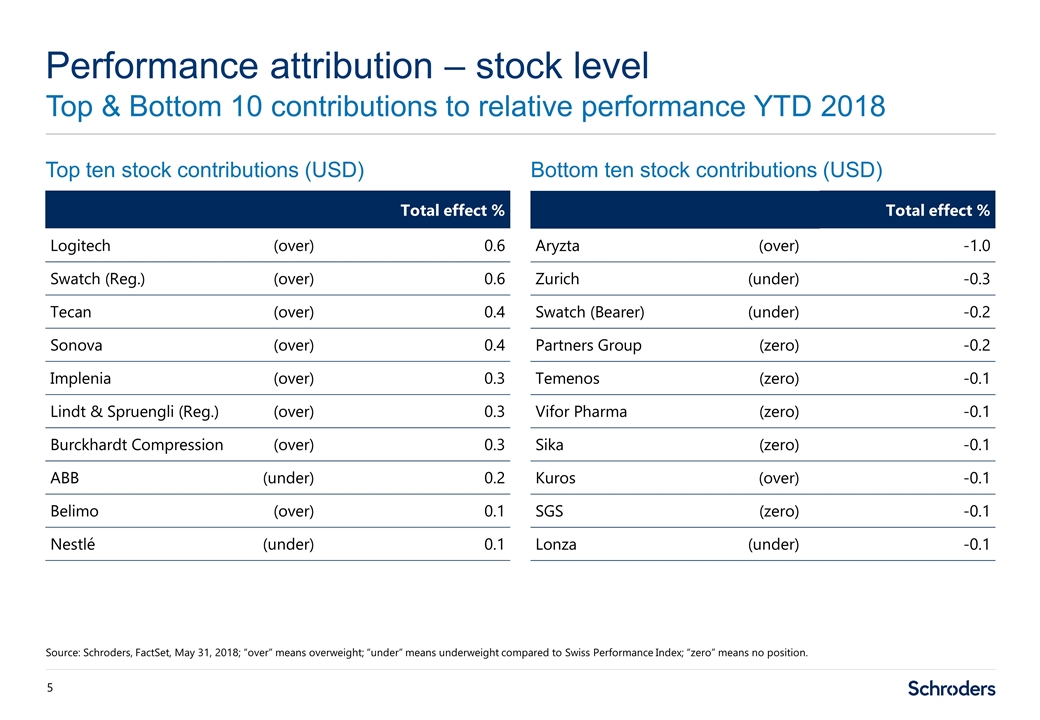
Performance attribution – stock level Top & Bottom 10 contributions to relative performance YTD 2018 Source: Schroders, FactSet, May 31, 2018; “over” means overweight; “under” means underweight compared to Swiss Performance Index; “zero” means no position. Top ten stock contributions (USD) Bottom ten stock contributions (USD) Total effect % Logitech(over) 0.6 Swatch (Reg.)(over) 0.6 Tecan(over) 0.4 Sonova(over) 0.4 Implenia(over) 0.3 Lindt & Spruengli (Reg.)(over) 0.3 Burckhardt Compression(over) 0.3 ABB(under) 0.2 Belimo(over) 0.1 Nestlé(under) 0.1 Total effect % Aryzta(over) -1.0 Zurich(under) -0.3 Swatch (Bearer)(under) -0.2 Partners Group(zero) -0.2 Temenos(zero) -0.1 Vifor Pharma(zero) -0.1 Sika(zero) -0.1 Kuros(over) -0.1 SGS(zero) -0.1 Lonza(under) -0.1

Portfolio positioning
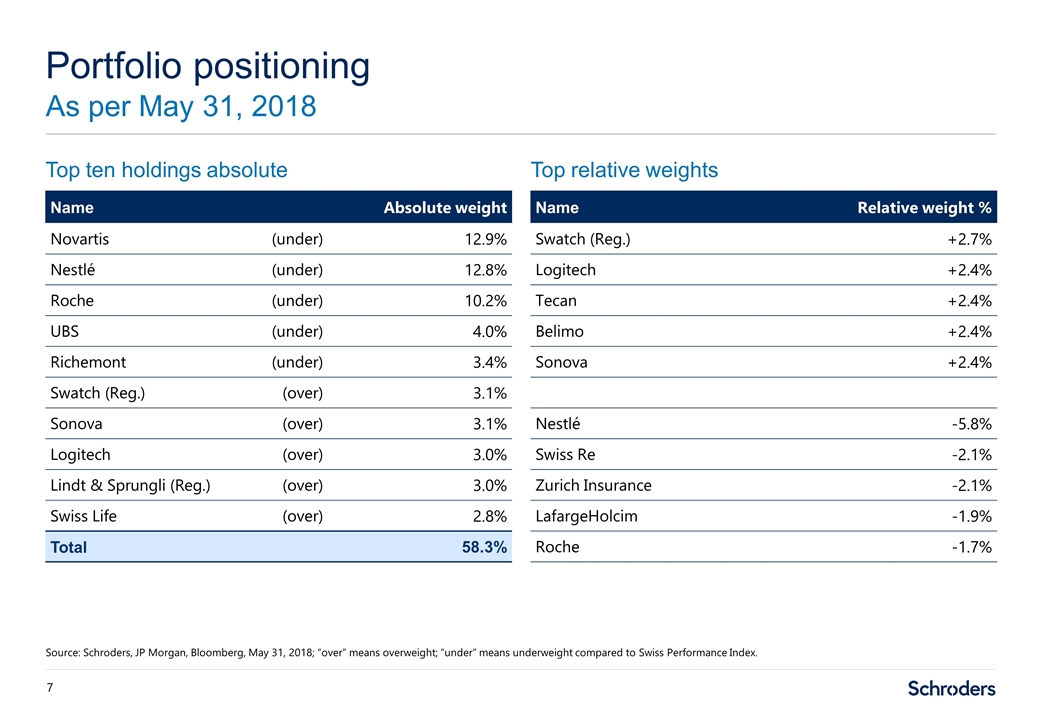
Top ten holdings absolute Top relative weights Portfolio positioning As per May 31, 2018 Source: Schroders, JP Morgan, Bloomberg, May 31, 2018; “over” means overweight; “under” means underweight compared to Swiss Performance Index. Name Absolute weight Novartis(under) 12.9% Nestlé(under) 12.8% Roche(under) 10.2% UBS(under) 4.0% Richemont (under) 3.4% Swatch (Reg.) (over) 3.1% Sonova(over) 3.1% Logitech(over) 3.0% Lindt & Sprungli (Reg.)(over) 3.0% Swiss Life(over) 2.8% Total 58.3% Name Relative weight % Swatch (Reg.) +2.7% Logitech +2.4% Tecan +2.4% Belimo +2.4% Sonova +2.4% Nestlé -5.8% Swiss Re -2.1% Zurich Insurance -2.1% LafargeHolcim -1.9% Roche -1.7%
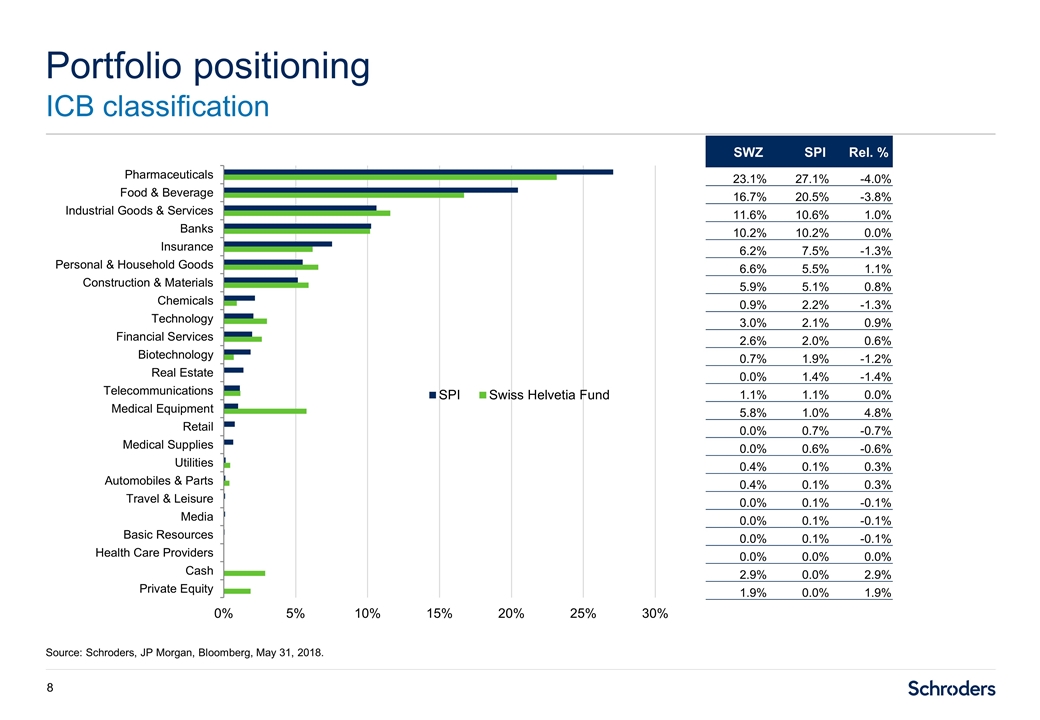
Portfolio positioning ICB classification Source: Schroders, JP Morgan, Bloomberg, May 31, 2018. SWZ SPI Rel. % 23.1% 27.1% -4.0% 16.7% 20.5% -3.8% 11.6% 10.6% 1.0% 10.2% 10.2% 0.0% 6.2% 7.5% -1.3% 6.6% 5.5% 1.1% 5.9% 5.1% 0.8% 0.9% 2.2% -1.3% 3.0% 2.1% 0.9% 2.6% 2.0% 0.6% 0.7% 1.9% -1.2% 0.0% 1.4% -1.4% 1.1% 1.1% 0.0% 5.8% 1.0% 4.8% 0.0% 0.7% -0.7% 0.0% 0.6% -0.6% 0.4% 0.1% 0.3% 0.4% 0.1% 0.3% 0.0% 0.1% -0.1% 0.0% 0.1% -0.1% 0.0% 0.1% -0.1% 0.0% 0.0% 0.0% 2.9% 0.0% 2.9% 1.9% 0.0% 1.9%
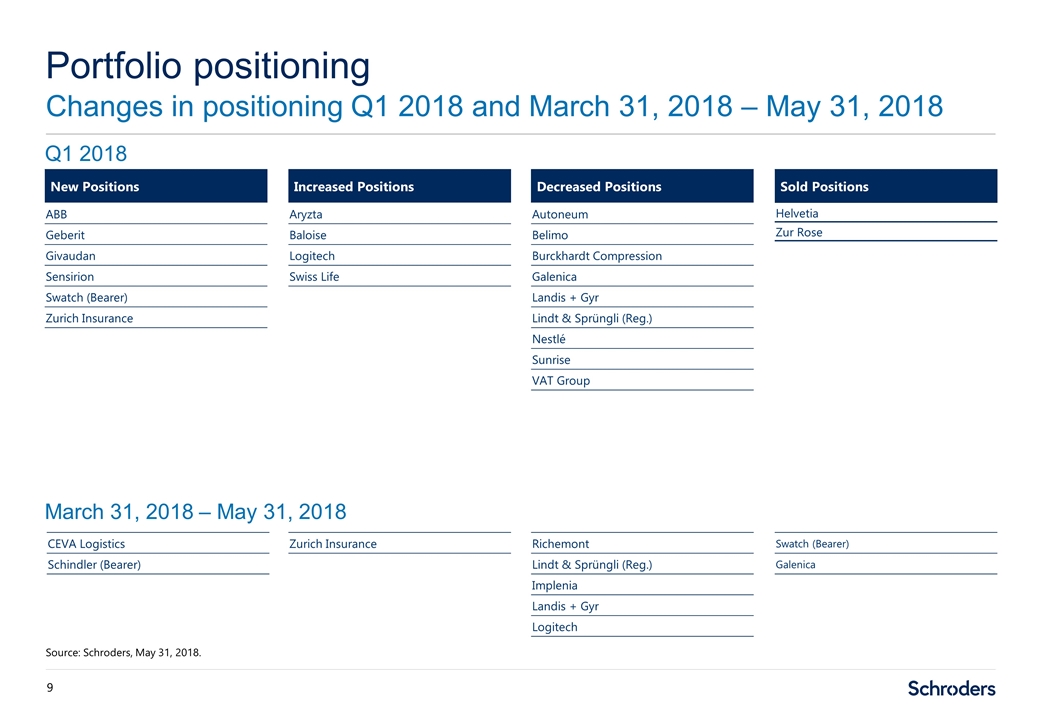
Portfolio positioning Changes in positioning Q1 2018 and March 31, 2018 – May 31, 2018 Source: Schroders, May 31, 2018. New Positions ABB Geberit Givaudan Sensirion Swatch (Bearer) Zurich Insurance Increased Positions Aryzta Baloise Logitech Swiss Life Decreased Positions Autoneum Belimo Burckhardt Compression Galenica Landis + Gyr Lindt & Sprüngli (Reg.) Nestlé Sunrise VAT Group Sold Positions Helvetia Zur Rose Zurich Insurance Richemont Lindt & Sprüngli (Reg.) Implenia Landis + Gyr Logitech Swatch (Bearer) Galenica Q1 2018 March 31, 2018 – May 31, 2018 CEVA Logistics Schindler (Bearer)
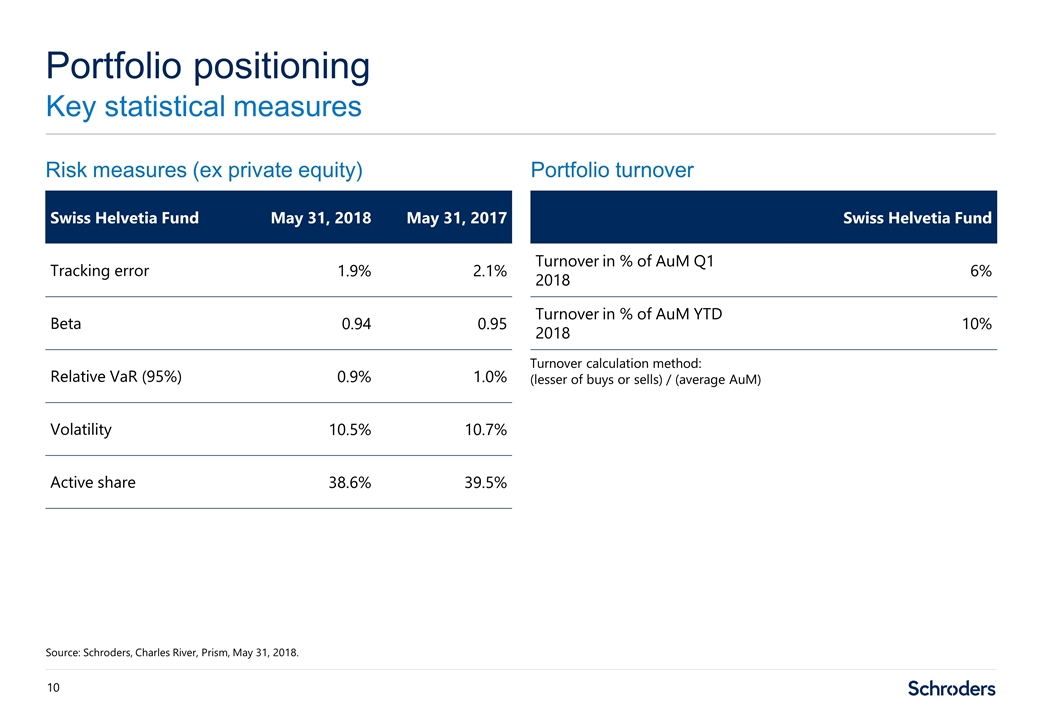
Risk measures (ex private equity) Portfolio turnover Portfolio positioning Key statistical measures Source: Schroders, Charles River, Prism, May 31, 2018. Swiss Helvetia Fund May 31, 2018 May 31, 2017 Tracking error 1.9% 2.1% Beta 0.94 0.95 Relative VaR (95%) 0.9% 1.0% Volatility 10.5% 10.7% Active share 38.6% 39.5% Swiss Helvetia Fund Turnover in % of AuM Q1 2018 6% Turnover in % of AuM YTD 2018 10% Turnover calculation method: (lesser of buys or sells) / (average AuM)

Outlook
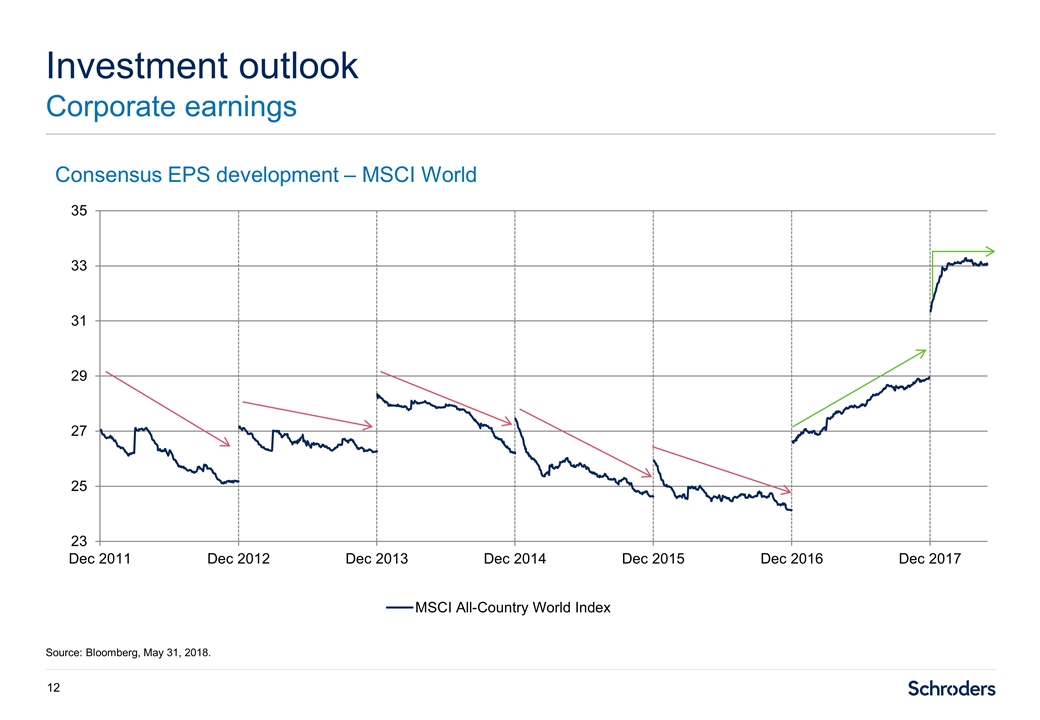
Investment outlook Corporate earnings Source: Bloomberg, May 31, 2018. Consensus EPS development – MSCI World
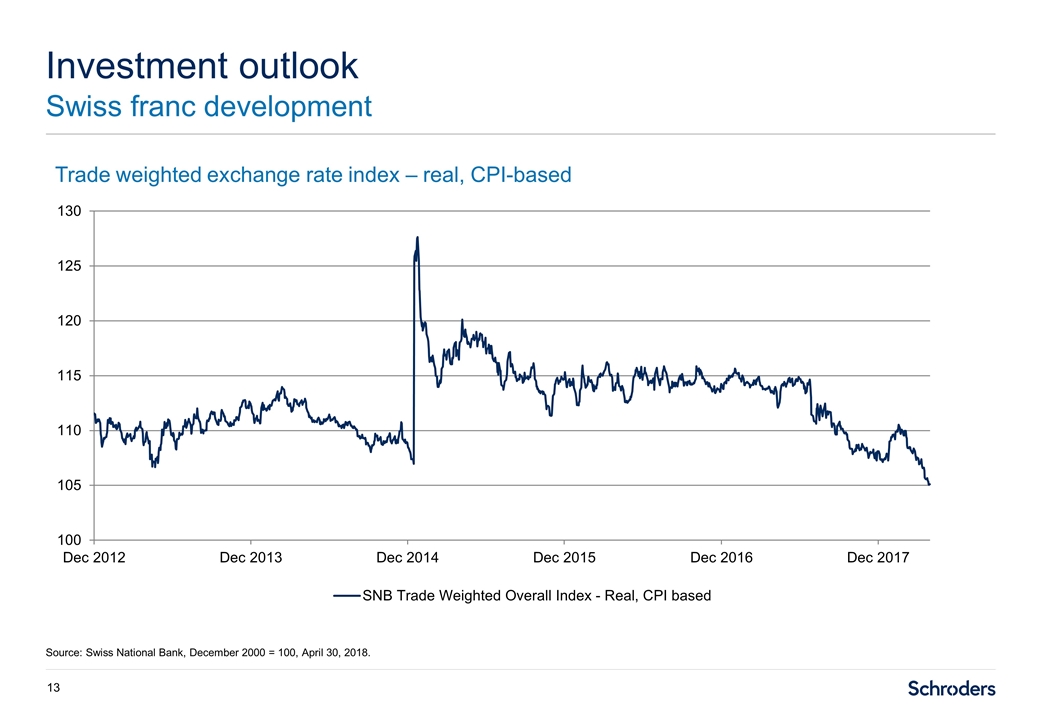
Investment outlook Swiss franc development Source: Swiss National Bank, December 2000 = 100, April 30, 2018. Trade weighted exchange rate index – real, CPI-based
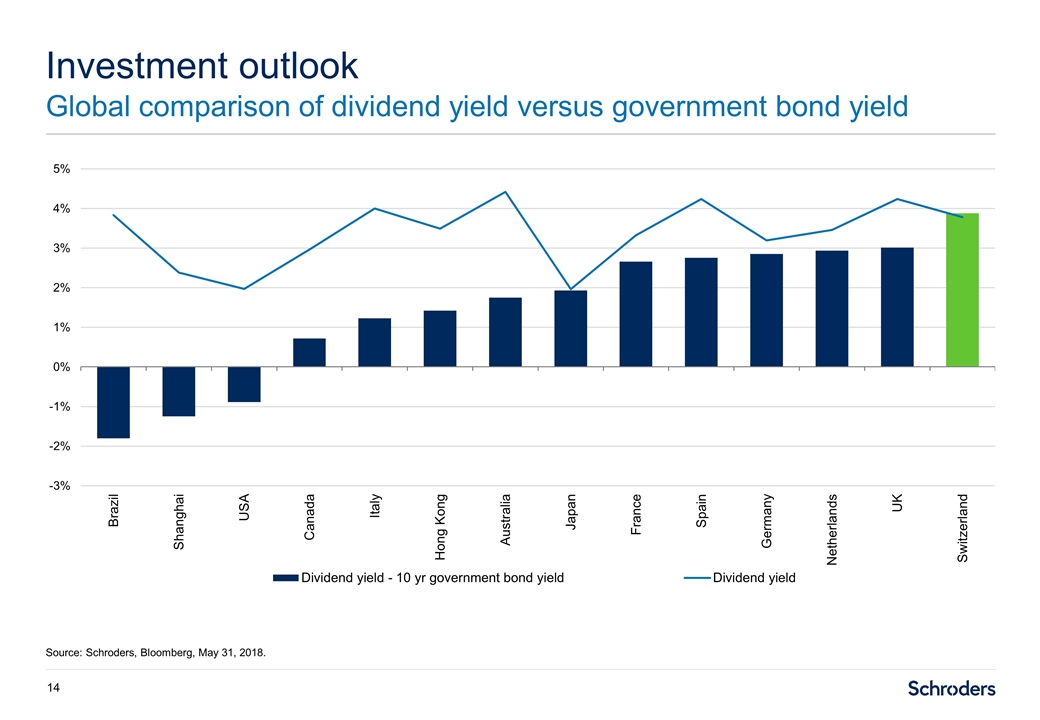
Investment outlook Global comparison of dividend yield versus government bond yield Source: Schroders, Bloomberg, May 31, 2018.
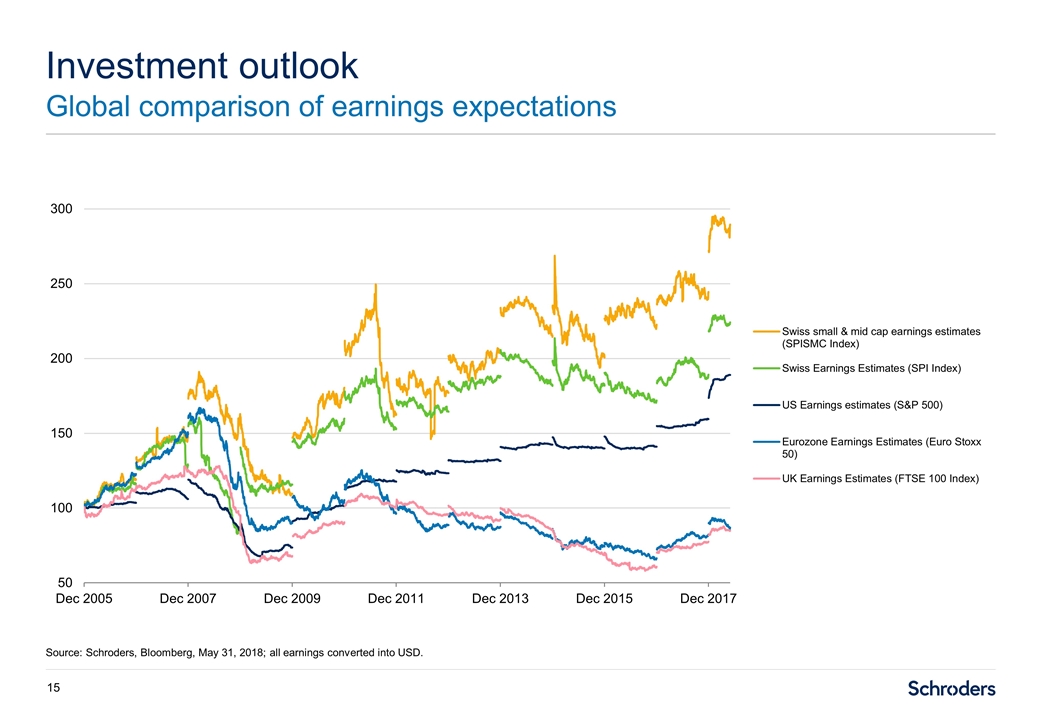
Investment outlook Global comparison of earnings expectations Source: Schroders, Bloomberg, May 31, 2018; all earnings converted into USD.
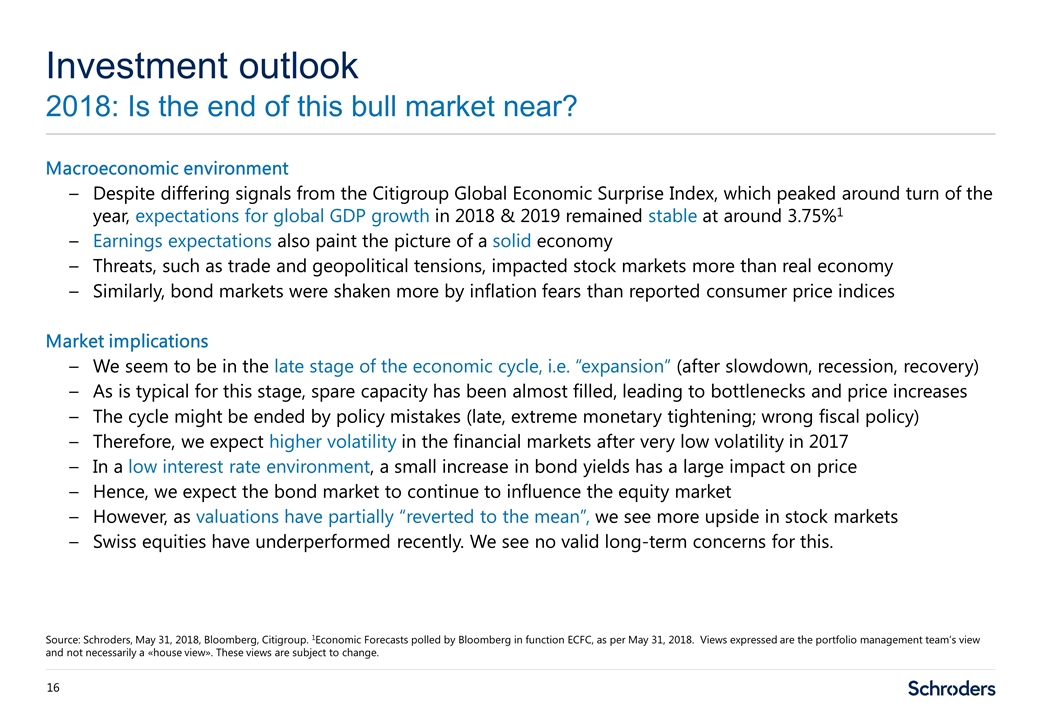
Macroeconomic environment Despite differing signals from the Citigroup Global Economic Surprise Index, which peaked around turn of the year, expectations for global GDP growth in 2018 & 2019 remained stable at around 3.75%1 Earnings expectations also paint the picture of a solid economy Threats, such as trade and geopolitical tensions, impacted stock markets more than real economy Similarly, bond markets were shaken more by inflation fears than reported consumer price indices Market implications We seem to be in the late stage of the economic cycle, i.e. “expansion” (after slowdown, recession, recovery) As is typical for this stage, spare capacity has been almost filled, leading to bottlenecks and price increases The cycle might be ended by policy mistakes (late, extreme monetary tightening; wrong fiscal policy) Therefore, we expect higher volatility in the financial markets after very low volatility in 2017 In a low interest rate environment, a small increase in bond yields has a large impact on price Hence, we expect the bond market to continue to influence the equity market However, as valuations have partially “reverted to the mean”, we see more upside in stock markets Swiss equities have underperformed recently. We see no valid long-term concerns for this. Investment outlook 2018: Is the end of this bull market near? Source: Schroders, May 31, 2018, Bloomberg, Citigroup. 1Economic Forecasts polled by Bloomberg in function ECFC, as per May 31, 2018. Views expressed are the portfolio management team’s view and not necessarily a «house view». These views are subject to change.
Case for Swiss equities
The Swiss stock market has a large proportion of global market leaders (not only among large corporations), with competitive advantage High innovation rate Global diversification helps in the current environment of synchronized growth Generally strong ESG performance and absence of “sin stocks” Swiss companies remained competitive despite the historic appreciation of the Swiss franc The difference between dividend yield and 10 year government bond yield stands out Why are Swiss equities attractive? Source: Schroders. Views expressed are the portfolio management team’s view and not necessarily a «house view». These views are subject to change.
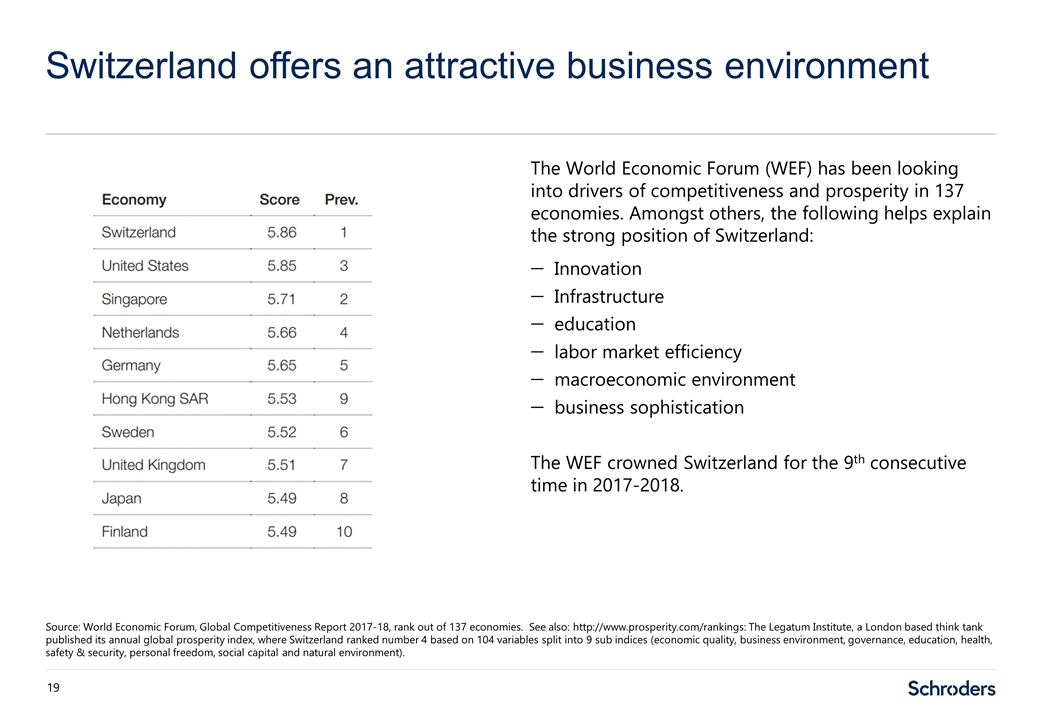
The World Economic Forum (WEF) has been looking into drivers of competitiveness and prosperity in 137 economies. Amongst others, the following helps explain the strong position of Switzerland: Innovation Infrastructure education labor market efficiency macroeconomic environment business sophistication The WEF crowned Switzerland for the 9th consecutive time in 2017-2018. Switzerland offers an attractive business environment Source: World Economic Forum, Global Competitiveness Report 2017-18, rank out of 137 economies. See also: http://www.prosperity.com/rankings: The Legatum Institute, a London based think tank published its annual global prosperity index, where Switzerland ranked number 4 based on 104 variables split into 9 sub indices (economic quality, business environment, governance, education, health, safety & security, personal freedom, social capital and natural environment).
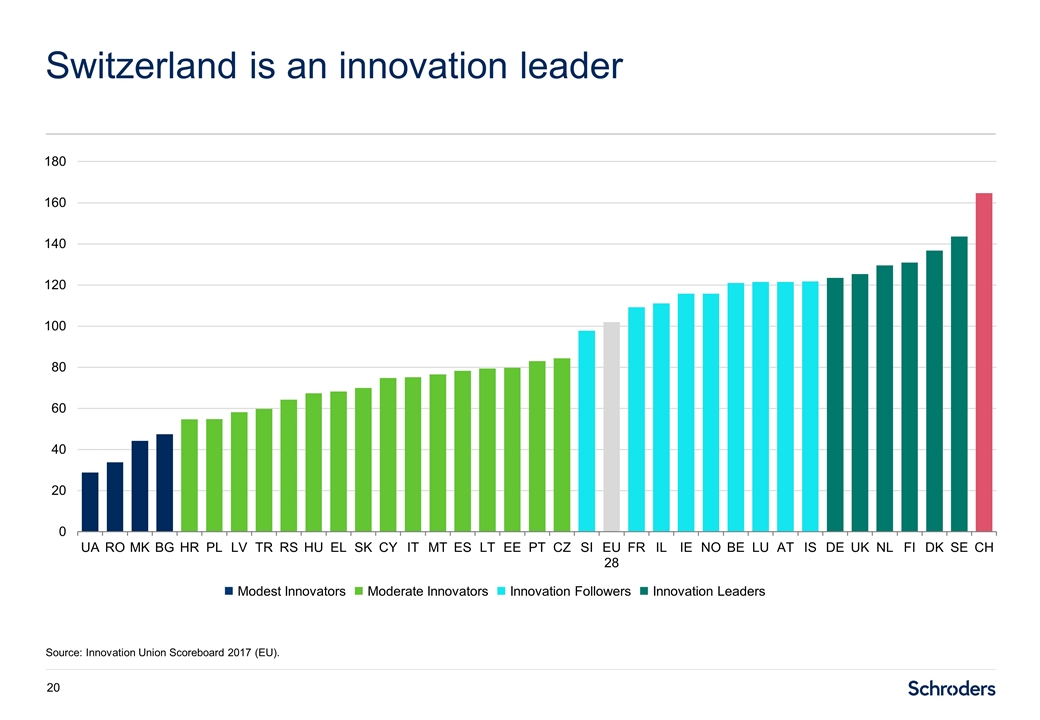
Switzerland is an innovation leader Source: Innovation Union Scoreboard 2017 (EU).
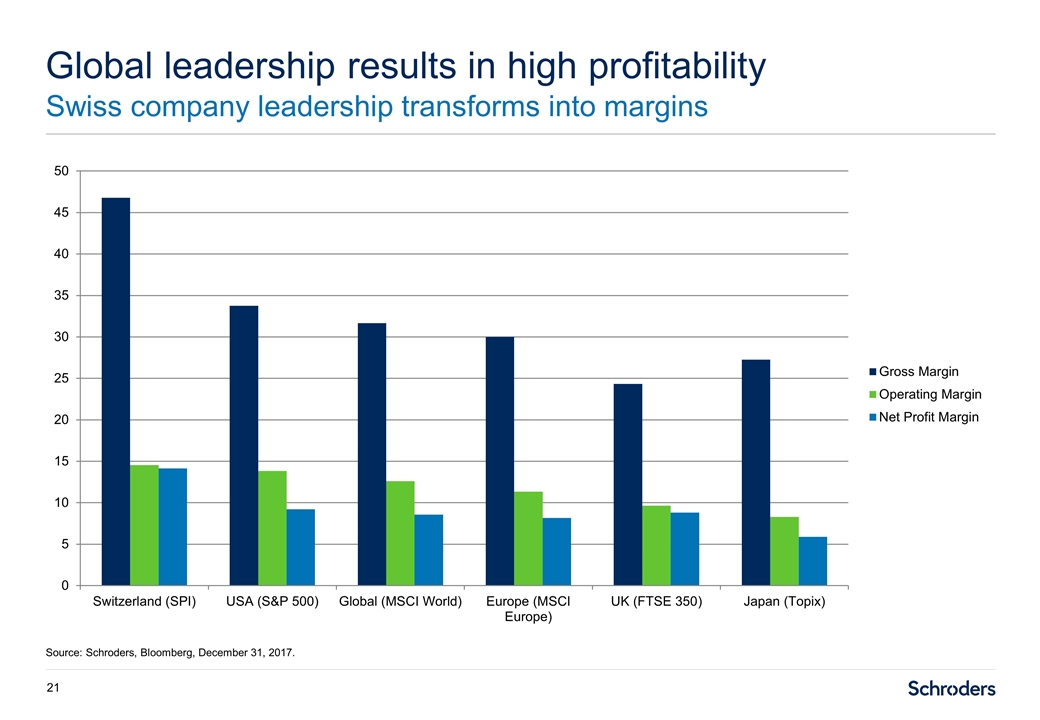
Global leadership results in high profitability Swiss company leadership transforms into margins Source: Schroders, Bloomberg, December 31, 2017.
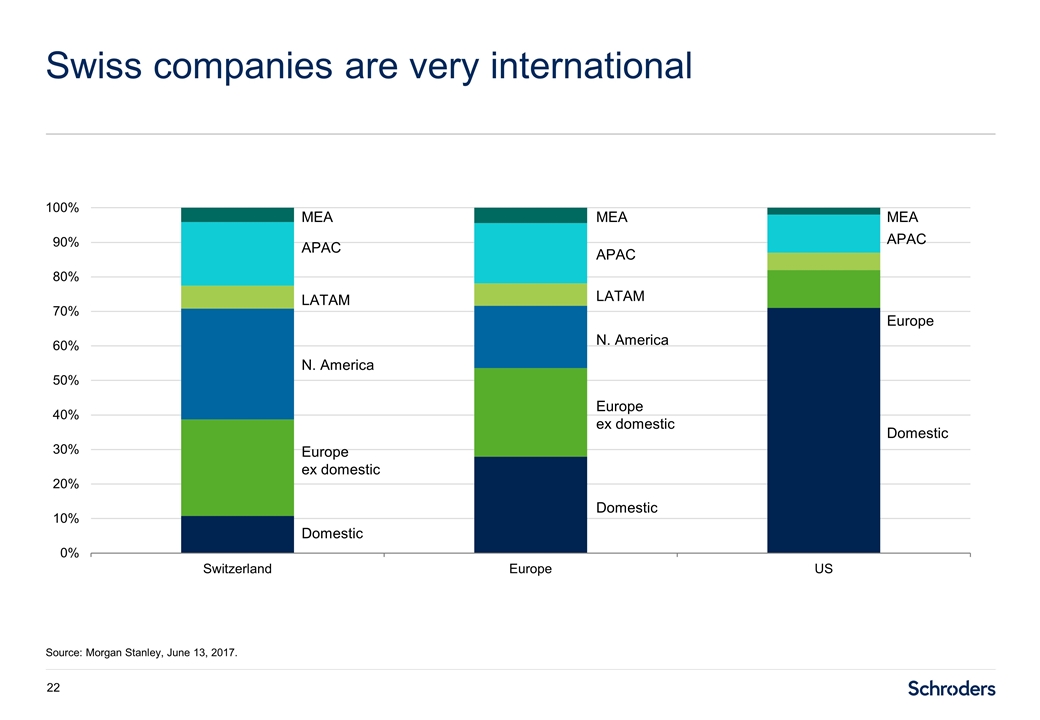
Swiss companies are very international Source: Morgan Stanley, June 13, 2017. Europe ex domestic APAC MEA LATAM N. America Domestic Europe ex domestic APAC MEA LATAM N. America Domestic Europe MEA APAC Domestic
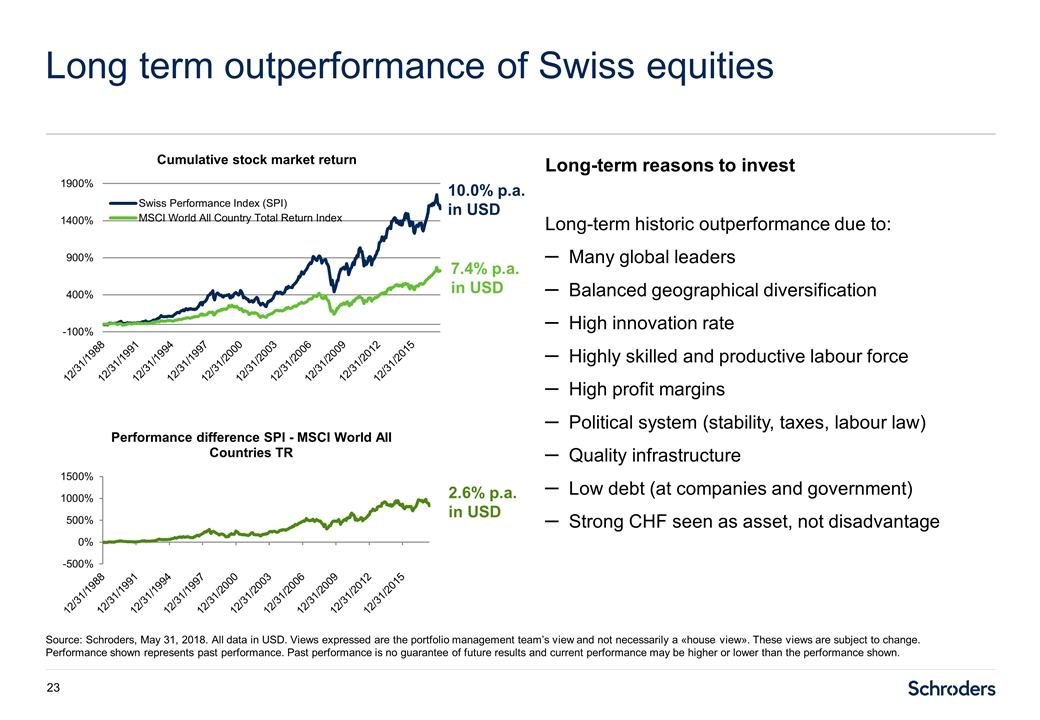
Long term outperformance of Swiss equities Source: Schroders, May 31, 2018. All data in USD. Views expressed are the portfolio management team’s view and not necessarily a «house view». These views are subject to change. Performance shown represents past performance. Past performance is no guarantee of future results and current performance may be higher or lower than the performance shown. Long-term reasons to invest Long-term historic outperformance due to: Many global leaders Balanced geographical diversification High innovation rate Highly skilled and productive labour force High profit margins Political system (stability, taxes, labour law) Quality infrastructure Low debt (at companies and government) Strong CHF seen as asset, not disadvantage 2.6% p.a. in USD 10.0% p.a. in USD 7.4% p.a. in USD
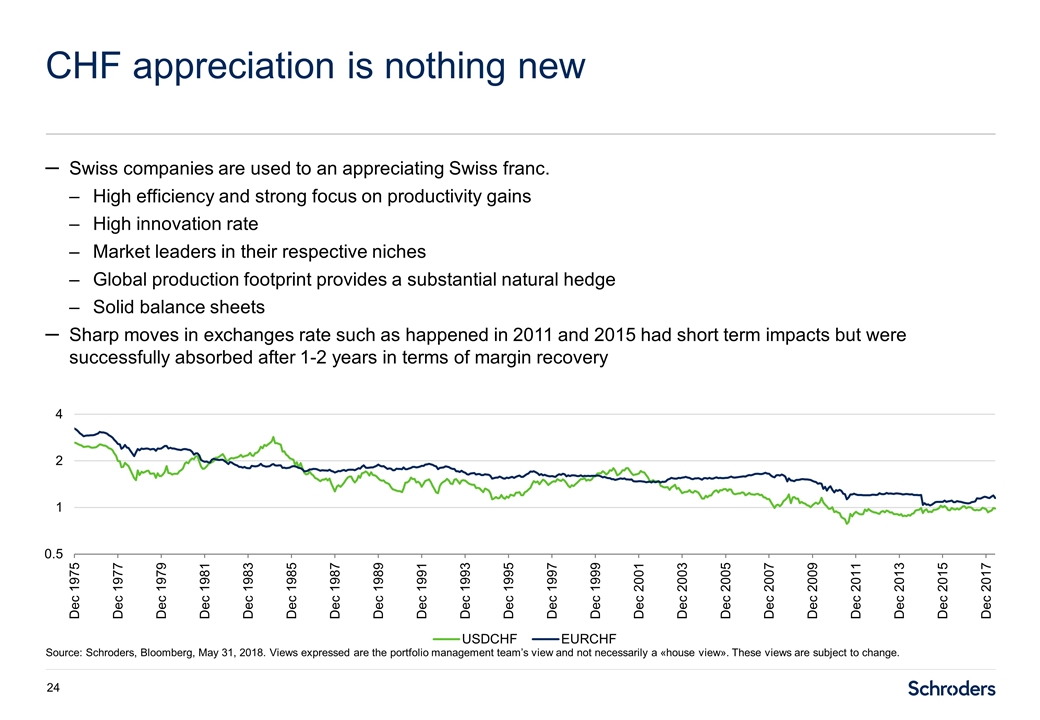
Swiss companies are used to an appreciating Swiss franc. High efficiency and strong focus on productivity gains High innovation rate Market leaders in their respective niches Global production footprint provides a substantial natural hedge Solid balance sheets Sharp moves in exchanges rate such as happened in 2011 and 2015 had short term impacts but were successfully absorbed after 1-2 years in terms of margin recovery CHF appreciation is nothing new Source: Schroders, Bloomberg, May 31, 2018. Views expressed are the portfolio management team’s view and not necessarily a «house view». These views are subject to change.
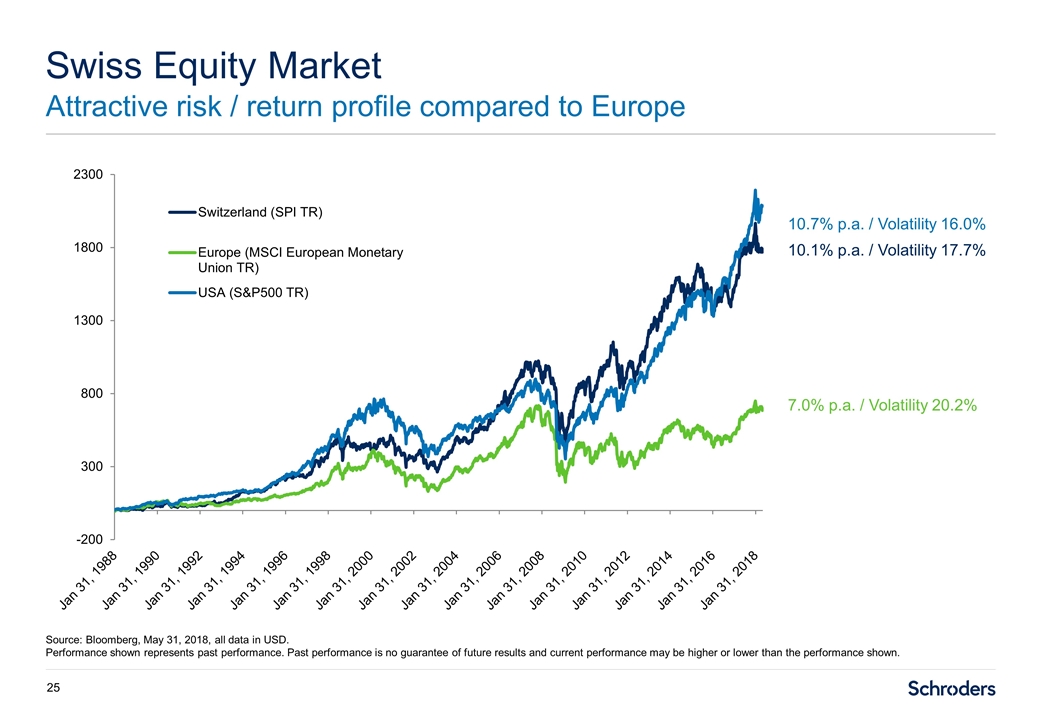
Swiss Equity Market Attractive risk / return profile compared to Europe Source: Bloomberg, May 31, 2018, all data in USD. Performance shown represents past performance. Past performance is no guarantee of future results and current performance may be higher or lower than the performance shown. 10.1% p.a. / Volatility 17.7% 7.0% p.a. / Volatility 20.2% 10.7% p.a. / Volatility 16.0%
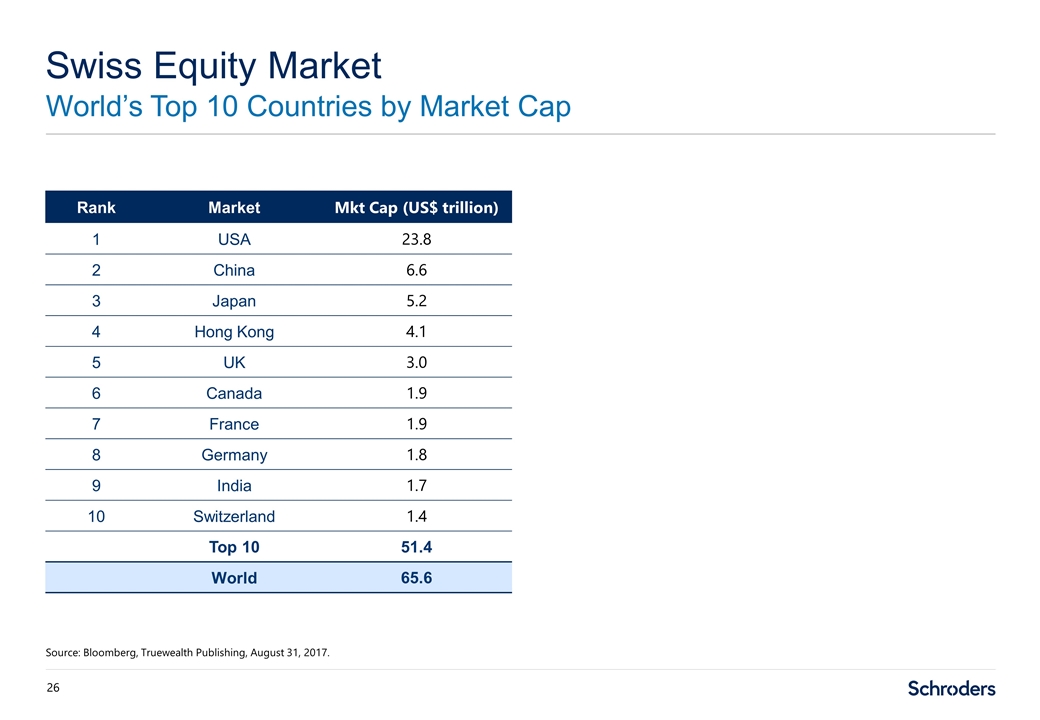
Swiss Equity Market World’s Top 10 Countries by Market Cap Source: Bloomberg, Truewealth Publishing, August 31, 2017. Rank Market Mkt Cap (US$ trillion) 1 USA 23.8 2 China 6.6 3 Japan 5.2 4 Hong Kong 4.1 5 UK 3.0 6 Canada 1.9 7 France 1.9 8 Germany 1.8 9 India 1.7 10 Switzerland 1.4 Top 10 51.4 World 65.6
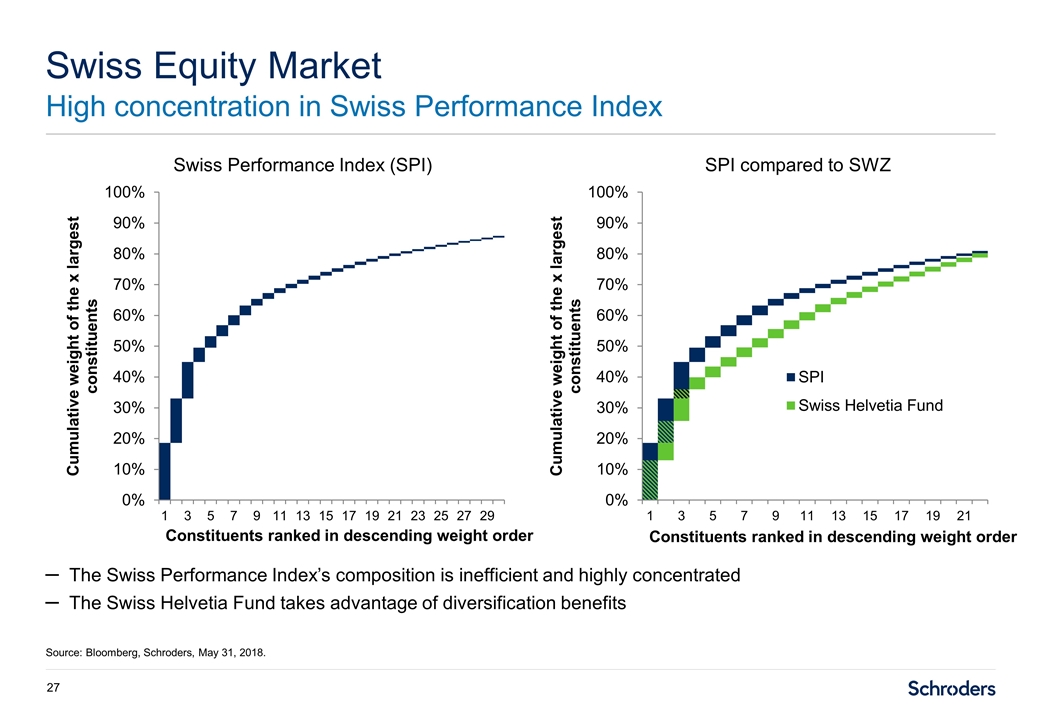
Swiss Equity Market High concentration in Swiss Performance Index Source: Bloomberg, Schroders, May 31, 2018. Swiss Performance Index (SPI) SPI compared to SWZ The Swiss Performance Index’s composition is inefficient and highly concentrated The Swiss Helvetia Fund takes advantage of diversification benefits Constituents ranked in descending weight order Constituents ranked in descending weight order
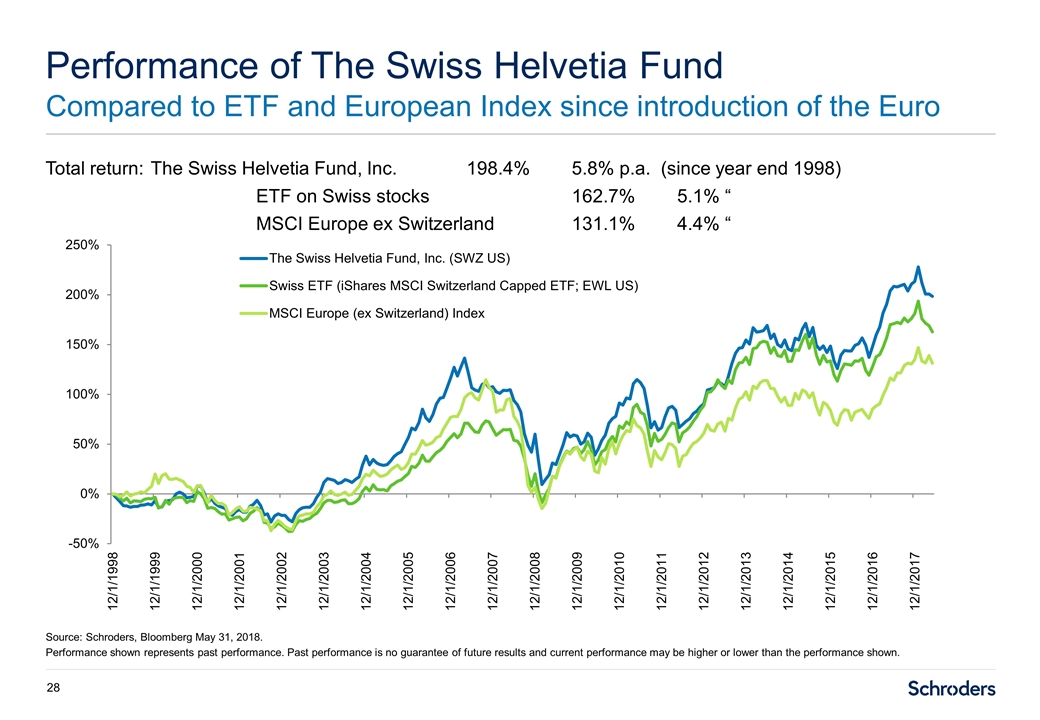
Total return:The Swiss Helvetia Fund, Inc.198.4%5.8% p.a. (since year end 1998) ETF on Swiss stocks162.7%5.1% “ MSCI Europe ex Switzerland131.1%4.4% “ Performance of The Swiss Helvetia Fund Compared to ETF and European Index since introduction of the Euro Source: Schroders, Bloomberg May 31, 2018. Performance shown represents past performance. Past performance is no guarantee of future results and current performance may be higher or lower than the performance shown.
