Attached files
| file | filename |
|---|---|
| 8-K - 8-K - Corporate Property Associates 17 - Global INC | a18-15535_28k.htm |
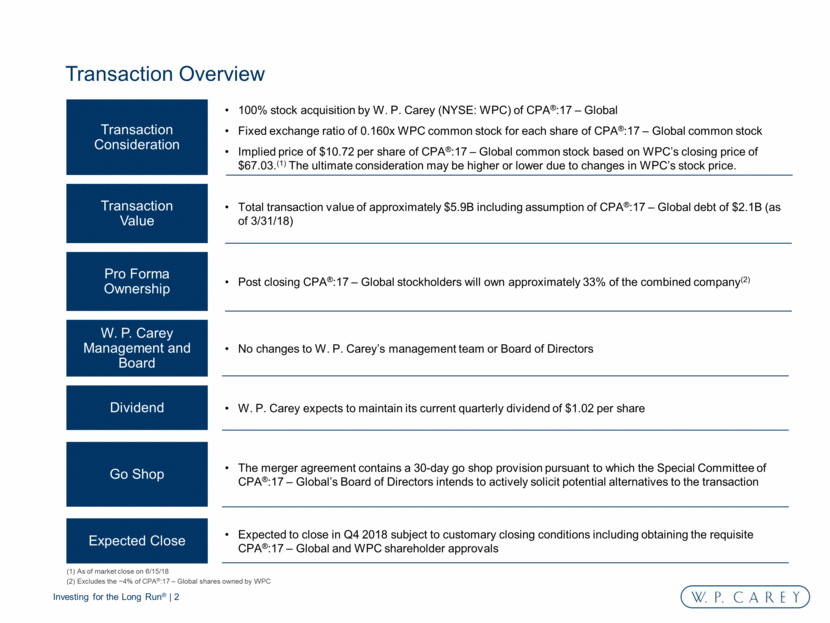
Transaction Overview 100% stock acquisition by W. P. Carey (NYSE: WPC) of CPA®:17 – Global Fixed exchange ratio of 0.160x WPC common stock for each share of CPA®:17 – Global common stock Implied price of $10.72 per share of CPA®:17 – Global common stock based on WPC’s closing price of $67.03.(1) The ultimate consideration may be higher or lower due to changes in WPC’s stock price. Transaction Consideration Pro Forma Ownership Post closing CPA®:17 – Global stockholders will own approximately 33% of the combined company(2) W. P. Carey Management and Board No changes to W. P. Carey’s management team or Board of Directors Dividend W. P. Carey expects to maintain its current quarterly dividend of $1.02 per share Expected Close Expected to close in Q4 2018 subject to customary closing conditions including obtaining the requisite CPA®:17 – Global and WPC shareholder approvals Transaction Value Total transaction value of approximately $5.9B including assumption of CPA®:17 – Global debt of $2.1B (as of 3/31/18) (1) As of market close on 6/15/18 (2) Excludes the ~4% of CPA®:17 – Global shares owned by WPC Go Shop The merger agreement contains a 30-day go shop provision pursuant to which the Special Committee of CPA®:17 – Global’s Board of Directors intends to actively solicit potential alternatives to the transaction
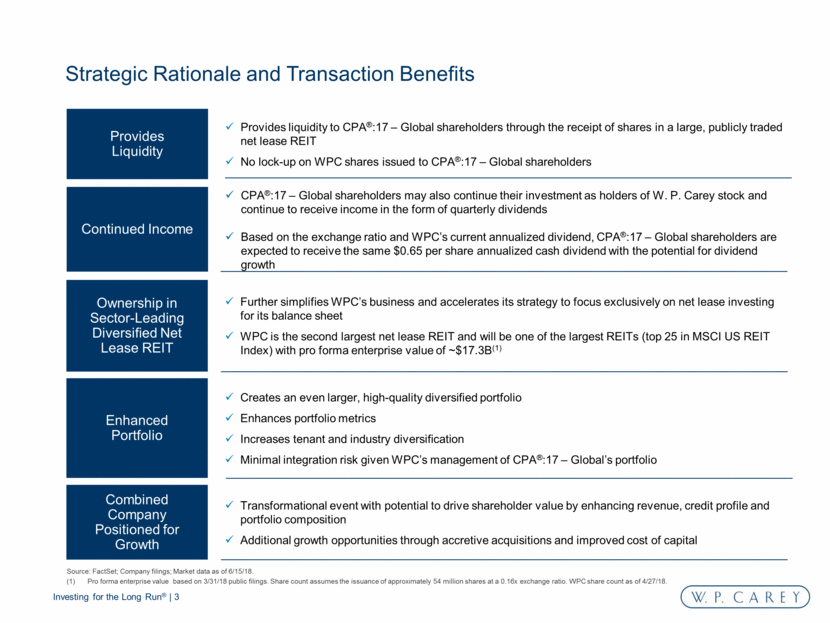
Strategic Rationale and Transaction Benefits Further simplifies WPC’s business and accelerates its strategy to focus exclusively on net lease investing for its balance sheet WPC is the second largest net lease REIT and will be one of the largest REITs (top 25 in MSCI US REIT Index) with pro forma enterprise value of ~$17.3B(1) Ownership in Sector-Leading Diversified Net Lease REIT Enhanced Portfolio Creates an even larger, high-quality diversified portfolio Enhances portfolio metrics Increases tenant and industry diversification Minimal integration risk given WPC’s management of CPA®:17 – Global’s portfolio Combined Company Positioned for Growth Transformational event with potential to drive shareholder value by enhancing revenue, credit profile and portfolio composition Additional growth opportunities through accretive acquisitions and improved cost of capital Source: FactSet; Company filings; Market data as of 6/15/18. Pro forma enterprise value based on 3/31/18 public filings. Share count assumes the issuance of approximately 54 million shares at a 0.16x exchange ratio. WPC share count as of 4/27/18. Provides liquidity to CPA®:17 – Global shareholders through the receipt of shares in a large, publicly traded net lease REIT No lock-up on WPC shares issued to CPA®:17 – Global shareholders Provides Liquidity CPA®:17 – Global shareholders may also continue their investment as holders of W. P. Carey stock and continue to receive income in the form of quarterly dividends Based on the exchange ratio and WPC’s current annualized dividend, CPA®:17 – Global shareholders are expected to receive the same $0.65 per share annualized cash dividend with the potential for dividend growth Continued Income
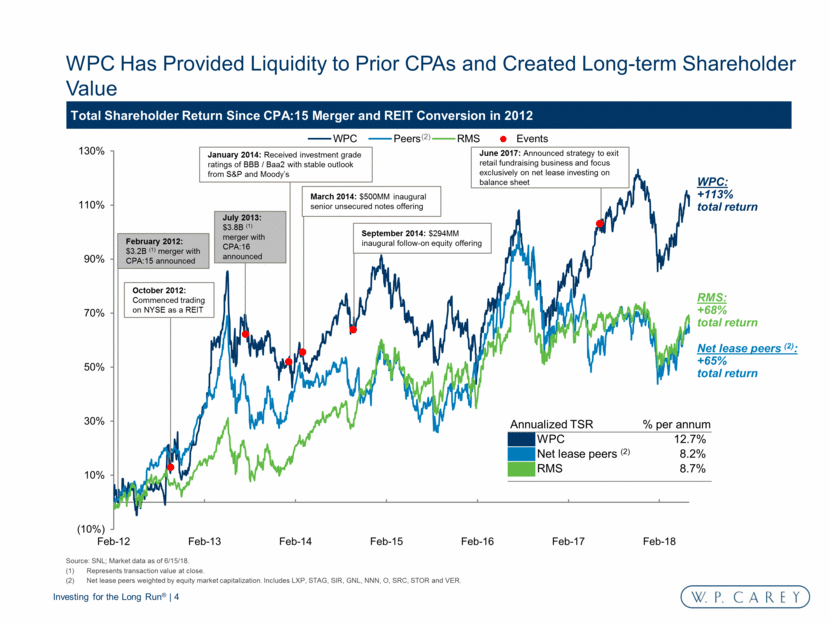
WPC Has Provided Liquidity to Prior CPAs and Created Long-term Shareholder Value Total Shareholder Return Since CPA:15 Merger and REIT Conversion in 2012 Source: SNL; Market data as of 6/15/18. Represents transaction value at close. Net lease peers weighted by equity market capitalization. Includes LXP, STAG, SIR, GNL, NNN, O, SRC, STOR and VER. WPC: +113% total return RMS: +68% total return Net lease peers (2): +65% total return (2) June 2017: Announced strategy to exit retail fundraising business and focus exclusively on net lease investing on balance sheet July 2013: $3.8B (1) merger with CPA:16 announced September 2014: $294MM inaugural follow-on equity offering March 2014: $500MM inaugural senior unsecured notes offering January 2014: Received investment grade ratings of BBB / Baa2 with stable outlook from S&P and Moody’s October 2012: Commenced trading on NYSE as a REIT February 2012: $3.2B (1) merger with CPA:15 announced Annualized TSR % per annum WPC 12.7% Net lease peers (2) 8.2% RMS 8.7% (10%) 10% 30% 50% 70% 90% 110% 130% Feb-12 Feb-13 Feb-14 Feb-15 Feb-16 Feb-17 Feb-18 WPC Peers RMS Events
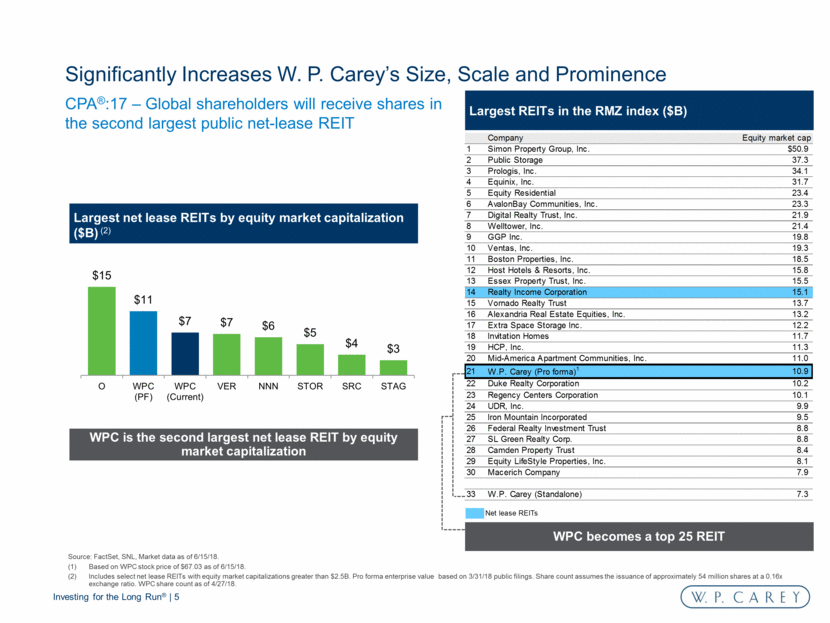
Significantly Increases W. P. Carey’s Size, Scale and Prominence Largest REITs in the RMZ index ($B) Largest net lease REITs by equity market capitalization ($B) (2) 1 WPC becomes a top 25 REIT WPC is the second largest net lease REIT by equity market capitalization CPA®:17 – Global shareholders will receive shares in the second largest public net-lease REIT Source: FactSet, SNL, Market data as of 6/15/18. Based on WPC stock price of $67.03 as of 6/15/18. Includes select net lease REITs with equity market capitalizations greater than $2.5B. Pro forma enterprise value based on 3/31/18 public filings. Share count assumes the issuance of approximately 54 million shares at a 0.16x exchange ratio. WPC share count as of 4/27/18. Net lease REITs Company Equity market cap 1 Simon Property Group, Inc. $50.9 2 Public Storage 37.3 3 Prologis, Inc. 34.1 4 Equinix, Inc. 31.7 5 Equity Residential 23.4 6 AvalonBay Communities, Inc. 23.3 7 Digital Realty Trust, Inc. 21.9 8 Welltower, Inc. 21.4 9 GGP Inc. 19.8 10 Ventas, Inc. 19.3 11 Boston Properties, Inc. 18.5 12 Host Hotels & Resorts, Inc. 15.8 13 Essex Property Trust, Inc. 15.5 14 Realty Income Corporation 15.1 15 Vornado Realty Trust 13.7 16 Alexandria Real Estate Equities, Inc. 13.2 17 Extra Space Storage Inc. 12.2 18 Invitation Homes 11.7 19 HCP, Inc. 11.3 20 Mid-America Apartment Communities, Inc. 11.0 21 W.P. Carey (Pro forma) 1 10.9 22 Duke Realty Corporation 10.2 23 Regency Centers Corporation 10.1 24 UDR, Inc. 9.9 25 Iron Mountain Incorporated 9.5 26 Federal Realty Investment Trust 8.8 27 SL Green Realty Corp. 8.8 28 Camden Property Trust 8.4 29 Equity LifeStyle Properties, Inc. 8.1 30 Macerich Company 7.9 33 W.P. Carey (Standalone) 7.3 $15 $11 $7 $7 $6 $5 $4 $3 O WPC (PF) WPC (Current) VER NNN STOR SRC STAG
The Combined Portfolio
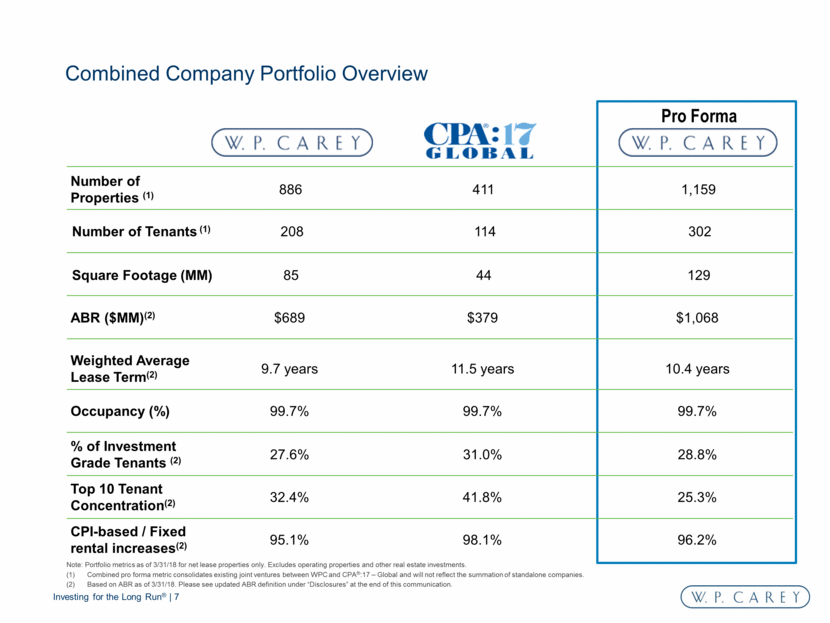
Combined Company Portfolio Overview Pro Forma 411 1,159 Number of Properties (1) 886 $379 $1,068 ABR ($MM)(2) $689 99.7% 99.7% Occupancy (%) 99.7% 11.5 years 10.4 years Weighted Average Lease Term(2) 9.7 years 31.0% 28.8% % of Investment Grade Tenants (2) 27.6% 41.8% 25.3% Top 10 Tenant Concentration(2) 32.4% 98.1% 96.2% CPI-based / Fixed rental increases(2) 95.1% 44 129 Square Footage (MM) 85 114 302 Number of Tenants (1) 208 Note: Portfolio metrics as of 3/31/18 for net lease properties only. Excludes operating properties and other real estate investments. Combined pro forma metric consolidates existing joint ventures between WPC and CPA®:17 – Global and will not reflect the summation of standalone companies. Based on ABR as of 3/31/18. Please see updated ABR definition under “Disclosures” at the end of this communication.
Geographic Diversification Pro Forma Portfolio Diversification Top 10 Tenants By Property Type Note: Based on annualized contractual minimum base rent (“ABR”) as of March 31, 2018. Net lease portfolio only; excludes operating properties. Includes: Education Facilities, Hotels, Movie Theaters, Fitness Facilities and Student Housing, which are all net lease properties. Also includes ground leases. Includes Australia and Japan. Uncapped CPI 43% CPI-based 23% Fixed 31% Other 3% None 1% Internal Growth from Contractual Rent Increases U.S. 62% Mexico 0% Canada 1% Europe 35% Other (2) 1% 64% North America Rank Tenant Geography % of total 1. Europe 4.7% 2. North America 3.4% 3. Europe 2.8% 4. Europe 2.8% 5. North America 2.5% 6. Europe 2.2% 7. North America 1.9% 8. Europe 1.7% 9. North America 1.7% 10. North America 1.6% Top 10 Total 25.3% Industrial 24% Warehouse 19% Office 26% Retail 19% Self-Storage 3% Other (1) 8% 43% Industrial / Warehouse 66% CPI-linked 62% 0% 1% 35% 1% 24% 19% 26% 19% 3% 8% 43% 23% 31% 3% 1%
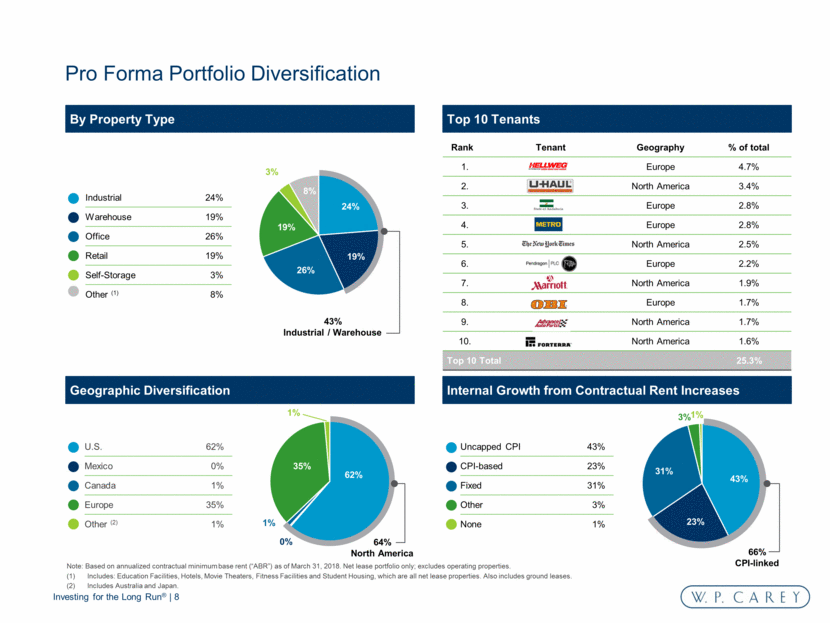
Long Weighted Average Lease Term and Lease Maturities Pro forma lease term of 10.4 years is among the highest for the net lease sector Lease expiration schedule (1) Weighted average lease term (years) (1) Based on ABR as of 3/31/18. Please see updated ABR definition under “Disclosures” at the end of this communication. 14.0 11.4 10.4 9.7 9.6 9.4 9.3 9.2 8.9 8.6 4.7 STOR NNN WPC (PF) WPC (Current) SRC O VER SIR LXP GNL STAG 1% 4% 5% 6% 10% 6% 14% 5% 3% 6% 41% 1% 3% 3% 4% 7% 4% 12% 5% 4% 7% 49% 2018 2019 2020 2021 2022 2023 2024 2025 2026 2027 Thereafter W. P. Carey Current W. P. Carey Pro forma
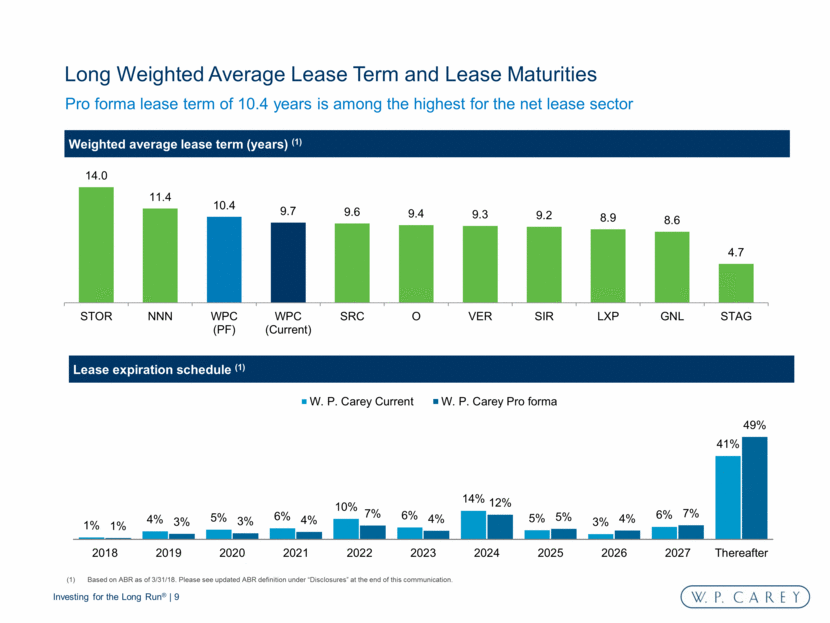
Strong Credit Profile Equity (1) 62% Mortgage Debt (pro rata) 18% Senior Unsecured Notes 18% Unsecured Revolving Credit Facility (2) 2% Pro Forma Capitalization ($MM) March 31, 2018 Pro forma enterprise value based on 3/31/18 public filings. Share count assumes the issuance of approximately 54 million shares at a 0.16x exchange ratio. WPC share count as of 4/27/18. WPC stock price of $67.03 as of 6/15/18. Includes WPC credit facility and CPA®:17 – Global term loan / credit facility; excludes any additional impact of transaction adjustments from merger. Cash and equivalents presented on a consolidated basis. Market Capitalization (1) $10,919 Mortgage Debt, pro rata 3,167 Senior Unsecured Notes 3,148 Unsecured Credit Facility (2) 360 Total Pro Rata Debt $6,675 Less: Cash and Equivalents (3) (274) Total Pro Rata Net Debt $6,401 Total Enterprise Value $17,320 Total Capitalization $17,594 62% 18% 18% 2%
Investor Returns
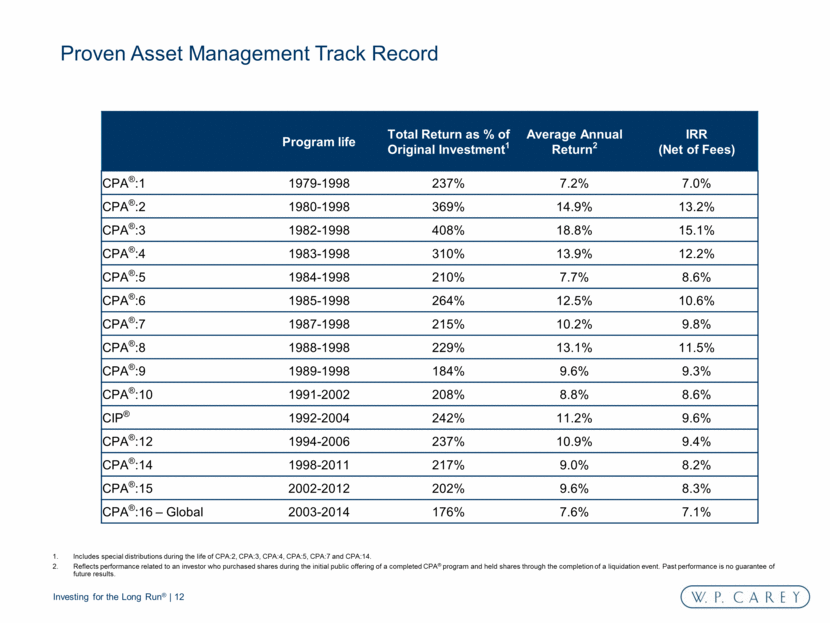
Proven Asset Management Track Record Includes special distributions during the life of CPA:2, CPA:3, CPA:4, CPA:5, CPA:7 and CPA:14. Reflects performance related to an investor who purchased shares during the initial public offering of a completed CPA® program and held shares through the completion of a liquidation event. Past performance is no guarantee of future results. Program life Total Return as % of Original Investment1 Average Annual Return2 IRR (Net of Fees) CPA®:1 1979-1998 237% 7.2% 7.0% CPA®:2 1980-1998 369% 14.9% 13.2% CPA®:3 1982-1998 408% 18.8% 15.1% CPA®:4 1983-1998 310% 13.9% 12.2% CPA®:5 1984-1998 210% 7.7% 8.6% CPA®:6 1985-1998 264% 12.5% 10.6% CPA®:7 1987-1998 215% 10.2% 9.8% CPA®:8 1988-1998 229% 13.1% 11.5% CPA®:9 1989-1998 184% 9.6% 9.3% CPA®:10 1991-2002 208% 8.8% 8.6% CIP® 1992-2004 242% 11.2% 9.6% CPA®:12 1994-2006 237% 10.9% 9.4% CPA®:14 1998-2011 217% 9.0% 8.2% CPA®:15 2002-2012 202% 9.6% 8.3% CPA®:16 – Global 2003-2014 176% 7.6% 7.1%
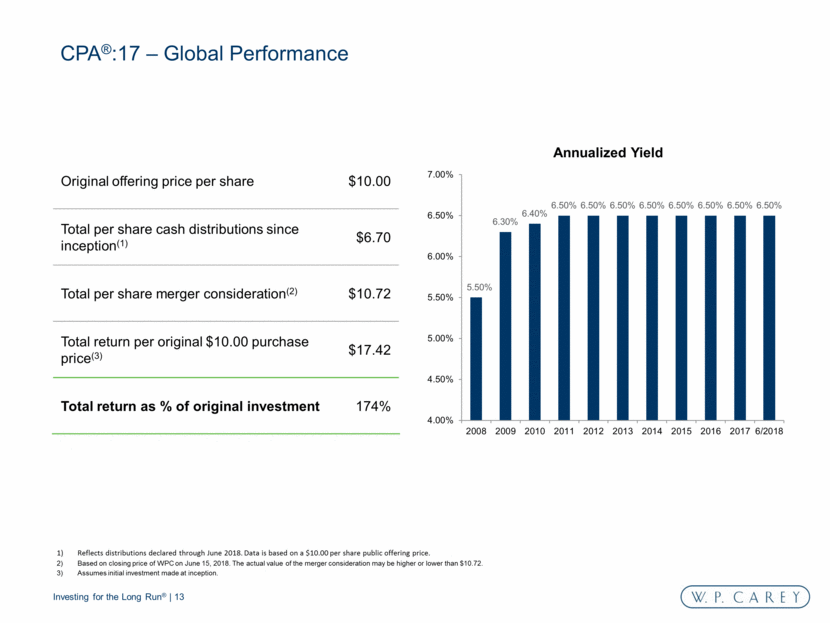
CPA®:17 – Global Performance Reflects distributions declared through June 2018. Data is based on a $10.00 per share public offering price. Based on closing price of WPC on June 15, 2018. The actual value of the merger consideration may be higher or lower than $10.72. Assumes initial investment made at inception. Original offering price per share $10.00 Total per share cash distributions since inception(1) $6.70 Total per share merger consideration(2) $10.72 Total return per original $10.00 purchase price(3) $17.42 Total return as % of original investment 174% 5.50% 6.30% 6.40% 6.50% 6.50% 6.50% 6.50% 6.50% 6.50% 6.50% 6.50% 4.00% 4.50% 5.00% 5.50% 6.00% 6.50% 7.00% 2008 2009 2010 2011 2012 2013 2014 2015 2016 2017 6/2018 Annualized Yield
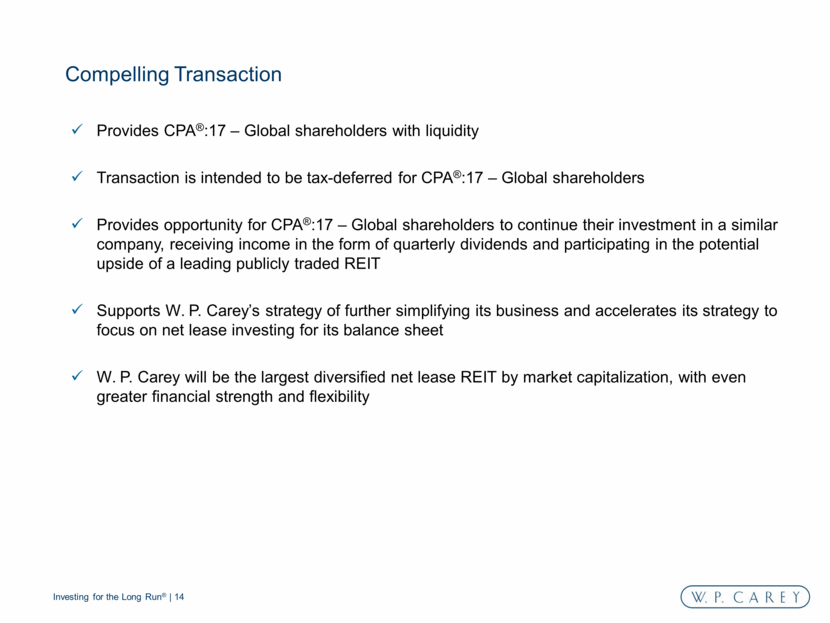
Compelling Transaction Provides CPA®:17 – Global shareholders with liquidity Transaction is intended to be tax-deferred for CPA®:17 – Global shareholders Provides opportunity for CPA®:17 – Global shareholders to continue their investment in a similar company, receiving income in the form of quarterly dividends and participating in the potential upside of a leading publicly traded REIT Supports W. P. Carey’s strategy of further simplifying its business and accelerates its strategy to focus on net lease investing for its balance sheet W. P. Carey will be the largest diversified net lease REIT by market capitalization, with even greater financial strength and flexibility
Cautionary Statement Concerning Forward-Looking Statements Certain of the matters discussed in this communication constitute forward-looking statements within the meaning of the Securities Act of 1933 and the Securities Exchange Act of 1934, both as amended by the Private Securities Litigation Reform Act of 1995. The forward-looking statements include, among other things, statements regarding intent, belief or expectations of CPA®:17 – Global and can be identified by the use of words such as “may,” “will,” “should,” “would,” “assume,” “outlook,” “seek,” “plan,” “believe,” “expect,” “anticipate,” “intend,” “estimate,” “forecast,” and other comparable terms. These forward-looking statements include, but are not limited to, statements regarding the benefits of the proposed Merger, annualized dividends, funds from operations coverage, integration plans and expected synergies, the expected benefits of the proposed Merger, anticipated future financial and operating performance and results, including estimates of growth and the expected timing of completion of the proposed Merger. These statements are based on current expectations, and actual results could be materially different from those projected in such forward-looking statements. There are a number of risks and uncertainties that could cause actual results to differ materially from the forward-looking statements. Discussions of some of these other important factors and assumptions are contained in CPA®:17 – Global’s and W. P. Carey’s filings with the SEC and are available at the SEC’s website at http://www.sec.gov, including Item 1A. Risk Factors in each company’s Annual Report on Form 10-K for the year ended December 31, 2017. These risks, as well as other risks associated with the proposed Merger, will be more fully discussed in the Joint Proxy Statement/Prospectus that will be included in the Registration Statement on Form S-4 that CPA®:17 – Global and W. P. Carey will file with the SEC in connection with the proposed Merger. In light of these risks, uncertainties, assumptions and factors, the forward-looking events discussed in this communication may not occur. Readers are cautioned not to place undue reliance on these forward-looking statements, which speak only as of the date of this communication, unless noted otherwise. Except as required under the federal securities laws and the rules and regulations of the SEC, CPA®:17 – Global does not undertake any obligation to release publicly any revisions to the forward-looking statements to reflect events or circumstances after the date of this communication or to reflect the occurrence of unanticipated events. All data presented herein is as of March 31, 2018 unless otherwise noted. Amounts may not sum to totals due to rounding. Past performance does not guarantee future results.
Additional Information and Where to Find It This communication shall not constitute an offer to sell or the solicitation of an offer to buy any securities, nor shall there be any sale of securities in any jurisdiction in which such offer, solicitation or sale would be unlawful prior to registration or qualification under the securities laws of any such jurisdiction. No offering of securities shall be made except by means of a prospectus meeting the requirements of Section 10 of the Securities Act of 1933, as amended. W. P. Carey intends to file with the SEC a registration statement on Form S-4 that will include a Joint Proxy Statement/Prospectus and other relevant documents to be mailed by CPA®:17 – Global and W. P. Carey to their respective security holders in connection with the proposed Transactions. WE URGE INVESTORS TO READ THE JOINT PROXY STATEMENT / PROSPECTUS AND ANY OTHER RELEVANT DOCUMENTS FILED BY CPA®:17 – Global AND W. P. CAREY WHEN THEY BECOME AVAILABLE, BECAUSE THEY WILL CONTAIN IMPORTANT INFORMATION ABOUT CPA®:17 – Global, W. P. CAREY AND THE PROPOSED TRANSACTIONS. INVESTORS ARE URGED TO READ THESE DOCUMENTS CAREFULLY AND IN THEIR ENTIRETY. Investors will be able to obtain these materials (when they become available) and other documents filed with the SEC free of charge at the SEC’s website (http://www.sec.gov). In addition, these materials (when they become available) will also be available free of charge by accessing CPA®:17 – Global’s website (http://www.cpa17global.com) or by accessing W. P. Carey’s website (http://www.wpcarey.com). Investors may also read and copy any reports, statements and other information filed by W. P. Carey or CPA®:17 – Global, with the SEC, at the SEC public reference room at 100 F Street, N.E., Washington, D.C. 20549. Please call the SEC at 1-800-SEC-0330 or visit the SEC’s website for further information on its public reference room. Participants in the Proxy Solicitation: Information regarding W. P. Carey’s directors and executive officers is available in its proxy statement filed with the SEC by W. P. Carey on April 3, 2018 in connection with its 2018 annual meeting of stockholders, and information regarding CPA®:17’s directors and executive officers is available in its proxy statement filed with the SEC by or CPA®:17 – Global on April 20, 2018 in connection with its 2018 annual meeting of stockholders. Other information regarding the participants in the proxy solicitation and a description of their direct and indirect interests, by security holdings or otherwise, will be contained in the Joint Proxy Statement/Prospectus and other relevant materials to be filed with the SEC when they become available.
Disclosures The following non-GAAP financial measures are used in this presentation Pro Rata Metrics This supplemental package contains certain metrics prepared under the pro rata consolidation method. We refer to these metrics as pro rata metrics. We have a number of investments, usually with our affiliates, in which our economic ownership is less than 100%. Under the full consolidation method, we report 100% of the assets, liabilities, revenues and expenses of those investments that are deemed to be under our control or for which we are deemed to be the primary beneficiary, even if our ownership is less than 100%. Also, for all other jointly owned investments, which we do not control, we report our net investment and our net income or loss from that investment. Under the pro rata consolidation method, we present our proportionate share, based on our economic ownership of these jointly owned investments, of the assets, liabilities, revenues and expenses of those investments. ABR ABR represents contractual minimum annualized base rent for our net-leased properties, net of receivable reserves as determined by GAAP, and reflects exchange rates as of March 31, 2018. If there is a rent abatement, we annualize the first monthly contractual base rent following the free rent period. ABR is not applicable to operating properties and is presented on a pro rata basis.
