Attached files
| file | filename |
|---|---|
| 8-K - 8-K - W. P. Carey Inc. | a18-15534_18k.htm |
| EX-99.2 - EX-99.2 - W. P. Carey Inc. | a18-15534_1ex99d2.htm |
| EX-2.1 - EX-2.1 - W. P. Carey Inc. | a18-15534_1ex2d1.htm |
Transaction Overview 100% stock acquisition by W. P. Carey (NYSE: WPC) of CPA®: – 17 Global (CPA:17) Fixed exchange ratio of 0.160x shares of WPC common stock for each share of CPA:17 common stock Implied price of $10.72 per each share of CPA:17 common stock based on WPC’s closing price of $67.03 (1) Transaction Consideration Pro Forma Ownership Post-closing CPA:17 stockholders will own approximately 33% of the combined company (2) W. P. Carey Management and Board No changes to WPC’s management team or Board of Directors Dividend WPC expects to maintain its current quarterly dividend of $1.020 per share Expected Close Expected to close in Q4 2018 subject to customary closing conditions, including obtaining the requisite WPC and CPA:17 shareholder approvals Transaction Value Total transaction value of approximately $5.9B including assumption of CPA:17’s debt of $2.1B (as of 3/31/18) Implies an approximate 7% cap rate for net lease Real Estate assets As of market close on 6/15/18. Excludes the ~4% of CPA:17 shares owned by WPC. Earnings Impact Transaction significantly increases WPC’s Real Estate AFFO derived from long-term, recurring lease revenues, partially replacing Investment Management AFFO derived from finite fee streams Increased earnings quality expected to result in a higher overall multiple on pro forma earnings
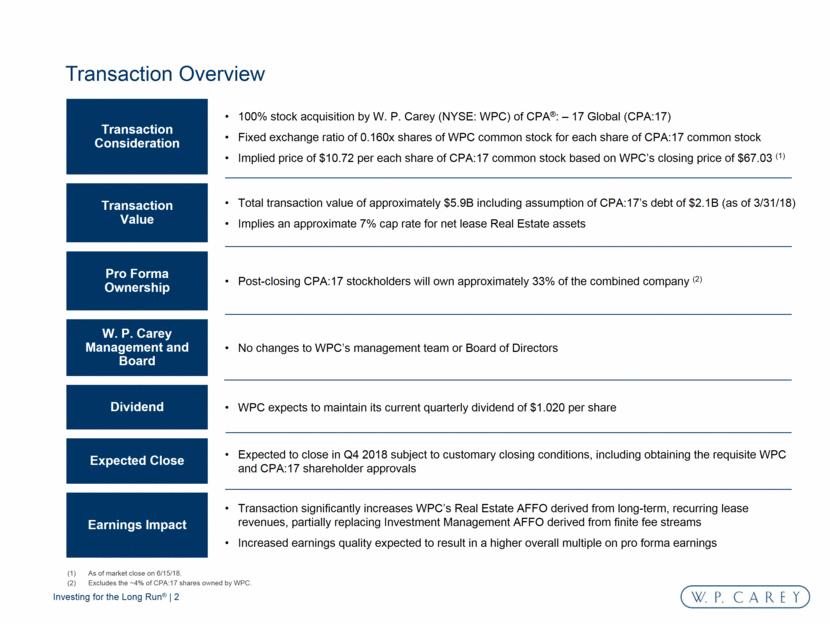
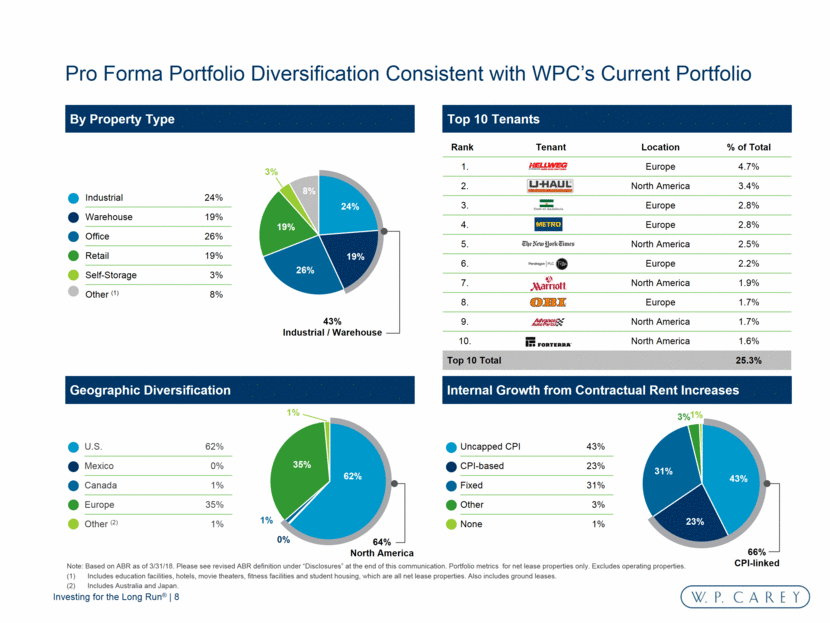
Strategic Rationale and Transaction Benefits Further simplifies WPC’s business and accelerates its strategy to focus exclusively on net lease investing for its balance sheet Higher-multiple Real Estate segment is expected to generate approximately 96% of total pro forma AFFO (up from 83% currently) (1) Accelerates “Pure-Play” Strategy Enhanced Portfolio Addition of a high-quality diversified portfolio aligned with WPC’s existing portfolio Enhances portfolio metrics, including extending the weighted-average lease term to 10.4 years Increases tenant and industry diversification and reduces top 10 concentration to 25% of ABR (3) Minimal integration risk given WPC’s management of CPA:17’s portfolio Sector Leading Diversified Net Lease REIT Considerably increases size, scale and prominence with pro forma equity market capitalization of ~$10.9B and pro forma enterprise value of ~$17.3B (2) Second largest net lease REIT with significantly elevated ranking in the MSCI US REIT Index (into top 25) G&A spread over larger asset base Positioned for Growth Transformational event with potential to drive re-weighting of WPC as a leading pure-play net lease REIT Additional growth opportunities through improved cost of capital resulting from a simplified business with increased contribution from higher-multiple Real Estate segment Flexible and Conservative Balance Sheet Improves overall credit profile and reduces debt to gross assets Expect to maintain BBB and Baa2 ratings with a clear path to reducing secured debt Expected to increase stock liquidity and positions WPC for enhanced access to capital Note: WPC share price of $67.03 based on 6/15/18 market close. Current Real Estate AFFO based on 3/31/18 actuals. Illustrative pro forma Real Estate AFFO based on AFFO for WPC and MFFO, adjusted for CPA:17 for the three months ended 3/13/18 and adjusted for select transaction adjustments. Pro forma enterprise value based on 3/31/18 public filings. Share count assumes the issuance of approximately 54 million shares at a 0.16x exchange ratio. WPC share count as of 4/27/18. Annualized Base Rent (“ABR”). Please see revised ABR definition under “Disclosures” at the end of this communication.
Real Estate Inv. Mgmt. AFFO by Segment Current (1) Pro Forma (2) Real Estate earnings are generally ascribed a higher multiple by investors given the long-term, recurring nature of the underlying income relative to finite Investment Management earnings Improved earnings mix results in a higher pro forma AFFO multiple, even at implied multiples currently ascribed to WPC’s Real Estate and Investment Management segments More Valuable Earnings Source: SNL; market data as of 6/15/18. Note: Analysis is intended to be for illustrative purposes. Current Real Estate AFFO based on 3/31/18 actuals. Illustrative pro forma Real Estate AFFO based on AFFO for WPC and MFFO, adjusted for CPA:17 for the three months ended 3/13/18 and adjusted for select transaction adjustments. AFFO multiple for Real Estate segment based on average consensus 2018 AFFO multiple for office, industrial and retail net lease REITs with equity market capitalizations exceeding $2.5B (STAG, O, NNN, STORE, SRC and VER). Investment Management multiple implied from Blended AFFO multiple and Real Estate AFFO multiple assuming the Investment Management segment comprises 17% of AFFO. Blended 2018E AFFO based on midpoint of previously issued AFFO guidance for 2018 of $5.40 per share. Pro forma blended multiple assumes the Real Estate AFFO multiple and Investment Management AFFO multiple remain constant and AFFO is comprised of 96% Real Estate and 4% Investment Management AFFO. Real Estate AFFO multiple (3) 14.2x 14.2x Investment Management AFFO multiple (4) 3.9x 3.9x Blended 2018E AFFO multiple (5) 12.4x 13.7x (6) +1.3x +10.5% AFFO Multiple Re-weighting 83% 17% 96% 4%
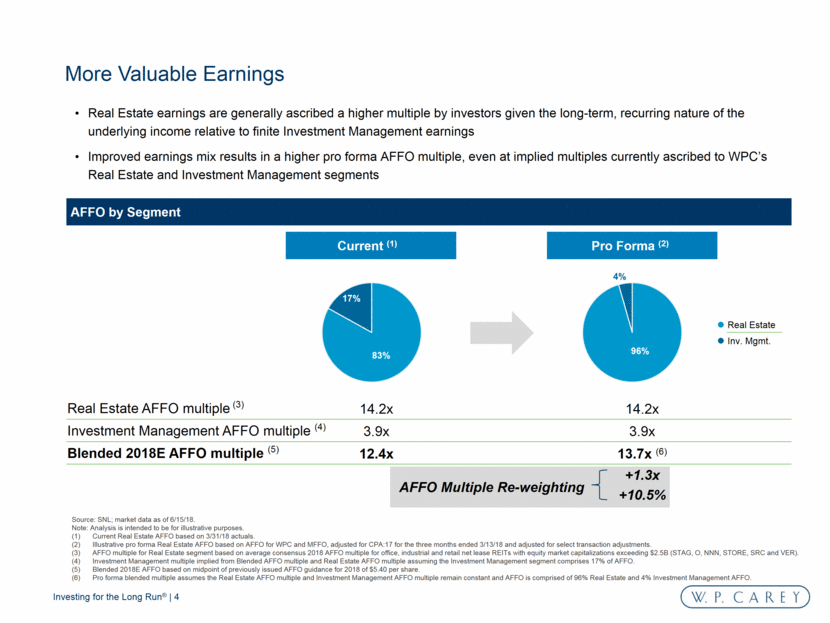
Significantly Increases Size, Scale and Prominence Largest REITs in the MSCI US REIT index ($B) Largest Net Lease REITs by Equity Market Capitalization ($B) (2) Source: FactSet, SNL, Market data as of 6/15/18. Based on WPC stock price of $67.03 as of 6/15/18. Includes select net lease REITs with equity market capitalizations greater than $2.5B. Pro forma enterprise value based on 3/31/18 public filings. Share count assumes the issuance of approximately 54 million shares at a 0.16x exchange ratio. WPC share count as of 4/27/18. Based on rental revenue (excluding reimbursables); WPC current and pro forma metrics include operating property revenues. WPC becomes a top 25 REIT Annual Rental Revenue ($B) – FY 2017 (3) Company Equity Market Cap . Net lease REITs $15 $11 $7 $7 $6 $5 $4 $3 O WPC (PF) WPC (Current) VER NNN STOR SRC STAG $1.2 $1.2 $1.1 $0.7 $0.6 $0.6 $0.4 $0.3 O VER WPC (PF) WPC (Current) SRC NNN STOR STAG Company Equity market cap 1 Simon Property Group, Inc. $50.9 2 Public Storage 37.3 3 Prologis, Inc. 34.1 4 Equinix, Inc. 31.7 5 Equity Residential 23.4 6 AvalonBay Communities, Inc. 23.3 7 Digital Realty Trust, Inc. 21.9 8 Welltower, Inc. 21.4 9 GGP Inc. 19.8 10 Ventas, Inc. 19.3 11 Boston Properties, Inc. 18.5 12 Host Hotels & Resorts, Inc. 15.8 13 Essex Property Trust, Inc. 15.5 14 Realty Income Corporation 15.1 15 Vornado Realty Trust 13.7 16 Alexandria Real Estate Equities, Inc. 13.2 17 Extra Space Storage Inc. 12.2 18 Invitation Homes 11.7 19 HCP, Inc. 11.3 20 Mid-America Apartment Communities, Inc. 11.0 21 W.P. Carey (Pro forma) 1 10.9 22 Duke Realty Corporation 10.2 23 Regency Centers Corporation 10.1 24 UDR, Inc. 9.9 25 Iron Mountain Incorporated 9.5 26 Federal Realty Investment Trust 8.8 27 SL Green Realty Corp. 8.8 28 Camden Property Trust 8.4 29 Equity LifeStyle Properties, Inc. 8.1 30 Macerich Company 7.9 33 W.P. Carey (Standalone) 7.3
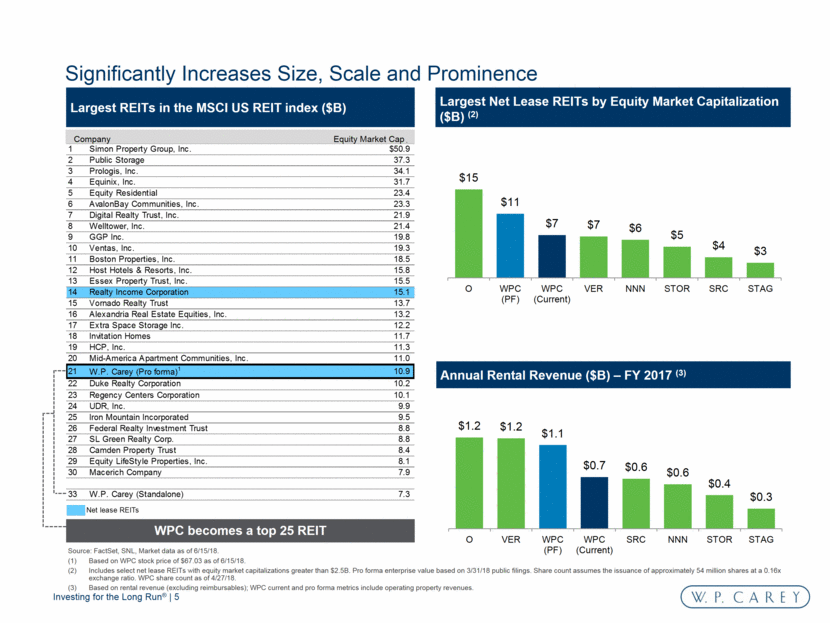
Overview of CPA:17 CPA:17 is the largest fund advised by WPC and owns a high-quality, diversified, primarily net lease portfolio Net Lease Assets by Property Type (1) Industrial 15% Self-Storage 1% Other (2) 5% Warehouse 28% Office 28% Retail 23% Net Lease Assets by Geography (1) International 44% United States 56% Based on ABR as of 3/31/18. Please see revised ABR definition under “Disclosures” at the end of this communication. Includes education facilities, fitness facilities, hotel, ground leases, and net leased student housing. Based on WPC stock price of $67.03 as of 6/15/18 and a 0.16x exchange ratio. Purchase Price Per Share (3) $10.72 Shares Outstanding (MM) 354 Equity Market Capitalization $3,799 Mortgage Debt, pro rata 2,140 Senior Credit Facility 92 Total Debt $2,232 Less: Cash and Equivalents (102) Enterprise Value $5,929 Total Debt / Gross Assets 39% Net Lease ABR $379MM Operating Self-storage Assets NOI (TTM) $23MM Cold Storage Equity Investment (book value) $39MM Other Investments (book value) $213MM Capitalization ($MM) March 31, 2018 Other Metrics 28% 28% 23% 15% 1% 5% 56% 44%
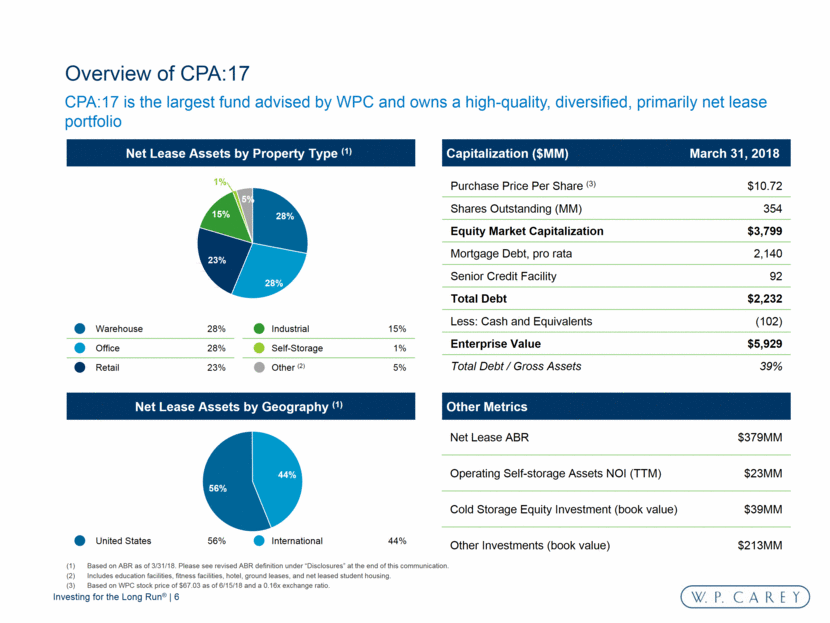
Combined Company Portfolio Overview Pro Forma 411 1,159 Number of Properties (1) 886 $379 $1,068 ABR ($MM) (2) $689 99.7% 99.7% Occupancy (%) 99.7% 11.5 years 10.4 years Weighted-Average Lease Term (2) 9.7 years 31.0% 28.8% % of Investment Grade Tenants (2) 27.6% 41.8% 25.3% Top 10 Tenant Concentration (2) 32.4% 98.1% 96.2% CPI-based / Fixed Rental Increases (2) 95.1% 44 129 Square Footage (MM) 85 114 302 Number of Tenants (1) 208 Note: Portfolio metrics as of 3/31/18 for net lease properties only. Excludes operating properties and other Real Estate investments. Combined pro forma metric consolidates existing joint ventures between WPC and CPA:17 and will not reflect the summation of standalone companies. Based on ABR as of 3/31/18. Please see revised ABR definition under “Disclosures” at the end of this communication.
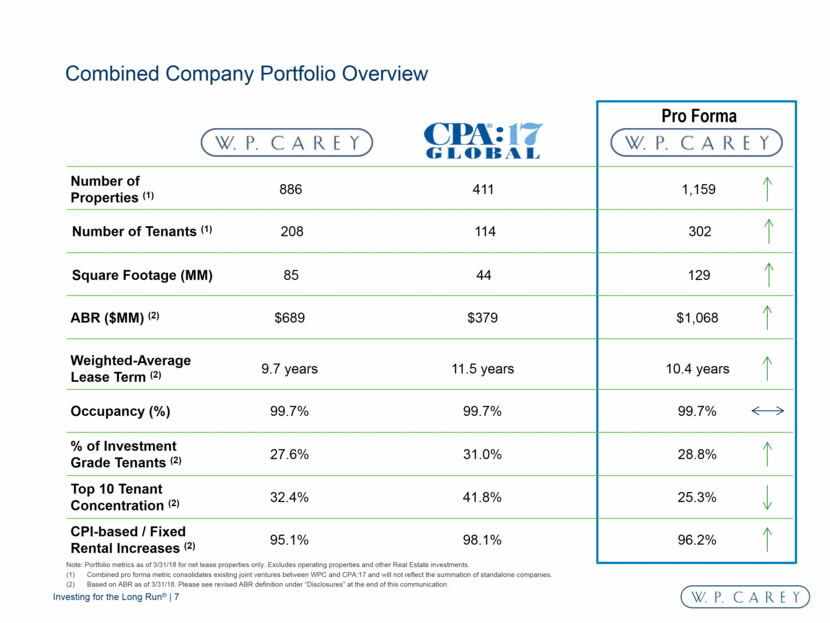
Geographic Diversification Pro Forma Portfolio Diversification Consistent with WPC’s Current Portfolio Top 10 Tenants By Property Type Industrial 24% Warehouse 19% Office 26% Retail 19% Self-Storage 3% Other (1) 8% Note: Based on ABR as of 3/31/18. Please see revised ABR definition under “Disclosures” at the end of this communication. Portfolio metrics for net lease properties only. Excludes operating properties. Includes education facilities, hotels, movie theaters, fitness facilities and student housing, which are all net lease properties. Also includes ground leases. Includes Australia and Japan. Uncapped CPI 43% CPI-based 23% Fixed 31% Other 3% None 1% Internal Growth from Contractual Rent Increases U.S. 62% Mexico 0% Canada 1% Europe 35% Other (2) 1% 64% North America 43% Industrial / Warehouse 66% CPI-linked Rank Tenant Location % of Total 1. Europe 4.7% 2. North America 3.4% 3. Europe 2.8% 4. Europe 2.8% 5. North America 2.5% 6. Europe 2.2% 7. North America 1.9% 8. Europe 1.7% 9. North America 1.7% 10. North America 1.6% Top 10 Total 25.3% 43% 23% 31% 3% 1% 62% 0% 1% 35% 1% 24% 19% 26% 19% 3% 8%
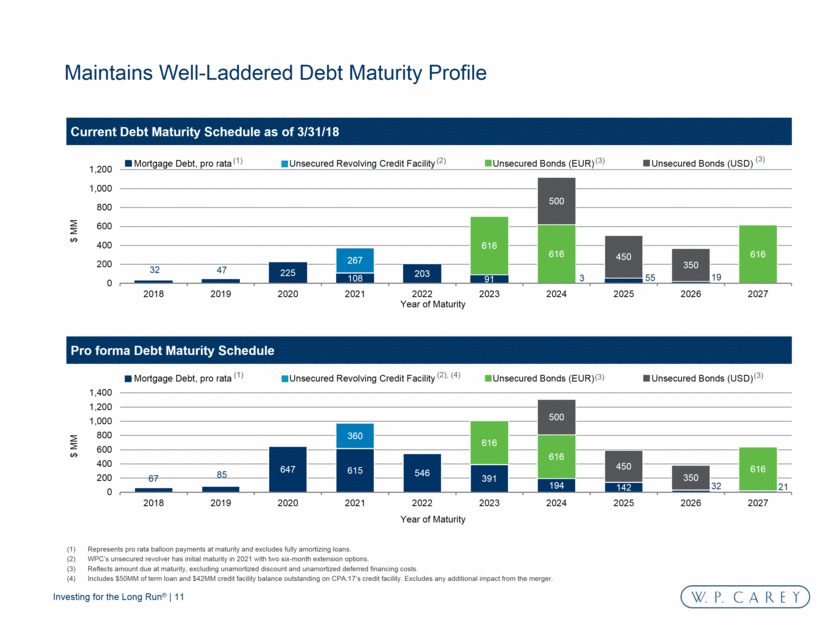
Extends Weighted-Average Lease Term and Lease Maturities Pro forma lease term of 10.4 years is among the highest for the net lease sector Lease Expiration Schedule (1) Weighted Average Lease Term (years) (1) Based on ABR as of 3/31/18. Please see revised ABR definition under “Disclosures” at the end of this communication. 14.0 11.4 10.4 9.7 9.6 9.4 9.3 9.2 8.9 8.6 4.7 STOR NNN WPC (PF) WPC (Current) SRC O VER SIR LXP GNL STAG 1% 4% 5% 6% 10% 6% 14% 5% 3% 6% 41% 1% 3% 3% 4% 7% 4% 12% 5% 4% 7% 49% 2018 2019 2020 2021 2022 2023 2024 2025 2026 2027 Thereafter W. P. Carey Current W. P. Carey Pro Forma
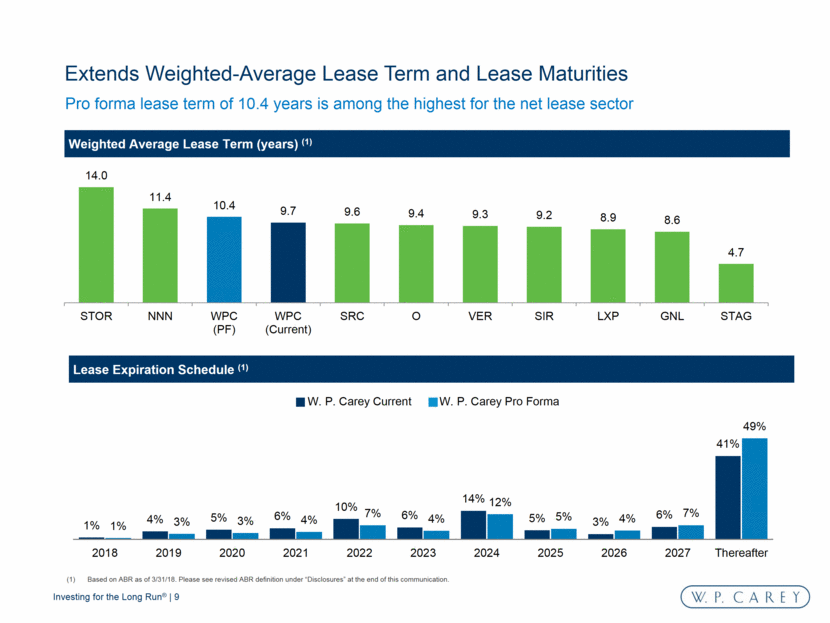
Transaction Enhances Credit Profile Equity 62% Mortgage Debt (pro rata) 18% Senior Unsecured Notes 18% Unsecured Credit Facility 2% Market Capitalization (2) $10,919 Mortgage Debt, pro rata 3,167 Senior Unsecured Notes 3,148 Unsecured Credit Facility (3) 360 Total Pro Rata Debt $6,675 Less: Cash and Equivalents (4) (274) Total Pro Rata Net Debt $6,401 Total Enterprise Value $17,320 Total Capitalization $17,594 Total Debt and Gross Assets based on 3/31/18 consolidated figures for WPC and CPA:17 adjusted for select transaction adjustments. Pro forma enterprise value based on 3/31/18 public filings. Share count assumes the issuance of approximately 54 million shares at a 0.16x exchange ratio. WPC share count as of 4/27/18. WPC stock price of $67.03 as of 6/15/18. Includes WPC credit facility and CPA:17 term loan / credit facility; excludes any additional impact of transaction adjustments from merger. Cash and equivalents presented on a consolidated basis. Pro Forma Capitalization ($MM) March 31, 2018 Decreases debt to gross assets from 49% to below 44% (1) Clear path to reducing secured debt through prepayment of debt with minimal frictional costs Temporary increase in net debt / EBITDA above current levels with projected path to reduce post-transaction Substantial credit facility capacity to fund ongoing needs Expected to enhance liquidity and access to capital Increases size – the largest diversified net lease REIT Replaces finite Investment Management fees with long-term, recurring Real Estate revenues providing higher quality cash flow coverage for interest expense and dividend 62% 18% 18% 2%
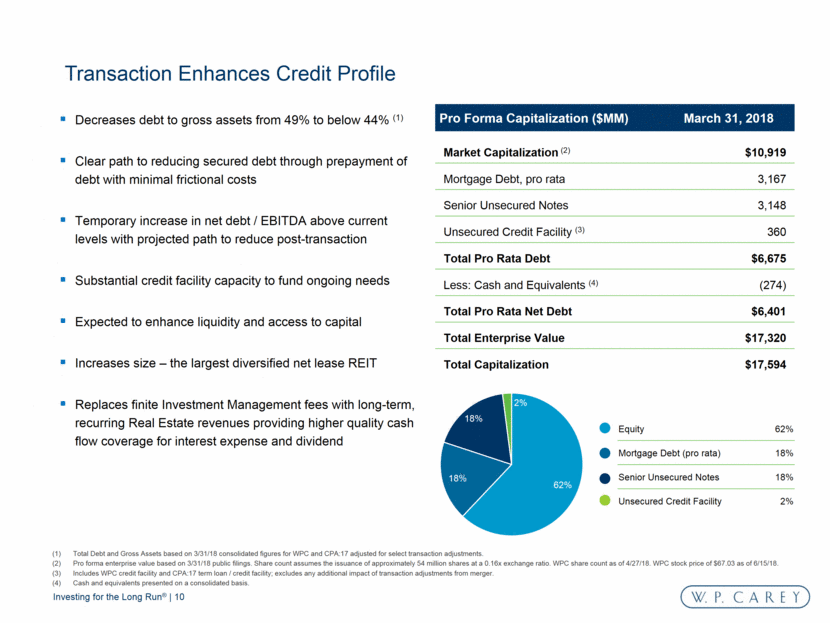
Current Debt Maturity Schedule as of 3/31/18 (1) (2) (3) (3) Represents pro rata balloon payments at maturity and excludes fully amortizing loans. WPC’s unsecured revolver has initial maturity in 2021 with two six-month extension options. Reflects amount due at maturity, excluding unamortized discount and unamortized deferred financing costs. Includes $50MM of term loan and $42MM credit facility balance outstanding on CPA:17’s credit facility. Excludes any additional impact from the merger. Pro forma Debt Maturity Schedule (1) (2), (4) (3) (3) Maintains Well-Laddered Debt Maturity Profile 32 47 225 108 203 91 3 55 19 267 616 616 616 500 450 350 0 200 400 600 800 1,000 1,200 2018 2019 2020 2021 2022 2023 2024 2025 2026 2027 $ MM Year of Maturity Mortgage Debt, pro rata Unsecured Revolving Credit Facility Unsecured Bonds (EUR) Unsecured Bonds (USD) 67 85 647 615 546 391 194 142 32 21 360 616 616 616 500 450 350 0 200 400 600 800 1,000 1,200 1,400 2018 2019 2020 2021 2022 2023 2024 2025 2026 2027 $ MM Year of Maturity Mortgage Debt, pro rata Unsecured Revolving Credit Facility Unsecured Bonds (EUR) Unsecured Bonds (USD)
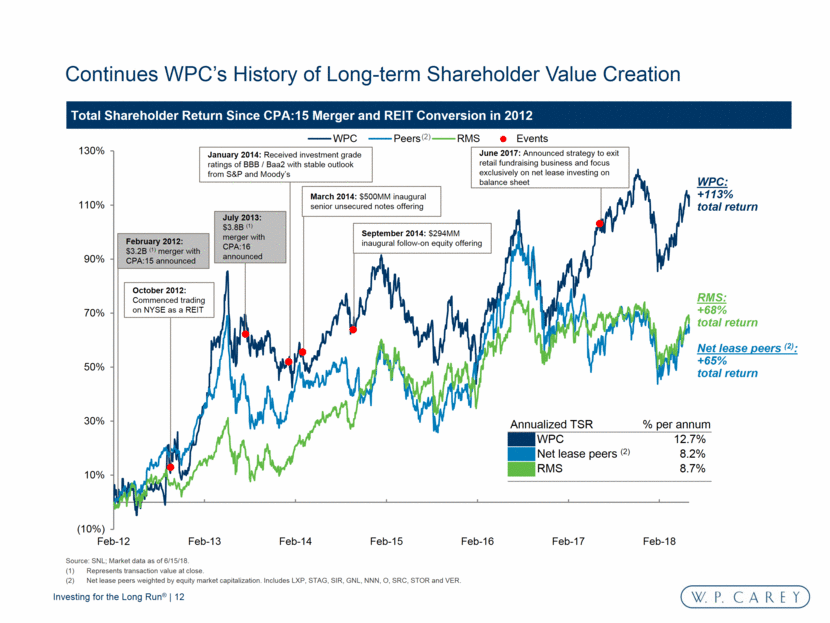
Continues WPC’s History of Long-term Shareholder Value Creation Total Shareholder Return Since CPA:15 Merger and REIT Conversion in 2012 Source: SNL; Market data as of 6/15/18. Represents transaction value at close. Net lease peers weighted by equity market capitalization. Includes LXP, STAG, SIR, GNL, NNN, O, SRC, STOR and VER. WPC: +113% total return RMS: +68% total return Net lease peers (2): +65% total return (2) June 2017: Announced strategy to exit retail fundraising business and focus exclusively on net lease investing on balance sheet July 2013: $3.8B (1) merger with CPA:16 announced September 2014: $294MM inaugural follow-on equity offering March 2014: $500MM inaugural senior unsecured notes offering January 2014: Received investment grade ratings of BBB / Baa2 with stable outlook from S&P and Moody’s October 2012: Commenced trading on NYSE as a REIT February 2012: $3.2B (1) merger with CPA:15 announced Annualized TSR % per annum WPC 12.7% Net lease peers (2) 8.2% RMS 8.7% (10%) 10% 30% 50% 70% 90% 110% 130% Feb-12 Feb-13 Feb-14 Feb-15 Feb-16 Feb-17 Feb-18 WPC Peers RMS Events
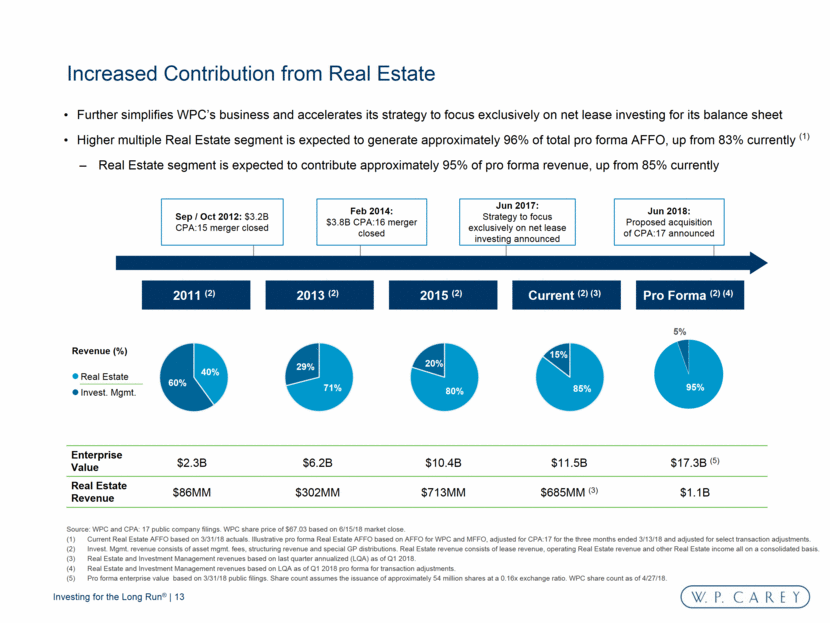
Further simplifies WPC’s business and accelerates its strategy to focus exclusively on net lease investing for its balance sheet Higher multiple Real Estate segment is expected to generate approximately 96% of total pro forma AFFO, up from 83% currently (1) Real Estate segment is expected to contribute approximately 95% of pro forma revenue, up from 85% currently Real Estate Invest. Mgmt. Revenue (%) Real Estate Revenue $86MM $2.3B Sep / Oct 2012: $3.2B CPA:15 merger closed $302MM $6.2B Feb 2014: $3.8B CPA:16 merger closed $713MM $10.4B Pro Forma (2) (4) 2011 (2) 2013 (2) 2015 (2) Current (2) (3) Jun 2017: Strategy to focus exclusively on net lease investing announced Jun 2018: Proposed acquisition of CPA:17 announced $1.1B $17.3B (5) $685MM (3) $11.5B Source: WPC and CPA: 17 public company filings. WPC share price of $67.03 based on 6/15/18 market close. Current Real Estate AFFO based on 3/31/18 actuals. Illustrative pro forma Real Estate AFFO based on AFFO for WPC and MFFO, adjusted for CPA:17 for the three months ended 3/13/18 and adjusted for select transaction adjustments. Invest. Mgmt. revenue consists of asset mgmt. fees, structuring revenue and special GP distributions. Real Estate revenue consists of lease revenue, operating Real Estate revenue and other Real Estate income all on a consolidated basis. Real Estate and Investment Management revenues based on last quarter annualized (LQA) as of Q1 2018. Real Estate and Investment Management revenues based on LQA as of Q1 2018 pro forma for transaction adjustments. Pro forma enterprise value based on 3/31/18 public filings. Share count assumes the issuance of approximately 54 million shares at a 0.16x exchange ratio. WPC share count as of 4/27/18. Enterprise Value Increased Contribution from Real Estate 95% 5% 40% 60% 71% 29% 80% 20% 85% 15%
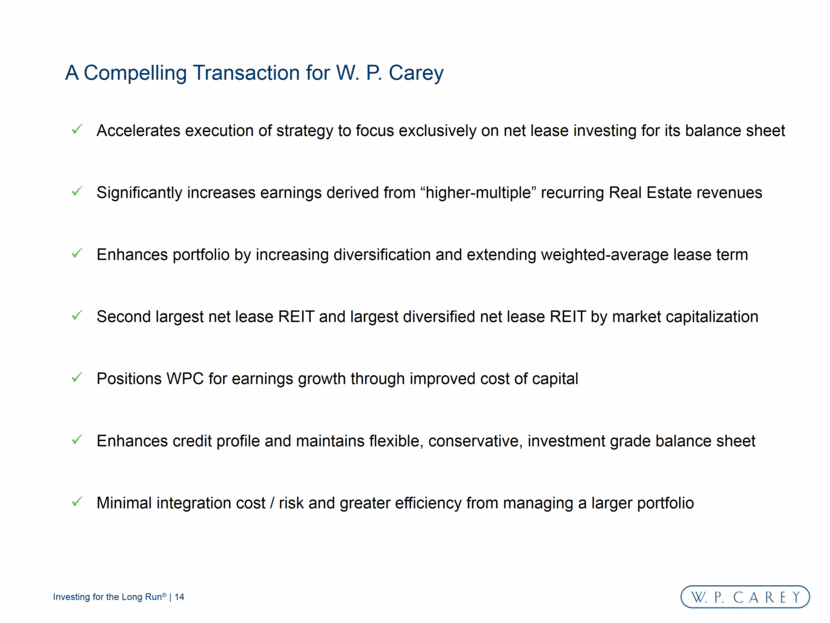
A Compelling Transaction for W. P. Carey Accelerates execution of strategy to focus exclusively on net lease investing for its balance sheet Significantly increases earnings derived from “higher-multiple” recurring Real Estate revenues Enhances portfolio by increasing diversification and extending weighted-average lease term Second largest net lease REIT and largest diversified net lease REIT by market capitalization Positions WPC for earnings growth through improved cost of capital Enhances credit profile and maintains flexible, conservative, investment grade balance sheet Minimal integration cost / risk and greater efficiency from managing a larger portfolio
Cautionary Statement Concerning Forward-Looking Statements Certain of the matters discussed in this communication constitute forward-looking statements within the meaning of the Securities Act of 1933 and the Securities Exchange Act of 1934, both as amended by the Private Securities Litigation Reform Act of 1995. The forward-looking statements include, among other things, statements regarding the intent, belief or expectations of W. P. Carey Inc. (“WPC”) and can be identified by the use of words such as “may,” “will,” “should,” “would,” “will be,” “will continue,” “will likely result,” “believe,” “project,” “expect,” “anticipate,” “intend,” “estimate” and other comparable terms. These forward-looking statements include, but are not limited to, statements regarding: our ability to close the proposed transaction; the impact of the proposed transaction on our earnings and on our credit profile; the strategic rational and transaction benefits; our ability to refinance mortgage debt with unsecured bonds; capital markets; our ability to sell shares under our “at-the-market” program and the use of proceeds from that program; tenant credit quality; the general economic outlook; our expected range of Adjusted funds from operations, or AFFO, including the impact on AFFO as a result of the proposed transaction; our corporate strategy; our capital structure; our portfolio lease terms; our international exposure and acquisition volume; our expectations about tenant bankruptcies and interest coverage; statements regarding estimated or future economic performance and results, including our underlying assumptions, occupancy rate, credit ratings, and possible new acquisitions and dispositions; the outlook for the investment programs that we manage, including their earnings, as well as possible liquidity events for those programs; statements that we make regarding our ability to remain qualified for taxation as a real estate investment trust, or REIT; the impact of recently issued accounting pronouncements, the Tax Cuts and Jobs Act in the United States adopted in 2017, and other regulatory activity, such as the General Data Protection Regulation in the European Union or other data privacy initiatives; the amount and timing of any future quarterly dividends; our existing or future leverage and debt service obligations; our estimated future growth; our projected assets under management; our future capital expenditure levels; our future financing transactions; and our plans to fund our future liquidity needs. These statements are based on the current expectations of our management. It is important to note that our actual results could be materially different from those projected in such forward-looking statements. There are a number of risks and uncertainties that could cause actual results to differ materially from these forward-looking statements. Other unknown or unpredictable factors could also have material adverse effects on our business, financial condition, liquidity, results of operations, AFFO, and prospects. You should exercise caution in relying on forward-looking statements as they involve known and unknown risks, uncertainties, and other factors that may materially affect our future results, performance, achievements, or transactions. Information on factors that could impact actual results and cause them to differ from what is anticipated in the forward-looking statements contained herein is included in our filings with the Securities and Exchange Commission, or the SEC from time to time, including, but not limited to those described in Item 1A. Risk Factors in our Annual Report on Form 10-K for the year ended December 31, 2017, as filed with the SEC on February 23, 2018. Moreover, because we operate in a very competitive and rapidly changing environment, new risks are likely to emerge from time to time. Given these risks and uncertainties, potential investors are cautioned not to place undue reliance on these forward-looking statements as a prediction of future results, which speak only as of the date of this presentation, unless noted otherwise. Except as required by federal securities laws and the rules and regulations of the SEC, we do not undertake to revise or update any forward-looking statements. All data presented herein is as of March 31, 2018 unless otherwise noted. Amounts may not sum to totals due to rounding. Past performance does not guarantee future results.
Additional Information and Where to Find it This presentation shall not constitute an offer to sell or the solicitation of an offer to buy any securities, nor shall there be any sale of securities in any jurisdiction in which such offer, solicitation or sale would be unlawful prior to registration or qualification under the securities laws of any such jurisdiction. No offering of securities shall be made except by means of a prospectus meeting the requirements of the federal securities laws. W. P. Carey intends to file a Registration Statement on Form S-4 and mail the Joint Proxy Statement/Prospectus and other relevant documents to its security holders in connection with the proposed Merger. WE URGE INVESTORS TO READ THE JOINT PROXY STATEMENT/PROSPECTUS AND ANY OTHER RELEVANT DOCUMENTS FILED BY W. P. CAREY AND CPA®:17 – GLOBAL IN CONNECTION WITH THE PROPOSED MERGER WHEN THEY BECOME AVAILABLE, BECAUSE THEY WILL CONTAIN IMPORTANT INFORMATION ABOUT W. P. CAREY, CPA®:17 – GLOBAL AND THE PROPOSED MERGER. INVESTORS ARE URGED TO READ THESE DOCUMENTS CAREFULLY AND IN THEIR ENTIRETY. Investors will be able to obtain these materials and other documents filed with the SEC free of charge at the SEC’s website (http://www.sec.gov). In addition, these materials will also be available free of charge by accessing W. P. Carey’s website (http://www.wpcarey.com) or by accessing CPA®:17 – Global’s website (http://www.cpa17global.com). Investors may also read and copy any reports, statements and other information filed by W. P. Carey or CPA®:17 – Global with the SEC, at the SEC public reference room at 100 F Street, N.E., Washington, D C. 20549. Please call the SEC at 1-800-SEC-0330 or visit the SEC’s website for further information on its public reference room. Participants in the Proxy Solicitation: Information regarding W. P. Carey’s directors and executive officers is available in its proxy statement filed with the SEC by W. P. Carey on April 03, 2018 in connection with its 2018 annual meeting of stockholders, and information regarding CPA®:17 – Global’s directors and executive officers is available in its proxy statement filed with the SEC by CPA®:17 – Global on April 20, 2018 in connection with its 2018 annual meeting of stockholders. Other information regarding the participants in the proxy solicitation and a description of their direct and indirect interests, by security holdings or otherwise, will be contained in the Joint Proxy Statement/Prospectus and other relevant materials filed with the SEC when they become available.
Disclosures The following non-GAAP financial measures are used in this presentation FFO and AFFO Due to certain unique operating characteristics of real estate companies, as discussed below, the National Association of Real Estate Investment Trusts, Inc., or NAREIT, an industry trade group, has promulgated a non-GAAP measure known as FFO, which we believe to be an appropriate supplemental measure, when used in addition to and in conjunction with results presented in accordance with GAAP, to reflect the operating performance of a REIT. The use of FFO is recommended by the REIT industry as a supplemental non-GAAP measure. FFO is not equivalent to nor a substitute for net income or loss as determined under GAAP. We define FFO, a non-GAAP measure, consistent with the standards established by the White Paper on FFO approved by the Board of Governors of NAREIT, as revised in February 2004. The White Paper defines FFO as net income or loss computed in accordance with GAAP, excluding gains or losses from sales of property, impairment charges on real estate and depreciation and amortization from real estate assets; and after adjustments for unconsolidated partnerships and jointly owned investments. Adjustments for unconsolidated partnerships and jointly owned investments are calculated to reflect FFO. Our FFO calculation complies with NAREIT’s policy described above. We modify the NAREIT computation of FFO to include other adjustments to GAAP net income to adjust for certain non-cash charges such as amortization of real estate-related intangibles, deferred income tax benefits and expenses, straight-line rents, stock-based compensation, non-cash environmental accretion expense and amortization of deferred financing costs. Our assessment of our operations is focused on long-term sustainability and not on such non-cash items, which may cause short-term fluctuations in net income but have no impact on cash flows. Additionally, we exclude non-core income and expenses such as certain lease termination income, gains or losses from extinguishment of debt, restructuring and related compensation expenses and merger and acquisition expenses. We also exclude realized and unrealized gains/losses on foreign exchange transactions (other than those realized on the settlement of foreign currency derivatives), which are not considered fundamental attributes of our business plan and do not affect our overall long-term operating performance. We refer to our modified definition of FFO as AFFO. We exclude these items from GAAP net income to arrive at AFFO as they are not the primary drivers in our decision-making process and excluding these items provides investors a view of our portfolio performance over time and makes it more comparable to other REITs which are currently not engaged in acquisitions, mergers and restructuring which are not part of our normal business operations. AFFO also reflects adjustments for unconsolidated partnerships and jointly owned investments. We use AFFO as one measure of our operating performance when we formulate corporate goals, evaluate the effectiveness of our strategies and determine executive compensation. We believe that AFFO is a useful supplemental measure for investors to consider as we believe it will help them to better assess the sustainability of our operating performance without the potentially distorting impact of these short-term fluctuations. However, there are limits on the usefulness of AFFO to investors. For example, impairment charges and unrealized foreign currency losses that we exclude may become actual realized losses upon the ultimate disposition of the properties in the form of lower cash proceeds or other considerations. We use our FFO and AFFO measures as supplemental financial measures of operating performance. We do not use our FFO and AFFO measures as, nor should they be considered to be, alternatives to net earnings computed under GAAP or as alternatives to cash from operating activities computed under GAAP or as indicators of our ability to fund our cash needs.
Disclosures (cont’d) The following non-GAAP financial measures are used in this presentation (cont’d) MFFO and MFFO, adjusted We define MFFO consistent with the IPA’s (formerly known as the Investment Program Association) Practice Guideline 2010-01, Supplemental Performance Measure for Publicly Registered, Non-Listed REITs: Modified Funds from Operations, or the Practice Guideline, issued by the IPA in November 2010. The Practice Guideline defines MFFO as FFO further adjusted for the following items, included in the determination of GAAP net income, as applicable: acquisition fees and expenses; amounts relating to deferred rent receivables and amortization of above- and below-market leases and liabilities (which are adjusted in order to reflect such payments from a GAAP accrual basis to a cash basis of disclosing the rent and lease payments); accretion of discounts and amortization of premiums on debt investments; nonrecurring impairments of real estate-related investments (i.e., infrequent or unusual, not reasonably likely to recur in the ordinary course of business); mark-to-market adjustments included in net income; nonrecurring gains or losses included in net income from the extinguishment or sale of debt, hedges, foreign exchange, derivatives, or securities holdings where trading of such holdings is not a fundamental attribute of the business plan, unrealized gains or losses resulting from consolidation from, or deconsolidation to, equity accounting, and after adjustments for consolidated and unconsolidated partnerships and jointly owned investments, with such adjustments calculated to reflect MFFO on the same basis. The accretion of discounts and amortization of premiums on debt investments, unrealized gains and losses on hedges, foreign exchange, derivatives or securities holdings, unrealized gains and losses resulting from consolidations, as well as other listed cash flow adjustments are adjustments made to net income in calculating the cash flows provided by operating activities and, in some cases, reflect gains or losses that are unrealized and may not ultimately be realized. In addition, our management uses Adjusted MFFO as another measure of sustainable operating performance. Adjusted MFFO adjusts MFFO for deferred income tax expenses and benefits, which are non-cash items that may cause short-term fluctuations in net income but have no impact on current period cash flows. Additionally, we adjust MFFO to reflect the realized gains/losses on the settlement of foreign currency derivatives to arrive at Adjusted MFFO. Foreign currency derivatives are a fundamental part of our operations in that they help us manage the foreign currency exposure we have associated with cash flows from our international investments.
Disclosures (cont’d) The following non-GAAP financial measures are used in this presentation (cont’d) EBITDA and Adjusted EBITDA We believe that EBITDA is a useful supplemental measure to investors and analysts for assessing the performance of our business segments because (i) it removes the impact of our capital structure from our operating results and (ii) because it is helpful when comparing our operating performance to that of companies in our industry without regard to such items, which can vary substantially from company to company. Adjusted EBITDA as disclosed represents EBITDA, modified to include other adjustments to GAAP net income for certain non-cash charges, such as impairments, non-cash rent adjustments and unrealized gains and losses from our hedging activity. Additionally, we exclude gains and losses on sale of real estate, which are not considered fundamental attributes of our business plans and do not affect our overall long-term operating performance. We exclude these items from adjusted EBITDA as they are not the primary drivers in our decision-making process. Adjusted EBITDA reflects adjustments for unconsolidated partnerships and jointly owned investments. Our assessment of our operations is focused on long-term sustainability and not on such non-cash and non-core items, which may cause short-term fluctuations in net income but have no impact on cash flows. We believe that adjusted EBITDA is a useful supplemental measure to investors and analysts, although it does not represent net income that is computed in accordance with GAAP. Accordingly, adjusted EBITDA should not be considered as an alternative to net income or as an indicator of our financial performance. EBITDA and adjusted EBITDA as calculated by us may not be comparable to similarly titled measures of other companies. Pro Rata Metrics This presentation contains certain metrics prepared under the pro rata consolidation method. We refer to these metrics as pro rata metrics. We have a number of investments, usually with our affiliates, in which our economic ownership is less than 100%. Under the full consolidation method, we report 100% of the assets, liabilities, revenues and expenses of those investments that are deemed to be under our control or for which we are deemed to be the primary beneficiary, even if our ownership is less than 100%. Also, for all other jointly owned investments, which we do not control, we report our net investment and our net income or loss from that investment. Under the pro rata consolidation method, we present our proportionate share, based on our economic ownership of these jointly owned investments, of the assets, liabilities, revenues and expenses of those investments. Multiplying each of our jointly owned investments’ financial statement line items by our percentage ownership and adding or subtracting those amounts from our totals, as applicable, may not accurately depict the legal and economic implications of holding an ownership interest of less than 100% in our jointly owned investments. ABR ABR represents contractual minimum annualized base rent for our net-leased properties, net of receivable reserves as determined by GAAP, and reflects exchange rates as of March 31, 2018. If there is a rent abatement, we annualize the first monthly contractual base rent following the free rent period. ABR is not applicable to operating properties and is presented on a pro rata basis.
