Attached files
| file | filename |
|---|---|
| EX-32 - EXHIBIT 32 - J M SMUCKER Co | sjm43018-10kex32.htm |
| EX-31.2 - EXHIBIT 31.2 - J M SMUCKER Co | sjm43018-10kex312.htm |
| EX-31.1 - EXHIBIT 31.1 - J M SMUCKER Co | sjm43018-10kex311.htm |
| EX-24 - EXHIBIT 24 - J M SMUCKER Co | sjm43018-10kex24.htm |
| EX-23 - EXHIBIT 23 - J M SMUCKER Co | sjm43018-10kex23.htm |
| EX-21 - EXHIBIT 21 - J M SMUCKER Co | sjm43018-10kex21.htm |
| EX-12.1 - EXHIBIT 12.1 - J M SMUCKER Co | sjm43018-10kex121.htm |
| EX-10.30 - EXHIBIT 10.30 - J M SMUCKER Co | sjm43018-10kex1030.htm |
| EX-2.2 - EXHIBIT 2.2 - J M SMUCKER Co | sjm43018-10kex22.htm |
| 10-K - 10-K - J M SMUCKER Co | sjm43018-10xk.htm |


2018 FINANCIAL REVIEW
The J. M. Smucker Company
FIVE-YEAR SUMMARY OF SELECTED FINANCIAL DATA
The following table presents selected financial data for each of the five years in the period ended April 30, 2018. The selected financial data should be read in conjunction with the “Results of Operations” and “Liquidity and Capital Resources” sections of “Management’s Discussion and Analysis” and the consolidated financial statements and notes thereto.
Year Ended April 30, | ||||||||||||||||||||||||||
(Dollars and shares in millions, except per share data) | 2018 | 2017 | 2016 | 2015 | 2014 | |||||||||||||||||||||
Statements of Income: | ||||||||||||||||||||||||||
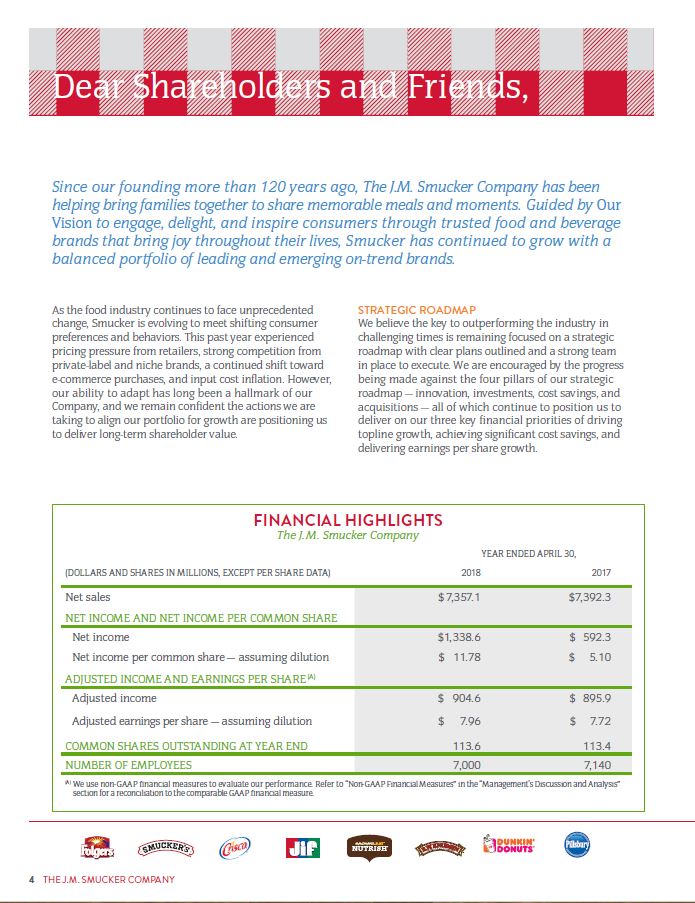
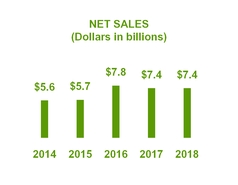
Net sales | $ | 7,357.1 | $ | 7,392.3 | $ | 7,811.2 | $ | 5,692.7 | $ | 5,610.6 | ||||||||||||||||
Gross profit | $ | 2,836.1 | $ | 2,835.3 | $ | 2,967.8 | $ | 1,968.7 | $ | 2,031.0 | ||||||||||||||||
% of net sales | 38.5 | % | 38.4 | % | 38.0 | % | 34.6 | % | 36.2 | % | ||||||||||||||||
Operating income | $ | 1,036.1 | $ | 1,031.5 | $ | 1,145.3 | $ | 772.0 | $ | 919.0 | ||||||||||||||||
% of net sales | 14.1 | % | 14.0 | % | 14.7 | % | 13.6 | % | 16.4 | % | ||||||||||||||||
Net income | $ | 1,338.6 | $ | 592.3 | $ | 688.7 | $ | 344.9 | $ | 565.2 | ||||||||||||||||
Financial Position: | ||||||||||||||||||||||||||
Cash and cash equivalents | $ | 192.6 | $ | 166.8 | $ | 109.8 | $ | 125.6 | $ | 153.5 | ||||||||||||||||
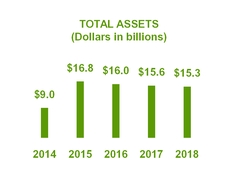
Total assets | 15,301.2 | 15,639.7 | 15,984.1 | 16,806.3 | 9,041.4 | |||||||||||||||||||||
Total debt | 4,832.0 | 5,398.5 | 5,430.0 | 6,170.9 | 2,216.3 | |||||||||||||||||||||
Total shareholders’ equity | 7,891.1 | 6,850.2 | 7,008.5 | 7,086.9 | 5,029.6 | |||||||||||||||||||||
Liquidity: | ||||||||||||||||||||||||||
Net cash provided by operating activities | $ | 1,218.0 | $ | 1,059.0 | $ | 1,461.0 | $ | 739.1 | $ | 863.3 | ||||||||||||||||
Additions to property, plant, and equipment | 321.9 | 192.4 | 201.4 | 247.7 | 279.5 | |||||||||||||||||||||
Free cash flow (A) | 896.1 | 866.6 | 1,259.6 | 491.4 | 583.8 | |||||||||||||||||||||
Quarterly dividends paid | 350.3 | 339.3 | 316.6 | 254.0 | 238.0 | |||||||||||||||||||||
Purchase of treasury shares | 7.0 | 437.6 | 441.1 | 24.3 | 508.5 | |||||||||||||||||||||
EBITDA (as adjusted) (A) | 1,625.1 | 1,593.7 | 1,579.1 | 871.3 | 1,185.5 | |||||||||||||||||||||
Share Data: | ||||||||||||||||||||||||||
Weighted-average shares outstanding | 113.6 | 116.0 | 119.4 | 103.7 | 104.3 | |||||||||||||||||||||
Weighted-average shares outstanding – assuming dilution | 113.6 | 116.1 | 119.5 | 103.7 | 104.3 | |||||||||||||||||||||
Dividends declared per common share | $ | 3.12 | $ | 3.00 | $ | 2.68 | $ | 2.56 | $ | 2.32 | ||||||||||||||||
Earnings per Common Share: | ||||||||||||||||||||||||||
Net income | $ | 11.79 | $ | 5.11 | $ | 5.77 | $ | 3.33 | $ | 5.42 | ||||||||||||||||
Net income – assuming dilution | 11.78 | 5.10 | 5.76 | 3.33 | 5.42 | |||||||||||||||||||||
Other Non-GAAP Measures: (A) | ||||||||||||||||||||||||||
Adjusted gross profit | $ | 2,802.7 | $ | 2,868.2 | $ | 2,968.0 | $ | 1,999.4 | $ | 2,035.1 | ||||||||||||||||
% of net sales | 38.1 | % | 38.8 | % | 38.0 | % | 35.1 | % | 36.3 | % | ||||||||||||||||
Adjusted operating income | $ | 1,431.8 | $ | 1,481.8 | $ | 1,489.8 | $ | 970.2 | $ | 1,047.6 | ||||||||||||||||
% of net sales | 19.5 | % | 20.0 | % | 19.1 | % | 17.0 | % | 18.7 | % | ||||||||||||||||
Adjusted income and earnings per share: | ||||||||||||||||||||||||||
Adjusted income | $ | 904.6 | $ | 895.9 | $ | 931.3 | $ | 475.6 | $ | 650.8 | ||||||||||||||||
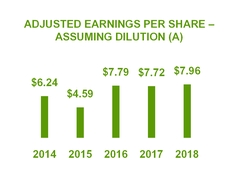
Adjusted earnings per share – assuming dilution | $ | 7.96 | $ | 7.72 | $ | 7.79 | $ | 4.59 | $ | 6.24 | ||||||||||||||||
(A) | We use non-GAAP financial measures to evaluate our performance. Refer to “Non-GAAP Financial Measures” in the “Management’s Discussion and Analysis” section for a reconciliation to the comparable GAAP financial measure. |
2018 ANNUAL REPORT 27
SUMMARY OF QUARTERLY RESULTS OF OPERATIONS
The J. M. Smucker Company
The following is a summary of unaudited quarterly results of operations for the years ended April 30, 2018 and 2017.
(Dollars in millions, except per share data) | Quarter Ended | Net Sales | Gross Profit | Net Income | Net Income per Common Share | Net Income per Common Share – Assuming Dilution | |||||||||||||||
2018 | July 31, 2017 | $ | 1,748.9 | $ | 662.1 | $ | 126.8 | $ | 1.12 | $ | 1.12 | ||||||||||
October 31, 2017 | 1,923.6 | 755.0 | 194.6 | 1.71 | 1.71 | ||||||||||||||||
January 31, 2018 | 1,903.3 | 728.5 | 831.3 | 7.32 | 7.32 | ||||||||||||||||
April 30, 2018 | 1,781.3 | 690.5 | 185.9 | 1.64 | 1.64 | ||||||||||||||||
2017 | July 31, 2016 | $ | 1,815.8 | $ | 722.7 | $ | 170.0 | $ | 1.46 | $ | 1.46 | ||||||||||
October 31, 2016 | 1,913.9 | 742.9 | 177.3 | 1.52 | 1.52 | ||||||||||||||||
January 31, 2017 | 1,878.8 | 722.9 | 134.6 | 1.16 | 1.16 | ||||||||||||||||
April 30, 2017 | 1,783.8 | 646.8 | 110.4 | 0.96 | 0.96 | ||||||||||||||||
Annual net income per common share may not equal the sum of the individual quarters due to differences in the average number of shares outstanding during the respective periods, primarily due to share repurchases.
STOCK PRICE DATA
Our common shares are listed on the New York Stock Exchange – ticker symbol SJM. The table below presents the high and low market prices for the shares and the quarterly dividends declared. There were approximately 319,849 shareholders of record as of June 12, 2018,
of which approximately 39,362 were registered holders of common shares.
Quarter Ended | High | Low | Dividends | ||||||||||
2018 | July 31, 2017 | $ | 134.12 | $ | 114.31 | $ | 0.78 | ||||||
October 31, 2017 | 123.83 | 101.82 | 0.78 | ||||||||||
January 31, 2018 | 132.76 | 99.57 | 0.78 | ||||||||||
April 30, 2018 | 133.38 | 113.16 | 0.78 | ||||||||||
2017 | July 31, 2016 | $ | 154.97 | $ | 125.67 | $ | 0.75 | ||||||
October 31, 2016 | 157.31 | 128.75 | 0.75 | ||||||||||
January 31, 2017 | 136.13 | 122.05 | 0.75 | ||||||||||
April 30, 2017 | 143.68 | 125.77 | 0.75 | ||||||||||
28 THE J. M. SMUCKER COMPANY
COMPARISON OF FIVE-YEAR CUMULATIVE TOTAL SHAREHOLDER RETURN
The J. M. Smucker Company
April 30, | |||||||||||||||||||||||
2013 | 2014 | 2015 | 2016 | 2017 | 2018 | ||||||||||||||||||
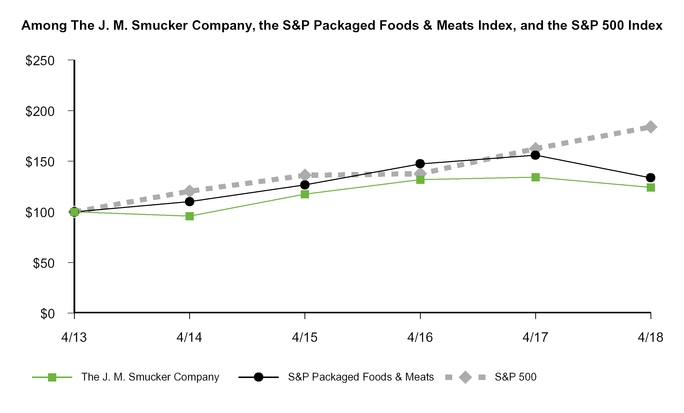
The J. M. Smucker Company | $ | 100.00 | $ | 95.71 | $ | 117.56 | $ | 131.72 | $ | 134.25 | $ | 124.10 | |||||||||||
S&P Packaged Foods & Meats | 100.00 | 110.04 | 126.53 | 147.44 | 155.95 | 133.61 | |||||||||||||||||
S&P 500 | 100.00 | 120.44 | 136.07 | 137.71 | 162.39 | 183.93 | |||||||||||||||||
The above graph compares the cumulative total shareholder return for the five years ended April 30, 2018, for our common shares, the S&P Packaged Foods & Meats Index, and the S&P 500 Index. These figures assume all dividends are reinvested when received and are based on $100 invested in our common shares and the referenced index funds on April 30, 2013.
Copyright © 2018 Standard & Poor’s, a division of S&P Global. All rights reserved.
www.researchdatagroup.com/standards-poors/
2018 ANNUAL REPORT 29
MANAGEMENT’S DISCUSSION AND ANALYSIS
The J. M. Smucker Company
(Dollars and shares in millions, unless otherwise noted, except per share data)
COMPANY BACKGROUND
For more than 120 years, The J. M. Smucker Company (“Company,” “we,” “us,” or “our”) headquartered in Orrville, Ohio, has brought families together to share memorable meals and moments. Guided by a vision to engage, delight, and inspire consumers through trusted food and beverage brands that bring joy throughout their lives, the Company has grown to be a well-respected North American marketer and manufacturer with a balanced portfolio of leading and emerging, on-trend brands. In consumer foods and beverages, our brands include Smucker’s®, Folgers®, Jif ®, Dunkin’ Donuts®, Crisco®, Café Bustelo®,
R.W. Knudsen Family®, Sahale Snacks®, Smucker’s Uncrustables®, Robin Hood®, and Bick’s®. In pet food and pet snacks, our brands include Rachael Ray® Nutrish®, Meow Mix®, Milk-Bone®,
Kibbles ’n Bits®, Natural Balance®, and Nature’s Recipe®.
We have four reportable segments: U.S. Retail Coffee, U.S. Retail Consumer Foods, U.S. Retail Pet Foods, and International and Away From Home. The U.S. retail market segments in total comprised approximately 85 percent of net sales in 2018 and represent a major portion of our strategic focus – the sale of branded food and beverage products with leadership positions to consumers through retail outlets in North America. In the U.S. retail market segments, our products are sold primarily to food retailers, food wholesalers, club stores, pet specialty stores, discount and dollar stores, drug stores, military commissaries, mass merchandisers, natural foods stores and distributors, and online retailers. The products included in the International and Away From Home segment are distributed domestically and in foreign countries through retail channels and foodservice distributors and operators (e.g., restaurants, lodging, schools and universities, health care operators).
STRATEGIC OVERVIEW
We remain rooted in our Basic Beliefs of Quality, People, Ethics, Growth, and Independence established by our founder and namesake, Jerome Smucker, more than a century ago. Today, these Basic Beliefs are the core of our unique corporate culture and serve as a foundation for decision-making and actions. We have been led by five generations of family leadership, having had only six chief executive officers in 121 years. This continuity of management and thought extends to the broader leadership team that embodies the values and embraces the business practices that have contributed to our consistent growth.
Our strategic vision is to own and market a portfolio of food and beverage brands that combines number one and leading brands with emerging, on-trend brands to drive balanced, long-term growth, primarily in North America.
Our strategic long-term growth objectives are to increase net sales by 3 percent and earnings per share, measured on a non-GAAP
basis, by 8 percent annually on average. We expect organic growth,
including new products, to drive much of our top-line growth,
while the contribution from acquisitions will vary from year
to year.
Net sales has increased at a compound annual growth rate of
5 percent over the past five years, driven by the acquisition of
Big Heart Pet Brands (“Big Heart”) in 2015, while income per diluted share excluding non-GAAP adjustments (“adjusted earnings per share”) has increased at a rate of 6 percent over the same period. Our non-GAAP adjustments include amortization expense and impairment charges related to intangible assets, integration and restructuring costs, unallocated gains and losses on commodity and foreign currency exchange derivatives, and, beginning in 2018, certain one-time tax adjustments. Refer to “Non-GAAP Financial Measures” in this discussion and analysis for further information.
During the fourth quarter of 2018, we announced a definitive agreement to acquire the stock of Ainsworth Pet Nutrition, LLC (“Ainsworth”). On May 14, 2018, we completed the all-cash transaction, which was funded by debt and valued at $1.9 billion. Ainsworth is a leading producer, distributor, and marketer of premium pet food and pet snacks, predominantly within the U.S. Approximately two-thirds of Ainsworth’s sales are generated by its Rachael Ray Nutrish brand, which is driving significant growth in the premium pet food category. We anticipate the acquired business to contribute net sales of approximately $800.0 in 2019. Annual cost synergies of approximately $55.0 are expected to be fully realized within three years after the closing, with approximately $25.0 anticipated in 2019.
Net cash provided by operating activities has increased at a compound annual growth rate of 7 percent over the past five years. Our cash deployment strategy is to balance reinvesting in our business through acquisitions and capital expenditures with returning cash to our shareholders through the payment of dividends and share repurchases. Our strategy also includes a significant focus on debt repayment as a result of the additional debt we incurred to finance the Ainsworth acquisition subsequent to year-end.
RESULTS OF OPERATIONS
All comparisons presented in this discussion and analysis are to the corresponding period of the prior year, unless otherwise noted. On December 31, 2015, we sold our U.S. canned milk brands and operations to Eagle Family Foods Group LLC, a subsidiary of
funds affiliated with Kelso & Company. The transaction included
canned milk products that were primarily sold in U.S. retail and
foodservice channels with annual net sales of approximately $200.0. The operating results for this business were primarily included in the U.S. Retail Consumer Foods segment prior to the sale. We received proceeds from the divestiture of $193.7, which were net of transaction costs and a working capital adjustment, and recognized a pre-tax gain of $25.3.
30 THE J. M. SMUCKER COMPANY
MANAGEMENT’S DISCUSSION AND ANALYSIS
The J. M. Smucker Company
Year Ended April 30, | ||||||||||||||||||||||
2018 | 2017 | 2016 | 2018 % Increase (Decrease) | 2017 % Increase (Decrease) | ||||||||||||||||||
Net sales | $ | 7,357.1 | $ | 7,392.3 | $ | 7,811.2 | — | % | (5 | )% | ||||||||||||
Gross profit | $ | 2,836.1 | $ | 2,835.3 | $ | 2,967.8 | — | (4 | ) | |||||||||||||
% of net sales | 38.5 | % | 38.4 | % | 38.0 | % | ||||||||||||||||
Operating income | $ | 1,036.1 | $ | 1,031.5 | $ | 1,145.3 | — | (10 | ) | |||||||||||||
% of net sales | 14.1 | % | 14.0 | % | 14.7 | % | ||||||||||||||||
Net income: | ||||||||||||||||||||||
Net income | $ | 1,338.6 | $ | 592.3 | $ | 688.7 | 126 | (14 | ) | |||||||||||||
Net income per common share – assuming dilution | $ | 11.78 | $ | 5.10 | $ | 5.76 | 131 | (11 | ) | |||||||||||||
Adjusted gross profit (A) | $ | 2,802.7 | $ | 2,868.2 | $ | 2,968.0 | (2 | ) | (3 | ) | ||||||||||||
% of net sales | 38.1 | % | 38.8 | % | 38.0 | % | ||||||||||||||||
Adjusted operating income (A) | $ | 1,431.8 | $ | 1,481.8 | $ | 1,489.8 | (3 | ) | (1 | ) | ||||||||||||
% of net sales | 19.5 | % | 20.0 | % | 19.1 | % | ||||||||||||||||
Adjusted income: (A) | ||||||||||||||||||||||
Income | $ | 904.6 | $ | 895.9 | $ | 931.3 | 1 | (4 | ) | |||||||||||||
Earnings per share – assuming dilution | $ | 7.96 | $ | 7.72 | $ | 7.79 | 3 | (1 | ) | |||||||||||||
(A) | We use non-GAAP financial measures to evaluate our performance. Refer to “Non-GAAP Financial Measures” in this discussion and analysis for a reconciliation to the comparable GAAP financial measure. |
Summary of 2018
Net sales were flat in 2018, reflecting declines within the U.S. Retail Consumer Foods and U.S. Retail Coffee segments, offset by gains in the U.S. Retail Pet Food and International and Away From Home segments. The overall net sales change was driven by unfavorable volume/mix, which was mostly offset by the impacts of higher net price realization and favorable foreign currency exchange in the current year. Operating income was flat, as lower special project costs and selling, distribution, and administrative (“SD&A”) expenses were mostly offset by a $43.7 increase in noncash impairment charges related to intangible assets. Net income per diluted share increased $6.68, reflecting a provisional nonrecurring income tax benefit of $765.8 related to U.S. tax reform legislation, which was enacted during the third quarter of 2018, and a decrease in weighted-average common shares outstanding as a result of our share repurchase activities during the fourth quarter of 2017.
Operating income excluding non-GAAP adjustments (“adjusted operating income”) decreased 3 percent in 2018. Adjusted earnings per share increased 3 percent, with the primary differences from the change in GAAP results being the exclusion of the impacts of our one-time tax adjustments, a favorable change in the impact of unallocated derivative gains and losses as compared to the prior year, and lower special project costs. The impairment charges in 2018 and 2017 were also excluded from our non-GAAP results.
Summary of 2017
Net sales decreased 5 percent in 2017, driven by the non-comparable impact from the U.S. canned milk business, which
was divested during the third quarter of 2016, as well as lower net
price realization and unfavorable volume/mix in 2017. Operating
income decreased 10 percent, primarily due to the impact of noncash impairment charges of $133.2 recognized during 2017 and the net sales decline. Additionally, 2016 results benefited from the recognition of a $25.3 pre-tax gain on the divestiture of the U.S. canned milk business and the related profits prior to the divestiture. SD&A expenses and Big Heart integration costs were lower in 2017 as compared to 2016. Net income per diluted share decreased
11 percent in 2017 and reflects the benefit of a decrease in weighted-average common shares outstanding as a result of our share repurchase activities during the fourth quarters of 2017 and 2016. However, this benefit was more than offset by the impact of an increase in the effective tax rate in 2017 as compared to the prior year.
Adjusted operating income and adjusted earnings per share both decreased 1 percent in 2017 and excluded the impact of the impairment charges and the reduction in integration costs.
Net Sales
2018 Compared to 2017
Net sales were flat in 2018, reflecting a 1 percentage point impact from unfavorable volume/mix, which was offset by the impact of higher net pricing and favorable foreign currency exchange. The unfavorable volume/mix was driven by declines in the oils and baking categories, which were partially offset by gains in pet food. Net price realization contributed 1 percentage point to net sales, as higher net pricing for peanut butter, the Smucker’s brand, and oils was partially offset by lower net pricing for pet food and pet snacks.
2018 ANNUAL REPORT 31
MANAGEMENT’S DISCUSSION AND ANALYSIS
The J. M. Smucker Company
2017 Compared to 2016
Year Ended April 30, | ||||||||||||||
2017 | 2016 | Increase (Decrease) | % | |||||||||||
Net sales | $ | 7,392.3 | $ | 7,811.2 | $ | (418.9 | ) | (5 | )% | |||||
Divestiture | — | (153.5 | ) | 153.5 | 2 | |||||||||
Foreign currency exchange | 3.8 | — | 3.8 | — | ||||||||||
Net sales excluding divestiture and foreign currency exchange (A) | $ | 7,396.1 | $ | 7,657.7 | $ | (261.6 | ) | (3 | )% | |||||
Amounts may not add due to rounding.
(A) | Net sales excluding divestiture and foreign currency exchange is a non-GAAP measure used to evaluate performance internally. This measure provides useful information to investors because it enables comparison of results on a year-over-year basis. Net sales excluding divestiture and foreign currency exchange in the table above excludes the impact of the U.S. canned milk business, which was divested on December 31, 2015, and foreign currency exchange. |
Net sales decreased $418.9, or 5 percent, in 2017, partially due to the impact of the divested U.S. canned milk business. Excluding the non-comparable divested business and foreign currency exchange, net sales decreased 3 percent, driven by the U.S. Retail Coffee segment, specifically the Folgers brand, and the U.S. Retail Pet Foods segment. The decline reflected lower net price realization and unfavorable volume/mix, which contributed somewhat equally to lower net sales.
Operating Income
The following table presents the components of operating income as a percentage of net sales.
Year Ended April 30, | ||||||||
2018 | 2017 | 2016 | ||||||
Gross profit | 38.5 | % | 38.4 | % | 38.0 | % | ||
Selling, distribution, and administrative expenses: | ||||||||
Marketing | 3.2 | % | 3.4 | % | 3.5 | % | ||
Advertising | 2.6 | 2.3 | 2.2 | |||||
Selling | 3.3 | 3.4 | 4.0 | |||||
Distribution | 3.2 | 3.3 | 2.9 | |||||
General and administrative | 6.3 | 6.5 | 6.7 | |||||
Total selling, distribution, and administrative expenses | 18.6 | % | 18.8 | % | 19.3 | % | ||
Amortization | 2.8 | 2.8 | 2.7 | |||||
Goodwill impairment charge | 2.0 | — | — | |||||
Other intangible assets impairment charges | 0.4 | 1.8 | — | |||||
Other special project costs | 0.6 | 1.0 | 1.7 | |||||
Other operating expense (income) – net | — | (0.1 | ) | (0.4 | ) | |||
Operating income | 14.1 | % | 14.0 | % | 14.7 | % | ||
Amounts may not add due to rounding.
2018 Compared to 2017
Gross profit was flat in 2018, as the impact of unfavorable volume/mix was offset by the favorable impact of higher pricing and slightly lower costs. Gross profit excluding non-GAAP adjustments (“adjusted gross profit”) decreased $65.5, or 2 percent, with the primary difference from the change in GAAP results being the exclusion of a $64.5 favorable change in the impact of unallocated derivative gains and losses as compared to the prior year.
SD&A expenses decreased $19.9, or 1 percent, primarily due to the benefits from our cost savings initiatives and lower selling expense, which more than offset an increase in advertising expense, driven by the U.S. Retail Pet Foods segment. Special project costs decreased $33.3, primarily due to a reduction in
Big Heart integration costs.
Operating income was flat, reflecting a $43.7 increase in noncash impairment charges, driven by the U.S. Retail Pet Foods segment. Adjusted operating income decreased $50.0, or 3 percent. The primary differences from the change in GAAP results were the exclusion of the favorable change in the impact of unallocated derivative gains and losses as compared to the prior year and the impacts of impairment charges and special project costs.
2017 Compared to 2016
Gross profit decreased $132.5, or 4 percent, in 2017, primarily reflecting unfavorable volume/mix and the loss of U.S. canned milk profits. The impact of lower net price realization was offset by a reduction in commodity and manufacturing overhead costs and incremental synergy realization related to the Big Heart acquisition. Adjusted gross profit decreased $99.8, or 3 percent, and excluded a $39.2 unfavorable change in the impact of unallocated derivative gains and losses as compared to 2016.
SD&A expenses decreased $119.6, or 8 percent, primarily driven by incremental synergy realization. Additionally, Big Heart integration costs decreased by $81.1, or 56 percent.
Operating income decreased $113.8, or 10 percent, reflecting noncash impairment charges of $133.2 related to certain indefinite-lived trademarks, primarily within the U.S. Retail Pet Foods segment. Additionally, 2016 results benefited from the recognition of the $25.3 gain related to the divestiture of the U.S. canned milk business. Adjusted operating income decreased $8.0, or 1 percent, with the primary differences from GAAP results being the exclusion of the impairment charges, integration costs, and the unfavorable change in the impact of unallocated derivative gains and losses as compared to 2016.
Interest Expense and Other Income
2018 Compared to 2017
Net interest expense increased $11.0 in 2018, primarily due to financing fees we incurred in 2018 in connection with the Ainsworth acquisition. For additional information, see Note 8: Debt and Financing Arrangements.
32 THE J. M. SMUCKER COMPANY
MANAGEMENT’S DISCUSSION AND ANALYSIS
The J. M. Smucker Company
An $11.0 unfavorable change in net other income (expense) was primarily due to an increase in foreign currency exchange loss in 2018 and a favorable legal settlement in 2017.
2017 Compared to 2016
Net interest expense decreased $8.0 in 2017, primarily due to a lower outstanding balance on the $1.8 billion term loan due
March 23, 2020, in 2017 as compared to 2016.
Income Taxes
On December 22, 2017, the U.S. government enacted “An Act to Provide for Reconciliation Pursuant to Titles II and V of the Concurrent Resolution on the Budget for Fiscal Year 2018”
(the “Act”), which reduces the U.S. federal statutory corporate tax rate from 35.0 percent to 21.0 percent effective January 1, 2018, broadens the U.S. federal income tax base, requires companies to pay a one-time repatriation tax on earnings of certain foreign subsidiaries that were previously tax deferred (“transition tax”), and creates new taxes on certain foreign-sourced earnings. Having an April 30 fiscal year-end, the lower corporate income tax rate is administratively phased in, resulting in a blended U.S. federal statutory tax rate of approximately 30.4 percent for our fiscal year ended April 30, 2018.
The U.S. Securities and Exchange Commission (“SEC”) and Financial Accounting Standards Board (“FASB”) have issued rules to allow a measurement period of up to 12 months following the enactment of the Act for registrants to finalize their accounting for the related income tax effects. The income tax benefit of $477.6 for 2018 reflects a provisional net benefit of $765.8 related to our one-time adjustments resulting directly from the Act, partially offset by additional income tax expense related to the Pet Foods reporting unit goodwill impairment charge. Income tax expense was $286.1 for 2017. Within our calculations of the income tax effects of the Act, we used assumptions and estimates that may change as a result of future guidance and interpretation from the Internal Revenue Service (“IRS”), the SEC, the FASB, and various taxing jurisdictions. All of these potential legislative and interpretive actions could result in adjustments to any of the provisional estimates when the accounting for the income tax effects of the Act is completed, which we expect to be no later than the third quarter of 2019. For further information on the Act’s impact on our consolidated financial statements, refer to Note 13: Income Taxes.
We anticipate that the effective tax rate in 2019 and in future years will be favorably impacted by the lower federal statutory corporate
tax rate of 21.0 percent, offset to some extent by the base broadening changes, such as the elimination of the domestic manufacturing deduction. Furthermore, U.S. state jurisdictions have started, and are expected to continue, taking legislative actions to conform or decouple from the Act, either in its entirety or with respect to specific provisions. We are also evaluating the impact of the Ainsworth acquisition on our future consolidated effective tax rate.
Income taxes decreased 1 percent in 2017, due to a decrease in income before income taxes, mostly offset by the impact of a higher effective tax rate in 2017 of 32.6 percent. The 2016
effective tax rate of 29.6 percent was impacted by the recognition of a $50.5 noncash deferred tax benefit related to the integration of Big Heart into the Company, partially offset by the impact of higher deferred state income tax expense, which was a result of state tax law changes.
Integration Activities
We incurred total cumulative costs of $271.9 related to the integration of Big Heart, including $26.6 during 2018, which primarily consisted of employee-related costs, outside service and consulting costs, and other costs related to the acquisition. We have fully realized our goal of $200.0 in annual synergies.
We expect to incur approximately $50.0 in one-time costs related to the Ainsworth acquisition, of which the majority are expected to be cash charges. Approximately two-thirds of these one-time costs are expected to be recognized in 2019.
Restructuring Activities
An organization optimization program was approved by the Board of Directors (the “Board”) during the fourth quarter of 2016. Under this program, we identified opportunities to reduce costs and optimize the organization. Related projects include an organizational redesign and the optimization of our manufacturing footprint. In addition, the program was recently expanded to include the restructuring of our geographic footprint, which includes the centralization of our pet food and pet snacks business, as well as certain International non-manufacturing functions, to our corporate headquarters in Orrville, Ohio, furthering collaboration and enhanced agility, while improving cost efficiency. As a result, we plan to close the San Francisco and Burbank, California, offices by the end of 2019, and our international offices in China and Mexico during the first half of 2019. The majority of these costs are expected to be incurred through the end of 2019.
During 2017, we exited two leased facilities in Livermore, California, and consolidated all ancient grains and pasta production into our facility in Chico, California. During 2018, we consolidated all of our coffee produced at our Harahan, Louisiana, facility into one of our facilities in New Orleans, Louisiana, and this portion of the optimization program is nearly complete. To date, the organization optimization program has resulted in total headcount reductions of approximately 275 full-time positions. We do not anticipate significant headcount reductions associated with the expansion of the program.
Upon completion of this program, total restructuring costs are expected to be approximately $75.0, of which the majority represents employee-related costs, while the remainder primarily consists of site preparation, equipment relocation, and production start-up costs at the impacted facilities. We have incurred total cumulative restructuring costs of $42.6, of which $22.7 was incurred during 2018. We achieved approximately $50.0 of annual cost reductions related to our organization optimization program, mainly during 2018, and have invested these savings in our businesses. For further information, refer to Note 3: Integration and Restructuring Costs.
2018 ANNUAL REPORT 33
MANAGEMENT’S DISCUSSION AND ANALYSIS
The J. M. Smucker Company
Cost Management Program
In addition to our organization optimization program, we announced a separate cost management program during 2017, which is comprised of various cost reduction initiatives, including SKU rationalization, revenue growth management, and our Right Spend zero-based budgeting initiative. We expect to realize approximately $200.0 of cost reductions annually by the end of 2020 as a result of these initiatives.
Commodities Overview
The raw materials we use are primarily commodities, agricultural-based products, and packaging materials. The most significant of these materials, based on 2018 annual spend, are green coffee, peanuts, oils and fats, protein meals, and plastic containers. Green coffee, certain oils, and certain protein meals are traded on active regulated exchanges, and the price of these commodities fluctuates based on market conditions. Derivative instruments, including futures and options, are used to minimize the impact of price volatility for these commodities.
We source green coffee from more than 20 coffee-producing countries. Its price is subject to high volatility due to factors such as weather, global supply and demand, plant disease, investor speculation, and political and economic conditions in the source countries.
We source peanuts, oils and fats, and protein meals mainly from North America. We are one of the largest procurers of peanuts in the U.S. and frequently enter into long-term purchase contracts for various periods of time to mitigate the risk of a shortage of this commodity. The oils we purchase are mainly soybean and canola.
The price of peanuts, oils, and protein meals are driven primarily
by weather, which impacts crop sizes and yield, as well as global
demand, especially from large importing countries such as China
and India. In addition, the price of oils has been impacted by demand from the biofuels industry.
We frequently enter into long-term contracts to purchase plastic containers, which are sourced mainly from within the U.S. Plastic
resin is made from petrochemical feedstock and natural gas
feedstock, and the price can be influenced by feedstock, energy, and crude oil prices as well as global economic conditions.
In 2018, our overall commodity costs were slightly higher than
in 2017, primarily due to higher costs for green coffee and oils.
Segment Results
We have four reportable segments: U.S. Retail Coffee, U.S. Retail Consumer Foods, U.S. Retail Pet Foods, and International and Away From Home. During 2018, we added International and Away From Home as a reportable segment because a single segment manager was named to oversee the entire operating segment. Prior year segment results have not been modified, as the new reportable segment represents the previously reported combination of the International and Away From Home strategic business areas, which were previously managed separately and not individually significant.
The U.S. Retail Coffee segment primarily includes the domestic sales of Folgers, Dunkin’ Donuts, and Café Bustelo branded coffee; the U.S. Retail Consumer Foods segment primarily includes domestic sales of Jif, Smucker’s, Crisco, and Pillsbury® branded products; and the U.S. Retail Pet Foods segment primarily includes domestic sales of Meow Mix, Milk-Bone, Natural Balance,
Kibbles ’n Bits, 9Lives®, Pup-Peroni®, and Nature’s Recipe branded products. The International and Away From Home segment is comprised of products distributed domestically and in foreign countries through retail channels and foodservice distributors and operators (e.g., restaurants, lodging, schools and universities, health care operators).
Year Ended April 30, | ||||||||||||||||||||||
2018 | 2017 | 2016 | 2018 % Increase (Decrease) | 2017 % Increase (Decrease) | ||||||||||||||||||
Net sales: | ||||||||||||||||||||||
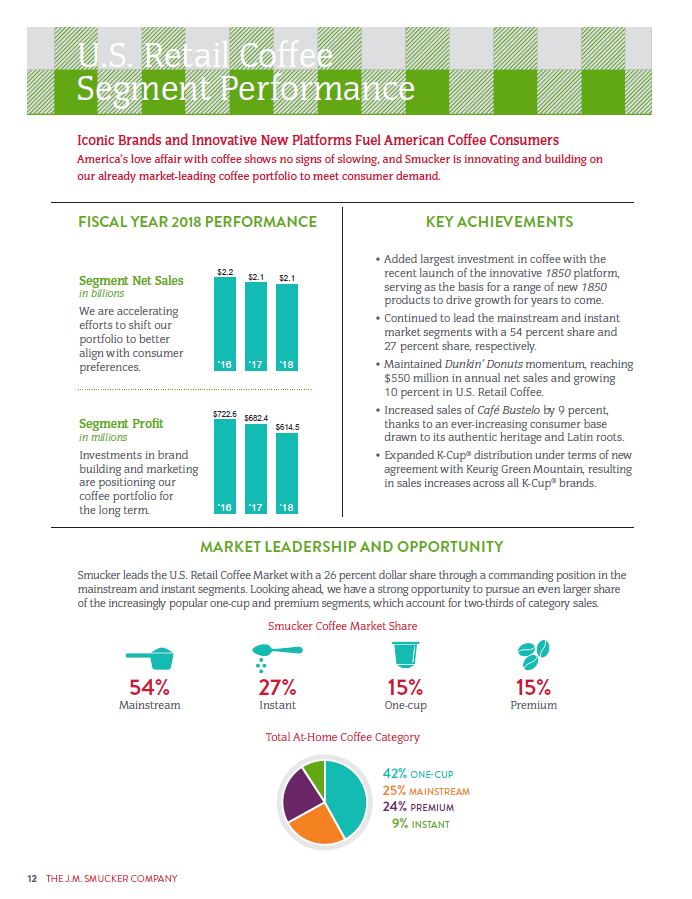
U.S. Retail Coffee | $ | 2,092.2 | $ | 2,108.6 | $ | 2,239.2 | (1 | )% | (6 | )% | ||||||||||||
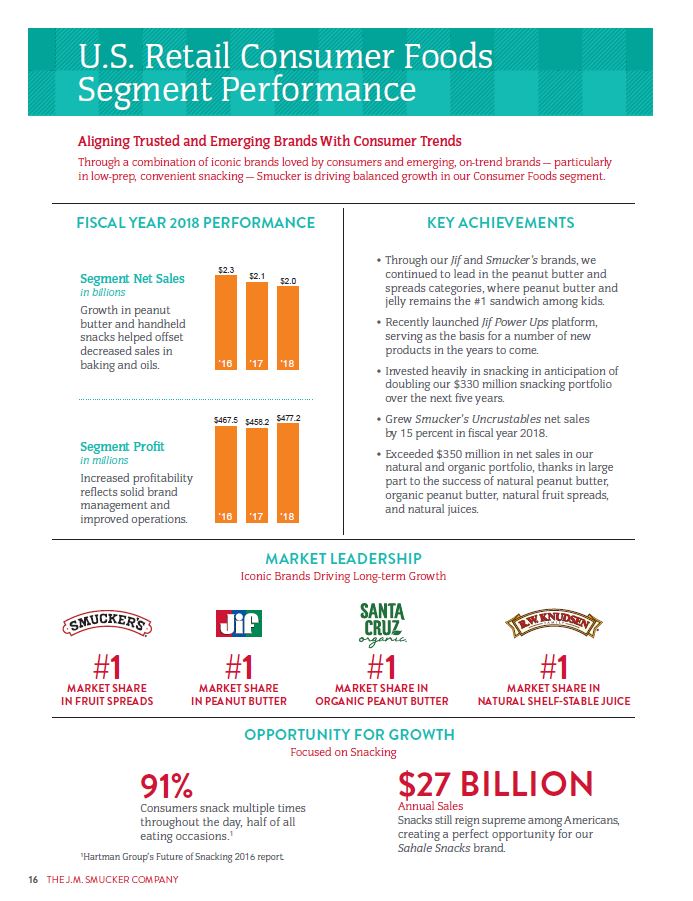
U.S. Retail Consumer Foods | 2,000.8 | 2,085.4 | 2,269.7 | (4 | ) | (8 | ) | |||||||||||||||
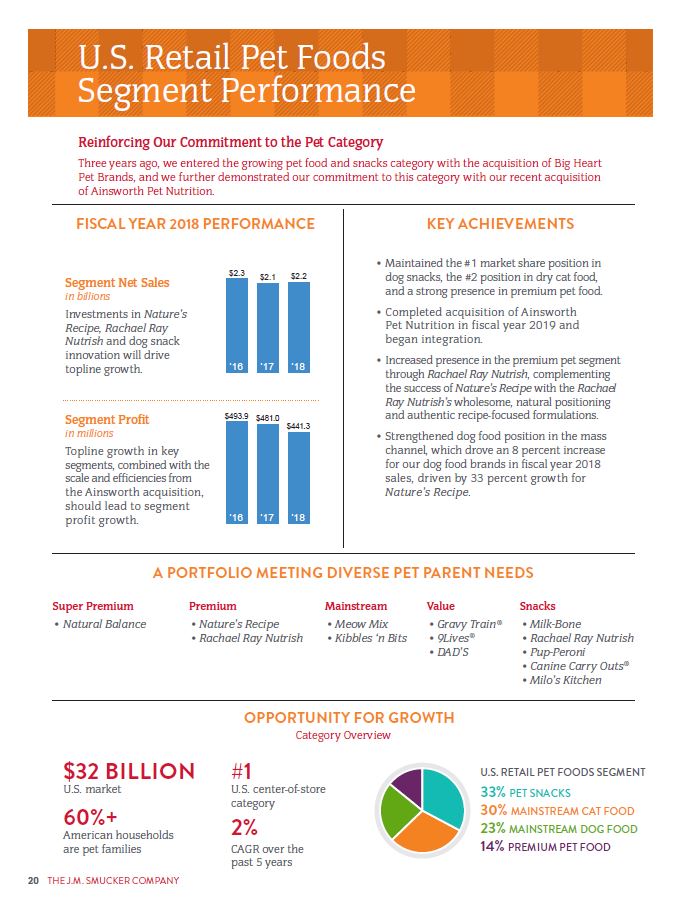
U.S. Retail Pet Foods | 2,169.3 | 2,135.9 | 2,250.4 | 2 | (5 | ) | ||||||||||||||||
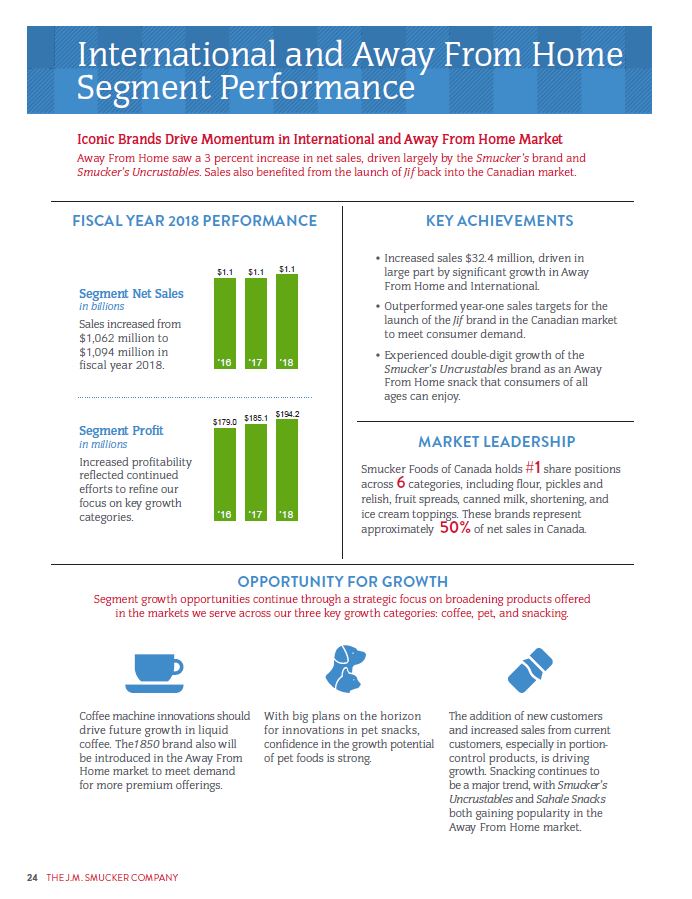
International and Away From Home | 1,094.8 | 1,062.4 | 1,051.9 | 3 | 1 | |||||||||||||||||
Segment profit: | ||||||||||||||||||||||
U.S. Retail Coffee | $ | 614.5 | $ | 682.4 | $ | 722.6 | (10 | )% | (6 | )% | ||||||||||||
U.S. Retail Consumer Foods | 477.2 | 458.2 | 467.5 | 4 | (2 | ) | ||||||||||||||||
U.S. Retail Pet Foods | 441.3 | 481.0 | 493.9 | (8 | ) | (3 | ) | |||||||||||||||
International and Away From Home | 194.2 | 185.1 | 179.0 | 5 | 3 | |||||||||||||||||
Segment profit margin: | ||||||||||||||||||||||
U.S. Retail Coffee | 29.4 | % | 32.4 | % | 32.3 | % | ||||||||||||||||
U.S. Retail Consumer Foods | 23.9 | 22.0 | 20.6 | |||||||||||||||||||
U.S. Retail Pet Foods | 20.3 | 22.5 | 21.9 | |||||||||||||||||||
International and Away From Home | 17.7 | 17.4 | 17.0 | |||||||||||||||||||
34 THE J. M. SMUCKER COMPANY
MANAGEMENT’S DISCUSSION AND ANALYSIS
The J. M. Smucker Company
U.S. Retail Coffee
The U.S. Retail Coffee segment net sales decreased $16.4 in 2018. Unfavorable volume/mix and lower net price realization each reduced net sales by less than 1 percentage point. Unfavorable volume/mix for the Folgers brand was mostly offset by gains for Dunkin’ Donuts K-Cup® pods and the Café Bustelo brand. Lower net price realization was also driven by the Folgers brand. Although 2018 results include a full-year benefit of a list price increase implemented in January 2017, the benefit was more than offset by increased promotional spending in the current year. Segment profit decreased $67.9, primarily due to the unfavorable impacts of volume/mix, higher green coffee costs, and lower net pricing, which were partially offset by improvements in K-Cup® pod profitability. The improved profitability resulted from new contract terms with Keurig Green Mountain, which became effective at the end of the second quarter of 2018. During 2019, we expect to realize the full-year benefits of lower green coffee costs and K-Cup® pod cost savings as compared to 2018.
The U.S. Retail Coffee segment net sales decreased $130.6 in 2017, primarily due to lower net price realization, which was mainly attributed to the net impact of pricing actions taken in 2016 and 2017, and unfavorable volume/mix, which reduced net sales by 3 percentage points. The unfavorable volume/mix was driven by the Folgers brand and was partially offset by favorable volume/mix for the Café Bustelo and Dunkin’ Donuts brands. Segment profit decreased $40.2, primarily due to the unfavorable volume/mix, as well as the impact of lower net price realization, which was partially offset by lower commodity and manufacturing overhead costs and incremental synergy realization.
U.S. Retail Consumer Foods
The U.S. Retail Consumer Foods segment net sales decreased$84.6 in 2018. Volume/mix reduced net sales by 8 percentage points, primarily driven by the Crisco, Pillsbury, and Jif brands. Net price realization contributed 4 percentage points to net sales, primarily related to the Jif, Smucker’s, and Crisco brands. Segment profit increased $19.0, as the net favorable impact of higher prices and higher costs, as well as reduced marketing expense, were partially offset by the unfavorable impact of volume/mix.
The U.S. Retail Consumer Foods segment net sales decreased $184.3 in 2017, primarily reflecting noncomparable net sales of $138.9 in 2016 related to the divested U.S. canned milk business. Excluding the impact of the divestiture, net sales decreased
2 percent, which was entirely driven by unfavorable volume/mix, primarily related to Smucker’s fruit spreads and the Jif and truRoots® brands, partially offset by growth in Smucker’s Uncrustables frozen sandwiches. Segment profit decreased $9.3; however, excluding the $25.3 gain related to the U.S. canned milk divestiture and canned milk profits in 2016, segment profit increased 10 percent, as lower manufacturing overhead costs and incremental synergy realization more than offset an increase in marketing expense.
U.S. Retail Pet Foods
The U.S. Retail Pet Foods segment net sales increased $33.4 in 2018. Favorable volume/mix, primarily driven by the Nature’s Recipe and Meow Mix brands, increased net sales by 2 percentage points. We expanded distribution of the Nature’s Recipe brand into grocery and mass merchandise outlets during the third quarter of 2017. The impact of volume/mix was partially offset by lower net price realization, which reduced net sales by 1 percentage point,
driven by the Meow Mix brand. Segment profit decreased $39.7, primarily due to the unfavorable impacts of lower prices and higher costs and increased advertising expense, mainly related to the Nature’s Recipe and Natural Balance brands. Although not reflected in segment profit, impairment charges of $176.9 were recognized in 2018 related to the goodwill of the Pet Foods reporting unit and certain indefinite-lived trademarks within the U.S. Retail Pet Foods segment.
The U.S. Retail Pet Foods segment net sales decreased $114.5 in 2017, primarily due to unfavorable volume/mix, which reduced net sales by 3 percentage points. This was driven by the
Kibbles’n Bits, Meow Mix, Natural Balance, and 9Lives brands. Net price realization was also lower, driven by the Natural Balance and Milk-Bone brands. Segment profit decreased $12.9, as the impact of unfavorable volume/mix, lower net price realization, and higher distribution costs more than offset the impact of lower commodity costs, incremental synergy realization, and a decrease in marketing expense. Although not reflected in segment profit, impairment charges of $128.5 were recognized in 2017 related to certain indefinite-lived trademarks within the U.S. Retail Pet Foods segment.
International and Away From Home
The International and Away From Home segment net sales increased $32.4 in 2018, reflecting favorable volume/mix, which increased net sales by 2 percentage points, driven by the Jif and Smucker’s brands. In addition, foreign currency exchange contributed $14.0 to net sales. Segment profit increased $9.1, primarily due to the contributions from favorable volume/mix, foreign currency exchange, and reduced marketing expense.
International and Away From Home net sales increased $10.5 in 2017, as favorable volume/mix, which contributed 4 percentage points of growth to net sales, more than offset the impacts of lower net price realization and $14.6 of noncomparable net sales in the prior year related to the divested U.S. canned milk business. Segment profit increased $6.1, primarily due to favorable volume/mix, incremental synergy realization, and a $3.8 pre-tax gain on the sale of our equity interest in Guilin Seamild Biologic Technology Development Co., Ltd. (“Seamild”), which more than offset the unfavorable net impact of lower prices and lower costs, and the loss of profits from the divested canned milk business.
2018 ANNUAL REPORT 35
MANAGEMENT’S DISCUSSION AND ANALYSIS
The J. M. Smucker Company
LIQUIDITY AND CAPITAL RESOURCES
Liquidity
Our principal source of funds is cash generated from operations, supplemented by borrowings against our commercial paper program and revolving credit facility. Total cash and cash equivalents increased to $192.6 at April 30, 2018, compared to $166.8 at April 30, 2017.
Within the U.S. Retail Coffee and U.S. Retail Consumer Foods segments, we generally expect a significant use of cash to fund working capital requirements during the first half of each fiscal
year, primarily due to the buildup of inventories to support the Fall Bake and Holiday period, the additional increase of coffee inventory in advance of the Atlantic hurricane season, and seasonal fruit procurement. In these businesses, we expect cash provided by operations in the second half of the fiscal year to significantly exceed the amount in the first half of the year, upon completion of the Fall Bake and Holiday period. However, the impact of seasonality on our overall working capital requirements is partially reduced by the U.S. Retail Pet Foods segment, which does not experience significant seasonality. Cash provided by operating activities in the second half of 2018 was $783.4, compared to $434.6 provided through the first half of 2018.
The following table presents selected cash flow information.
Year Ended April 30, | |||||||||||
2018 | 2017 | 2016 | |||||||||
Net cash provided by (used for) operating activities | $ | 1,218.0 | $ | 1,059.0 | $ | 1,461.0 | |||||
Net cash provided by (used for) investing activities | (277.6 | ) | (189.7 | ) | 21.7 | ||||||
Net cash provided by (used for) financing activities | (922.0 | ) | (806.1 | ) | (1,498.9 | ) | |||||
Net cash provided by (used for) operating activities | $ | 1,218.0 | $ | 1,059.0 | $ | 1,461.0 | |||||
Additions to property, plant, and equipment | (321.9 | ) | (192.4 | ) | (201.4 | ) | |||||
Free cash flow (A) | $ | 896.1 | $ | 866.6 | $ | 1,259.6 | |||||
(A) | Free cash flow is a non-GAAP measure used by management to evaluate the amount of cash available for debt repayment, dividend distribution, acquisition opportunities, share repurchases, and other corporate purposes. |
Cash provided by operating activities increased $159.0 in 2018 mainly due to a decrease in working capital during 2018, as compared to an increase in the prior year. The working capital change was driven by inventory, accrued liabilities, and trade receivables. Net income adjusted for noncash items was also higher in 2018, partially driven by the reduction in the U.S. federal statutory corporate tax rate in 2018, which resulted from the Act.
Cash provided by operating activities decreased $402.0 in 2017
as a result of a significant decrease in working capital in the prior year, while working capital at the end of the current year was comparable to beginning of the year levels. The decrease in
working capital in 2016 was driven by a reduction in inventory levels, which resulted from a working capital reduction initiative, and the timing of tax payments, including the realization of a
$49.6 one-time tax refund in the first quarter of the prior year.
Cash used for investing activities in 2018 consisted primarily of $321.9 in capital expenditures, partially offset by a $30.9 reduction in our derivative cash margin account balances. Cash used for investing activities in 2017 consisted primarily of $192.4
in capital expenditures and a $38.4 increase in our derivative cash
margin account balances, partially offset by $40.6 in proceeds from the sale of our investment in Seamild. The increase in capital
expenditures in 2018 was driven by the construction of our new manufacturing facility in Longmont, Colorado, as further described below, and product innovation. In 2016, cash provided by investing activities consisted primarily of $193.7 in proceeds from the divestiture of the U.S. canned milk business and a $34.8 reduction in our derivative cash margin account balances, mostly offset by $201.4 in capital expenditures.
Cash used for financing activities in 2018 consisted primarily of$1,050.3 in long-term debt repayments, dividend payments of $350.3, and a $310.0 decrease in short-term borrowings during 2018, which were partially offset by $799.6 in long-term debt proceeds. For additional information on our new borrowings and debt repayments, see “Capital Resources” in this discussion and analysis. In 2017, cash used for financing activities consisted primarily of the purchase of treasury shares for $437.6, mainly representing the repurchase of 3.0 million common shares available under the Board’s authorizations, dividend payments of $339.3, and long-term debt repayments of $200.0, partially offset by a $170.0 increase in short-term borrowings during the year. In 2016, cash used for financing activities consisted primarily of $800.0 in long-term debt repayments, the purchase of treasury shares for $441.1, mainly representing the repurchase of 3.4 million common shares available under the Board’s authorizations, and dividend payments of $316.6.
We, like other food manufacturers, are from time to time subject to legal proceedings arising in the ordinary course of business that could have a material adverse effect on our financial position, results of operations, or cash flows. In particular, we are currently a defendant in Council for Education and Research on Toxics v. Brad Barry LLC, et al., which alleges that we, in addition to nearly eighty other defendants who manufacture, package, distribute, or sell coffee, failed to provide warnings for our coffee products of exposure to the chemical acrylamide as required under California Health and Safety Code Section 25249.5, the California Safe Drinking Water and Toxic Enforcement Act of 1986, better known as “Proposition 65.” As part of a joint defense group organized to defend against the lawsuit, we dispute these claims. Acrylamide is not added to coffee, but is present in all coffee in small amounts (measured in parts per billion) as a byproduct of the coffee bean roasting process. The outcome and the financial impact of the case, if any, cannot be predicted at this time. Accordingly, no loss contingency has been recorded for this matter as of April 30, 2018, as the likelihood of loss is not considered probable or estimable.
36 THE J. M. SMUCKER COMPANY
MANAGEMENT’S DISCUSSION AND ANALYSIS
The J. M. Smucker Company
However, if we are required to pay significant statutory penalties or to add warning labels to any of our products or place warnings in certain locations where our products are sold as a result of Proposition 65, our business and financial results could be adversely impacted, and sales of those products could suffer not only in those locations but elsewhere. For additional information, see Note 15: Contingencies.
Capital Resources
The following table presents our capital structure.
April 30, | |||||||
2018 | 2017 | ||||||
Current portion of long-term debt | $ | — | $ | 499.0 | |||
Short-term borrowings | 144.0 | 454.0 | |||||
Long-term debt, less current portion | 4,688.0 | 4,445.5 | |||||
Total debt | $ | 4,832.0 | $ | 5,398.5 | |||
Shareholders’ equity | 7,891.1 | 6,850.2 | |||||
Total capital | $ | 12,723.1 | $ | 12,248.7 | |||
On April 27, 2018, we entered into a senior unsecured delayed-draw Term Loan Credit Agreement (“Term Loan”) with a syndicate of banks and an available commitment amount of $1.5 billion. Borrowings under the Term Loan bear interest on the prevailing U.S. Prime Rate or London Interbank Offered Rate (“LIBOR”), based on our election, and is payable either on a quarterly basis or at the end of the borrowing term. The Term Loan does not require scheduled amortization payments. Voluntary prepayments are permitted without premium or penalty. As of April 30, 2018, no balance was drawn on the Term Loan. The full amount of the Term Loan was drawn on May 14, 2018, at an interest rate of
3.04 percent, to partially finance the Ainsworth acquisition. The Term Loan matures on May 14, 2021.
In December 2017, we completed an offering of $800.0 in Senior Notes due December 6, 2019, and December 15, 2027. The net proceeds from the offering were used to prepay the $500.0 in principal amount of the Senior Notes due March 15, 2018. In addition, we prepaid, in full, the remaining outstanding balance of the $1.8 billion term loan due March 23, 2020.
In September 2017, we entered into an unsecured revolving credit facility with a group of 11 banks, which provides for a revolving credit line of $1.8 billion and matures in September 2022. Additionally, we terminated the previous $1.5 billion credit facility. Borrowings under the revolving credit facility bear interest on the prevailing U.S. Prime Rate, LIBOR, or Canadian Dealer Offered Rate, based on our election. Interest is payable either on a quarterly basis or at the end of the borrowing term. We did not have a balance outstanding under the revolving credit facility at April 30, 2018.
We participate in a commercial paper program under which we can issue short-term, unsecured commercial paper not to exceed
$1.8 billion at any time, which was increased from the previous limit of $1.0 billion in conjunction with entering into the new unsecured revolving credit facility in September 2017. The
commercial paper program is backed by our revolving credit facility and reduces what we can borrow under the revolving credit facility by the amount of commercial paper outstanding. Commercial paper will be used as a continuing source of short-term financing for general corporate purposes. As of April 30, 2018, we had $144.0 of short-term borrowings outstanding, all of which were issued under our commercial paper program, at a weighted-average interest rate of 2.20 percent. On May 14, 2018, we issued $400.0 of commercial paper at a weighted-average interest rate of 2.27 percent to partially finance the Ainsworth acquisition.
We are in compliance with all of our debt covenants. For additional information on our long-term debt, sources of liquidity, and debt covenants, see Note 8: Debt and Financing Arrangements.
During 2018, we did not repurchase any common shares under a repurchase plan authorized by the Board. At April 30, 2018, approximately 3.6 million common shares remain available for repurchase pursuant to the Board’s authorizations. There is no guarantee as to the exact number of shares that may be repurchased or when such purchases may occur.
In June 2017, we began construction of a Smucker’s Uncrustables frozen sandwich manufacturing facility in Longmont, Colorado. The new facility will help meet growing demand for Smucker’s Uncrustables frozen sandwiches and will complement our existing facility in Scottsville, Kentucky. The Longmont facility will be constructed in two phases, with a total potential investment of $340.0. Phase 1 includes up to an initial $210.0 investment to construct and equip the new facility, with an opportunity to invest an additional $130.0 for phase 2 expansion, dependent on product demand. Production is expected to begin at the new facility during 2020.
The following table presents certain cash requirements related
to 2019 investing and financing activities based on our current expectations. Although no principal payments are required on our debt obligations in 2019, we may utilize a portion of cash provided by operations for debt repayment. Additionally, in 2020, a portion of our Senior Notes will mature, and $800.0 in principal payments will be required that year.
Projection Year Ending April 30, 2019 | ||||
Capital expenditures | $ | 360.0 | ||
Dividend payments – based on current rates and common shares outstanding | 350.0 | |||
Interest payments – includes indebtedness related to Ainsworth | 220.0 | |||
On March 5, 2018, the U.S. Federal Trade Commission announced an administrative complaint challenging the proposed transaction to acquire the Wesson® oil brand from Conagra Brands, Inc. (“Conagra”). As a result, we mutually determined with Conagra to terminate the definitive agreement to acquire the Wesson brand.
2018 ANNUAL REPORT 37
MANAGEMENT’S DISCUSSION AND ANALYSIS
The J. M. Smucker Company
Absent any additional material acquisitions or other significant investments, we believe that cash on hand, combined with cash provided by operations and borrowings available under our commercial paper program and revolving credit facility, will be sufficient to meet our cash requirements for the next 12 months, including capital expenditures, the payment of quarterly dividends, interest payments on debt outstanding, and share repurchases.
As of April 30, 2018, total cash and cash equivalents of $177.5 was held by our international subsidiaries. We recorded a provisional one-time transition tax of $26.1 in 2018 on the undistributed earnings of certain foreign subsidiaries that were previously deferred from U.S. income taxes, as required by the Act. This tax liability is expected to be paid over an eight-year period, which began in 2018. As of April 30, 2018, the undistributed earnings of our foreign subsidiaries continue to be permanently reinvested, and we do not intend to repatriate any of the amounts to meet our cash requirements. For further information, refer to Note 13: Income Taxes.
NON-GAAP FINANCIAL MEASURES
We use non-GAAP financial measures including: net sales excluding divestiture and foreign currency exchange; adjusted gross profit, operating income, income, and earnings per share; earnings before interest, taxes, depreciation, amortization, and impairment charges related to intangible assets (“EBITDA (as adjusted)”); and free cash flow, as key measures for purposes of evaluating performance internally. We believe that investors’ understanding of our performance is enhanced by disclosing these performance measures. Furthermore, these non-GAAP financial measures are used by management in preparation of the annual budget and for the monthly analyses of our operating results. The Board also utilizes the adjusted earnings per share and free cash flow measures as components for measuring performance for incentive compensation purposes.
Non-GAAP measures exclude certain items affecting comparability, that can significantly affect the year-over-year assessment of operating results, which include amortization expense and impairment charges related to intangible assets, integration and restructuring costs (“special project costs”), and unallocated gains and losses on commodity and foreign currency exchange derivatives (“unallocated derivative gains and losses”). The special project costs in the following table relate to specific integration and restructuring projects, and the unallocated derivative gains and losses reflect the changes in fair value of our commodity and foreign currency exchange contracts. During 2018, we expanded our non-GAAP measures to also exclude certain one-time tax adjustments. These adjustments include the provisional effect of the one-time items associated with the Act, which includes certain adjustments related to the U.S. deferred tax assets and liabilities remeasurement and the transition tax. Also included in these one-time tax adjustments is the permanent tax difference related to the goodwill impairment charge that was recorded during 2018. For further details on these adjustments, refer to Note 13: Income Taxes, and Note 7: Goodwill and Other Intangible Assets. We believe that excluding these one-time tax adjustments in our non-GAAP measures provides comparability across the periods presented and better reflects the benefit of a lower blended U.S. statutory tax rate on our current year earnings as a result of the Act.
These non-GAAP financial measures are not intended to replace the presentation of financial results in accordance with U.S. generally accepted accounting principles (“GAAP”). Rather, the presentation of these non-GAAP financial measures supplements other metrics we use to internally evaluate our businesses and facilitate the comparison of past and present operations and liquidity. These non-GAAP financial measures may not be comparable to similar measures used by other companies and may exclude certain nondiscretionary expenses and cash payments.
38 THE J. M. SMUCKER COMPANY
MANAGEMENT’S DISCUSSION AND ANALYSIS
The J. M. Smucker Company
The following table reconciles certain non-GAAP financial measures to the comparable GAAP financial measure. See page 32 for a reconciliation of net sales adjusted for certain noncomparable items to the comparable GAAP financial measure.
Year Ended April 30, | |||||||||||||||||||||
2018 | 2017 | 2016 | 2015 | 2014 | |||||||||||||||||
Gross profit reconciliation: | |||||||||||||||||||||
Gross profit | $ | 2,836.1 | $ | 2,835.3 | $ | 2,967.8 | $ | 1,968.7 | $ | 2,031.0 | |||||||||||
Unallocated derivative losses (gains) | (37.3 | ) | 27.2 | (12.0 | ) | 24.5 | (5.3 | ) | |||||||||||||
Cost of products sold – special project costs | 3.9 | 5.7 | 12.2 | 6.2 | 9.4 | ||||||||||||||||
Adjusted gross profit | $ | 2,802.7 | $ | 2,868.2 | $ | 2,968.0 | $ | 1,999.4 | $ | 2,035.1 | |||||||||||
Operating income reconciliation: | |||||||||||||||||||||
Operating income | $ | 1,036.1 | $ | 1,031.5 | $ | 1,145.3 | $ | 772.0 | $ | 919.0 | |||||||||||
Amortization | 206.8 | 207.3 | 208.4 | 109.7 | 98.9 | ||||||||||||||||
Goodwill impairment charge | 145.0 | — | — | — | — | ||||||||||||||||
Other intangible assets impairment charges | 31.9 | 133.2 | — | 1.2 | — | ||||||||||||||||
Unallocated derivative losses (gains) | (37.3 | ) | 27.2 | (12.0 | ) | 24.5 | (5.3 | ) | |||||||||||||
Cost of products sold – special project costs | 3.9 | 5.7 | 12.2 | 6.2 | 9.4 | ||||||||||||||||
Other special project costs | 45.4 | 76.9 | 135.9 | 56.6 | 25.6 | ||||||||||||||||
Adjusted operating income | $ | 1,431.8 | $ | 1,481.8 | $ | 1,489.8 | $ | 970.2 | $ | 1,047.6 | |||||||||||
Net income reconciliation: | |||||||||||||||||||||
Net income | $ | 1,338.6 | $ | 592.3 | $ | 688.7 | $ | 344.9 | $ | 565.2 | |||||||||||
Income tax expense (benefit) | (477.6 | ) | 286.1 | 289.2 | 178.1 | 284.5 | |||||||||||||||
Amortization | 206.8 | 207.3 | 208.4 | 109.7 | 98.9 | ||||||||||||||||
Goodwill impairment charge | 145.0 | — | — | — | — | ||||||||||||||||
Other intangible assets impairment charges | 31.9 | 133.2 | — | 1.2 | — | ||||||||||||||||
Unallocated derivative losses (gains) | (37.3 | ) | 27.2 | (12.0 | ) | 24.5 | (5.3 | ) | |||||||||||||
Cost of products sold – special project costs | 3.9 | 5.7 | 12.2 | 6.2 | 9.4 | ||||||||||||||||
Other special project costs | 45.4 | 76.9 | 135.9 | 56.6 | 25.6 | ||||||||||||||||
Adjusted income before income taxes | $ | 1,256.7 | $ | 1,328.7 | $ | 1,322.4 | $ | 721.2 | $ | 978.3 | |||||||||||
Income taxes, as adjusted (A) | 352.1 | 432.8 | 391.1 | 245.6 | 327.5 | ||||||||||||||||
Adjusted income | $ | 904.6 | $ | 895.9 | $ | 931.3 | $ | 475.6 | $ | 650.8 | |||||||||||
Weighted-average shares – assuming dilution | 113.6 | 116.1 | 119.5 | 103.7 | 104.3 | ||||||||||||||||
Adjusted earnings per share – assuming dilution | $ | 7.96 | $ | 7.72 | $ | 7.79 | $ | 4.59 | $ | 6.24 | |||||||||||
EBITDA (as adjusted) reconciliation: | |||||||||||||||||||||
Net income | $ | 1,338.6 | $ | 592.3 | $ | 688.7 | $ | 344.9 | $ | 565.2 | |||||||||||
Income tax expense (benefit) | (477.6 | ) | 286.1 | 289.2 | 178.1 | 284.5 | |||||||||||||||
Interest expense – net | 174.1 | 163.1 | 171.1 | 79.9 | 79.4 | ||||||||||||||||
Depreciation | 206.3 | 211.7 | 221.7 | 157.5 | 157.5 | ||||||||||||||||
Amortization | 206.8 | 207.3 | 208.4 | 109.7 | 98.9 | ||||||||||||||||
Goodwill impairment charge | 145.0 | — | — | — | — | ||||||||||||||||
Other intangible assets impairment charges | 31.9 | 133.2 | — | 1.2 | — | ||||||||||||||||
EBITDA (as adjusted) | $ | 1,625.1 | $ | 1,593.7 | $ | 1,579.1 | $ | 871.3 | $ | 1,185.5 | |||||||||||
Free cash flow reconciliation: | |||||||||||||||||||||
Net cash provided by (used for) operating activities | $ | 1,218.0 | $ | 1,059.0 | $ | 1,461.0 | $ | 739.1 | $ | 863.3 | |||||||||||
Additions to property, plant, and equipment | (321.9 | ) | (192.4 | ) | (201.4 | ) | (247.7 | ) | (279.5 | ) | |||||||||||
Free cash flow | $ | 896.1 | $ | 866.6 | $ | 1,259.6 | $ | 491.4 | $ | 583.8 | |||||||||||
(A) Income taxes, as adjusted, is based upon our GAAP effective tax rate and reflects the impact of items excluded from GAAP net income to derive
adjusted income. Income taxes, as adjusted also reflects the exclusion of certain one-time tax adjustments during 2018.
2018 ANNUAL REPORT 39
MANAGEMENT’S DISCUSSION AND ANALYSIS
The J. M. Smucker Company
OFF-BALANCE SHEET ARRANGEMENTS
We do not have material off-balance sheet arrangements, financings, or other relationships with unconsolidated entities or other persons, also known as variable interest entities. Transactions with related parties are in the ordinary course of business and are not material to our results of operations, financial condition, or cash flows.
CONTRACTUAL OBLIGATIONS
The following table summarizes our contractual obligations by fiscal year at April 30, 2018.
Total | 2019 | 2020–2021 | 2022–2023 | 2024 and beyond | |||||||||||||||
Long-term debt obligations, including current portion (A) | $ | 4,700.0 | $ | — | $ | 800.0 | $ | 1,150.0 | $ | 2,750.0 | |||||||||
Interest payments (B) | 1,770.6 | 163.5 | 307.1 | 236.6 | 1,063.4 | ||||||||||||||
Operating lease obligations (C) | 208.1 | 42.8 | 70.8 | 59.0 | 35.5 | ||||||||||||||
Purchase obligations (D) | 1,376.0 | 1,163.8 | 181.4 | 21.5 | 9.3 | ||||||||||||||
Other liabilities (E) | 288.3 | 22.1 | 38.3 | 24.9 | 203.0 | ||||||||||||||
Total | $ | 8,343.0 | $ | 1,392.2 | $ | 1,397.6 | $ | 1,492.0 | $ | 4,061.2 | |||||||||
(A) | Excludes the impact of offering discounts, make-whole payments, and debt issuance costs. |
(B) | Includes interest payments on our long-term debt. |
(C) | Includes the minimum rental commitments under non-cancelable operating leases. |
(D) | Includes agreements that are enforceable and legally bind us to purchase goods or services, including certain obligations related to normal, ongoing purchase obligations in which we have guaranteed payment to ensure availability of raw materials, packaging supplies, and co-pack arrangements. We expect to receive consideration for these purchase obligations in the form of materials and services. These purchase obligations do not represent the entire anticipated purchases in the future, but represent only those items for which we are contractually obligated. |
(E) | Mainly consists of projected commitments associated with our defined benefit pension and other postretirement benefit plans. The liability for unrecognized tax benefits and tax-related net interest of $36.4 under FASB Accounting Standards Codification 740, Income Taxes, is excluded, since we are unable to reasonably estimate the timing of cash settlements with the respective taxing authorities. |
CRITICAL ACCOUNTING ESTIMATES
AND POLICIES
The preparation of financial statements in conformity with U.S. GAAP requires that we make estimates and assumptions that in certain circumstances affect amounts reported in the accompanying consolidated financial statements. In preparing these financial statements, we have made our best estimates and judgments of certain amounts included in the financial statements, giving due consideration to materiality. We do not believe there is a great likelihood that materially different amounts would be reported under different conditions or using different assumptions related to the accounting policies described below. However, application of these accounting policies involves the exercise of judgment and use of assumptions as to future uncertainties and, as a result, actual results could differ from these estimates.
Trade Marketing and Merchandising Programs: In order to support our products, various promotional activities are conducted through retail trade, distributors, or directly with consumers, including in-store display and product placement programs, feature price discounts, coupons, and other similar activities. The costs of these programs are classified as a reduction of sales. We regularly review and revise, when we deem necessary, estimates of costs for these promotional programs based on estimates of what will be redeemed by retail trade, distributors, or consumers. These estimates are made using various techniques, including historical data on performance of similar promotional programs. Differences
between estimated expenditures and actual performance are
recognized as a change in estimate in a subsequent period. During 2018, 2017, and 2016, subsequent period adjustments approximated less than 2 percent of both consolidated pre-tax income and cash provided by operating activities. These promotional expenditures, including amounts classified as a reduction of sales, represented 35 percent of net sales in 2018. The possibility exists that reported results could be different if factors such as the level and success of the promotional programs or other conditions differ from expectations.
Income Taxes: We account for income taxes using the liability method. In the ordinary course of business, we are exposed to uncertainties related to tax filing positions and periodically assess the technical merits of these tax positions for all tax years that remain subject to examination, based upon the latest information available. For material uncertain tax positions, we have recognized a liability for unrecognized tax benefits, including any applicable interest and penalty charges.
We routinely evaluate the likelihood of realizing the benefit of our deferred tax assets and may record a valuation allowance if, based on all available evidence, we determine that it is more likely than not that all or some portion of such assets will not be realized. Valuation allowances related to deferred tax assets can be affected by changes in tax laws, statutory tax rates, and projected future taxable income levels. Changes in estimated realization of deferred tax assets would result in an adjustment to income in the period in which that determination is made, unless such changes are
40 THE J. M. SMUCKER COMPANY
MANAGEMENT’S DISCUSSION AND ANALYSIS
The J. M. Smucker Company
determined to be an adjustment to goodwill within the allowable measurement period under the acquisition method of accounting.
The future tax benefit arising from the net deductible temporary differences and tax carryforwards is $129.1 and $227.3 at
April 30, 2018 and 2017, respectively. The decrease in the future tax benefit from the prior year reflects the reduction in the federal
income tax rate from the enactment of U.S. comprehensive tax
reform legislation. In evaluating our ability to recover our deferred tax assets within the jurisdiction from which they arise, we consider all available positive and negative evidence, including scheduled reversals of deferred tax liabilities, projected future taxable income, tax planning strategies, and results of operations. For those jurisdictions where the expiration date of tax carry-forwards or the projected operating results indicate that realization is not likely, a valuation allowance would have been provided.
As of April 30, 2018, the undistributed earnings of our foreign subsidiaries, primarily in Canada, continue to be indefinitely reinvested.
Long-Lived Assets: Long-lived assets, other than goodwill and other indefinite-lived intangible assets, are reviewed for impairment whenever events or changes in circumstances indicate that the carrying amount of the asset may not be recoverable. Recoverability of assets to be held and used is measured by a comparison of the carrying amount of the assets to future net undiscounted cash flows estimated to be generated by such assets. If such assets are considered to be impaired, the impairment to be recognized is the amount by which the carrying amount of the assets exceeds the estimated fair value of the assets. However, determining fair value is subject to estimates of both cash flows and discount rates, and different estimates could yield different results. There are no events or changes in circumstances of which we are aware that indicate the carrying value of our long-lived assets may not be recoverable at April 30, 2018.
Goodwill and Other Indefinite-Lived Intangible Assets:
A significant portion of our assets is goodwill and other intangible assets, the majority of which are not amortized but are reviewed at least annually for impairment and more often if indicators of impairment exist. At April 30, 2018, the carrying value of goodwill and other intangible assets totaled $11.9 billion, compared to total assets of $15.3 billion and total shareholders’ equity of
$7.9 billion. If the carrying value of these assets exceeds the current estimated fair value, the asset is considered impaired, and this would result in a noncash charge to earnings. Any such impairment charge would reduce earnings and could be material. Events and conditions that could result in impairment include a sustained drop in the market price of our common shares, increased competition or loss of market share, obsolescence, product claims that result in a significant loss of sales or profitability over the product life, deterioration in macroeconomic conditions, or declining financial performance in comparison to projected results.
To test for goodwill impairment, we estimate the fair value of each of our reporting units using both a discounted cash flow valuation technique and a market-based approach. The impairment test incorporates estimates of future cash flows; allocations of certain assets, liabilities, and cash flows among reporting units; future growth rates; terminal value amounts; and the applicable weighted-average cost of capital used to discount those estimated cash flows. The estimates and projections used in the calculation of fair value are consistent with our current and long-range plans, including anticipated changes in market conditions, industry trends, growth rates, and planned capital expenditures. Changes in forecasted operations and other estimates and assumptions could impact the assessment of impairment in the future.
At April 30, 2018, goodwill totaled $5.9 billion. Goodwill is substantially concentrated within the U.S. Retail Coffee, U.S. Retail Pet Foods, and U.S. Retail Consumer Foods segments. During 2018, we recognized goodwill impairment charges of $145.0 related to the goodwill of the Pet Foods reporting unit, which was a result of the evaluation performed during the year.
As of April 30, 2018, the estimated fair value of each of our seven reporting units was substantially in excess of its carrying value, with the exception of the Pet Foods reporting unit, for which its fair value exceeded its carrying value by less than 1 percent. A sensitivity analysis was performed for the Pet Foods reporting unit, assuming a hypothetical 50-basis-point decrease in the expected long-term growth rate or a hypothetical 50-basis-point increase in the weighted-average cost of capital, and both scenarios independently yielded an estimated fair value for the Pet Foods reporting unit below carrying value.
Other indefinite-lived intangible assets, consisting entirely of trademarks, are also tested for impairment at least annually and more often if events or changes in circumstances indicate their carrying value may not be recoverable. To test these assets for impairment, we estimate the fair value of each asset based on a discounted cash flow model using various inputs, including projected revenues, an assumed royalty rate, and a discount rate. Changes in these estimates and assumptions could impact the assessment of impairment in the future.
At April 30, 2018, other indefinite-lived intangible assets totaled $2.9 billion. Trademarks that represent our leading brands comprise more than 90 percent of the total carrying value of other indefinite-lived intangible assets. As of April 30, 2018, each of these leading brand trademarks had an estimated fair value substantially in excess of its carrying value, with the exception of the indefinite-lived trademarks within the U.S. Retail Pet Foods segment. During 2018, we recognized impairment charges of $31.9 related to certain indefinite-lived trademarks within the U.S. Retail Pet Foods segment, to the extent that the carrying value exceeded the estimated fair value.
2018 ANNUAL REPORT 41
MANAGEMENT’S DISCUSSION AND ANALYSIS
The J. M. Smucker Company
The goodwill and indefinite-lived trademarks within the U.S. Retail Pet Foods segment remain susceptible to future impairment charges as the carrying values approximate estimated fair values at April 30, 2018. In addition, any meaningful adverse change to our near or long-term projections or macro-economic conditions could result in future impairment charges.
Pension and Other Postretirement Benefit Plans: To determine the ultimate obligation under our defined benefit pension and other postretirement benefit plans, we must estimate the future cost of benefits and attribute that cost to the time period during which each covered employee works. Various actuarial assumptions must be made in order to predict and measure costs and obligations many years prior to the settlement date, the most significant being the interest rates used to discount the obligations of the plans, the long-term rates of return on the plans’ assets, mortality assumptions, assumed pay increases, and the health care cost trend rates. We, along with third-party actuaries and investment managers, review all of these assumptions on an ongoing basis to ensure that the most reasonable information available is being considered.
During 2017, we changed the approach utilized to estimate the service and interest cost components of net periodic benefit cost for our defined benefit pension and other postretirement benefit plans. Historically, we estimated the service and interest cost components using a single weighted-average discount rate derived from the yield curve used to measure the benefit obligation at the beginning of the period. As of April 30, 2017, we utilized a spot rate approach for the estimation of service and interest cost for our plans by applying specific spot rates along the yield curve to the relevant projected cash flows, to provide a better estimate of service and interest costs. This approach does not affect the measurement of the total benefit obligations, and has been accounted for as a change in estimate that is effected by a change in accounting principle. As such, we accounted for this change in methodology on a prospective basis beginning May 1, 2017.
For 2019 expense recognition, we will continue to use a spot rate methodology, determined using the method described above. This methodology will result in weighted-average discount rates for the U.S. defined benefit pension plans of 4.17 percent to determine benefit obligation, 4.29 percent to determine service cost, and
3.87 percent to determine interest cost, and a rate of compensation increase of 3.59 percent. For the Canadian defined benefit pension plans, it will result in weighted-average discount rates of
3.57 percent to determine benefit obligation, 3.64 percent to determine service cost, and 3.23 percent to determine interest cost. In addition, we anticipate using an expected rate of return on plan assets of 5.66 percent and 5.25 percent for the U.S. and Canadian defined benefit pension plans, respectively.
DERIVATIVE FINANCIAL INSTRUMENTS AND MARKET RISK
The following discussions about our market risk disclosures involve forward-looking statements. Actual results could differ from those projected in the forward-looking statements. We are
exposed to market risk related to changes in interest rates, foreign currency exchange rates, and commodity prices.
Interest Rate Risk: The fair value of our cash and cash equivalents at April 30, 2018, approximates carrying value. We are exposed to interest rate risk with regard to existing debt consisting of fixed- and variable-rate maturities. Our interest rate exposure primarily includes U.S. Treasury rates, LIBOR, and commercial paper rates in the U.S.
We utilize derivative instruments to manage changes in the fair value and cash flows of our debt. Interest rate contracts mitigate the risk associated with the underlying hedged item. At the inception of the contract, the instrument is evaluated and documented for hedge accounting treatment. If the contract is designated as a cash flow hedge, the mark-to-market gains or losses on the contract are deferred and included as a component of accumulated other comprehensive income (loss), and reclassified to interest expense in the period during which the hedged transaction affects earnings. If the contract is designated as a fair value hedge, the contract is recognized at fair value on the balance sheet, and changes in the fair value are recognized in interest expense. Generally, changes in the fair value of the derivative are equal to changes in the fair value of the underlying debt and have no net impact on earnings.
In June 2017, we entered into a treasury lock, with a notional value of $300.0, to manage our exposure to interest rate volatility associated with anticipated debt financing in 2018. This interest rate contract was designated as a cash flow hedge. In December 2017, concurrent with the pricing of the Senior Notes due December 15, 2027, we terminated the treasury lock prior to maturity. The termination resulted in a gain of $2.7, which was deferred and included as a component of accumulated other comprehensive income (loss) and is being amortized as a reduction to interest expense over the life of the debt.
In 2015, we terminated the interest rate swap on the 3.50 percent Senior Notes due October 15, 2021, which was designated as a fair value hedge, and used to hedge against the changes in fair value of the debt. As a result of the early termination, we received $58.1 in cash, which included $4.6 of accrued and prepaid interest and a $53.5 benefit that is deferred as a component of the carrying value of the long-term debt and is being recognized ratably as a reduction to interest expense over the remaining life of the related debt. At April 30, 2018, the remaining benefit of $28.5 was recorded as an increase in the long-term debt balance.
42 THE J. M. SMUCKER COMPANY
MANAGEMENT’S DISCUSSION AND ANALYSIS
The J. M. Smucker Company
In measuring interest rate risk by the amount of net change in the fair value of our financial liabilities, a hypothetical 100-basis-point decrease in interest rates at April 30, 2018, would increase the fair value of our long-term debt by $333.2.
Foreign Currency Exchange Risk: We have operations outside the U.S. with foreign currency denominated assets and liabilities, primarily denominated in Canadian currency. Because we have foreign currency denominated assets and liabilities, financial exposure may result, primarily from the timing of transactions and the movement of exchange rates. The foreign currency balance sheet exposures as of April 30, 2018, are not expected to result in a significant impact on future earnings or
cash flows.
We utilize foreign currency derivatives to manage the effect of foreign currency exchange fluctuations on future cash payments in Canada, primarily related to purchases of certain raw materials and finished goods. The contracts generally have maturities of less than one year. We do not qualify instruments used to manage foreign currency exchange exposures for hedge accounting treatment. Therefore, the change in value of these instruments is immediately recognized in the cost of products sold. Based on our hedged foreign currency positions as of April 30, 2018, a hypothetical
10 percent change in exchange rates would not materially impact the fair value.
Revenues from customers outside the U.S., subject to foreign currency exchange, represented 6 percent of net sales during 2018. Thus, certain revenues and expenses have been, and are expected to be, subject to the effect of foreign currency fluctuations, and these fluctuations may have an impact on operating results.
Commodity Price Risk: We use certain raw materials and other commodities that are subject to price volatility caused by supply and demand conditions, political and economic variables, weather, investor speculation, and other unpredictable factors. To manage the volatility related to anticipated commodity purchases, we use derivatives with maturities of generally less than one year. We do not qualify commodity derivatives for hedge accounting treatment. As a result, the gains and losses on all commodity derivatives are immediately recognized in cost of products sold.
The following sensitivity analysis presents our potential loss of fair value resulting from a hypothetical 10 percent change in market prices related to commodities.
Year Ended April 30, | |||||||
2018 | 2017 | ||||||
High | $ | 36.0 | $ | 40.8 | |||
Low | 17.0 | 13.2 | |||||
Average | 26.8 | 26.5 | |||||
The estimated fair value was determined using quoted market prices and was based on our net derivative position by commodity for the previous four quarters. The calculations are not intended to represent actual losses in fair value that we expect to incur. In practice, as markets move, we actively manage our risk and adjust hedging strategies as appropriate. The commodities hedged have a high inverse correlation to price changes of the derivative instrument; thus, we would expect that any gain or loss in the estimated fair value of its derivatives would generally be offset by an increase or decrease in the estimated fair value of the underlying exposures.
2018 ANNUAL REPORT 43
MANAGEMENT’S DISCUSSION AND ANALYSIS
The J. M. Smucker Company
FORWARD-LOOKING STATEMENTS
Certain statements included in this Annual Report contain forward-looking statements within the meaning of federal securities laws. The forward-looking statements may include statements concerning our current expectations, estimates, assumptions, and beliefs concerning future events, conditions, plans, and strategies that are not historical fact. Any statement that is not historical in nature is a forward-looking statement and may be identified by the use of words and phrases such as “expect,” “anticipate,” “believe,” “intend,” “will,” “plan,” and similar phrases.
Federal securities laws provide a safe harbor for forward-looking statements to encourage companies to provide prospective information. We are providing this cautionary statement in connection with the safe harbor provisions. Readers are cautioned not to place undue reliance on any forward-looking statements, as such statements are by nature subject to risks, uncertainties, and other factors, many of which are outside of our control and could cause actual results to differ materially from such statements and from our historical results and experience. These risks and uncertainties include, but are not limited to, those set forth under the caption “Risk Factors” in our Annual Report on Form 10-K, as well as the following:
• our ability to successfully integrate the acquired Ainsworth business in a timely and cost-effective manner and retain key suppliers, customers, and employees; |
• our ability to achieve synergies and cost savings related to the Ainsworth acquisition in the amounts and within the time frames currently anticipated; |
• our ability to achieve cost savings related to our organization optimization and cost management programs in the amounts and within the time frames currently anticipated; |
• our ability to generate sufficient cash flow to meet our cash deleveraging objectives; |
• volatility of commodity, energy, and other input costs; |
• risks associated with derivative and purchasing strategies we employ to manage commodity pricing risks; |
• the availability of reliable transportation on acceptable terms; |
• our ability to implement and realize the full benefit of price changes, and the impact of the timing of the price changes to profits and cash flow in a particular period; |
• the success and cost of marketing and sales programs and strategies intended to promote growth in our businesses, including product innovation; |
• general competitive activity in the market, including competitors’ pricing practices and promotional spending levels; |
• the impact of food security concerns involving either our products or our competitors’ products; |
• the impact of accidents, extreme weather, and natural disasters; |
• the concentration of certain of our businesses with key customers and suppliers, including single-source suppliers of certain key raw materials and finished goods, and our ability to manage and maintain key relationships; |
• the timing and amount of capital expenditures and share repurchases; |
• impairments in the carrying value of goodwill, other intangible assets, or other long-lived assets or changes in useful lives of other intangible assets; |
• the impact of new or changes to existing governmental laws and regulations and their application; |
• the outcome of tax examinations, changes in tax laws, and other tax matters; |
• foreign currency and interest rate fluctuations; and |
• risks related to other factors described under “Risk Factors” in other reports and statements we have filed with the SEC. |
Readers are cautioned not to unduly rely on such forward-looking statements, which speak only as of the date made, when evaluating the information presented in this Annual Report. We do not undertake any obligation to update or revise these forward-looking statements to reflect new events or circumstances subsequent to the filing of this Annual Report.
44 THE J. M. SMUCKER COMPANY
REPORT OF MANAGEMENT ON INTERNAL CONTROL OVER FINANCIAL REPORTING
The J. M. Smucker Company
Shareholders
The J. M. Smucker Company
Management is responsible for establishing and maintaining adequate accounting and internal control systems over financial reporting, as such term is defined in Rules 13a-15(f) and 15d-15(f) under the Securities and Exchange Act of 1934, as amended. Our internal control system is designed to provide reasonable assurance that we have the ability to record, process, summarize, and report reliable financial information on a timely basis.
Our management, with the participation of the principal financial officer and principal executive officer, assessed the effectiveness of the internal control over financial reporting as of April 30, 2018. In making this assessment, we used the criteria established in Internal Control – Integrated Framework issued by the Committee of Sponsoring Organizations of the Treadway Commission (2013 Framework) (“the COSO criteria”).
Based on our assessment of internal control over financial reporting under the COSO criteria, we concluded the internal control over financial reporting was effective as of April 30, 2018.
Ernst & Young LLP, an independent registered public accounting firm, audited the effectiveness of our internal control over financial reporting as of April 30, 2018, and their report thereon is included on page 46 of this report.
Mark T. Smucker | Mark R. Belgya | |||
President and | Vice Chair and | |||
Chief Executive Officer | Chief Financial Officer | |||
2018 ANNUAL REPORT 45
REPORT OF INDEPENDENT REGISTERED PUBLIC ACCOUNTING FIRM ON INTERNAL CONTROL OVER FINANCIAL REPORTING
The J. M. Smucker Company
Board of Directors and Shareholders
The J. M. Smucker Company
Opinion on Internal Control Over Financial Reporting
We have audited The J. M. Smucker Company’s internal control over financial reporting as of April 30, 2018, based on criteria established in Internal Control – Integrated Framework issued by the Committee of Sponsoring Organizations of the Treadway Commission (2013 framework) (“the COSO criteria”). In our opinion, The J. M. Smucker Company (the “Company”) maintained, in all material aspects, effective internal control over financial reporting as of April 30, 2018, based on the COSO criteria.
We also have audited, in accordance with the standards of the Public Company Accounting Oversight Board (United States) (“PCAOB”), the consolidated balance sheets of the Company as of April 30, 2018 and 2017, and the related statements of consolidated income, comprehensive income, shareholders’ equity, and cash flows for each of the three years in the period ended April 30, 2018, and the related notes and our report dated June 18, 2018, expressed an unqualified opinion thereon.
Basis for Opinion
The Company’s management is responsible for maintaining effective internal control over financial reporting and for its assessment of the effectiveness of internal control over financial reporting included in the accompanying Report of Management on Internal Control Over Financial Reporting. Our responsibility is to express an opinion on the Company’s internal control over financial reporting based on our audit. We are a public accounting firm registered with the PCAOB and are required to be independent with respect to the Company in accordance with the U.S. federal securities laws and the applicable rules and regulations of the Securities and Exchange Commission and the PCAOB.
We conducted our audit in accordance with the standards of the PCAOB. Those standards require that we plan and perform the audit to obtain reasonable assurance about whether effective internal control over financial reporting was maintained in all material respects.
Our audit included obtaining an understanding of internal control over financial reporting, assessing the risk that a material weakness exists, testing and evaluating the design and operating effectiveness of internal control based on the assessed risk, and performing such other procedures as we considered necessary in the circumstances. We believe that our audit provides a reasonable basis for our opinion.
Definition and Limitations of Internal Control Over Financial Reporting
A company’s internal control over financial reporting is a process designed to provide reasonable assurance regarding the reliability of financial reporting and the preparation of financial statements for external purposes in accordance with generally accepted accounting principles. A company’s internal control over financial reporting includes those policies and procedures that (1) pertain to the maintenance of records that, in reasonable detail, accurately and fairly reflect the transactions and dispositions of the assets of the company; (2) provide reasonable assurance that transactions are recorded as necessary to permit preparation of financial statements in accordance with generally accepted accounting principles, and that receipts and expenditures of the company are being made only in accordance with authorizations of management and directors of the company; and (3) provide reasonable assurance regarding prevention or timely detection of unauthorized acquisition, use, or disposition of the company’s assets that could have a material effect on the financial statements.
Because of its inherent limitations, internal control over financial reporting may not prevent or detect misstatements. Also, projections of any evaluation of effectiveness to future periods are subject to the risk that controls may become inadequate because of changes in conditions, or that the degree of compliance with the policies or procedures may deteriorate.

Akron, Ohio
June 18, 2018
46 THE J. M. SMUCKER COMPANY
REPORT OF INDEPENDENT REGISTERED PUBLIC ACCOUNTING FIRM ON THE CONSOLIDATED FINANCIAL STATEMENTS
The J. M. Smucker Company
Board of Directors and Shareholders
The J. M. Smucker Company
Opinion on the Financial Statements
We have audited the accompanying consolidated balance sheets of The J. M. Smucker Company (the “Company”) as of April 30, 2018 and 2017, and the related statements of consolidated income, comprehensive income, shareholders’ equity, and cash flows for each of the three years in the period ended April 30, 2018, and the related notes (collectively referred to as the “consolidated financial statements”). In our opinion, the consolidated financial statements present fairly, in all material respects, the financial position of the Company at April 30, 2018 and 2017, and the results of its operations and its cash flows for each of the three years in the period ended April 30, 2018, in conformity with U.S. generally accepted accounting principles.
We also have audited, in accordance with the standards of the Public Company Accounting Oversight Board (United States) (“PCAOB”), the Company’s internal control over financial reporting as of April 30, 2018, based on criteria established in Internal Control – Integrated Framework issued by the Committee of Sponsoring Organizations of the Treadway Commission (2013 framework), and our report dated June 18, 2018, expressed an unqualified opinion thereon.
Basis for Opinion
These financial statements are the responsibility of the Company’s management. Our responsibility is to express an opinion on the Company’s financial statements based on our audits. We are a public accounting firm registered with the PCAOB and are required to be independent with respect to the Company in accordance with the U.S. federal securities laws and the applicable rules and regulations of the Securities and Exchange Commission and the PCAOB.
We conducted our audits in accordance with the standards of the PCAOB. Those standards require that we plan and perform the audit to obtain reasonable assurance about whether the financial statements are free of material misstatement, whether due to error or fraud. Our audits included performing procedures to assess the risks of material misstatement of the financial statements, whether due to error or fraud, and performing procedures that respond to those risks. Such procedures included examining, on a test basis, evidence regarding the amounts and disclosures in the financial statements. Our audits also included evaluating the accounting principles used and significant estimates made by management, as well as evaluating the overall presentation of the financial statements. We believe that our audits provide a reasonable basis for our opinion.

We have served as the Company’s auditor since 1955.
Akron, Ohio
June 18, 2018
2018 ANNUAL REPORT 47
REPORT OF MANAGEMENT ON RESPONSIBILITY
FOR FINANCIAL REPORTING
The J. M. Smucker Company
Shareholders
The J. M. Smucker Company
Management of The J. M. Smucker Company is responsible for the preparation, integrity, accuracy, and consistency of the consolidated financial statements and the related financial information in this report. Such information has been prepared in accordance with U.S. generally accepted accounting principles and is based on our best estimates and judgments.
We maintain systems of internal accounting controls supported by formal policies and procedures that are communicated throughout the Company. There is a program of audits performed by our internal audit staff designed to evaluate the adequacy of and adherence to these controls, policies, and procedures.
Ernst & Young LLP, an independent registered public accounting firm, has audited our financial statements in accordance with the standards of the Public Company Accounting Oversight Board (United States). Management has made all financial records and related data available to Ernst & Young LLP during its audit.
Our audit committee, comprised of three independent non-employee members of the Board of Directors, meets regularly with the independent registered public accounting firm and management to review the work of the internal audit staff and the work, audit scope, timing arrangements, and fees of the independent registered public accounting firm. The audit committee also regularly satisfies itself as to the adequacy of controls, systems, and financial records. The director of the internal audit department is required to report directly to the audit committee as to internal audit matters.
It is our best judgment that our policies and procedures, our program of internal and independent audits, and the oversight activity of the audit committee work together to provide reasonable assurance that our operations are conducted according to law and in compliance with the high standards of business ethics and conduct to which we subscribe.
Mark T. Smucker | Mark R. Belgya | |||
President and | Vice Chair and | |||
Chief Executive Officer | Chief Financial Officer | |||
48 THE J. M. SMUCKER COMPANY
STATEMENTS OF CONSOLIDATED INCOME
The J. M. Smucker Company
Year Ended April 30, | |||||||||||
(Dollars in millions, except per share data) | 2018 | 2017 | 2016 | ||||||||
Net sales | $ | 7,357.1 | $ | 7,392.3 | $ | 7,811.2 | |||||
Cost of products sold | 4,521.0 | 4,557.0 | 4,843.4 | ||||||||
Gross Profit | 2,836.1 | 2,835.3 | 2,967.8 | ||||||||
Selling, distribution, and administrative expenses | 1,370.8 | 1,390.7 | 1,510.3 | ||||||||
Amortization | 206.8 | 207.3 | 208.4 | ||||||||
Goodwill impairment charge | 145.0 | — | — | ||||||||
Other intangible assets impairment charges | 31.9 | 133.2 | — | ||||||||
Other special project costs (A) | 45.4 | 76.9 | 135.9 | ||||||||
Other operating expense (income) – net | 0.1 | (4.3 | ) | (32.1 | ) | ||||||
Operating Income | 1,036.1 | 1,031.5 | 1,145.3 | ||||||||
Interest expense – net | (174.1 | ) | (163.1 | ) | (171.1 | ) | |||||
Other income (expense) – net | (1.0 | ) | 10.0 | 3.7 | |||||||
Income Before Income Taxes | 861.0 | 878.4 | 977.9 | ||||||||
Income tax expense (benefit) | (477.6 | ) | 286.1 | 289.2 | |||||||
Net Income | $ | 1,338.6 | $ | 592.3 | $ | 688.7 | |||||
Earnings per common share: | |||||||||||
Net Income | $ | 11.79 | $ | 5.11 | $ | 5.77 | |||||
Net Income – Assuming Dilution | $ | 11.78 | $ | 5.10 | $ | 5.76 | |||||
Dividends Declared per Common Share | $ | 3.12 | $ | 3.00 | $ | 2.68 | |||||
(A) | Other special project costs includes integration and restructuring costs. For more information, see Note 3: Integration and Restructuring Costs. |
See notes to consolidated financial statements.
STATEMENTS OF CONSOLIDATED COMPREHENSIVE INCOME
The J. M. Smucker Company
Year Ended April 30, | |||||||||||
(Dollars in millions) | 2018 | 2017 | 2016 | ||||||||
Net income | $ | 1,338.6 | $ | 592.3 | $ | 688.7 | |||||
Other comprehensive income (loss): | |||||||||||
Foreign currency translation adjustments | 26.6 | (29.9 | ) | (10.8 | ) | ||||||
Cash flow hedging derivative activity, net of tax | 2.0 | 0.4 | 0.4 | ||||||||
Pension and other postretirement benefit plans activity, net of tax | 14.3 | 34.1 | (28.5 | ) | |||||||
Available-for-sale securities activity, net of tax | (1.2 | ) | 0.4 | 0.3 | |||||||
Total Other Comprehensive Income (Loss) | 41.7 | 5.0 | (38.6 | ) | |||||||
Comprehensive Income | $ | 1,380.3 | $ | 597.3 | $ | 650.1 | |||||
See notes to consolidated financial statements.
2018 ANNUAL REPORT 49
CONSOLIDATED BALANCE SHEETS
The J. M. Smucker Company
ASSETS
April 30, | |||||||
(Dollars in millions) | 2018 | 2017 | |||||
Current Assets | |||||||
Cash and cash equivalents | $ | 192.6 | $ | 166.8 | |||
Trade receivables, less allowance for doubtful accounts | 385.6 | 438.7 | |||||
Inventories: | |||||||
Finished products | 542.1 | 562.4 | |||||
Raw materials | 312.3 | 343.3 | |||||
Total Inventory | 854.4 | 905.7 | |||||
Other current assets | 122.4 | 130.6 | |||||
Total Current Assets | 1,555.0 | 1,641.8 | |||||
Property, Plant, and Equipment | |||||||
Land and land improvements | 120.1 | 115.6 | |||||
Buildings and fixtures | 812.6 | 766.2 | |||||
Machinery and equipment | 2,111.5 | 1,983.0 | |||||
Construction in progress | 212.1 | 116.9 | |||||
Gross Property, Plant, and Equipment | 3,256.3 | 2,981.7 | |||||
Accumulated depreciation | (1,527.2 | ) | (1,364.2 | ) | |||
Total Property, Plant, and Equipment | 1,729.1 | 1,617.5 | |||||
Other Noncurrent Assets | |||||||
Goodwill | 5,942.2 | 6,077.1 | |||||
Other intangible assets – net | 5,916.5 | 6,149.9 | |||||
Other noncurrent assets | 158.4 | 153.4 | |||||
Total Other Noncurrent Assets | 12,017.1 | 12,380.4 | |||||
Total Assets | $ | 15,301.2 | $ | 15,639.7 | |||
See notes to consolidated financial statements.
50 THE J. M. SMUCKER COMPANY
CONSOLIDATED BALANCE SHEETS
The J. M. Smucker Company
LIABILITIES AND SHAREHOLDERS’ EQUITY
April 30, | |||||||
(Dollars in millions) | 2018 | 2017 | |||||
Current Liabilities | |||||||
Accounts payable | $ | 512.1 | $ | 477.2 | |||
Accrued compensation | 79.8 | 88.2 | |||||
Accrued trade marketing and merchandising | 101.6 | 106.0 | |||||
Dividends payable | 88.6 | 85.1 | |||||
Current portion of long-term debt | — | 499.0 | |||||
Short-term borrowings | 144.0 | 454.0 | |||||
Other current liabilities | 107.7 | 123.1 | |||||
Total Current Liabilities | 1,033.8 | 1,832.6 | |||||
Noncurrent Liabilities | |||||||
Long-term debt, less current portion | 4,688.0 | 4,445.5 | |||||
Defined benefit pensions | 144.1 | 189.8 | |||||
Other postretirement benefits | 61.9 | 66.6 | |||||
Deferred income taxes | 1,377.2 | 2,167.0 | |||||
Other noncurrent liabilities | 105.1 | 88.0 | |||||
Total Noncurrent Liabilities | 6,376.3 | 6,956.9 | |||||
Total Liabilities | 7,410.1 | 8,789.5 | |||||
Shareholders’ Equity | |||||||
Serial preferred shares – no par value: Authorized – 6,000,000 shares; outstanding – none | — | — | |||||
Common shares – no par value: Authorized – 300,000,000 shares; outstanding – 113,572,840 at April 30, 2018, and 113,439,553 at April 30, 2017 (net of 32,924,890 and 33,058,177 treasury shares, respectively), at stated value | 28.9 | 28.4 | |||||
Additional capital | 5,739.7 | 5,724.7 | |||||
Retained income | 2,239.2 | 1,240.5 | |||||
Accumulated other comprehensive income (loss) | (116.7 | ) | (143.4 | ) | |||
Total Shareholders’ Equity | 7,891.1 | 6,850.2 | |||||
Total Liabilities and Shareholders’ Equity | $ | 15,301.2 | $ | 15,639.7 | |||
See notes to consolidated financial statements.
2018 ANNUAL REPORT 51
STATEMENTS OF CONSOLIDATED CASH FLOWS
The J. M. Smucker Company
Year Ended April 30, | ||||||||||||||||
(Dollars in millions) | 2018 | 2017 | 2016 | |||||||||||||
Operating Activities | ||||||||||||||||
Net income | $ | 1,338.6 | $ | 592.3 | $ | 688.7 | ||||||||||
Adjustments to reconcile net income to net cash provided by (used for) operations: | ||||||||||||||||
Depreciation | 206.3 | 211.7 | 221.7 | |||||||||||||
Amortization | 206.8 | 207.3 | 208.4 | |||||||||||||
Goodwill impairment charge | 145.0 | — | — | |||||||||||||
Other intangible assets impairment charges | 31.9 | 133.2 | — | |||||||||||||
Share-based compensation expense | 15.4 | 22.0 | 34.6 | |||||||||||||
Gain on divestiture | — | — | (25.3 | ) | ||||||||||||
Deferred income tax expense (benefit) | (803.4 | ) | (79.4 | ) | (95.2 | ) | ||||||||||
Loss on disposal of assets – net | 6.6 | 4.4 | 5.6 | |||||||||||||
Other noncash adjustments – net | 3.7 | 0.4 | (2.2 | ) | ||||||||||||
Defined benefit pension contributions | (39.6 | ) | (28.7 | ) | (8.6 | ) | ||||||||||
Changes in assets and liabilities, net of effect from businesses acquired: | ||||||||||||||||
Trade receivables | 54.7 | 8.9 | (21.9 | ) | ||||||||||||
Inventories | 54.0 | (10.4 | ) | 240.1 | ||||||||||||
Other current assets | (5.3 | ) | 8.9 | 14.6 | ||||||||||||
Accounts payable | 19.0 | 2.1 | 46.1 | |||||||||||||
Accrued liabilities | 20.5 | (39.8 | ) | 2.4 | ||||||||||||
Income and other taxes | (28.7 | ) | 7.9 | 146.9 | ||||||||||||
Other – net | (7.5 | ) | 18.2 | 5.1 | ||||||||||||
Net Cash Provided by (Used for) Operating Activities | 1,218.0 | 1,059.0 | 1,461.0 | |||||||||||||
Investing Activities | ||||||||||||||||
Businesses acquired, net of cash acquired | — | — | 7.9 | |||||||||||||
Equity investment in affiliate | — | — | (16.0 | ) | ||||||||||||
Additions to property, plant, and equipment | (321.9 | ) | (192.4 | ) | (201.4 | ) | ||||||||||
Proceeds from divestiture | — | — | 193.7 | |||||||||||||
Proceeds from sale of investment | — | 40.6 | — | |||||||||||||
Proceeds from disposal of property, plant, and equipment | 13.4 | 0.5 | 4.0 | |||||||||||||
Other – net | 30.9 | (38.4 | ) | 33.5 | ||||||||||||
Net Cash Provided by (Used for) Investing Activities | (277.6 | ) | (189.7 | ) | 21.7 | |||||||||||
Financing Activities | ||||||||||||||||
Short-term borrowings (repayments) – net | (310.0 | ) | 170.0 | 58.0 | ||||||||||||
Proceeds from long-term debt | 799.6 | — | — | |||||||||||||
Repayments of long-term debt | (1,050.3 | ) | (200.0 | ) | (800.0 | ) | ||||||||||
Quarterly dividends paid | (350.3 | ) | (339.3 | ) | (316.6 | ) | ||||||||||
Purchase of treasury shares | (7.0 | ) | (437.6 | ) | (441.1 | ) | ||||||||||
Other – net | (4.0 | ) | 0.8 | 0.8 | ||||||||||||
Net Cash Provided by (Used for) Financing Activities | (922.0 | ) | (806.1 | ) | (1,498.9 | ) | ||||||||||
Effect of exchange rate changes on cash | 7.4 | (6.2 | ) | 0.4 | ||||||||||||
Net increase (decrease) in cash and cash equivalents | 25.8 | 57.0 | (15.8 | ) | ||||||||||||
Cash and cash equivalents at beginning of year | 166.8 | 109.8 | 125.6 | |||||||||||||
Cash and Cash Equivalents at End of Year | $ | 192.6 | $ | 166.8 | $ | 109.8 | ||||||||||
( ) | Denotes use of cash |
See notes to consolidated financial statements.
52 THE J. M. SMUCKER COMPANY
STATEMENTS OF CONSOLIDATED SHAREHOLDERS’ EQUITY
The J. M. Smucker Company
(Dollars in millions) | Common Shares Outstanding | Common Shares | Additional Capital | Retained Income | Amount Due from ESOP Trust | Accumulated Other Comprehensive Income (Loss) | Total Shareholders’ Equity | |||||||||||||||||||
Balance at May 1, 2015 | 119,577,333 | $ | 29.9 | $ | 6,007.7 | $ | 1,159.2 | $ | (0.1 | ) | $ | (109.8 | ) | $ | 7,086.9 | |||||||||||
Net income | 688.7 | 688.7 | ||||||||||||||||||||||||
Other comprehensive income (loss) | (38.6 | ) | (38.6 | ) | ||||||||||||||||||||||
Comprehensive Income | 650.1 | |||||||||||||||||||||||||
Purchase of treasury shares | (3,451,591 | ) | (0.9 | ) | (177.9 | ) | (262.3 | ) | (441.1 | ) | ||||||||||||||||
Stock plans (includes tax benefit of $2.7) | 181,152 | 0.1 | 30.7 | 30.8 | ||||||||||||||||||||||
Cash dividends declared | (317.9 | ) | (317.9 | ) | ||||||||||||||||||||||
Other | (0.4 | ) | 0.1 | (0.3 | ) | |||||||||||||||||||||
Balance at April 30, 2016 | 116,306,894 | 29.1 | 5,860.1 | 1,267.7 | — | (148.4 | ) | 7,008.5 | ||||||||||||||||||
Net income | 592.3 | 592.3 | ||||||||||||||||||||||||
Other comprehensive income (loss) | 5.0 | 5.0 | ||||||||||||||||||||||||
Comprehensive Income | 597.3 | |||||||||||||||||||||||||
Purchase of treasury shares | (3,147,659 | ) | (0.8 | ) | (163.6 | ) | (273.2 | ) | (437.6 | ) | ||||||||||||||||
Stock plans | 280,318 | 0.1 | 28.1 | 28.2 | ||||||||||||||||||||||
Cash dividends declared | (346.5 | ) | (346.5 | ) | ||||||||||||||||||||||
Other | 0.1 | 0.2 | 0.3 | |||||||||||||||||||||||
Balance at April 30, 2017 | 113,439,553 | 28.4 | 5,724.7 | 1,240.5 | — | (143.4 | ) | 6,850.2 | ||||||||||||||||||
Net income | 1,338.6 | 1,338.6 | ||||||||||||||||||||||||
Other comprehensive income (loss) | 41.7 | 41.7 | ||||||||||||||||||||||||
Comprehensive Income | 1,380.3 | |||||||||||||||||||||||||
Purchase of treasury shares | (54,535 | ) | — | (5.8 | ) | (1.2 | ) | (7.0 | ) | |||||||||||||||||
Stock plans | 187,822 | — | 21.3 | 21.3 | ||||||||||||||||||||||
Cash dividends declared | (353.7 | ) | (353.7 | ) | ||||||||||||||||||||||
Reclassification of stranded tax effects (A) | 15.0 | (15.0 | ) | — | ||||||||||||||||||||||
Other | 0.5 | (0.5 | ) | — | ||||||||||||||||||||||
Balance at April 30, 2018 | 113,572,840 | $ | 28.9 | $ | 5,739.7 | $ | 2,239.2 | $ | — | $ | (116.7 | ) | $ | 7,891.1 | ||||||||||||
(A) | During the fourth quarter of 2018, we elected to early adopt ASU 2018-02, Income Statement – Reporting Comprehensive Income (Topic 220) Reclassification of Certain Tax Effects from Accumulated Other Comprehensive Income, which allowed us to reclassify the stranded income tax effects resulting from the Act from accumulated other comprehensive income (loss) to retained earnings. For additional information, see Recently Issued Accounting Standards in Note 1: Accounting Policies, and Note 13: Income Taxes. |
See notes to consolidated financial statements.
2018 ANNUAL REPORT 53
NOTES TO CONSOLIDATED FINANCIAL STATEMENTS
The J. M. Smucker Company
(Dollars and shares in millions, unless otherwise noted, except per share data)
NOTE 1 | ACCOUNTING POLICIES | |
Principles of Consolidation: The consolidated financial statements include the accounts of the Company, its wholly-owned subsidiaries, and its majority-owned investments, if any. Intercompany transactions and accounts are eliminated in consolidation.
Use of Estimates: The preparation of consolidated financial statements in conformity with U.S. generally accepted accounting principles (“GAAP”) requires that we make certain estimates and assumptions that affect the amounts reported in the consolidated financial statements and accompanying notes. Significant estimates in these consolidated financial statements include: estimates of future cash flows associated with assets, potential asset impairments, useful lives and residual values of long-lived assets used in determining depreciation and amortization, net realizable value of inventories, accruals for trade marketing and merchandising programs, income taxes, and the determination of discount and other assumptions for defined benefit pension and other postretirement benefit expenses. Actual results could differ from these estimates.
Cash and Cash Equivalents: We consider all short-term, highly-liquid investments with a maturity of three months or less when purchased to be cash equivalents.
Revenue Recognition: We recognize revenue when all of the following criteria have been met: a valid customer order with a determinable price has been received; title and risk of loss have transferred to the customer; there is no further significant obligation to assist in the resale of the product; and collectibility is reasonably assured. Our products are shipped with FOB destination terms, with the exception of certain export customers and those customers who elect to pick up.
Trade marketing and merchandising program costs are classified as a reduction of sales. A provision for estimated returns and allowances is recognized as a reduction of sales at the time revenue is recognized.
Trade Marketing and Merchandising Programs: In order to support our products, various promotional activities are conducted through retail trade, distributors, or directly with consumers, including in-store display and product placement programs, feature price discounts, coupons, and other similar activities. We regularly review and revise, when we deem necessary, estimates of costs for these promotional programs based on estimates of what will be redeemed by retail trade, distributors, or consumers. These estimates are made using various techniques, including historical data on performance of similar promotional programs. Differences between estimated expenditures and actual performance are recognized as a change in estimate in a subsequent period. During 2018, 2017, and 2016, subsequent period adjustments approximated less than 2 percent of both consolidated pre-tax income and cash provided by operating activities. Total promotional expenditures, including amounts classified as a reduction of sales, represented 35 percent, 33 percent, and 31 percent of net sales in 2018, 2017, and 2016, respectively. The possibility exists that reported results could be different if factors such as the level and success of the promotional programs or other conditions differ from expectations.
Shipping and Handling Costs: Transportation costs included in cost of products sold relate to the costs incurred to ship our products. Distribution costs are included in selling, distribution, and administrative (“SD&A”) expenses and relate to the warehousing costs incurred to store our products. Total distribution costs recorded within SD&A were $245.4, $252.9, and $236.1 in 2018, 2017, and 2016, respectively.
Advertising Expense: Advertising costs are expensed as incurred. Advertising expense was $194.2, $169.8, and $170.3 in 2018, 2017, and 2016, respectively.
Research and Development Costs: Research and development (“R&D”) costs are expensed as incurred and are included in SD&A in the Statements of Consolidated Income. R&D costs include expenditures for new product and manufacturing process innovation, which are comprised primarily of internal salaries and wages, consulting, and other supplies attributable to time spent on R&D activities. Other costs include the depreciation and maintenance of research facilities. Total R&D expense was $56.0, $58.1, and $58.8 in 2018, 2017, and
2016, respectively.
Share-Based Payments: Share-based compensation expense, excluding stock options, is recognized on a straight-line basis over the requisite service period, which includes a one-year performance period plus the defined forfeiture period, which is typically four years of service or the attainment of a defined age and years of service. Compensation expense related to stock options is recognized ratably over
54 THE J. M. SMUCKER COMPANY
NOTES TO CONSOLIDATED FINANCIAL STATEMENTS
The J. M. Smucker Company
the service period for each vesting tranche from the grant date through the end of the requisite service period if it is probable that the performance criteria will be met. The stock options vest over a period of one to three years, dependent on continued service of the option holder, as well as the achievement of the performance objectives established on the grant date.
The following table summarizes amounts related to share-based payments.
Year Ended April 30, | |||||||||||
2018 | 2017 | 2016 | |||||||||
Share-based compensation expense included in SD&A | $ | 13.7 | $ | 22.3 | $ | 26.3 | |||||
Share-based compensation expense (benefit) included in other special project costs | 1.7 | (0.3 | ) | (A) | 8.3 | ||||||
Total share-based compensation expense | $ | 15.4 | $ | 22.0 | $ | 34.6 | |||||
Related income tax benefit | $ | 4.6 | $ | 7.2 | $ | 10.2 | |||||
(A) | During 2017, we concluded that a portion of the performance objectives were unachievable, and therefore reversed the life-to-date compensation cost recognized. For additional information, see Note 12: Share-Based Payments. |
As of April 30, 2018, total unrecognized share-based compensation cost related to nonvested share-based awards was $42.6. The weighted-average period over which this amount is expected to be recognized is 3.4 years.
Prior to adoption of Accounting Standards Update (“ASU”) 2016-09, Stock Compensation (Topic 718) Improvements to Employee Share-Based Payment Accounting, realized excess tax benefits were presented in the Statements of Consolidated Cash Flows as a financing activity and were credited to additional capital in the Consolidated Balance Sheets. Realized shortfall tax benefits, amounts which are less than those previously recognized in earnings, were first offset against the cumulative balance of excess tax benefits, if any, and then charged directly to income tax expense. Upon adoption of ASU 2016-09, realized excess tax benefits are presented in the Statements of Consolidated Cash Flows as an operating activity and are recognized within income taxes in the Statements of Consolidated Income. For 2018, 2017, and 2016, the excess tax benefits realized upon exercise or vesting of share-based compensation were $1.5, $3.3, and $2.7, respectively. For further discussion on share-based compensation expense, see Note 12: Share-Based Payments.
Defined Contribution Plans: We offer employee savings plans for domestic and Canadian employees. Our contributions under these plans are based on a specified percentage of employee contributions. Charges to operations for these plans in 2018, 2017, and 2016 were $36.3, $31.9, and $25.9, respectively. For information on our defined benefit plans, see Note 9: Pensions and Other Postretirement Benefits.
Income Taxes: We account for income taxes using the liability method. Accordingly, deferred tax assets and liabilities are recognized for the future tax consequences attributable to differences between financial statement carrying amounts of existing assets and liabilities and their respective tax bases. Deferred tax assets and liabilities are measured using enacted tax rates expected to apply to taxable income in the years in which those temporary differences are expected to be recovered or settled. The effect on deferred tax assets and liabilities of a change in the applicable tax rate is recognized in income or expense in the period that the change is enacted. A valuation allowance is established when it is more likely than not that all or a portion of a deferred tax asset will not be realized. A tax benefit is recognized when it is more likely than not to be sustained.
We account for the financial statement recognition and measurement criteria of a tax position taken or expected to be taken in a tax return under Financial Accounting Standards Board (“FASB”) Accounting Standards Codification (“ASC”) 740, Income Taxes. ASC 740 also provides guidance on derecognition, classification, interest and penalties, accounting in interim periods, and disclosure. In accordance
with the requirements of ASC 740, uncertain tax positions have been classified in the Consolidated Balance Sheets as noncurrent, except
to the extent payment is expected within one year. We recognize net interest and penalties related to unrecognized tax benefits in income
tax expense.
On December 22, 2017, the U.S. government enacted “An Act to Provide for Reconciliation Pursuant to Titles II and V of the Concurrent Resolution on the Budget for Fiscal Year 2018” (the “Act”), which is commonly referred to as “The Tax Cuts and Jobs Act.” The Act provides for comprehensive tax legislation that reduces the U.S. federal statutory corporate tax rate from 35.0 percent to 21.0 percent effective January 1, 2018, broadens the U.S. federal income tax base, requires companies to pay a one-time repatriation tax on earnings of certain foreign subsidiaries that were previously tax deferred, and introduces new taxes on certain foreign-sourced earnings. The provisional effect of the rate reduction and other pronouncements of the Act on our deferred tax asset and liability, and current and noncurrent tax payable balances have been accounted for in our 2018 financial statements, in accordance with recently issued
ASU 2018-05, Amendments to SEC Paragraphs Pursuant to SEC Staff Accounting Bulletin No. 118, which allows a measurement period of up to one year after the enactment date to finalize our initial accounting for the impacts of the Act. For additional information, see Note 13: Income Taxes.
2018 ANNUAL REPORT 55
NOTES TO CONSOLIDATED FINANCIAL STATEMENTS
The J. M. Smucker Company
Trade Receivables: In the normal course of business, we extend credit to customers. Trade receivables, less allowances, reflects the net realizable value of receivables and approximates fair value. We evaluate our trade receivables and establish an allowance for doubtful accounts based on a combination of factors. When aware that a specific customer has been impacted by circumstances such as bankruptcy filings or deterioration in the customer’s operating results or financial position, potentially making it unable to meet its financial obligations, we record a specific reserve for bad debt to reduce the related receivable to the amount we reasonably believe is collectible. We also record reserves for bad debt for all other customers based on a variety of factors, including the length of time the receivables are past due, historical collection experience, and an evaluation of current and projected economic conditions at the balance sheet date. Trade receivables are charged off against the allowance after we determine that the potential for recovery is remote. At April 30, 2018 and 2017, the allowance for doubtful accounts was $1.1 and $1.6, respectively. We believe there is no concentration of risk with any single customer whose failure or nonperformance would materially affect results other than as discussed in Note 5: Reportable Segments.
Inventories: Inventories are stated at the lower of cost or market, with market being defined as net realizable value, less costs to sell. Cost for all inventories is determined using the first-in, first-out method applied on a consistent basis.
The cost of finished products and work-in-process inventory includes materials, direct labor, and overhead. Work-in-process is included in finished products in the Consolidated Balance Sheets and was $80.9 and $72.2 at April 30, 2018 and 2017, respectively.
Derivative Financial Instruments: We account for derivative instruments in accordance with FASB ASC 815, Derivatives and Hedging, which requires all derivative instruments to be recognized in the financial statements and measured at fair value, regardless of the purpose or intent for holding them.
We do not qualify commodity derivatives or instruments used to manage foreign currency exchange exposures for hedge accounting treatment and, as a result, the derivative gains and losses are immediately recognized in earnings. Although we do not perform the assessments required to achieve hedge accounting for derivative positions, we believe all of our derivatives are economic hedges of our risk exposure. The exposures hedged have a high inverse correlation to price changes of the derivative instrument. Thus, we would expect that over time any gain or loss in the estimated fair value of the derivatives would generally be offset by an increase or decrease in the estimated fair value of the underlying exposures.
We utilize derivative instruments to manage changes in the fair value and cash flows of our debt. Interest rate contracts mitigate the risk associated with the underlying hedged item. At the inception of the contract, the instrument is evaluated and documented for hedge accounting treatment. If the contract is designated as a cash flow hedge, the mark-to-market gains or losses on the contract are deferred and included as a component of accumulated other comprehensive income (loss), and reclassified to interest expense in the period during which the hedged transaction affects earnings. If the contract is designated as a fair value hedge, the contract is recognized at fair value on the balance sheet, and changes in the fair value are recognized in interest expense. Generally, changes in the fair value of the contract are equal to changes in the fair value of the underlying debt and have no net impact on earnings.
Property, Plant, and Equipment: Property, plant, and equipment is recognized at cost and is depreciated on a straight-line basis over the estimated useful life of the asset (3 to 20 years for machinery and equipment, 1 to 7 years for capitalized software costs, and
5 to 40 years for buildings, fixtures, and improvements).
We lease certain land, buildings, and equipment for varying periods of time, with renewal options. Rent expense in 2018, 2017, and 2016 totaled $95.2, $101.0, and $92.5, respectively. As of April 30, 2018, our minimum operating lease obligations were as follows: $42.8 in 2019, $37.5 in 2020, $33.3 in 2021, $29.9 in 2022, and $29.1 in 2023.
In accordance with FASB ASC 360, Property, Plant, and Equipment, long-lived assets, other than goodwill and other indefinite-lived intangible assets, are reviewed for impairment when circumstances indicate the carrying value of an asset may not be recoverable. Recoverability of assets to be held and used is measured by a comparison of the carrying amount of the assets to future net undiscounted cash flows we estimate to be generated by such assets. If such assets are considered to be impaired, the impairment to be recognized is the amount by which the carrying amount of the assets exceeds their estimated fair value. Assets to be disposed of by sale are recognized as held for sale at the lower of carrying value or fair value less costs to sell.
Goodwill and Other Intangible Assets: Goodwill is the excess of the purchase price paid over the estimated fair value of the net assets of a business acquired. In accordance with FASB ASC 350, Intangibles – Goodwill and Other, goodwill and other indefinite-lived intangible assets are not amortized but are reviewed at least annually for impairment. We conduct our annual test for impairment of goodwill and other indefinite-lived intangible assets as of February 1 of each year. As of the current year annual impairment test date, we had seven reporting units. A discounted cash flow valuation technique was utilized to estimate the fair value of our reporting units and indefinite-lived intangible assets. We also used a market-based approach to estimate the fair value of our reporting units. The discount rates
56 THE J. M. SMUCKER COMPANY
NOTES TO CONSOLIDATED FINANCIAL STATEMENTS
The J. M. Smucker Company
utilized in the cash flow analyses were developed using a weighted-average cost of capital methodology. In addition to the annual test, we test for impairment if events or circumstances occur that would more likely than not reduce the fair value of a reporting unit or an indefinite-lived intangible asset below its carrying amount. Finite-lived intangible assets are amortized on a straight-line basis over their estimated useful lives, which are evaluated on an annual basis. For additional information, see Note 7: Goodwill and Other Intangible Assets.
Marketable Securities and Other Investments: We maintain funds for the payment of benefits associated with nonqualified retirement plans. These funds include investments considered to be available-for-sale marketable securities. At April 30, 2018 and 2017,
the fair value of these investments was $45.8 and $47.3, respectively, and was included in other noncurrent assets in the Consolidated Balance Sheets. Included in accumulated other comprehensive income (loss) at April 30, 2018 and 2017, were unrealized pre-tax gains of $4.7 and $6.3, respectively.
Equity Method Investments: Investments in common stock of entities other than our consolidated subsidiaries are accounted for under the equity method in accordance with FASB ASC 323, Investments – Equity Method and Joint Ventures. Under the equity method, the initial investment is recorded at cost and the investment is subsequently adjusted for its proportionate share of earnings or losses, including consideration of basis differences resulting from the difference between the initial carrying amount of the investment and the underlying equity in net assets. The difference between the carrying amount of the investment and the underlying equity in net assets is primarily attributable to goodwill and other intangible assets.
During 2017, we sold our 25 percent equity interest in Guilin Seamild Biologic Technology Development Co., Ltd. (“Seamild”), a privately-owned manufacturer and marketer of oats products in China. We received proceeds from the sale of $40.6, net of transaction costs, and recognized a pre-tax gain of $3.8 during 2017. The initial investment in Seamild was in 2012 for $35.9 and was included in other noncurrent assets in the Consolidated Balance Sheets. The investment in Seamild did not have a material impact on International and Away From Home or the consolidated financial statements for the year ended April 30, 2017.
Additionally, we have a 20 percent equity interest in Mountain Country Foods, LLC, and a 44 percent equity interest in Numi, Inc. The carrying amount of these investments is included in other noncurrent assets in the Consolidated Balance Sheets. The investments did not have a material impact on the consolidated financial statements or the respective reportable segment to which they relate for the years ended April 30, 2018 and 2017.
Foreign Currency Translation: Assets and liabilities of foreign subsidiaries are translated using the exchange rates in effect at the balance sheet dates, while income and expenses are translated using average rates throughout the periods. Translation adjustments are reported as a component of shareholders’ equity in accumulated other comprehensive income (loss). Included in accumulated other comprehensive income (loss) at April 30, 2018 and 2017, were foreign currency losses of $16.4 and $43.0, respectively.
Recently Issued Accounting Standards: In March 2018, the FASB issued ASU 2018-05, Amendments to SEC Paragraphs Pursuant to SEC Staff Accounting Bulletin No. 118, which amends FASB ASC 740 to add the Securities and Exchange Commission’s (“SEC”) guidance in Staff Accounting Bulletin (“SAB”) 118 concerning the application of U.S. GAAP when preparing the initial accounting for the income tax effects of the Act, which was enacted on December 22, 2017. SAB 118 addresses the specific situation in which the initial accounting for certain income tax effects of the Act will not be complete at the time that financial statements are issued covering the reporting period that includes the enactment date, specifically allowing a measurement period of up to one year after the enactment date to finalize our initial accounting for the impacts of the Act. For additional information, see Note 13: Income Taxes.
In February 2018, the FASB issued ASU 2018-02, Income Statement – Reporting Comprehensive Income (Topic 220) Reclassification of Certain Tax Effects from Accumulated Other Comprehensive Income, which allows a reclassification of the income tax effects of the enactment of the Act on items that are stranded in accumulated other comprehensive income to retained earnings. This standard also requires certain disclosures about stranded tax effects. This ASU, however, does not change the underlying guidance that requires that the effect of a change in tax laws or rates be included in income from continuing operations. ASU 2018-02 is effective for us on May 1, 2019, but we have elected to early adopt as of February 1, 2018, as permitted, so that the tax effects of items within accumulated other comprehensive income are reflected at the appropriate tax rate. Early adoption of this ASU had an overall immaterial impact on our financial statements and disclosures. For additional information, see Note 13: Income Taxes.
In August 2017, the FASB issued ASU 2017-12, Derivatives and Hedging (Topic 815) Targeted Improvements to Accounting for Hedging Activities, which simplifies the application of hedge accounting and enables companies to better portray the economics of their risk management activities in their financial statements. ASU 2017-12 is effective for us on May 1, 2019, but we have elected to early adopt during the second quarter of 2018, as permitted. Early adoption of this ASU had an overall immaterial impact on our financial statements and disclosures. For additional information, see Note 10: Derivative Financial Instruments.
2018 ANNUAL REPORT 57
NOTES TO CONSOLIDATED FINANCIAL STATEMENTS
The J. M. Smucker Company
In March 2017, the FASB issued ASU 2017-07, Compensation – Retirement Benefits (Topic 715) Improving the Presentation of Net Periodic Pension Cost and Net Periodic Postretirement Benefit Cost, which requires the service cost component of the net periodic pension cost to be presented separately from the other components of the net periodic pension cost in the income statement. Additionally, only the service cost component of the net periodic pension cost will be eligible for capitalization. ASU 2017-07 will be effective for us on May 1, 2018. The change in presentation of service cost must be applied retrospectively, while the capitalization of service cost must be applied on a prospective basis. We do not anticipate that the adoption of this ASU will have a material impact on our financial statements and disclosures.
In January 2017, the FASB issued ASU 2017-04, Intangibles – Goodwill and Other (Topic 350) Simplifying the Test for Goodwill Impairment, which eliminates Step 2 from the goodwill impairment test and requires an impairment charge to be recorded based on the excess of a reporting unit’s carrying value over its fair value. ASU 2017-04 is effective for us on May 1, 2020, but we have elected to early adopt on a prospective basis during 2018, as permitted.
In October 2016, the FASB issued ASU 2016-16, Income Taxes (Topic 740) Intra-Entity Transfers of Assets Other Than Inventory, which requires the recognition of the income tax consequences of an intra-entity transfer of an asset, other than inventory, when the transfer occurs rather than deferring such recognition until the asset is sold to an outside party. ASU 2016-16 is effective for us on May 1, 2018, and it will require adoption on a modified retrospective basis through a cumulative-effect adjustment directly to retained earnings as of the beginning of the period of adoption. We do not anticipate that the adoption of this ASU will have a material impact on our financial statements and disclosures.
In August 2016, the FASB issued ASU 2016-15, Statement of Cash Flows (Topic 230) Classification of Certain Cash Receipts and Cash Payments, which will make changes to how certain cash receipts and cash payments are presented and classified in the statement of cash flows. ASU 2016-15 will be effective for us on May 1, 2018, and it will require adoption on a retrospective basis. We do not anticipate that the adoption of this ASU will have a material impact on the presentation of our financial statements and disclosures.
In February 2016, the FASB issued ASU 2016-02, Leases (Topic 842), which will require lessees to recognize a right-of-use asset and lease liability for all leases with terms of more than 12 months. ASU 2016-02 will be effective for us on May 1, 2019, with the option to early adopt at any time prior to the effective date. It requires a modified retrospective application for leases existing at, or entered into after, the beginning of the earliest comparative period presented and may exclude any leases that expired before the date of initial application. However, the FASB has recently proposed guidance that would allow adoption of the standard as of the effective date without restating prior periods. We are currently compiling an inventory of our lease arrangements in order to determine the impact the new guidance will have on our financial statements and disclosures. We have selected new lease accounting software in preparation for the standard’s additional reporting requirements and will begin implementation during the first quarter of 2019. Based on our assessment to date, we expect that the adoption of ASU 2016-02 will result in a significant increase in lease-related assets and liabilities recognized in our Consolidated Balance Sheets, but we are unable to quantify the impact at this time.
In May 2014, the FASB issued ASU 2014-09, Revenue from Contracts with Customers (Topic 606). The core principle of the new guidance is that an entity must recognize revenue to depict the transfer of promised goods or services to customers in an amount that reflects the consideration to which the entity expects to be entitled in exchange for those goods or services. It requires additional disclosures to enable users to understand the nature, amount, timing, and uncertainty of revenue and cash flows relating to customer contracts. ASU 2014-09 requires either full retrospective application to each prior reporting period presented or modified retrospective application with the cumulative effect of initially applying the standard recognized at the date of adoption. In August 2015, the FASB issued ASU 2015-14, Revenue from Contracts with Customers (Topic 606) Deferral of the Effective Date, which extends the standard’s effective date by one year. As a result of this issuance, the standard will be effective for us on May 1, 2018. Our implementation of the standard is complete, with the exception of evaluating the newly acquired Ainsworth Pet Nutrition, LLC (“Ainsworth”) business. With the involvement of a cross-functional team, we performed a detailed review of the new guidance as compared to our current policies to identify any potential accounting differences. We then reviewed contracts from each of our significant revenue streams to determine the validity of our initial conclusions. We have not identified any accounting changes that will materially impact our financial statements, and therefore we intend to utilize the modified retrospective transition method.
Risks and Uncertainties: The raw materials we use are primarily commodities, agricultural-based products, and packaging materials. The principal packaging materials we use are plastic, glass, metal cans, caps, carton board, and corrugate. Green coffee, peanuts, oils and fats, protein meals, sweeteners, grains, fruit, and other ingredients are obtained from various suppliers. The availability, quality, and cost of many of these commodities have fluctuated, and may continue to fluctuate over time. Green coffee is sourced solely from foreign countries, and its supply and price are subject to high volatility due to factors such as weather, global supply and demand, plant disease, investor speculation, and political and economic conditions in the source countries. Raw materials are generally available from numerous sources, although we have elected to source certain plastic packaging materials and finished goods, such as our Pup-Peroni® dog snacks, from
58 THE J. M. SMUCKER COMPANY
NOTES TO CONSOLIDATED FINANCIAL STATEMENTS
The J. M. Smucker Company
single sources of supply pursuant to long-term contracts. While availability may vary from year to year, we believe that we will continue to be able to obtain adequate supplies and that alternatives to single-sourced materials are available. We have not historically encountered significant shortages of key raw materials. We consider our relationships with key material suppliers to be in good standing.
We have consolidated our production capacity for certain products, including substantially all of our coffee, Milk-Bone® dog snacks, fruit spreads, toppings, syrups, and Uncrustables® frozen sandwiches, into single manufacturing sites. Although steps are taken at all of our manufacturing sites to reduce the likelihood of a production disruption, an interruption at a single manufacturing site would result in a reduction or elimination of the availability of some of our products for a period of time.
Of our total employees, 28 percent are covered by union contracts at 10 manufacturing locations. The contracts vary in term, with one contract expiring in 2019, representing less than 1 percent of our total employees.
We insure our business and assets in each country against insurable risks, to the extent that we deem appropriate, based upon an analysis of the relative risks and costs.
NOTE 2 | ACQUISITIONS | |
During the fourth quarter of 2018, we announced a definitive agreement to acquire the stock of Ainsworth. On May 14, 2018, we completed the all-cash transaction, valued at $1.9 billion, which was funded with a new $1.5 billion bank term loan and $400.0 in borrowings under our commercial paper program. For additional information on the financing associated with this transaction, refer to
Note 8: Debt and Financing Arrangements.
Ainsworth is a leading producer, distributor, and marketer of premium pet food and pet snacks, predominantly within the U.S. Approximately two-thirds of Ainsworth’s sales are generated by the Rachael Ray® Nutrish® brand, which is driving significant growth in the premium pet food category. Ainsworth also sells pet food and pet snacks under several additional branded and private label trademarks. Ainsworth was a privately-held company headquartered in Meadville, Pennsylvania. In addition to its headquarters, the transaction includes two manufacturing facilities owned by Ainsworth, which are located in Meadville, Pennsylvania, and Frontenac, Kansas, and a leased distribution facility in Greenville, Pennsylvania.
We expect to incur approximately $50.0 in one-time costs related to the acquisition, of which the majority are expected to be cash charges. The one-time costs will consist primarily of employee-related costs, outside service and consulting costs, and other costs directly related to the acquisition. Approximately two-thirds of these one-time costs are expected to be recognized by the end of 2019.
The purchase price will be preliminarily allocated to the underlying assets acquired and liabilities assumed based upon their estimated fair values at the date of acquisition and is subject to change as we complete our analysis of their fair values during the measurement period not to exceed one year as permitted under FASB ASC 805, Business Combinations. Due to the transaction closing subsequent to 2018, we will complete and disclose the preliminary purchase price allocation during the first quarter of 2019; however, we anticipate the majority of the purchase price will be allocated to goodwill and other intangible assets. The acquisition will be included within the U.S. Retail Pet Foods reportable segment and Pet Foods reporting unit.
On March 5, 2018, the U.S. Federal Trade Commission announced an administrative complaint challenging the proposed transaction to acquire the Wesson® oil brand from Conagra Brands, Inc. (“Conagra”). As a result, we mutually determined with Conagra to terminate the definitive agreement to acquire the Wesson brand.
NOTE 3 | INTEGRATION AND RESTRUCTURING COSTS | |
Integration and restructuring costs primarily consist of employee-related costs, outside service and consulting costs, and other costs related to certain acquisition or restructuring activities. Employee-related costs include severance, retention bonuses, and relocation costs. Severance costs and retention bonuses are recognized over the estimated future service period of the affected employees, and relocation costs are expensed as incurred. Other costs include professional fees, information systems costs, and other miscellaneous expenditures associated with the integration or restructuring activities, which are expensed as incurred. These one-time costs are not allocated to segment profit, and the majority of these costs are reported in other special project costs in the Statements of Consolidated Income. The obligation related to employee separation costs is included in other current liabilities in the Consolidated Balance Sheets.
2018 ANNUAL REPORT 59
NOTES TO CONSOLIDATED FINANCIAL STATEMENTS
The J. M. Smucker Company
Integration Costs: As of April 30, 2018, all integration activities related to the acquisition of Big Heart Pet Brands (“Big Heart”) were considered complete. The following table summarizes the one-time costs incurred in relation to the Big Heart acquisition.
2018 | 2017 | 2016 | Total Costs Incurred to Date at April 30, 2018 | ||||||||||||
Employee-related costs | $ | 8.5 | $ | 16.3 | $ | 52.4 | $ | 90.6 | |||||||
Outside service and consulting costs | 11.6 | 33.9 | 56.0 | 117.6 | |||||||||||
Other costs | 6.5 | 13.9 | 36.8 | 63.7 | |||||||||||
Total one-time costs | $ | 26.6 | $ | 64.1 | $ | 145.2 | $ | 271.9 | |||||||
Noncash charges of $2.6, $3.2, and $18.9 were included in the total one-time costs incurred in 2018, 2017, and 2016, respectively. Noncash charges included in total one-time costs incurred to date were $30.4, which primarily consisted of share-based compensation and accelerated depreciation. The obligation related to severance costs and retention bonuses was $0.1 and $5.3 at April 30, 2018 and 2017, respectively.
Restructuring Costs: An organization optimization program was approved by the Board of Directors (the “Board”) during the fourth quarter of 2016. Under this program, we identified opportunities to reduce costs and optimize the organization. Related projects include an organizational redesign and the optimization of our manufacturing footprint. In addition, the program was recently expanded to include the restructuring of our geographic footprint, which includes the centralization of our pet food and pet snacks business, as well as certain International non-manufacturing functions, to our corporate headquarters in Orrville, Ohio, furthering collaboration and enhanced agility, while improving cost efficiency. As a result, we plan to close the San Francisco and Burbank, California, offices by the end of 2019, and our international offices in China and Mexico during the first half of 2019. The majority of these costs are expected to be incurred through the end of 2019.
During 2017, we exited two leased facilities in Livermore, California, and consolidated all ancient grains and pasta production into our facility in Chico, California. During 2018, we consolidated all of our coffee produced at our Harahan, Louisiana, facility into one of our facilities in New Orleans, Louisiana, and this portion of the optimization program is nearly complete. To date, the organization optimization program has resulted in total headcount reductions of approximately 275 full-time positions. We do not anticipate significant headcount reductions associated with the expansion of the program.
Upon completion of this program, total restructuring costs are expected to be approximately $75.0, of which the majority represents employee-related costs, while the remainder primarily consists of site preparation, equipment relocation, and production start-up costs at the impacted facilities.
The following table summarizes our one-time costs incurred in relation to the organization optimization program.
2018 | 2017 | 2016 | Total Costs Incurred to Date at April 30, 2018 | ||||||||||||
Employee-related costs | $ | 10.1 | $ | 12.4 | $ | 1.3 | $ | 23.8 | |||||||
Outside service and consulting costs | 0.4 | 1.8 | — | 2.2 | |||||||||||
Other costs | 12.2 | 4.4 | — | 16.6 | |||||||||||
Total one-time costs | $ | 22.7 | $ | 18.6 | $ | 1.3 | $ | 42.6 | |||||||
Noncash charges of $9.8 and $2.1 were included in the one-time costs incurred during 2018 and 2017, respectively, and we did not incur any noncash charges during 2016. Noncash charges included in total one-time costs incurred to date were $11.9, and primarily consisted of accelerated depreciation. The obligation related to severance costs and retention bonuses was $0.3 and $3.3 at April 30, 2018 and 2017, respectively.
60 THE J. M. SMUCKER COMPANY
NOTES TO CONSOLIDATED FINANCIAL STATEMENTS
The J. M. Smucker Company
NOTE 4 | DIVESTITURE | |
On December 31, 2015, we sold our U.S. canned milk brands and operations to Eagle Family Foods Group LLC, a subsidiary of funds affiliated with Kelso & Company. The transaction included canned milk products that were primarily sold in U.S. retail and foodservice channels under the Eagle Brand® and Magnolia® brands, along with other branded and private label trade names, with annual net sales of approximately $200.0. Our manufacturing facilities in El Paso, Texas, and Seneca, Missouri, were included in the transaction, but our canned milk business in Canada was excluded from the divestiture.
The operating results for this business were primarily included in the U.S. Retail Consumer Foods segment prior to the sale on
December 31, 2015. We received proceeds from the divestiture of $193.7, which were net of transaction costs and a working capital adjustment. Upon completion of the transaction, we recognized a pre-tax gain of $25.3 in 2016.
NOTE 5 | REPORTABLE SEGMENTS | |
We operate in one industry: the manufacturing and marketing of food and beverage products. We have four reportable segments: U.S. Retail Coffee, U.S. Retail Consumer Foods, U.S. Retail Pet Foods, and International and Away From Home, previously referred to as International and Foodservice. During 2018, we added International and Away From Home as a reportable segment because a single segment manager was named to oversee the entire operating segment. Prior year segment results have not been modified, as the new reportable segment represents the previously reported combination of the International and Away From Home strategic business areas, which were previously managed separately and not individually significant.
The U.S. Retail Coffee segment primarily includes the domestic sales of Folgers®, Dunkin’ Donuts®, and Café Bustelo® branded coffee; the U.S. Retail Consumer Foods segment primarily includes domestic sales of Jif ®, Smucker’s®, Crisco®, and Pillsbury® branded products; and the U.S. Retail Pet Foods segment primarily includes domestic sales of Meow Mix®, Milk-Bone, Natural Balance®, Kibbles ’n Bits®, 9Lives®, Pup-Peroni, and Nature’s Recipe® branded products. The International and Away From Home segment is comprised of products distributed domestically and in foreign countries through retail channels and foodservice distributors and operators (e.g., restaurants, lodging, schools and universities, health care operators).
Segment profit represents net sales, less direct and allocable operating expenses, and is consistent with the way in which we manage our segments. However, we do not represent that the segments, if operated independently, would report operating profit equal to the segment profit set forth below, as segment profit excludes certain expenses such as corporate administrative expenses, unallocated gains and losses on commodity and foreign currency exchange derivative activities, as well as amortization expense and impairment charges related to intangible assets.
Consistent with prior periods, commodity and foreign currency exchange derivative gains and losses are reported in unallocated derivative gains and losses outside of segment operating results until the related inventory is sold. At that time, we reclassify the hedge gains and
losses from unallocated derivative gains and losses to segment profit, allowing our segments to realize the economic effect of the hedge without experiencing any mark-to-market volatility. We would expect that any gain or loss in the estimated fair value of the derivatives would generally be offset by a change in the estimated fair value of the underlying exposures.
2018 ANNUAL REPORT 61
NOTES TO CONSOLIDATED FINANCIAL STATEMENTS
The J. M. Smucker Company
Year Ended April 30, | |||||||||||
2018 | 2017 | 2016 | |||||||||
Net sales: | |||||||||||
U.S. Retail Coffee | $ | 2,092.2 | $ | 2,108.6 | $ | 2,239.2 | |||||
U.S. Retail Consumer Foods | 2,000.8 | 2,085.4 | 2,269.7 | ||||||||
U.S. Retail Pet Foods | 2,169.3 | 2,135.9 | 2,250.4 | ||||||||
International and Away From Home | 1,094.8 | 1,062.4 | 1,051.9 | ||||||||
Total net sales | $ | 7,357.1 | $ | 7,392.3 | $ | 7,811.2 | |||||
Segment profit: | |||||||||||
U.S. Retail Coffee | $ | 614.5 | $ | 682.4 | $ | 722.6 | |||||
U.S. Retail Consumer Foods | 477.2 | 458.2 | 467.5 | ||||||||
U.S. Retail Pet Foods | 441.3 | 481.0 | 493.9 | ||||||||
International and Away From Home | 194.2 | 185.1 | 179.0 | ||||||||
Total segment profit | $ | 1,727.2 | $ | 1,806.7 | $ | 1,863.0 | |||||
Amortization | (206.8 | ) | (207.3 | ) | (208.4 | ) | |||||
Goodwill impairment charge | (145.0 | ) | — | — | |||||||
Other intangible assets impairment charges | (31.9 | ) | (133.2 | ) | — | ||||||
Interest expense – net | (174.1 | ) | (163.1 | ) | (171.1 | ) | |||||
Unallocated derivative gains (losses) | 37.3 | (27.2 | ) | 12.0 | |||||||
Cost of products sold – special project costs (A) | (3.9 | ) | (5.7 | ) | (12.2 | ) | |||||
Other special project costs (A) | (45.4 | ) | (76.9 | ) | (135.9 | ) | |||||
Corporate administrative expenses | (295.4 | ) | (324.9 | ) | (373.2 | ) | |||||
Other income (expense) – net | (1.0 | ) | 10.0 | 3.7 | |||||||
Income before income taxes | $ | 861.0 | $ | 878.4 | $ | 977.9 | |||||
Assets: | |||||||||||
U.S. Retail Coffee | $ | 4,815.4 | $ | 4,909.9 | $ | 5,002.0 | |||||
U.S. Retail Consumer Foods | 3,217.5 | 3,157.2 | 3,288.5 | ||||||||
U.S. Retail Pet Foods | 5,932.3 | 6,232.9 | 6,321.6 | ||||||||
International and Away From Home | 1,043.9 | 1,053.4 | 1,168.6 | ||||||||
Unallocated (B) | 292.1 | 286.3 | 203.4 | ||||||||
Total assets | $ | 15,301.2 | $ | 15,639.7 | $ | 15,984.1 | |||||
Depreciation, amortization, and impairment charges: | |||||||||||
U.S. Retail Coffee | $ | 96.6 | $ | 95.7 | $ | 104.0 | |||||
U.S. Retail Consumer Foods | 80.2 | 73.2 | 60.7 | ||||||||
U.S. Retail Pet Foods | 314.8 | 280.8 | 164.9 | ||||||||
International and Away From Home | 57.8 | 61.9 | 66.2 | ||||||||
Unallocated (C) | 40.6 | 40.6 | 34.3 | ||||||||
Total depreciation, amortization, and impairment charges | $ | 590.0 | $ | 552.2 | $ | 430.1 | |||||
Additions to property, plant, and equipment: | |||||||||||
U.S. Retail Coffee | $ | 89.4 | $ | 40.9 | $ | 51.4 | |||||
U.S. Retail Consumer Foods | 168.9 | 49.7 | 90.3 | ||||||||
U.S. Retail Pet Foods | 34.3 | 70.5 | 11.9 | ||||||||
International and Away From Home | 29.3 | 31.3 | 47.8 | ||||||||
Total additions to property, plant, and equipment | $ | 321.9 | $ | 192.4 | $ | 201.4 | |||||
(A) Special project costs include integration and restructuring costs. For more information, see Note 3: Integration and Restructuring Costs.
(B) Primarily represents unallocated cash and cash equivalents and corporate-held investments.
(C) Primarily represents unallocated corporate administrative expense, mainly depreciation and software amortization.
62 THE J. M. SMUCKER COMPANY
NOTES TO CONSOLIDATED FINANCIAL STATEMENTS
The J. M. Smucker Company
The following table presents certain geographical information.
Year Ended April 30, | |||||||||||
2018 | 2017 | 2016 | |||||||||
Net sales: | |||||||||||
United States | $ | 6,786.5 | $ | 6,865.1 | $ | 7,300.8 | |||||
International: | |||||||||||
Canada | $ | 431.8 | $ | 414.3 | $ | 416.0 | |||||
All other international | 138.8 | 112.9 | 94.4 | ||||||||
Total international | $ | 570.6 | $ | 527.2 | $ | 510.4 | |||||
Total net sales | $ | 7,357.1 | $ | 7,392.3 | $ | 7,811.2 | |||||
Assets: | |||||||||||
United States | $ | 14,828.2 | $ | 15,214.3 | $ | 15,501.1 | |||||
International: | |||||||||||
Canada | $ | 428.7 | $ | 380.9 | $ | 396.2 | |||||
All other international | 44.3 | 44.5 | 86.8 | ||||||||
Total international | $ | 473.0 | $ | 425.4 | $ | 483.0 | |||||
Total assets | $ | 15,301.2 | $ | 15,639.7 | $ | 15,984.1 | |||||
Long-lived assets (excluding goodwill and other intangible assets): | |||||||||||
United States | $ | 1,869.8 | $ | 1,757.1 | $ | 1,773.9 | |||||
International: | |||||||||||
Canada | $ | 17.4 | $ | 13.4 | $ | 10.7 | |||||
All other international | 0.3 | 0.4 | 40.6 | ||||||||
Total international | $ | 17.7 | $ | 13.8 | $ | 51.3 | |||||
Total long-lived assets (excluding goodwill and other intangible assets) | $ | 1,887.5 | $ | 1,770.9 | $ | 1,825.2 | |||||
The following table presents product category sales as a percentage of consolidated net sales.
Year Ended April 30, | |||||||||||
2018 | 2017 | 2016 | |||||||||
Coffee | 34 | % | 34 | % | 34 | % | |||||
Dog food | 11 | 10 | 10 | ||||||||
Pet snacks | 10 | 10 | 10 | ||||||||
Peanut butter | 10 | 10 | 9 | ||||||||
Cat food | 9 | 9 | 9 | ||||||||
Fruit spreads | 5 | 5 | 4 | ||||||||
Shortening and oils | 4 | 4 | 4 | ||||||||
Baking mixes and frostings | 3 | 3 | 3 | ||||||||
Frozen handheld | 3 | 3 | 3 | ||||||||
Flour and baking ingredients | 2 | 2 | 2 | ||||||||
Juices and beverages | 2 | 2 | 2 | ||||||||
Portion control | 2 | 2 | 2 | ||||||||
Canned milk | 1 | 1 | 3 | ||||||||
Other | 4 | 5 | 5 | ||||||||
Total product sales | 100 | % | 100 | % | 100 | % | |||||
Sales to Walmart Inc. and subsidiaries amounted to 31 percent of net sales in 2018, and 30 percent of net sales in both 2017 and 2016. These sales are primarily included in our U.S. retail market segments. No other customer exceeded 10 percent of net sales for any year. Trade receivables at April 30, 2018 and 2017, included amounts due from Walmart Inc. and subsidiaries of $123.1 and $138.2, respectively.
2018 ANNUAL REPORT 63
NOTES TO CONSOLIDATED FINANCIAL STATEMENTS
The J. M. Smucker Company
NOTE 6 | EARNINGS PER SHARE | |
The following table sets forth the computation of net income per common share and net income per common share – assuming dilution under the two-class method.
Year Ended April 30, | ||||||||||||
2018 | 2017 | 2016 | ||||||||||
Net income | $ | 1,338.6 | $ | 592.3 | $ | 688.7 | ||||||
Less: Net income allocated to participating securities | 6.8 | 2.8 | 3.0 | |||||||||
Net income allocated to common stockholders | $ | 1,331.8 | $ | 589.5 | $ | 685.7 | ||||||
Weighted-average common shares outstanding | 113.0 | 115.5 | 118.9 | |||||||||
Add: Dilutive effect of stock options | — | 0.1 | 0.1 | |||||||||
Weighted-average common shares outstanding – assuming dilution | 113.0 | 115.6 | 119.0 | |||||||||
Net income per common share | $ | 11.79 | $ | 5.11 | $ | 5.77 | ||||||
Net income per common share – assuming dilution | $ | 11.78 | $ | 5.10 | $ | 5.76 | ||||||
NOTE 7 | GOODWILL AND OTHER INTANGIBLE ASSETS | |
A summary of changes in goodwill by reportable segment is as follows:
U.S. Retail Coffee | U.S. Retail Consumer Foods | U.S. Retail Pet Foods | International and Away From Home | Total | ||||||||||||||||
Balance at May 1, 2016 | $ | 2,090.9 | $ | 1,600.9 | $ | 1,969.5 | $ | 429.8 | $ | 6,091.1 | ||||||||||
Other (A) | — | (1.9 | ) | — | (12.1 | ) | (14.0 | ) | ||||||||||||
Balance at April 30, 2017 | $ | 2,090.9 | $ | 1,599.0 | $ | 1,969.5 | $ | 417.7 | $ | 6,077.1 | ||||||||||
Impairment charges (B) | — | — | (145.0 | ) | — | (145.0 | ) | |||||||||||||
Other (A) | — | 1.4 | — | 8.7 | 10.1 | |||||||||||||||
Balance at April 30, 2018 | $ | 2,090.9 | $ | 1,600.4 | $ | 1,824.5 | $ | 426.4 | $ | 5,942.2 | ||||||||||
(A) | The amounts classified as other represent foreign currency exchange adjustments. |
(B) | There have been no goodwill impairment charges recognized in prior periods. |
64 THE J. M. SMUCKER COMPANY
NOTES TO CONSOLIDATED FINANCIAL STATEMENTS
The J. M. Smucker Company
The following table summarizes our other intangible assets and related accumulated amortization and impairment charges, including foreign currency exchange adjustments.
April 30, 2018 | April 30, 2017 | |||||||||||||||||||||||
Acquisition Cost | Accumulated Amortization/ Impairment Charges/ Foreign Currency Exchange | Net | Acquisition Cost | Accumulated Amortization/ Impairment Charges/ Foreign Currency Exchange | Net | |||||||||||||||||||
Finite-lived intangible assets subject to amortization: | ||||||||||||||||||||||||
Customer and contractual relationships | $ | 3,520.1 | $ | 959.3 | $ | 2,560.8 | $ | 3,520.1 | $ | 802.1 | $ | 2,718.0 | ||||||||||||
Patents and technology | 168.5 | 114.4 | 54.1 | 168.5 | 101.4 | 67.1 | ||||||||||||||||||
Trademarks | 556.4 | 145.0 | 411.4 | 556.4 | 112.7 | 443.7 | ||||||||||||||||||
Total intangible assets subject to amortization | $ | 4,245.0 | $ | 1,218.7 | $ | 3,026.3 | $ | 4,245.0 | $ | 1,016.2 | $ | 3,228.8 | ||||||||||||
Indefinite-lived intangible assets not subject to amortization: | ||||||||||||||||||||||||
Trademarks | $ | 3,078.1 | $ | 187.9 | $ | 2,890.2 | $ | 3,078.1 | $ | 157.0 | $ | 2,921.1 | ||||||||||||
Total other intangible assets | $ | 7,323.1 | $ | 1,406.6 | $ | 5,916.5 | $ | 7,323.1 | $ | 1,173.2 | $ | 6,149.9 | ||||||||||||
Amortization expense for finite-lived intangible assets was $204.8, $205.9, and $204.7 in 2018, 2017, and 2016, respectively. The weighted-average useful lives of the customer and contractual relationships, patents and technology, and trademarks are 23 years, 14 years, and 16 years, respectively. The weighted-average useful life of total finite-lived intangible assets is 22 years. Based on the carrying amount of intangible assets subject to amortization at April 30, 2018, the estimated amortization expense is $205.1 for 2019, $200.4 for 2020, $198.8 for 2021, $193.4 for 2022, and $186.0 for 2023.
We review goodwill and other indefinite-lived intangible assets at least annually on February 1 for impairment and more often if indicators of impairment exist.
During the third quarter of 2018, we completed our annual long-range planning process, which resulted in a decline in forecasted net sales for the U.S. Retail Pet Foods segment. As a result of the decreased projections, as well as the narrow differences between estimated fair value and carrying value, we performed an interim impairment analysis on the goodwill of the Pet Foods reporting unit and the indefinite-lived trademarks included within the U.S. Retail Pet Foods segment, which was prior to the annual impairment review performed as of February 1, 2018. We recognized total impairment charges of $176.9, of which $145.0 and $31.9 related to the goodwill of the Pet Foods reporting unit and certain indefinite-lived trademarks within the U.S. Retail Pet Foods segment, respectively, to the extent the carrying values exceeded the estimated fair values. These charges were included as a noncash charge in our Statement of Consolidated Income. Furthermore, we early adopted ASU 2017-04, Intangibles – Goodwill and Other (Topic 350) Simplifying the Test for Goodwill Impairment, in connection with the interim impairment analysis. As a result, we did not perform Step 2 of the goodwill impairment test for the goodwill of the Pet Foods reporting unit and recorded the impairment charge based on the excess of the reporting unit’s carrying value over its fair value. For further details, refer to Note 1: Accounting Policies.
As of February 1, 2018, we completed the annual impairment review, in which goodwill impairment was tested at the reporting unit level for our seven reporting units. As part of our annual evaluation, we did not recognize any other impairment charges related to our goodwill and indefinite-lived trademarks. The estimated fair value of each reporting unit and material indefinite-lived intangible asset was substantially in excess of its carrying value as of the annual test date, with the exception of the Pet Foods reporting unit and all indefinite-lived trademarks within the U.S. Retail Pet Foods segment. Additional sensitivity analyses were performed for the Pet Foods reporting unit, assuming a hypothetical 50-basis-point decrease in the expected long-term growth rate or a hypothetical 50-basis-point increase in the weighted-average cost of capital. Both scenarios independently yielded an estimated fair value for the Pet Foods reporting unit below carrying value.
During 2017, we recognized total impairment charges of $133.2 primarily related to certain indefinite-lived trademarks within the U.S. Retail Pet Foods segment and did not recognize any impairment charges related to goodwill.
The goodwill and indefinite-lived trademarks within the U.S. Retail Pet Foods segment remain susceptible to future impairment charges, as the carrying values approximate estimated fair values at April 30, 2018. In addition, any meaningful adverse change to our near or long-term projections or macro-economic conditions could result in future impairment charges.
2018 ANNUAL REPORT 65
NOTES TO CONSOLIDATED FINANCIAL STATEMENTS
The J. M. Smucker Company
NOTE 8 | DEBT AND FINANCING ARRANGEMENTS | |
Long-term debt consists of the following:
April 30, 2018 | April 30, 2017 | |||||||||||||||
Principal Outstanding | Carrying Amount (A) | Principal Outstanding | Carrying Amount (A) | |||||||||||||
1.75% Senior Notes due March 15, 2018 | $ | — | $ | — | $ | 500.0 | $ | 499.0 | ||||||||
2.20% Senior Notes due December 6, 2019 | 300.0 | 298.6 | — | — | ||||||||||||
2.50% Senior Notes due March 15, 2020 | 500.0 | 497.8 | 500.0 | 496.6 | ||||||||||||
3.50% Senior Notes due October 15, 2021 | 750.0 | 775.6 | 750.0 | 782.6 | ||||||||||||
3.00% Senior Notes due March 15, 2022 | 400.0 | 397.3 | 400.0 | 396.6 | ||||||||||||
3.50% Senior Notes due March 15, 2025 | 1,000.0 | 994.4 | 1,000.0 | 993.6 | ||||||||||||
3.38% Senior Notes due December 15, 2027 | 500.0 | 495.8 | — | — | ||||||||||||
4.25% Senior Notes due March 15, 2035 | 650.0 | 643.1 | 650.0 | 642.6 | ||||||||||||
4.38% Senior Notes due March 15, 2045 | 600.0 | 585.4 | 600.0 | 584.9 | ||||||||||||
Term Loan Credit Agreement due March 23, 2020 | — | — | 550.0 | 548.6 | ||||||||||||
Total long-term debt | $ | 4,700.0 | $ | 4,688.0 | $ | 4,950.0 | $ | 4,944.5 | ||||||||
Current portion of long-term debt | — | — | 500.0 | 499.0 | ||||||||||||
Total long-term debt, less current portion | $ | 4,700.0 | $ | 4,688.0 | $ | 4,450.0 | $ | 4,445.5 | ||||||||
(A) Represents the carrying amount included in the Consolidated Balance Sheets, which includes the impact of terminated interest rate contracts, offering discounts, and capitalized debt issuance costs.
On April 27, 2018, we entered into a senior unsecured delayed-draw Term Loan Credit Agreement (“Term Loan”) with a syndicate of banks and an available commitment amount of $1.5 billion. Borrowings under the Term Loan bear interest on the prevailing U.S. Prime Rate or London Interbank Offered Rate (“LIBOR”), based on our election, and is payable either on a quarterly basis or at the end of the borrowing term. The Term Loan does not require scheduled amortization payments. Voluntary prepayments are permitted without premium or penalty. As of April 30, 2018, no balance was drawn on the Term Loan. The full amount of the Term Loan was drawn on May 14, 2018, at an interest rate of 3.04 percent, to partially finance the Ainsworth acquisition, as discussed in Note 2: Acquisitions. The Term Loan matures on May 14, 2021. We have incurred total capitalized debt issuance costs of $2.8, of which $0.8 was incurred during 2018, and will be amortized to interest expense over the time period for which the debt is outstanding.
Prior to entering into the new Term Loan, we entered into a commitment letter for a $1.9 billion 364-day senior unsecured Bridge Term Loan Credit Facility that provided committed financing for the Ainsworth acquisition. This commitment letter was terminated upon entry into the Term Loan on April 27, 2018. Financing fees were included in interest expense – net on the Statement of Consolidated Income at April 30, 2018.
In December 2017, we completed an offering of $800.0 in Senior Notes due December 6, 2019, and December 15, 2027. The Senior Notes included $6.1 of capitalized debt issuance costs and offering discounts to be amortized to interest expense over the time for which the debt is outstanding. The net proceeds from the offering were used to prepay the $500.0 in principal amount of the Senior Notes due March 15, 2018. In addition, we prepaid, in full, the remaining outstanding balance of the $1.8 billion term loan due March 23, 2020. As a result of prepaying both the Senior Notes due March 15, 2018, and the term loan due March 23, 2020, we recognized debt costs of $1.7, which primarily consisted of the write-off of capitalized debt issuance costs, and were included in interest expense. Concurrent with the pricing of the Senior Notes due December 15, 2027, we terminated the treasury lock, entered into in June 2017, prior to maturity, resulting in a gain of $2.7, which was deferred and included as a component of accumulated other comprehensive income (loss) and is being amortized as a reduction to interest expense over the life of the debt. For additional information on the treasury lock, see Note 10: Derivative Financial Instruments.
All of our Senior Notes outstanding at April 30, 2018, are unsecured, and interest is paid semiannually, with no required scheduled principal payments until maturity. We may prepay all or part of the Senior Notes at 100 percent of the principal amount thereof, together with the accrued and unpaid interest, and any applicable make-whole amount.
66 THE J. M. SMUCKER COMPANY
NOTES TO CONSOLIDATED FINANCIAL STATEMENTS
The J. M. Smucker Company
In September 2017, we entered into an unsecured revolving credit facility with a group of 11 banks, which provides for a revolving credit line of $1.8 billion and matures in September 2022. Additionally, we terminated the previous $1.5 billion credit facility. The new revolving credit facility included $4.1 of capitalized debt issuance costs, which are being amortized to interest expense over the time period for which the revolving credit facility is effective. Borrowings under the revolving credit facility bear interest on the prevailing U.S. Prime Rate, LIBOR, or Canadian Dealer Offered Rate, based on our election. Interest is payable either on a quarterly basis or at the end of the borrowing term. We did not have a balance outstanding under the current and previous revolving credit facilities at both April 30, 2018 and 2017. As a result of the termination of the previous $1.5 billion credit facility, and because there are no subsidiary guarantors of the new $1.8 billion credit facility, the guarantees provided by the Company’s subsidiaries, J. M. Smucker LLC and The Folgers Coffee Company (the “subsidiary guarantors”), related to the obligations under the term loan due March 23, 2020, and all of our outstanding Senior Notes were released. For additional information, see Note 16: Guarantor and Non-Guarantor Financial Information.
We participate in a commercial paper program under which we can issue short-term, unsecured commercial paper not to exceed $1.8 billion at any time, which was increased from the previous limit of $1.0 billion in conjunction with entering into the new unsecured revolving credit facility in September 2017. The commercial paper program is backed by our revolving credit facility and reduces what we can borrow under the revolving credit facility by the amount of commercial paper outstanding. Commercial paper will be used as a continuing source of short-term financing for general corporate purposes. As of April 30, 2018 and 2017, we had $144.0 and $454.0 of short-term borrowings outstanding, respectively, which were issued under our commercial paper program at weighted-average interest rates of
2.20 percent and 1.15 percent, respectively. On May 14, 2018, we issued $400.0 of commercial paper at a weighted-average interest rate of 2.27 percent to partially finance the Ainsworth acquisition, as discussed in Note 2: Acquisitions.
Interest paid totaled $158.9, $162.2, and $167.3 in 2018, 2017, and 2016, respectively. This differs from interest expense due to the amortization of debt issuance costs and discounts, timing of interest payments, effect of interest rate contracts, other debt fees, and capitalized interest.
Our debt instruments contain certain financial covenant restrictions, including a leverage ratio, which was amended in connection with the execution of the new Term Loan, and an interest coverage ratio. We are in compliance with all covenants.
NOTE 9 | PENSIONS AND OTHER POSTRETIREMENT BENEFITS | |
We have defined benefit pension plans covering certain U.S. and Canadian employees. Pension benefits are based on the employee’s years of service and compensation levels. Our plans are funded in conformity with the funding requirements of applicable government regulations.
In addition to providing pension benefits, we sponsor several unfunded postretirement plans that provide health care and life insurance benefits to certain retired U.S. and Canadian employees. These plans are contributory, with retiree contributions adjusted periodically, and contain other cost-sharing features, such as deductibles and coinsurance. Covered employees generally are eligible for these benefits when they reach age 55 and have attained 10 years of credited service.
2018 ANNUAL REPORT 67
NOTES TO CONSOLIDATED FINANCIAL STATEMENTS
The J. M. Smucker Company
The following table summarizes the components of net periodic benefit cost and the change in accumulated other comprehensive income (loss) related to the defined benefit pension and other postretirement plans.
Defined Benefit Pension Plans | Other Postretirement Benefits | |||||||||||||||||||||||
Year Ended April 30, | 2018 | 2017 | 2016 | 2018 | 2017 | 2016 | ||||||||||||||||||
Service cost | $ | 5.2 | $ | 12.7 | $ | 17.8 | $ | 2.0 | $ | 2.3 | $ | 2.3 | ||||||||||||
Interest cost | 21.6 | 25.3 | 27.7 | 2.1 | 2.6 | 2.8 | ||||||||||||||||||
Expected return on plan assets | (28.8 | ) | (29.3 | ) | (32.9 | ) | — | — | — | |||||||||||||||
Amortization of prior service cost (credit) | 0.9 | 1.1 | 0.7 | (1.4 | ) | (1.5 | ) | (1.1 | ) | |||||||||||||||
Amortization of net actuarial loss (gain) | 11.5 | 13.8 | 10.9 | (0.3 | ) | (0.2 | ) | (0.3 | ) | |||||||||||||||
Curtailment loss (gain) | — | — | (6.5 | ) | — | — | (0.3 | ) | ||||||||||||||||
Settlement loss (gain) | 2.3 | (0.7 | ) | — | — | — | — | |||||||||||||||||
Net periodic benefit cost | $ | 12.7 | $ | 22.9 | $ | 17.7 | $ | 2.4 | $ | 3.2 | $ | 3.4 | ||||||||||||
Other changes in plan assets and benefit liabilities recognized in accumulated other comprehensive income (loss) before income taxes: | ||||||||||||||||||||||||
Prior service credit (cost) arising during the year | $ | — | $ | 2.1 | $ | (5.3 | ) | $ | (0.2 | ) | $ | 3.0 | $ | — | ||||||||||
Net actuarial gain (loss) arising during the year | 3.5 | 1.5 | (43.3 | ) | 5.5 | 2.3 | — | |||||||||||||||||
Amortization of prior service cost (credit) | 0.9 | 1.1 | 0.7 | (1.4 | ) | (1.5 | ) | (1.1 | ) | |||||||||||||||
Amortization of net actuarial loss (gain) | 11.5 | 13.8 | 10.9 | (0.3 | ) | (0.2 | ) | (0.3 | ) | |||||||||||||||
Curtailment loss (gain) | — | 28.8 | (6.5 | ) | — | 0.1 | (0.3 | ) | ||||||||||||||||
Settlement loss (gain) | 2.3 | (0.7 | ) | — | — | — | — | |||||||||||||||||
Foreign currency translation | (1.8 | ) | 2.5 | 0.8 | (0.1 | ) | — | — | ||||||||||||||||
Net change for year | $ | 16.4 | $ | 49.1 | $ | (42.7 | ) | $ | 3.5 | $ | 3.7 | $ | (1.7 | ) | ||||||||||
Weighted-average assumptions used in determining net periodic benefit costs: | |||||||||||||||||||||||
U.S. plans: | |||||||||||||||||||||||
Discount rate used to determine benefit obligation | 3.95 | % | 3.85 | % | 4.06 | % | 3.86 | % | 3.80 | % | 4.04 | % | |||||||||||
Discount rate used to determine service cost | 4.20 | 3.85 | 4.06 | 4.06 | 3.80 | 4.04 | |||||||||||||||||
Discount rate used to determine interest cost | 3.38 | 3.85 | 4.06 | 3.24 | 3.80 | 4.04 | |||||||||||||||||
Expected return on plan assets | 6.27 | 6.27 | 6.58 | — | — | — | |||||||||||||||||
Rate of compensation increase | 3.78 | 3.96 | 4.06 | — | — | — | |||||||||||||||||
Canadian plans: | |||||||||||||||||||||||
Discount rate used to determine benefit obligation | 3.22 | % | 3.60 | % | 3.51 | % | 3.19 | % | 3.50 | % | 3.50 | % | |||||||||||
Discount rate used to determine service cost | 3.39 | 3.60 | 3.51 | 3.70 | 3.50 | 3.50 | |||||||||||||||||
Discount rate used to determine interest cost | 2.60 | 3.60 | 3.51 | 2.58 | 3.50 | 3.50 | |||||||||||||||||
Expected return on plan assets | 5.00 | 5.25 | 5.65 | — | — | — | |||||||||||||||||
Rate of compensation increase | 3.00 | 3.00 | 3.00 | — | — | — | |||||||||||||||||
We amortize gains and losses for our postretirement plans over the average expected future period of vested service. For plans that consist of less than 5 percent of participants that are active, average life expectancy is used instead of the average expected useful service period.
68 THE J. M. SMUCKER COMPANY
NOTES TO CONSOLIDATED FINANCIAL STATEMENTS
The J. M. Smucker Company
We use a measurement date of April 30 to determine defined benefit pension and other postretirement benefit plans’ assets and benefit obligations. The following table sets forth the combined status of the plans as recognized in the Consolidated Balance Sheets.
Defined Benefit Pension Plans | Other Postretirement Benefits | ||||||||||||||
April 30, | 2018 | 2017 | 2018 | 2017 | |||||||||||
Change in benefit obligation: | |||||||||||||||
Benefit obligation at beginning of year | $ | 677.3 | $ | 745.9 | $ | 70.7 | $ | 75.9 | |||||||
Service cost | 5.2 | 12.7 | 2.0 | 2.3 | |||||||||||
Interest cost | 21.6 | 25.3 | 2.1 | 2.6 | |||||||||||
Amendments | — | — | 0.2 | (3.0 | ) | ||||||||||
Actuarial loss (gain) | (10.8 | ) | 6.7 | (5.5 | ) | (2.3 | ) | ||||||||
Benefits paid | (36.0 | ) | (43.8 | ) | (4.3 | ) | (3.9 | ) | |||||||
Foreign currency translation adjustments | 5.8 | (7.8 | ) | 0.7 | (0.8 | ) | |||||||||
Curtailment | — | (30.9 | ) | — | (0.1 | ) | |||||||||
Settlement | (23.4 | ) | (30.8 | ) | — | — | |||||||||
Benefit obligation at end of year | $ | 639.7 | $ | 677.3 | $ | 65.9 | $ | 70.7 | |||||||
Change in plan assets: | |||||||||||||||
Fair value of plan assets at beginning of year | $ | 489.2 | $ | 505.6 | $ | — | $ | — | |||||||
Actual return on plan assets | 21.5 | 37.4 | — | — | |||||||||||
Company contributions | 39.6 | 28.7 | 4.3 | 3.9 | |||||||||||
Benefits paid | (36.0 | ) | (43.8 | ) | (4.3 | ) | (3.9 | ) | |||||||
Settlement | (23.4 | ) | (30.8 | ) | — | — | |||||||||
Foreign currency translation adjustments | 6.1 | (7.9 | ) | — | — | ||||||||||
Fair value of plan assets at end of year | $ | 497.0 | $ | 489.2 | $ | — | $ | — | |||||||
Funded status of the plans | $ | (142.7 | ) | $ | (188.1 | ) | $ | (65.9 | ) | $ | (70.7 | ) | |||
Defined benefit pensions | $ | (144.1 | ) | $ | (189.8 | ) | $ | — | $ | — | |||||
Other noncurrent assets | 9.5 | 5.7 | — | — | |||||||||||
Accrued compensation | (8.1 | ) | (4.0 | ) | (4.0 | ) | (4.1 | ) | |||||||
Other postretirement benefits | — | — | (61.9 | ) | (66.6 | ) | |||||||||
Net benefit liability | $ | (142.7 | ) | $ | (188.1 | ) | $ | (65.9 | ) | $ | (70.7 | ) | |||
During 2018, we made additional contributions to the defined benefit pension plans of $20.0, which was funded by the current year tax savings that resulted from the tax legislation that was enacted during the third quarter of 2018. For further details on the tax legislation changes, refer to Note 13: Income Taxes.
The following table summarizes amounts recognized in accumulated other comprehensive income (loss) in the Consolidated Balance Sheets, before income taxes.
Defined Benefit Pension Plans | Other Postretirement Benefits | ||||||||||||||
April 30, | 2018 | 2017 | 2018 | 2017 | |||||||||||
Net actuarial gain (loss) | $ | (150.9 | ) | $ | (166.4 | ) | $ | 13.6 | $ | 8.5 | |||||
Prior service credit (cost) | (4.7 | ) | (5.6 | ) | 9.1 | 10.7 | |||||||||
Total recognized in accumulated other comprehensive income (loss) | $ | (155.6 | ) | $ | (172.0 | ) | $ | 22.7 | $ | 19.2 | |||||
During 2019, we expect to recognize amortization of net actuarial losses and prior service credit of $7.7 and $0.4, respectively, in net periodic benefit cost.
During 2017, we announced our plans to harmonize our retirement benefits and freeze our non-union U.S. defined benefit pension plans by December 31, 2017. The amendments resulted in an immaterial net settlement loss and a decrease in accumulated other comprehensive income (loss) of $25.2 during 2017. As a result of the plan changes, we realized savings in 2018 and expect to realize additional savings in the future.
2018 ANNUAL REPORT 69
NOTES TO CONSOLIDATED FINANCIAL STATEMENTS
The J. M. Smucker Company
As of April 30, 2017, we changed the approach utilized to estimate the service and interest cost components of net periodic benefit cost for our defined benefit pension and other postretirement benefit plans. Historically, we estimated the service and interest cost components using a single weighted-average discount rate derived from the yield curve used to measure the benefit obligation at the beginning of the period. As of April 30, 2017, we utilized a spot rate approach for the estimation of service and interest cost for our plans by applying specific spot rates along the yield curve to the relevant projected cash flows, to provide a better estimate of service and interest costs. This approach does not affect the measurement of the total benefit obligations, and has been accounted for as a change in estimate that is effected by a change in accounting principle. As such, we accounted for this change in methodology on a prospective basis beginning
May 1, 2017, which resulted in a benefit of approximately $4.3 in 2018.
The following table sets forth the weighted-average assumptions used in determining the benefit obligations.
Defined Benefit Pension Plans | Other Postretirement Benefits | ||||||||||||||
April 30, | 2018 | 2017 | 2018 | 2017 | |||||||||||
U.S. plans: | |||||||||||||||
Discount rate | 4.17 | % | 3.95 | % | 4.13 | % | 3.86 | % | |||||||
Rate of compensation increase | 3.59 | 4.15 | — | — | |||||||||||
Canadian plans: | |||||||||||||||
Discount rate | 3.57 | % | 3.22 | % | 3.55 | % | 3.16 | % | |||||||
Rate of compensation increase | 3.00 | 3.00 | — | — | |||||||||||
For 2019, the assumed health care trend rates are 6.8 percent and 4.5 percent for the U.S. and Canadian plans, respectively. The rate for participants under age 65 is assumed to decrease to 5.0 percent in calendar 2026 for the U.S. plan and remain at 4.5 percent for the Canadian plan. The health care cost trend rate assumption impacts the amount of the other postretirement benefits obligation and periodic other postretirement benefits cost reported. A one percentage point annual change in the assumed health care cost trend rate would have the following effect as of April 30, 2018:
One Percentage Point | ||||||||
Increase | Decrease | |||||||
Effect on total service and interest cost components | $ | — | $ | 0.1 | ||||
Effect on benefit obligation | 1.0 | 1.1 | ||||||
The following table sets forth selective information pertaining to our Canadian pension and other postretirement benefit plans, which is included in the consolidated information presented on pages 68 and 69.
Defined Benefit Pension Plans | Other Postretirement Benefits | ||||||||||||||
Year Ended April 30, | 2018 | 2017 | 2018 | 2017 | |||||||||||
Benefit obligation at end of year | $ | 87.6 | $ | 89.8 | $ | 7.3 | $ | 9.4 | |||||||
Fair value of plan assets at end of year | 96.4 | 94.8 | — | — | |||||||||||
Funded status of the plans | $ | 8.8 | $ | 5.0 | $ | (7.3 | ) | $ | (9.4 | ) | |||||
Components of net periodic benefit cost: | |||||||||||||||
Service cost | $ | 0.2 | $ | 0.3 | $ | — | $ | — | |||||||
Interest cost | 2.4 | 3.2 | 0.3 | 0.3 | |||||||||||
Expected return on plan assets | (5.0 | ) | (4.7 | ) | — | — | |||||||||
Amortization of net actuarial loss (gain) | 0.8 | 1.1 | — | — | |||||||||||
Net periodic benefit cost (credit) | $ | (1.6 | ) | $ | (0.1 | ) | $ | 0.3 | $ | 0.3 | |||||
Changes in plan assets: | |||||||||||||||
Company contributions | $ | 0.9 | $ | 3.1 | $ | 0.5 | $ | 0.5 | |||||||
Benefits paid | (6.8 | ) | (6.6 | ) | (0.5 | ) | (0.5 | ) | |||||||
Actual return on plan assets | 1.5 | 10.2 | — | — | |||||||||||
Foreign currency translation | 6.0 | (7.9 | ) | — | — | ||||||||||
70 THE J. M. SMUCKER COMPANY
NOTES TO CONSOLIDATED FINANCIAL STATEMENTS
The J. M. Smucker Company
The following table sets forth additional information related to our defined benefit pension plans.
April 30, | |||||||
2018 | 2017 | ||||||
Accumulated benefit obligation for all pension plans | $ | 627.9 | $ | 659.6 | |||
Plans with an accumulated benefit obligation in excess of plan assets: | |||||||
Accumulated benefit obligation | $ | 541.3 | $ | 570.6 | |||
Fair value of plan assets | 400.6 | 394.4 | |||||
Plans with a projected benefit obligation in excess of plan assets: | |||||||
Projected benefit obligation | $ | 552.9 | $ | 588.2 | |||
Fair value of plan assets | 400.6 | 394.4 | |||||
We employ a total return on investment approach for the defined benefit pension plans’ assets. A mix of equity, fixed-income, and alternative investments is used to maximize the long-term rate of return on assets for the level of risk. In determining the expected long-term rate of return on the defined benefit pension plans’ assets, we consider the historical rates of return, the nature of investments, the asset allocation, and expectations of future investment strategies. The actual rate of return was 5.4 percent and 8.3 percent for the years ended April 30, 2018 and 2017, respectively, which excludes administrative and investment expenses.
The following tables summarize the major asset classes for the U.S. and Canadian defined benefit pension plans and the levels within the fair value hierarchy for those assets measured at fair value.
Quoted Prices in Active Markets for Identical Assets (Level 1) | Significant Observable Inputs (Level 2) | Significant Unobservable Inputs (Level 3) | Plan Assets at April 30, 2018 | |||||||||||||
Cash and cash equivalents (A) | $ | 3.7 | $ | — | $ | — | $ | 3.7 | ||||||||
Equity securities: | ||||||||||||||||
U.S. (B) | 94.8 | 1.9 | — | 96.7 | ||||||||||||
International (C) | 73.2 | 9.7 | — | 82.9 | ||||||||||||
Fixed-income securities: | ||||||||||||||||
Bonds (D) | 231.8 | — | — | 231.8 | ||||||||||||
Fixed income (E) | 53.0 | — | — | 53.0 | ||||||||||||
Other types of investments (F) | — | 16.8 | 3.2 | 20.0 | ||||||||||||
Total financial assets measured at fair value | $ | 456.5 | $ | 28.4 | $ | 3.2 | $ | 488.1 | ||||||||
Total financial assets measured at net asset value (G) | 8.9 | |||||||||||||||
Total plan assets | $ | 497.0 | ||||||||||||||
Quoted Prices in Active Markets for Identical Assets (Level 1) | Significant Observable Inputs (Level 2) | Significant Unobservable Inputs (Level 3) | Plan Assets at April 30, 2017 | |||||||||||||
Cash and cash equivalents (A) | $ | 2.7 | $ | — | $ | — | $ | 2.7 | ||||||||
Equity securities: | ||||||||||||||||
U.S. (B) | 128.9 | 1.9 | — | 130.8 | ||||||||||||
International (C) | 81.4 | 10.5 | — | 91.9 | ||||||||||||
Fixed-income securities: | ||||||||||||||||
Bonds (D) | 168.5 | — | — | 168.5 | ||||||||||||
Fixed income (E) | 71.9 | — | — | 71.9 | ||||||||||||
Other types of investments (F) | 6.7 | 4.5 | 2.4 | 13.6 | ||||||||||||
Total financial assets measured at fair value | $ | 460.1 | $ | 16.9 | $ | 2.4 | $ | 479.4 | ||||||||
Total financial assets measured at net asset value (G) | 9.8 | |||||||||||||||
Total plan assets | $ | 489.2 | ||||||||||||||
2018 ANNUAL REPORT 71
NOTES TO CONSOLIDATED FINANCIAL STATEMENTS
The J. M. Smucker Company
(A) This category includes money market holdings with maturities of three months or less and are classified as Level 1 assets. Based on the short-term nature of these assets, carrying value approximates fair value.
(B) This category is invested in a diversified portfolio of common stocks and index funds that primarily invest in U.S. stocks with broad market capitalization ranges similar to those found in the S&P 500 Index and/or the various Russell Indices and are traded on active exchanges. The Level 1 assets are valued using quoted market prices for identical securities in active markets. The Level 2 asset is comprised of a pooled fund that consists of equity securities traded on active exchanges.
(C) This category is invested primarily in common stocks and other equity securities traded on active exchanges of foreign issuers located outside the U.S. The fund invests primarily in developed countries, but may also invest in emerging markets. The Level 1 assets are valued using quoted market prices for identical securities in active markets. The Level 2 asset is comprised of a pooled fund that consists of equity securities traded on active exchanges.
(D) This category is primarily comprised of bond funds, which seek to duplicate the return characteristics of high-quality U.S. and foreign corporate bonds with a duration range of 10 to 13 years. In 2018, this category is further comprised of various U.S. Treasury Separate Trading of Registered Interest and Principal (“STRIP”) holdings, with wide-ranging maturity dates. The Level 1 assets are valued using quoted market prices for identical securities in active markets.
(E) This category is comprised of fixed-income funds that invest primarily in government-related bonds of non-U.S. issuers and include investments in the Canadian, as well as emerging, markets. The Level 1 assets are valued using quoted market prices for identical securities in active markets.
(F) This category is comprised of a real estate fund whereby the underlying investments are contained in the Canadian market and a private limited investment partnership in 2017, and in 2018, this category also included a common collective trust fund investing in direct commercial property funds. In 2017, the category included a dynamic asset allocation mutual fund, which was comprised of U.S. and global equities and fixed-income securities inclusive of derivatives within the asset mix. The dynamic asset allocation mutual fund was classified as a Level 1 asset, whereby the assets are valued using quoted market prices for identical securities in active markets. The real estate fund and the collective trust fund investing in direct commercial property are classified as a Level 2 asset, whereby the underlying securities are valued utilizing quoted market prices for identical securities in active markets and based on the quoted market prices of the underlying investments in the common collective trust, respectively. The private investment limited partnership is classified as a Level 3 asset. The investments in the partnership are valued at estimated fair value based on audited financial statements received from the general partner. The private investment limited partnership cannot be redeemed, and the return of principal is based on the liquidation of the underlying assets.
(G) This category is comprised of a private equity fund that consists primarily of limited partnership interests in corporate finance and venture capital funds. The fair value estimate of the private equity fund is based on the underlying funds’ net asset values further as a practical expedient equivalent to the Company’s defined benefit plan’s ownership interest in partners’ capital, whereby a proportionate share of the net assets is attributed and further corroborated by our review. The private equity fund is non-redeemable, and the return of principal is based on the liquidation of the underlying assets. In accordance with ASU 2015-07, the private equity fund is removed from the total financial assets measured at fair value and disclosed separately.
The following table presents a rollforward of activity for Level 3 assets.
2018 | 2017 | ||||||
Balance at May 1, | $ | 2.4 | $ | 3.2 | |||
Actual return on plan assets still held at reporting date | 0.8 | (0.8 | ) | ||||
Balance at April 30, | $ | 3.2 | $ | 2.4 | |||
Our current investment policy is to invest 50 percent of assets in both equity securities and fixed-income securities. Included in equity securities were 317,552 of our common shares at April 30, 2018. The total market value of these shares was $36.2 at April 30, 2018. We paid dividends of $1.0 on these shares during 2018.
We expect to contribute approximately $20.0 to the defined benefit pension plans in 2019. We expect the following payments to be made from the defined benefit pension and other postretirement benefit plans: $54.8 in 2019, $48.0 in 2020, $47.5 in 2021, $47.4 in 2022,
$51.7 in 2023, and $238.8 in 2024 through 2028.
Multi-Employer Pension Plan: We participate in one multi-employer pension plan, the Bakery and Confectionery Union and Industry International Pension Fund (“Bakery and Confectionery Union Fund”) (52-6118572), which provides defined benefits to certain union employees. During 2018 and 2017, a total of $2.0 and $1.9 was contributed to the plan, respectively, and we anticipate contributions of $2.2 in 2019.
The risks of participating in multi-employer pension plans are different from the risks of participating in single-employer pension plans. For instance, the assets contributed to the multi-employer plan by one employer may be used to provide benefits to employees of other participating employers, and if a participating employer stops contributing to the plan, the unfunded obligations of the plan allocable to the withdrawing employer may be the responsibility of the remaining participating employers. Additionally, if we stop participating in the multi-employer pension plan, we may be required to pay the plan an amount based on our allocable share of the underfunded status of the plan, referred to as a withdrawal liability.
72 THE J. M. SMUCKER COMPANY
NOTES TO CONSOLIDATED FINANCIAL STATEMENTS
The J. M. Smucker Company
The Pension Protection Act of 2006 ranks the funded status of multi-employer pension plans depending upon a plan’s current and projected funding. A plan is in the Red Zone (Critical) if it has a current funded percentage less than 65 percent. A plan is in the Yellow Zone (Endangered) if it has a current funded percentage of less than 80 percent or projects a credit balance deficit within seven years. A plan is in the Green Zone (Healthy) if it has a current funded percentage greater than 80 percent and does not have a projected credit balance deficit within seven years. The zone status is based on the plan’s year-end, not our fiscal year-end. The zone status is based on information that we received from the plan and is certified by the plan’s actuary. During calendar year 2017, the Bakery and Confectionery Union Fund was in Red Zone status, as the current funding status was 54.7 percent. A funding improvement plan, or rehabilitation plan, has been implemented.
NOTE 10 | DERIVATIVE FINANCIAL INSTRUMENTS | |
We are exposed to market risks, such as changes in commodity prices, foreign currency exchange rates, and interest rates. To manage the volatility related to these exposures, we enter into various derivative transactions. We have policies in place that define acceptable instrument types we may enter into and establish controls to limit our market risk exposure.
During 2018, we early adopted ASU 2017-12, Derivatives and Hedging (Topic 815) Targeted Improvements to Accounting for Hedging Activities, which did not have a material impact on our condensed consolidated financial statements and disclosures. For additional information, see Recently Issued Accounting Standards in Note 1: Accounting Policies.
Commodity Price Management: We enter into commodity derivatives to manage the price volatility and reduce the variability of future cash flows related to anticipated inventory purchases of key raw materials, notably green coffee, edible oils, corn, wheat, and soybean meal. We also enter into commodity derivatives to manage price risk for energy input costs, including diesel fuel and natural gas. Our derivative instruments generally have maturities of less than one year.
We do not qualify commodity derivatives for hedge accounting treatment and, as a result, the derivative gains and losses are immediately recognized in earnings. Although we do not perform the assessments required to achieve hedge accounting for derivative positions, we believe all of our commodity derivatives are economic hedges of our risk exposure.
The commodities hedged have a high inverse correlation to price changes of the derivative instrument. Thus, we would expect that over time, any gain or loss in the estimated fair value of the derivatives would generally be offset by an increase or decrease in the estimated fair value of the underlying exposures.
Foreign Currency Exchange Rate Hedging: We utilize foreign currency derivatives to manage the effect of foreign currency exchange fluctuations on future cash payments primarily related to purchases of certain raw materials and finished goods. The contracts generally have maturities of less than one year. We do not qualify instruments used to manage foreign currency exchange exposures for hedge accounting treatment.
Interest Rate Hedging: We utilize derivative instruments to manage changes in the fair value of our debt. Interest rate contracts mitigate the risk associated with the underlying hedged item. At the inception of the contract, the instrument is evaluated and documented for hedge accounting treatment. If the contract is designated as a cash flow hedge, the mark-to-market gains or losses on the contract are deferred and included as a component of accumulated other comprehensive income (loss), and reclassified to interest expense in the period during which the hedged transaction affects earnings. If the contract is designated as a fair value hedge, the contract is recognized at fair value on the balance sheet, and changes in the fair value are recognized in interest expense. Generally, changes in the fair value of the derivative are equal to changes in the fair value of the underlying debt and have no impact on earnings.
In June 2017, we entered into a treasury lock, with a notional value of $300.0, to manage our exposure to interest rate volatility associated with anticipated debt financing in 2018. This interest rate contract was designated as a cash flow hedge. In December 2017, concurrent with the pricing of the Senior Notes due December 15, 2027, we terminated the treasury lock prior to maturity. The termination resulted in a gain of $2.7, which was deferred and included as a component of accumulated other comprehensive income (loss) and is being amortized as a reduction to interest expense over the life of the debt.
In 2015, we terminated the interest rate swap on the 3.50 percent Senior Notes due October 15, 2021, which was designated as a fair value hedge and used to hedge against the changes in the fair value of the debt. As a result of the early termination, we received $58.1 in cash, which included $4.6 of accrued and prepaid interest. The gain on termination was recorded as an increase in the long-term debt balance and is being recognized over the remaining life of the underlying debt as a reduction of interest expense. To date, we have recognized $25.0, of which $7.8, $7.6, and $7.4 were recognized in 2018, 2017, and 2016, respectively. The remaining gain will be recognized as follows: $8.0 in 2019, $8.1 in 2020, $8.4 in 2021, and $4.0 in 2022.
2018 ANNUAL REPORT 73
NOTES TO CONSOLIDATED FINANCIAL STATEMENTS
The J. M. Smucker Company
The following tables set forth the gross fair value amounts of derivative instruments recognized in the Consolidated Balance Sheets.
April 30, 2018 | ||||||||||||||||
Other Current Assets | Other Current Liabilities | Other Noncurrent Assets | Other Noncurrent Liabilities | |||||||||||||
Derivatives not designated as hedging instruments: | ||||||||||||||||
Commodity contracts | $ | 14.8 | $ | 6.8 | $ | 0.4 | $ | 0.2 | ||||||||
Foreign currency exchange contracts | 2.2 | 0.7 | — | — | ||||||||||||
Total derivative instruments | $ | 17.0 | $ | 7.5 | $ | 0.4 | $ | 0.2 | ||||||||
April 30, 2017 | ||||||||||||||||
Other Current Assets | Other Current Liabilities | Other Noncurrent Assets | Other Noncurrent Liabilities | |||||||||||||
Derivatives not designated as hedging instruments: | ||||||||||||||||
Commodity contracts | $ | 5.2 | $ | 21.2 | $ | — | $ | — | ||||||||
Foreign currency exchange contracts | 3.2 | 0.1 | — | — | ||||||||||||
Total derivative instruments | $ | 8.4 | $ | 21.3 | $ | — | $ | — | ||||||||
We have elected to not offset fair value amounts recognized for our exchange-traded derivative instruments and our cash margin accounts executed with the same counterparty that are generally subject to enforceable netting agreements. We are required to maintain cash margin accounts in connection with funding the settlement of our open positions. At April 30, 2018 and 2017, we maintained cash margin account balances of $10.9 and $41.8, respectively, included in other current assets in the Consolidated Balance Sheets. The change in the cash margin account balances is included in other – net, investing activities in the Statements of Consolidated Cash Flows. In the event of default and immediate net settlement of all of our open positions with individual counterparties, all of our derivative liabilities would be fully offset by either our derivative asset positions or margin accounts based on the net asset or liability position with our individual counterparties.
Interest expense – net, as presented in the Statements of Consolidated Income, was $174.1, $163.1, and $171.1 in 2018, 2017, and 2016, respectively. Within interest expense, we recognized $0.5 in net pre-tax losses related to terminated interest rate contracts during 2018 and $0.6 during both 2017 and 2016. Included as a component of accumulated other comprehensive income (loss) at April 30, 2018 and 2017, were deferred net pre-tax losses of $3.8 and $7.0, respectively, related to the terminated interest rate contracts. The related net tax benefit recognized in accumulated other comprehensive income (loss) was $0.9 and $2.6 at April 30, 2018 and 2017, respectively. Approximately $0.4 of the net pre-tax loss will be recognized over the next 12 months related to the terminated interest rate contracts.
The following table presents the net gains and losses recognized in cost of products sold on derivatives not designated as hedging instruments.
Year Ended April 30, | |||||||||||
2018 | 2017 | 2016 | |||||||||
Gains (losses) on commodity contracts | $ | 6.5 | $ | (45.2 | ) | $ | (31.6 | ) | |||
Gains (losses) on foreign currency exchange contracts | (5.9 | ) | 9.8 | 2.0 | |||||||
Total gains (losses) recognized in costs of products sold | $ | 0.6 | $ | (35.4 | ) | $ | (29.6 | ) | |||
Commodity and foreign currency exchange derivative gains and losses are reported in unallocated derivative gains and losses outside of segment operating results until the related inventory is sold. At that time, we reclassify the hedge gains and losses from unallocated derivative gains and losses to segment profit, allowing our segments to realize the economic effect of the hedge without experiencing any mark-to-market volatility. The following table presents the activity in unallocated derivative gains and losses.
Year Ended April 30, | |||||||||||
2018 | 2017 | 2016 | |||||||||
Net gains (losses) on mark-to-market valuation of unallocated derivative positions | $ | 0.6 | $ | (35.4 | ) | $ | (29.6 | ) | |||
Less: Net gains (losses) on derivative positions reclassified to segment operating profit | (36.7 | ) | (8.2 | ) | (41.6 | ) | |||||
Unallocated derivative gains (losses) | $ | 37.3 | $ | (27.2 | ) | $ | 12.0 | ||||
74 THE J. M. SMUCKER COMPANY
NOTES TO CONSOLIDATED FINANCIAL STATEMENTS
The J. M. Smucker Company
The net cumulative unallocated derivative gains and losses at April 30, 2018 and 2017, were gains of $1.7 and losses of $35.6, respectively.
The following table presents the gross contract notional value of outstanding derivative contracts.
Year Ended April 30, | |||||||
2018 | 2017 | ||||||
Commodity contracts | $ | 658.0 | $ | 704.9 | |||
Foreign currency exchange contracts | 122.1 | 195.4 | |||||
NOTE 11 | OTHER FINANCIAL INSTRUMENTS AND FAIR VALUE MEASUREMENTS | |
Financial instruments, other than derivatives, that potentially subject us to significant concentrations of credit risk consist principally of cash investments, short-term borrowings, and trade receivables. The carrying value of these financial instruments approximates fair value. Our remaining financial instruments, with the exception of long-term debt, are recognized at estimated fair value in the Consolidated
Balance Sheets.
The following table provides information on the carrying amounts and fair values of our financial instruments.
April 30, 2018 | April 30, 2017 | ||||||||||||||
Carrying Amount | Fair Value | Carrying Amount | Fair Value | ||||||||||||
Marketable securities and other investments | $ | 45.8 | $ | 45.8 | $ | 47.3 | $ | 47.3 | |||||||
Derivative financial instruments – net | 9.7 | 9.7 | (12.9 | ) | (12.9 | ) | |||||||||
Long-term debt | (4,688.0 | ) | (4,579.8 | ) | (4,944.5 | ) | (5,023.8 | ) | |||||||
Fair value is defined as the price that would be received to sell an asset or paid to transfer a liability in an orderly transaction between market participants at the measurement date. Valuation techniques are based on observable and unobservable inputs. Observable inputs reflect readily obtainable data from independent sources, while unobservable inputs reflect our market assumptions.
The following tables summarize the fair values and the levels within the fair value hierarchy in which the fair value measurements fall for our financial instruments.
Quoted Prices in Active Markets for Identical Assets (Level 1) | Significant Observable Inputs (Level 2) | Significant Unobservable Inputs (Level 3) | Fair Value at April 30, 2018 | |||||||||||||
Marketable securities and other investments: (A) | ||||||||||||||||
Equity mutual funds | $ | 9.3 | $ | — | $ | — | $ | 9.3 | ||||||||
Municipal obligations | — | 36.1 | — | 36.1 | ||||||||||||
Money market funds | 0.4 | — | — | 0.4 | ||||||||||||
Derivative financial instruments: (B) | ||||||||||||||||
Commodity contracts – net | 7.2 | 1.0 | — | 8.2 | ||||||||||||
Foreign currency exchange contracts – net | 0.1 | 1.4 | — | 1.5 | ||||||||||||
Long-term debt (C) | (4,579.8 | ) | — | — | (4,579.8 | ) | ||||||||||
Total financial instruments measured at fair value | $ | (4,562.8 | ) | $ | 38.5 | $ | — | $ | (4,524.3 | ) | ||||||
2018 ANNUAL REPORT 75
NOTES TO CONSOLIDATED FINANCIAL STATEMENTS
The J. M. Smucker Company
Quoted Prices in Active Markets for Identical Assets (Level 1) | Significant Observable Inputs (Level 2) | Significant Unobservable Inputs (Level 3) | Fair Value at April 30, 2017 | |||||||||||||
Marketable securities and other investments: (A) | ||||||||||||||||
Equity mutual funds | $ | 1.1 | $ | — | $ | — | $ | 1.1 | ||||||||
Municipal obligations | — | 34.7 | — | 34.7 | ||||||||||||
Money market funds | 11.5 | — | — | 11.5 | ||||||||||||
Derivative financial instruments: (B) | ||||||||||||||||
Commodity contracts – net | (15.8 | ) | (0.2 | ) | — | (16.0 | ) | |||||||||
Foreign currency exchange contracts – net | 0.3 | 2.8 | — | 3.1 | ||||||||||||
Long-term debt (C) | (4,473.2 | ) | (550.6 | ) | — | (5,023.8 | ) | |||||||||
Total financial instruments measured at fair value | $ | (4,476.1 | ) | $ | (513.3 | ) | $ | — | $ | (4,989.4 | ) | |||||
(A) | Marketable securities and other investments consist of funds maintained for the payment of benefits associated with nonqualified retirement plans. The funds include equity securities listed in active markets, municipal obligations valued by a third party using valuation techniques that utilize inputs that are derived principally from or corroborated by observable market data, and money market funds with maturities of three months or less. Based on the short-term nature of these money market funds, carrying value approximates fair value. As of April 30, 2018, our municipal obligations are scheduled to mature as follows: $1.4 in 2019, $1.7 in 2020, $4.9 in 2021, $1.0 in 2022, and the remaining $27.1 in 2023 and beyond. For additional information, see Marketable Securities and Other Investments in Note 1: Accounting Policies. |
(B) | Level 1 commodity and foreign currency exchange derivatives are valued using quoted market prices for identical instruments in active markets. Level 2 commodity and foreign currency exchange derivatives are valued using quoted prices for similar assets or liabilities in active markets. For additional information, see Note 10: Derivative Financial Instruments. |
(C) | Long-term debt is comprised of public Senior Notes classified as Level 1. In 2017, the previous term loan that was due March 23, 2020 is classified as Level 2. The public Senior Notes are traded in an active secondary market and valued using quoted prices. The value of the term loan was based on the net present value of each interest and principal payment calculated, utilizing an interest rate derived from an estimated yield curve obtained from independent pricing sources for similar types of term loan borrowing arrangements. For additional information, see Note 8: Debt and Financing Arrangements. |
Furthermore, we recognized impairment charges of $176.9 during 2018, of which $145.0 and $31.9 related to the goodwill of the Pet Foods reporting unit and certain indefinite-lived trademarks within the U.S. Retail Pet Foods segment, respectively. During 2017, we recognized impairment charges of $133.2, which was related to the impairment of certain indefinite-lived trademarks in the U.S. Retail Pet Foods segment. These adjustments were included as noncash charges in our Statements of Consolidated Income. We utilized Level 3 inputs based on management’s best estimates and assumptions to estimate the fair value of the reporting unit and indefinite-lived trademarks. For additional information, see Goodwill and Other Intangible Assets in Note 1: Accounting Policies, and
Note 7: Goodwill and Other Intangible Assets.
NOTE 12 | SHARE-BASED PAYMENTS | |
We provide for equity-based incentives to be awarded to key employees and non-employee directors. Currently, these incentives consist of restricted shares, restricted stock units (which may also be referred to as deferred stock units), performance units, and stock options. These awards are administered primarily through the 2010 Equity and Incentive Compensation Plan initially approved by our shareholders in August 2010 and re-approved in August 2015. Awards under this plan may be in the form of stock options, stock appreciation rights, restricted shares, restricted stock units, performance shares, performance units, incentive awards, and other share-based awards. Awards under this plan may be granted to our non-employee directors, consultants, officers, and other employees. Deferred stock units granted to non-employee directors vest immediately and, along with dividends credited on those deferred stock units, are paid out in the form of common shares upon termination of service as a non-employee director. At April 30, 2018, there were 5,174,159 shares available for future issuance under this plan.
Under the 2010 Equity and Incentive Compensation Plan, we have the option to settle share-based awards by issuing common shares
from treasury, issuing new Company common shares, or issuing a combination of common shares from treasury and new Company
common shares.
76 THE J. M. SMUCKER COMPANY
NOTES TO CONSOLIDATED FINANCIAL STATEMENTS
The J. M. Smucker Company
Stock Options: Under the 2010 Equity and Incentive Compensation Plan, we granted no stock options during both 2018 and 2017, and 370,000 stock options during 2016. The options vest over a period of one to three years dependent on the continued service of the option holder, as well as the achievement of performance objectives established on the grant date. The exercise price of all stock options granted is equal to the market value of the shares on the date of grant. All stock options granted during 2016 have a contractual term of 10 years.
The fair value of each stock option is estimated on the date of grant using a Black-Scholes option-pricing model with the following weighted-average assumptions for stock options granted in 2016:
2016 | |||
Expected volatility (%) | 20.7 | % | |
Dividend Yield (%) | 2.3 | % | |
Risk-free interest rate (%) | 1.9 | % | |
Expected life of stock option (years) | 5.9 | ||
Expected volatility was calculated in accordance with the provisions of FASB ASC 718, Compensation – Stock Compensation, based on consideration of both historical and implied volatilities. The expected life of a stock option represents the period from the grant date through the expected exercise date of the option. This was calculated using a simplified method whereby the midpoint between the vesting date and the end of the contractual term is utilized to compute the expected term.
The following table is a summary of our stock option activity.
Number of Stock Options | Weighted-Average Exercise Price | |||||
Outstanding at May 1, 2017 | 915,000 | $ | 113.07 | |||
Exercised | 35,002 | 111.86 | ||||
Cancelled | 56,666 | 111.86 | ||||
Outstanding at April 30, 2018 | 823,332 | $ | 113.20 | |||
Exercisable at April 30, 2018 | 270,006 | $ | 113.22 | |||
The intrinsic value of a stock option is the amount by which the market value of the underlying stock exceeds the exercise price of the option. The total intrinsic value for stock options outstanding and exercisable at April 30, 2018, was $1.6 and $0.5, respectively, both with an average remaining contractual term of 7.0 years. The total intrinsic value of stock options exercised during 2018 and 2016 was $0.6 and $0.1, respectively. During 2017, there were no stock options exercised. The closing market price of our common stock on the last trading day of 2018 was $114.08 per share. The stock options granted during 2016 have a weighted-average grant date fair value of $18.67 per option.
For stock options granted, compensation cost will be recognized ratably over the service period for each vesting tranche from the grant
date through the end of the requisite service period to the extent the performance objectives are likely to be achieved. During 2017, we concluded that a portion of the performance objectives were unachievable, and therefore reversed the life-to-date compensation cost recognized. For the year ended April 30, 2017, the compensation net benefit for stock option awards totaled $1.0, and compensation cost totaled $0.4 and $8.1 for the years ended April 30, 2018, and 2016, respectively, which was included in other special project costs in the Statements of Consolidated Income. The tax expense related to the stock option net benefit was $0.4 for 2017, and the tax benefit related to the stock option expense was $0.1 and $3.0 for 2018 and 2016, respectively. At April 30, 2018, we had no unrecognized compensation cost related to stock options.
Cash received from stock option exercises for the years ended April 30, 2018 and 2016, was $3.9 and $0.1, respectively. We received no cash from stock option exercises for the year ended April 30, 2017.
2018 ANNUAL REPORT 77
NOTES TO CONSOLIDATED FINANCIAL STATEMENTS
The J. M. Smucker Company
Other Equity Awards: The following table is a summary of our restricted shares, deferred stock units, and performance units.
Restricted Shares and Deferred Stock Units | Weighted- Average Grant Date Fair Value | Performance Units | Weighted- Average Conversion Date Fair Value | ||||||||||
Outstanding at May 1, 2017 | 573,405 | $ | 115.88 | 73,701 | $ | 126.80 | |||||||
Granted | 136,127 | 126.80 | 84,051 | 103.86 | |||||||||
Converted | 73,701 | 126.80 | (73,701 | ) | 126.80 | ||||||||
Vested | (161,581 | ) | 106.04 | — | — | ||||||||
Forfeited | (79,294 | ) | 120.27 | — | — | ||||||||
Outstanding at April 30, 2018 | 542,358 | $ | 122.39 | 84,051 | $ | 103.86 | |||||||
The weighted-average grant date fair value of equity awards other than stock options that vested in 2018, 2017, and 2016 was $17.1, $24.6, and $18.7, respectively. The vesting date fair value of equity awards other than stock options that vested in 2018, 2017, and 2016 was $20.7, $32.7, and $24.4, respectively. The weighted-average grant date fair value of restricted shares and deferred stock units is the average of the high and the low share price on the date of grant. The weighted-average conversion date fair value of performance units is the average of the high and the low share price on the date of conversion to restricted shares. The following table summarizes the weighted-average fair values of the equity awards granted.
Year Ended April 30, | Restricted Shares and Deferred Stock Units | Weighted- Average Grant Date Fair Value | Performance Units | Weighted- Average Conversion Date Fair Value | |||||||||
2018 | 136,127 | $ | 126.80 | 84,051 | $ | 103.86 | |||||||
2017 | 180,997 | 133.92 | 73,701 | 126.80 | |||||||||
2016 | 97,922 | 113.57 | 121,936 | 132.46 | |||||||||
The performance units column represents the number of restricted shares received by certain executive officers, subsequent to year-end, upon conversion of the performance units earned during the year. Restricted shares and deferred stock units generally vest four years from the date of grant or upon the attainment of a defined age and years of service, subject to certain retention requirements.
NOTE 13 | INCOME TAXES | |
Income before income taxes is as follows:
Year Ended April 30, | |||||||||||
2018 | 2017 | 2016 | |||||||||
Domestic | $ | 828.6 | $ | 836.8 | $ | 959.3 | |||||
Foreign | 32.4 | 41.6 | 18.6 | ||||||||
Income before income taxes | $ | 861.0 | $ | 878.4 | $ | 977.9 | |||||
On December 22, 2017, the U.S. government enacted “An Act to Provide for Reconciliation Pursuant to Titles II and V of the Concurrent Resolution on the Budget for Fiscal Year 2018” (the “Act”), which is commonly referred to as “The Tax Cuts and Jobs Act.” The Act provides for comprehensive tax legislation that reduces the U.S. federal statutory corporate tax rate from 35.0 percent to 21.0 percent effective January 1, 2018, broadens the U.S. federal income tax base, requires companies to pay a one-time repatriation tax on earnings of certain foreign subsidiaries that were previously tax deferred (“transition tax”), and creates new taxes on certain foreign-sourced earnings as part of a new territorial tax regime. As we have an April 30 fiscal year-end, the lower corporate income tax rate is administratively phased in, resulting in a blended U.S. federal statutory tax rate of approximately 30.4 percent for our fiscal year ended April 30, 2018, and
21.0 percent for our fiscal years thereafter.
In March 2018, the FASB issued ASU 2018-05, Amendments to SEC Paragraphs Pursuant to SEC Staff Accounting Bulletin No. 118, which amends the FASB ASC 740, Income Taxes, to add the SEC guidance in SAB 118 concerning the application of U.S. GAAP when accounting for the income tax effects of the Act for the reporting period that includes the enactment date. ASU 2018-05 recognizes that a registrant’s review of certain income tax effects of the Act may be incomplete at the time financial statements are issued for the reporting
78 THE J. M. SMUCKER COMPANY
NOTES TO CONSOLIDATED FINANCIAL STATEMENTS
The J. M. Smucker Company
period that includes the enactment date, including interim periods therein. Specifically, ASU 2018-05 allows a company to report provisional estimates in the reporting period that includes the enactment date if the company does not have the necessary information available, prepared, or fully analyzed for certain income tax effects of the Act. The provisional estimates would be adjusted during a measurement period not to exceed 12 months from the enactment date of the Act, at which time the accounting for the income tax effects of the Act is required to be completed. For additional information on ASU 2018-05, see Recently Issued Accounting Standards in Note 1: Accounting Policies.
During the third quarter of 2018, we recorded a net provisional benefit of $765.8, which included the revaluation of net deferred tax liabilities at the reduced federal income tax rate offset in part by the estimated impact of the one-time transition tax. In addition to the estimates further described below, we also used assumptions and estimates that may change as a result of future guidance and interpretation from the Internal Revenue Service (“IRS”), the SEC, the FASB, and various taxing jurisdictions. All of these potential legislative and interpretive actions could result in adjustment to our provisional estimates when the accounting for the income tax effects of the Act is completed. During the fourth quarter of 2018, there were no adjustments to the recorded provisional amount.
Accordingly, our income tax provision as of April 30, 2018, reflects the current year impacts of the Act and the following provisional estimates of our adjustments resulting directly from the enactment of the Act based on information available, prepared, or analyzed to date in reasonable detail.
(Provisional amounts recorded) | Year Ended April 30, 2018 | |||
Net impact on U.S. deferred tax assets and liabilities | $ | (791.9 | ) | |
Transition tax | 26.1 | |||
Net impact of adjustments | $ | (765.8 | ) | |
The provisional net benefit amount of $765.8 from the adjustments is included as a component of income tax expense (benefit) in the Statement of Consolidated Income.
Deferred tax assets and liabilities: We remeasured our existing U.S. deferred tax assets and liabilities based on the rates at which they are expected to reverse in the future. The provisional amount recorded related to the remeasurement of our deferred tax balance is a benefit of $791.9. We determined that the calculation cannot be completed until all of the underlying timing differences are finalized. Furthermore, we are still analyzing certain aspects of the Act and refining our calculations, which could potentially affect the measurement of these balances or potentially give rise to new or additional deferred tax amounts. We anticipate completing the accounting for the reduced federal tax rate on our deferred tax balances, with any further adjustments to the provisional amount to be reported as a component of income tax expense (benefit).
Foreign tax effects: The transition tax is based on our total post-1986 foreign earnings and profits, which were previously deferred from U.S. income taxes and the related available foreign tax credits. We recorded a provisional income tax expense of $26.1 for the transition tax for our foreign subsidiaries, and determined that the transition tax is provisional because numerous components of the computation are estimated as of April 30, 2018. Consistent with provisions allowed in the Act, the $26.1 estimated transition tax liability is expected to be paid over an eight-year period, which began in 2018. The remaining amount of the estimated transition tax liability is included in other noncurrent liabilities in the Consolidated Balance Sheet. We anticipate concluding the analysis of accumulated foreign earnings and profits and related foreign taxes paid on an entity-by-entity basis and completing the accounting for the transition tax in the third quarter of 2019, with any further adjustments to the provisional amount to be reported as a component of income tax expense (benefit).
Deferred income taxes have not been provided on approximately $226.0 of temporary differences related to investments in foreign subsidiaries since these amounts are considered to be permanently reinvested. It is not practical to estimate the amount of additional taxes that might be payable on these basis differences because of the multiple methods by which these differences could reverse.
While the Act generally transitions the U.S. tax system to a territorial regime, it also introduces a new requirement to tax certain income from foreign operations, known as Global Intangible Low Taxed Income (“GILTI”), effective for us beginning in 2019. Under U.S. GAAP, we are allowed to make an accounting policy election and record the taxes related to GILTI as either a period cost as incurred or consider such amounts into the measurement of deferred taxes. Due to the complexity of the new GILTI rules and limited guidance issued by the IRS, we are evaluating and have not yet computed a reasonable estimate of the impact of this provision, and therefore, have not made an accounting policy decision regarding this item.
2018 ANNUAL REPORT 79
NOTES TO CONSOLIDATED FINANCIAL STATEMENTS
The J. M. Smucker Company
During the fourth quarter of 2018, we elected to early adopt ASU 2018-02, Income Statement – Reporting Comprehensive Income
(Topic 220) Reclassification of Certain Tax Effects from Accumulated Other Comprehensive Income, which allowed us to reclassify $15.0 of stranded income tax effects resulting from the Act from accumulated other comprehensive income (loss) to retained earnings. This reclassification consists of deferred taxes originally recorded in accumulated other comprehensive income (loss) at rates that exceed the newly enacted federal corporate tax rate. For additional information, see Recently Issued Accounting Standards in Note 1: Accounting Policies.
The components of the provision for income taxes are as follows:
Year Ended April 30, | ||||||||||||
2018 | 2017 | 2016 | ||||||||||
Current: | ||||||||||||
Federal | $ | 277.9 | $ | 325.1 | $ | 342.5 | ||||||
Foreign | 7.9 | 11.0 | 4.8 | |||||||||
State and local | 40.0 | 29.4 | 37.1 | |||||||||
Deferred: | ||||||||||||
Federal | (802.3 | ) | (78.3 | ) | (32.1 | ) | ||||||
Foreign | 0.5 | 1.6 | 1.3 | |||||||||
State and local | (1.6 | ) | (2.7 | ) | (64.4 | ) | ||||||
Total income tax expense (benefit) | $ | (477.6 | ) | $ | 286.1 | $ | 289.2 | |||||
A reconciliation of the statutory federal income tax rate and the effective income tax rate is as follows:
Year Ended April 30, | ||||||||||||||
(Percent of Pre-tax Income) | 2018 | 2017 | 2016 | |||||||||||
Statutory federal income tax rate | 30.4 | % | 35.0 | % | 35.0 | % | ||||||||
Tax reform – net impact on U.S. deferred tax assets and liabilities (provisional) | (92.0 | ) | — | — | ||||||||||
Tax reform – transition tax (provisional) | 3.0 | — | — | |||||||||||
Goodwill impairment | 5.5 | — | — | |||||||||||
State and local income taxes | 1.9 | 2.1 | 2.5 | |||||||||||
Domestic manufacturing deduction | (3.0 | ) | (3.7 | ) | (3.5 | ) | ||||||||
Deferred tax benefit from integration | — | — | (5.2 | ) | ||||||||||
Other items – net | (1.3 | ) | (0.8 | ) | 0.8 | |||||||||
Effective income tax rate | (55.5 | )% | 32.6 | % | 29.6 | % | ||||||||
Income taxes paid | $ | 336.8 | $ | 367.2 | $ | 290.5 | ||||||||
The effective tax rate of 29.6 percent in 2016 includes the recognition in the fourth quarter of a $50.5 noncash deferred tax benefit related to the integration of Big Heart into the Company.
We are a voluntary participant in the Compliance Assurance Process (“CAP”) program offered by the IRS and are currently under a CAP examination for the tax year ended April 30, 2018. Through the contemporaneous exchange of information with the IRS, this program is designed to identify and resolve tax positions with the IRS prior to the filing of a tax return, which allows us to remain current with our IRS examinations. The IRS has completed the CAP examinations for the tax years ended April 30, 2015, 2016, and 2017. The tax years prior to 2015 are no longer subject to U.S. federal tax examination. With limited exceptions, we are no longer subject to examination for state and local jurisdictions for the tax years prior to 2014 and for the tax years prior to 2011 for foreign jurisdictions.
80 THE J. M. SMUCKER COMPANY
NOTES TO CONSOLIDATED FINANCIAL STATEMENTS
The J. M. Smucker Company
Deferred income taxes reflect the tax effects of temporary differences between the carrying amounts of assets and liabilities for financial reporting purposes and the amounts used for income tax reporting. Significant components of our deferred tax assets and liabilities are
as follows:
April 30, | |||||||
2018 | 2017 | ||||||
Deferred tax liabilities: | |||||||
Intangible assets | $ | 1,393.6 | $ | 2,248.0 | |||
Property, plant, and equipment | 98.5 | 129.8 | |||||
Other | 14.2 | 16.5 | |||||
Total deferred tax liabilities | $ | 1,506.3 | $ | 2,394.3 | |||
Deferred tax assets: | |||||||
Post-employment and other employee benefits | $ | 75.5 | $ | 146.3 | |||
Tax credit and loss carryforwards | 0.2 | 1.8 | |||||
Intangible assets | 18.8 | 25.4 | |||||
Inventory | 5.9 | 10.5 | |||||
Property, plant, and equipment | 6.4 | 3.1 | |||||
Other | 25.2 | 43.8 | |||||
Total deferred tax assets | $ | 132.0 | $ | 230.9 | |||
Valuation allowance | (2.9 | ) | (3.6 | ) | |||
Total deferred tax assets, less allowance | $ | 129.1 | $ | 227.3 | |||
Net deferred tax liability | $ | 1,377.2 | $ | 2,167.0 | |||
As described previously, our 2018 U.S. deferred assets and liabilities have been remeasured, on a provisional basis, for the reduced federal income tax rates of the Act.
We evaluate the realizability of deferred tax assets for each of the jurisdictions in which we operate. The total valuation allowance decreased by a net amount of $0.7 during the year.
Our unrecognized tax benefits were $32.3, $40.4, and $46.3, of which $21.5, $23.1, and $32.6 would affect the effective tax rate, if recognized, as of April 30, 2018, 2017, and 2016, respectively. Our accrual for tax-related net interest and penalties totaled $4.0, $4.1, and $3.8 as of April 30, 2018, 2017, and 2016, respectively. Interest charged to earnings totaled $0.1, $0.3, and $0.6 during 2018, 2017, and 2016, respectively.
Within the next 12 months, it is reasonably possible that we could decrease our unrecognized tax benefits by an estimated $9.5, primarily as a result of the expiration of statute of limitation periods.
A reconciliation of our unrecognized tax benefits is as follows:
2018 | 2017 | 2016 | |||||||||
Balance at May 1, | $ | 40.4 | $ | 46.3 | $ | 45.0 | |||||
Increases: | |||||||||||
Current year tax positions | 1.1 | 0.7 | 3.3 | ||||||||
Prior year tax positions | 0.5 | 1.2 | 0.2 | ||||||||
Acquired businesses | — | — | 3.3 | ||||||||
Decreases: | |||||||||||
Prior year tax positions | — | 0.9 | 0.9 | ||||||||
Settlement with tax authorities | 3.0 | 1.1 | 2.5 | ||||||||
Expiration of statute of limitations periods | 6.7 | 5.8 | 2.1 | ||||||||
Balance at April 30, | $ | 32.3 | $ | 40.4 | $ | 46.3 | |||||
2018 ANNUAL REPORT 81
NOTES TO CONSOLIDATED FINANCIAL STATEMENTS
The J. M. Smucker Company
NOTE 14 | ACCUMULATED OTHER COMPREHENSIVE INCOME (LOSS) | |
The components of accumulated other comprehensive income (loss), including the reclassification adjustments for items that are reclassified from accumulated other comprehensive income (loss) to net income, are shown below.
Foreign Currency Translation Adjustment | Net Gains (Losses) on Cash Flow Hedging Derivatives (A) | Pension and Other Postretirement Liabilities (B) | Unrealized Gain (Loss) on Available-for-Sale Securities | Accumulated Other Comprehensive Income (Loss) | ||||||||||||||||
Balance at May 1, 2015 | $ | (2.3 | ) | $ | (5.2 | ) | $ | (105.6 | ) | $ | 3.3 | $ | (109.8 | ) | ||||||
Reclassification adjustments | — | 0.6 | 10.2 | — | 10.8 | |||||||||||||||
Current period credit (charge) | (10.8 | ) | — | (54.6 | ) | 0.4 | (65.0 | ) | ||||||||||||
Income tax benefit (expense) | — | (0.2 | ) | 15.9 | (0.1 | ) | 15.6 | |||||||||||||
Balance at April 30, 2016 | $ | (13.1 | ) | $ | (4.8 | ) | $ | (134.1 | ) | $ | 3.6 | $ | (148.4 | ) | ||||||
Reclassification adjustments | — | 0.6 | 13.2 | — | 13.8 | |||||||||||||||
Current period credit (charge) | (29.9 | ) | — | 39.6 | 0.6 | 10.3 | ||||||||||||||
Income tax benefit (expense) | — | (0.2 | ) | (18.7 | ) | (0.2 | ) | (19.1 | ) | |||||||||||
Balance at April 30, 2017 | $ | (43.0 | ) | $ | (4.4 | ) | $ | (100.0 | ) | $ | 4.0 | $ | (143.4 | ) | ||||||
Reclassification adjustments | — | 0.5 | 10.7 | — | 11.2 | |||||||||||||||
Current period credit (charge) | 26.6 | 2.7 | 9.2 | (1.7 | ) | 36.8 | ||||||||||||||
Income tax benefit (expense) | — | (1.2 | ) | (5.6 | ) | 0.5 | (6.3 | ) | ||||||||||||
Reclassification of stranded tax effects (C) | — | (0.5 | ) | (15.3 | ) | 0.8 | (15.0 | ) | ||||||||||||
Balance at April 30, 2018 | $ | (16.4 | ) | $ | (2.9 | ) | $ | (101.0 | ) | $ | 3.6 | $ | (116.7 | ) | ||||||
(A) | The reclassification from accumulated other comprehensive income (loss) to interest expense was related to terminated interest rate contracts. The 2018 credit relates to the gain on the interest rate contract terminated in December 2017. For additional information, see Note 10: Derivative Financial Instruments. |
(B) | Amortization of net losses was reclassified from accumulated other comprehensive income (loss) to SD&A. |
(C) | During the fourth quarter of 2018, we elected to early adopt ASU 2018-02, Income Statement – Reporting Comprehensive Income (Topic 220) Reclassification of Certain Tax Effects from Accumulated Other Comprehensive Income, which allowed us to reclassify the stranded income tax effects resulting from the Act from accumulated other comprehensive income (loss) to retained earnings. For additional information, see Note 13: Income Taxes. |
82 THE J. M. SMUCKER COMPANY
NOTES TO CONSOLIDATED FINANCIAL STATEMENTS
The J. M. Smucker Company
NOTE 15 | CONTINGENCIES | |
We, like other food manufacturers, are from time to time subject to various administrative, regulatory, and other legal proceedings arising in the ordinary course of business. We are currently a defendant in a variety of such legal proceedings. We cannot predict with certainty
the ultimate results of these proceedings or reasonably determine a range of potential loss. Our policy is to accrue losses for contingent liabilities when such liabilities are probable and amounts can be reasonably estimated. Based on the information known to date, with the exception of the matter discussed below, we do not believe the final outcome of these proceedings could have a material adverse effect on our financial position, results of operations, or cash flows.
On May 9, 2011, an organization named Council for Education and Research on Toxics (“Plaintiff”) filed a lawsuit in the Superior Court of the State of California, County of Los Angeles, against us and additional defendants who manufacture, package, distribute, or sell packaged coffee. The lawsuit is Council for Education and Research on Toxics v. Brad Barry LLC, et al., and was a tag along to a 2010 lawsuit against companies selling “ready-to-drink” coffee based on the same claims. Both cases have since been consolidated and now include nearly eighty defendants, which constitute the great majority of the coffee industry in California. The Plaintiff alleges that we and the other defendants failed to provide warnings for our coffee products of exposure to the chemical acrylamide as required under California Health and Safety Code Section 25249.5, the California Safe Drinking Water and Toxic Enforcement Act of 1986, better known as
“Proposition 65.” The Plaintiff seeks equitable relief, including providing warnings to consumers of coffee products, as well as civil penalties in the amount of the statutory maximum of $2,500.00 per day per violation of Proposition 65. The Plaintiff asserts that every consumed cup of coffee, absent a compliant warning, is equivalent to a violation under Proposition 65.
As part of a joint defense group organized to defend against the lawsuit, we dispute the claims of the Plaintiff. Acrylamide is not added to coffee, but is present in all coffee in small amounts (measured in parts per billion) as a byproduct of the coffee bean roasting process. We have asserted multiple affirmative defenses. Trial of the first phase of the case commenced on September 8, 2014, and was limited to three affirmative defenses shared by all defendants. On September 1, 2015, the trial court issued a final ruling adverse to the defendants on all Phase 1 defenses. Trial of the second phase of the case commenced in the fall of calendar year 2017. On March 28, 2018, the trial court issued a proposed ruling adverse to the defendants on the Phase 2 defense, our last remaining defense to liability. The trial court finalized and affirmed its Phase 2 ruling on May 7, 2018 and, therefore, the trial will proceed to the third phase regarding remedies issues.
At this stage of the proceedings, prior to a trial on remedies issues, we are unable to predict or reasonably estimate the potential loss or effect on our operations. Accordingly, no loss contingency has been recorded for this matter as of April 30, 2018, as the likelihood of loss is not considered probable or estimable. The trial court has discretion to impose zero penalties against us or to impose significant statutory penalties. Significant labeling or warning requirements that could potentially be imposed by the trial court may increase our costs and adversely affect sales of our coffee products, as well as involve substantial expense and operational disruption, which could have a material adverse impact on our financial position, results of operations, or cash flows. Furthermore, a future appellate court decision could reverse the trial court rulings. The outcome and the financial impact of settlement, or the trial or appellate court rulings of the case, if any, cannot be predicted at this time.
2018 ANNUAL REPORT 83
NOTES TO CONSOLIDATED FINANCIAL STATEMENTS
The J. M. Smucker Company
NOTE 16 | GUARANTOR AND NON-GUARANTOR FINANCIAL INFORMATION | |
In September 2017, we terminated the revolving credit facility that was entered into in September 2013, and as a result, the guarantees provided by the subsidiary guarantors were released. In addition, the subsidiary guarantors are not guarantors under the new $1.8 billion revolving credit facility entered into in September 2017. As a result, the guarantees of the subsidiary guarantors, in respect to the obligations under the term loan due March 23, 2020, and all of our outstanding Senior Notes, were released in accordance with the terms of the amended term loan agreement for the term loan due March 23, 2020, and the indentures governing such notes, as applicable. As the Senior Notes were not guaranteed as of April 30, 2018, the condensed consolidating financial statements are not provided for the subsidiary guarantors. For additional information, see Note 8: Debt and Financing Arrangements.
NOTE 17 | COMMON SHARES | |
Voting: The Amended Articles of Incorporation (“Articles”) provide that each holder of a common share outstanding is entitled to one vote on each matter submitted to a vote of the shareholders, except for the following specific matters:
• any matter that relates to or would result in the dissolution or liquidation of the Company;
• the adoption of any amendment to the Articles or Amended Regulations, or the adoption of amended Articles, other than the adoption of any amendment or amended Articles that increases the number of votes to which holders of our common shares are entitled or expands the matters to which time-phased voting applies;
• any proposal or other action to be taken by our shareholders relating to the Rights Agreement, dated as of May 20, 2009, between the Company and Computershare Trust Company, N.A., or any successor plan;
• any matter relating to any stock option plan, stock purchase plan, executive compensation plan, executive benefit plan, or other similar plan, arrangement, or agreement;
• the adoption of any agreement or plan of or for the merger, consolidation, or majority share acquisition of us or any of our subsidiaries with or into any other person, whether domestic or foreign, corporate or noncorporate, or the authorization of the lease, sale, exchange, transfer, or other disposition of all, or substantially all, of our assets;
• any matter submitted to our shareholders pursuant to Article Fifth (which relates to procedures applicable to certain business combinations) or Article Seventh (which relates to procedures applicable to certain proposed acquisitions of specified percentages of our outstanding common shares) of the Articles, as they may be further amended, or any issuance of our common shares for which shareholder approval is required by applicable stock exchange rules; and
• any matter relating to the issuance of our common shares or the repurchase of our common shares that the Board determines is required or appropriate to be submitted to our shareholders under the Ohio Revised Code or applicable stock exchange rules.
On the matters listed above, common shares are entitled to 10 votes per share if they meet the requirements set forth in the Articles. Common shares which would be entitled to 10 votes per share must meet one of the following criteria:
• common shares for which there has not been a change in beneficial ownership in the past four years; or
• common shares received through our various equity plans that have not been sold or otherwise transferred.
In the event of a change in beneficial ownership, the new owner of that common share will be entitled to only one vote with respect to that share on all matters until four years pass without a further change in beneficial ownership of the share.
Shareholders’ Rights Plan: Pursuant to a Shareholders’ Rights Plan adopted by the Board on May 20, 2009, one share purchase right is associated with each of our outstanding common shares.
Under the plan, the rights will initially trade together with our common shares and will not be exercisable. In the absence of further action by the directors, the rights generally will become exercisable and allow the holder to acquire our common shares at a discounted price if a person or group acquires 10 percent or more of our outstanding common shares. Rights held by persons who exceed the applicable threshold will be void. Shares held by members of the Smucker family are not subject to the threshold. If exercisable, each right entitles the shareholder to buy one common share at a discounted price. Under certain circumstances, the rights will entitle the holder to buy shares in an acquiring entity at a discounted price.
84 THE J. M. SMUCKER COMPANY
NOTES TO CONSOLIDATED FINANCIAL STATEMENTS
The J. M. Smucker Company
The plan also includes an exchange option. In general, if the rights become exercisable, the directors may, at their option, effect an exchange of part or all of the rights, other than rights that have become void, for common shares. Under this option, we would issue
one common share for each right, in each case subject to adjustment in certain circumstances.
The directors may, at their option, redeem all rights for $0.001 per right, generally at any time prior to the rights becoming exercisable. The rights will expire June 3, 2019, unless earlier redeemed, exchanged, or amended by the directors.
In connection with the Big Heart acquisition, we and the rights agent entered into an amendment to the plan providing that neither the approval, execution, delivery, or performance of the merger agreement or the shareholders’ agreement entered into in connection with the transaction will in any way give rise to any provision of the plan becoming effective, and that none of Blue Holdings I, L.P., the controlling stockholder of Blue Acquisition Group, Inc., or any of its affiliates will be deemed to be an acquiring person for purposes of the plan.
During 2017, we and the rights agent entered into another amendment to the plan to amend the definition of beneficial ownership to provide that, among other things and subject to certain exceptions, a person will not be deemed the beneficial owner of, or to beneficially own, the first 10 percent of then-outstanding common shares of the Company that would otherwise be deemed to be beneficially owned by such person, together with all its affiliates and associates, if such person is entitled to file, and files, a statement on Schedule 13G pursuant to Rule 13d-1(b) or Rule 14d-1(c) under the Securities and Exchange Act of 1934, as amended.
Repurchase Programs: During 2018, we did not repurchase any common shares under a repurchase plan authorized by the Board.
On February 22, 2017, we entered into a 10b5-1 trading plan (the “Plan”) to facilitate the repurchase of up to 3.0 million common shares under the Board’s authorizations. Purchases under the Plan commenced on February 27, 2017, and concluded on March 27, 2017, and were transacted by a broker based upon the guidelines and parameters of the Plan. During 2017, we repurchased 3.0 million common shares under the Plan for $418.1.
At April 30, 2018, approximately 3.6 million common shares were remaining available for repurchase pursuant to the Board’s authorizations.
2018 ANNUAL REPORT 85
DIRECTORS AND EXECUTIVE OFFICERS
The J. M. Smucker Company
DIRECTORS | ||
Kathryn W. DindoA | Kirk L. PerryE | Mark T. Smucker |
Retired Vice President and | President, Brand Solutions | President and Chief Executive Officer |
Chief Risk Officer | Google Inc. | The J. M. Smucker Company |
FirstEnergy Corp. | Mountain View, California | |
Akron, Ohio | ||
Paul J. DolanE | Sandra PianaltoA | Richard K. Smucker |
Chairman and Chief Executive Officer | Retired President and | Executive Chairman |
Cleveland Indians | Chief Executive Officer | The J. M. Smucker Company |
Cleveland, Ohio | Federal Reserve Bank of Cleveland | |
Cleveland, Ohio | ||
Jay L. HendersonA | Nancy Lopez RussellG | Timothy P. Smucker |
Retired Vice Chairman, Client Service | Founder | Chairman Emeritus |
PricewaterhouseCoopers LLP | Nancy Lopez Golf Company | The J. M. Smucker Company |
Chicago, Illinois | Palm City, Florida | |
Elizabeth Valk LongE | Alex ShumateG | Dawn C. WilloughbyG |
Retired Executive Vice President | Managing Partner, North America | Executive Vice President and |
Time Inc. | Squire Patton Boggs (US) LLP | Chief Operating Officer |
New York, New York | Columbus, Ohio | The Clorox Company |
Oakland, California | ||
Gary A. OateyE, G | ||
Executive Chairman | ||
Oatey Co. | ||
Cleveland, Ohio | ||
A Audit Committee Member; E Executive Compensation Committee Member; G Nominating, Governance, and Corporate Responsibility
Committee Member
EXECUTIVE OFFICERS | ||
Richard K. Smucker | Barry C. Dunaway* | David J. Lemmon* |
Executive Chairman | President, Pet Food and Pet Snacks | President, Canada, International, and U.S. Away From Home |
Mark T. Smucker | Tina R. Floyd | Jill R. Penrose |
President and Chief Executive Officer | Senior Vice President and General | Senior Vice President, Human Resources |
Manager, Consumer Foods | and Corporate Communications | |
Mark R. Belgya | Jeannette L. Knudsen | Joseph Stanziano |
Vice Chair and Chief Financial Officer | Senior Vice President, General Counsel | Senior Vice President and General |
and Secretary | Manager, Coffee | |
* Effective June 25, 2018, Mr. Lemmon will assume the position of President, Pet Food and Pet Snacks, and Mr. Dunaway will assume the position of Executive Advisor, Pet, until his retirement on July 31, 2018.
86 THE J. M. SMUCKER COMPANY
OUR LOCATIONS
The J. M. Smucker Company
CORPORATE OFFICE
Orrville, Ohio
DOMESTIC MANUFACTURING LOCATIONS
Bloomsburg, Pennsylvania | Lawrence, Kansas | Ripon, Wisconsin | ||
Buffalo, New York | Lexington, Kentucky | Scottsville, Kentucky | ||
Chico, California | Memphis, Tennessee | Seattle, Washington | ||
Cincinnati, Ohio | New Bethlehem, Pennsylvania | Suffolk, Virginia | ||
Decatur, Alabama | New Orleans, Louisiana (3) | Toledo, Ohio | ||
Grandview, Washington | Orrville, Ohio | Topeka, Kansas | ||
Havre de Grace, Maryland | Oxnard, California | |||
INTERNATIONAL MANUFACTURING LOCATION
Sherbrooke, Quebec, Canada
2018 ANNUAL REPORT 87
SHAREHOLDER INFORMATION
The J. M. Smucker Company
CORPORATE OFFICE
The J. M. Smucker Company
One Strawberry Lane
Orrville, Ohio 44667
Telephone: (330) 682-3000
STOCK LISTING
Our common shares are listed on the New York Stock Exchange — ticker symbol SJM.
CORPORATE WEBSITE
To learn more about The J. M. Smucker Company,
visit jmsmucker.com.
ANNUAL MEETING
The annual meeting will be held at 11:00 a.m. Eastern Time, August 15, 2018, at the Ritz-Carlton, 1515 West Third Street, Cleveland, Ohio 44113.
CORPORATE NEWS AND REPORTS
Corporate news releases, annual reports, and Securities and Exchange Commission filings, including Forms 10-K, 10-Q, and 8-K, are available free of charge on our website,
jmsmucker.com/investor-relations. They are also available
without cost to shareholders who submit a written request to:
The J. M. Smucker Company
Attention: Corporate Secretary
One Strawberry Lane
Orrville, Ohio 44667
CERTIFICATIONS
Our Chief Executive Officer has certified to the New York Stock Exchange that he is not aware of any violation by the Company of the New York Stock Exchange’s corporate governance listing standards. We have also filed with the Securities and Exchange Commission certain certifications relating to the quality of our public disclosures. These certifications are filed as exhibits to our Annual Report on Form 10-K.
FORWARD-LOOKING STATEMENTS
This Annual Report includes certain forward-looking statements that are based on current expectations and are subject to a number of risks and uncertainties. Please reference “Forward-Looking Statements” in the “Management’s Discussion and Analysis” section.
INDEPENDENT REGISTERED PUBLIC ACCOUNTING FIRM
Ernst & Young LLP
Akron, Ohio
Designed by Corporate Reports Inc. | Atlanta, GA | www.cricommunications.com
DIVIDENDS
Our Board of Directors typically declares a cash dividend each quarter. Dividends are generally payable on the first business day of March, June, September, and December. The record date is approximately two weeks before the payment date. Our dividend disbursement agent is Computershare Investor Services, LLC.
SHAREHOLDER SERVICES
Our transfer agent and registrar, Computershare Investor Services, LLC, is responsible for assisting registered shareholders with a variety of matters, including:
• | Shareholder investment program (CIPSM) |
– | Direct purchase of our common shares |
– | Dividend reinvestment |
– | Automatic monthly cash investments |
• | Book-entry share ownership |
• | Share transfer matters (including name changes, gifting, and inheritances) |
• | Direct deposit of dividend payments |
• | Nonreceipt of dividend checks |
• | Lost share certificates |
• | Changes of address |
• | Online shareholder account access |
• | Form 1099 income inquiries (including requests for duplicate copies) |
Shareholders may contact Shareholder Services at the corporate offices regarding other shareholder inquiries.
TRANSFER AGENT AND REGISTRAR
Computershare
P.O. Box 505000
Louisville, KY 40233
Telephone: (800) 456-1169
Telephone outside U.S., Canada, and Puerto Rico:
(312) 360-5254
Website: computershare.com/investor
The J. M. Smucker Company, or its subsidiaries, is the owner of all trademarks, except for the following, which are used under license: PillsburyTM is a trademark of the Pillsbury Company, LLC; Carnation® is a trademark of Société des Produits Nestlé S.A.; Dunkin’ Donuts® is a trademark of DD IP Holder, LLC; K-Cup® is a trademark of Keurig Green Mountain, Inc; and Rachael Ray® is a trademark of Ray Marks Co., LLC.

88 THE J. M. SMUCKER COMPANY