Attached files
| file | filename |
|---|---|
| EX-32.1 - EXHIBIT 32.1 - MOTORCAR PARTS AMERICA INC | ex32_1.htm |
| EX-31.3 - EXHIBIT 31.3 - MOTORCAR PARTS AMERICA INC | ex31_3.htm |
| EX-31.2 - EXHIBIT 31.2 - MOTORCAR PARTS AMERICA INC | ex31_2.htm |
| EX-31.1 - EXHIBIT 31.1 - MOTORCAR PARTS AMERICA INC | ex31_1.htm |
| EX-23.1 - EXHIBIT 23.1 - MOTORCAR PARTS AMERICA INC | ex23_1.htm |
| EX-21.1 - EXHIBIT 21.1 - MOTORCAR PARTS AMERICA INC | ex21_1.htm |
UNITED STATES SECURITIES AND EXCHANGE COMMISSION
Washington, D.C. 20549
Form 10-K
| ☑ |
ANNUAL REPORT PURSUANT TO SECTION 13 OR 15(d) OF THE SECURITIES EXCHANGE ACT OF 1934
|
For the fiscal year ended March 31, 2018
OR
| ☐ |
TRANSITION REPORT PURSUANT TO SECTION 13 OR 15(d) OF THE SECURITIES EXCHANGE ACT OF 1934
|
For the transition period from__________to__________
Commission File No. 001-33861
Motorcar Parts of America, Inc.
(Exact name of registrant as specified in its charter)
|
New York
|
11-2153962
|
|
|
(State or other jurisdiction of incorporation or organization)
|
(I.R.S. Employer Identification No.)
|
|
|
2929 California Street, Torrance, California
|
90503
|
|
|
(Address of principal executive offices)
|
Zip Code
|
Registrant’s telephone number, including area code: (310) 212-7910
Securities registered pursuant to Section 12(b) of the Act: common stock, $0.01 par value per share (registered on the NASDAQ Global Select Market)
Securities registered pursuant to Section 12(g) of the Act: None
Indicate by check mark if the registrant is a well-known seasoned issuer, as defined in Rule 405 of the Securities Act. Yes ☐ No ☑
Indicate by check mark if the registrant is not required to file reports pursuant to Section 13 or Section 15(d) of the Act. Yes ☐ No ☑
Indicate by check mark whether the registrant: (1) has filed all reports required to be filed by Section 13 or 15(d) of the Securities Exchange Act of 1934 during the preceding 12 months (or for such shorter period that the registrant was required to file such reports), and (2) has been subject to such filing requirements for the past 90 days. Yes ☑ No ☐
Indicate by check mark whether the registrant has submitted electronically and posted on its corporate Website, if any, every Interactive Data File required to be submitted and posted pursuant to Rule 405 of Regulation S-T during the preceding 12 months (or for such shorter period that the registrant was required to submit and post such files). Yes ☑ No ☐
Indicate by check mark if disclosure of delinquent filers in response to Item 405 of Regulation S-K is not contained herein, and will not be contained, to the best of registrant’s knowledge, in definitive proxy or information statements incorporated by reference in Part III of this Form 10-K or any amendment to this Form 10-K. ☐
Indicate by check mark whether the registrant is a large accelerated filer, an accelerated filer, a non-accelerated filer, smaller reporting company, or an emerging growth company. See the definitions of “large accelerated filer,” “accelerated filer,” “smaller reporting company,” “emerging growth company” in Rule 12b-2 of the Exchange Act. (Check one):
|
Large accelerated filer ☐
|
Accelerated filer ☑
|
|
|
Non-accelerated filer ☐
|
(Do not check if a smaller reporting company)
|
Smaller reporting company ☐
|
|
Emerging growth company ☐
|
If an emerging growth company, indicate by check mark if the registrant has elected not to use the extended transition period for complying with any new or revised financial accounting standards provided pursuant to Section 13(a) of the Exchange Act. ☐
Indicate by check mark whether the registrant is a shell company (as defined in Rule 12b-2 of the Act). Yes ☐ No ☑
As of September 30, 2017, which was the last business day of the registrant’s most recently completed fiscal second quarter, the aggregate market value of the registrant’s common stock held by non-affiliates of the registrant was approximately $553,613,587 based on the closing sale price as reported on the NASDAQ Global Market.
There were 18,893,102 shares of common stock outstanding as of June 7, 2018.
DOCUMENTS INCORPORATED BY REFERENCE:
In accordance with General Instruction G (3) of Form 10-K, the information required by Part III hereof will either be incorporated into this Form 10-K by reference to the registrant’s Definitive Proxy Statement for the registrant’s next Annual Meeting of Stockholders filed within 120 days of March 31, 2018 or will be included in an amendment to this Form 10-K filed within 120 days of March 31, 2018.
|
PART I
|
|
|
5
|
|
|
10
|
|
|
16
|
|
|
16
|
|
|
16
|
|
|
16
|
|
|
PART II
|
|
|
17
|
|
|
20
|
|
|
21
|
|
|
41
|
|
|
41
|
|
|
41
|
|
|
41
|
|
|
43
|
|
|
PART III
|
|
|
44
|
|
|
44
|
|
|
44
|
|
|
44
|
|
|
44
|
|
|
PART IV
|
|
|
45
|
|
|
51
|
|
|
52
|
|
MOTORCAR PARTS OF AMERICA, INC.
GLOSSARY
The following terms are frequently used in the text of this report and have the meanings indicated below.
“Used Core” — An automobile part which has been used in the operation of a vehicle. Generally, the Used Core is an original equipment (“OE”) automobile part installed by the vehicle manufacturer and subsequently removed for replacement. Used Cores contain salvageable parts, which are an important raw material in the remanufacturing process. We obtain most Used Cores by providing credits to our customers for Used Cores returned to us under our core exchange program. Our customers receive these Used Cores from consumers who deliver a Used Core to obtain credit from our customers upon the purchase of a newly remanufactured automobile part. When sufficient Used Cores cannot be obtained from our customers, we will purchase Used Cores from core brokers, who are in the business of buying and selling Used Cores. The Used Cores purchased from core brokers or returned to us by our customers under the core exchange program, and which have been physically received by us, are part of our raw material or work in process inventory included in long-term core inventory.
“Remanufactured Core” — The Used Core underlying an automobile part that has gone through the remanufacturing process and through that process has become part of a newly remanufactured automobile part. The remanufacturing process takes a Used Core, breaks it down into its component parts, replaces those components that cannot be reused and reassembles the salvageable components of the Used Core and additional new components into a remanufactured automobile part. Remanufactured Cores are included in our on-hand finished goods inventory and in the remanufactured finished good product held for sale at customer locations. Used Cores returned by consumers to our customers but not yet returned to us continue to be classified as Remanufactured Cores until we physically receive these Used Cores. All Remanufactured Cores are included in our long-term core inventory or in our long-term core inventory deposit.
CAUTIONARY NOTE REGARDING FORWARD-LOOKING STATEMENTS
Unless the context otherwise requires, all references in this Annual Report on Form 10-K to “the Company,” “we,” “us,” “MPA,” and “our” refer to Motorcar Parts of America, Inc. and its subsidiaries.
This Form 10-K may contain forward-looking statements within the meaning of the Private Securities Litigation Reform Act of 1995 with respect to our future performance that involve risks and uncertainties. Various factors could cause actual results to differ materially from those expressed or implied by such statements. These factors include, but are not limited to: concentration of sales to a small number of large customers; changes in the financial condition of or our relationship with any of our major customers; increases in the average accounts receivable collection period; the loss of sales to customers; delays in payments by customers; the increasing customer pressure for lower prices and more favorable payment and other terms; lower revenues than anticipated from new and existing contracts; the increasing demands on our working capital; the significant strain on working capital associated with large inventory purchases from customers; any meaningful difference between expected production needs and ultimate sales to our customers; investments in operational changes or acquisitions; our ability to obtain any additional financing we may seek or require; our ability to maintain positive cash flows from operations; potential future changes in our previously reported results as a result of the identification and correction of errors in our accounting policies or procedures or the potential material weaknesses in our internal control over financial reporting; our failure to meet the financial covenants or the other obligations set forth in our credit agreement and the lenders’ refusal to waive any such defaults; increases in interest rates; the impact of high gasoline prices; consumer preferences and general economic conditions; increased competition in the automotive parts industry including increased competition from Chinese and other offshore manufacturers; difficulty in obtaining Used Cores and component parts or increases in the costs of those parts; political, criminal or economic instability in any of the foreign countries where we conduct operations; currency exchange fluctuations; unforeseen increases in operating costs; risks associated with cyber-attacks; risks associated with conflict minerals; the impact of new accounting pronouncements and tax laws, including the U.S. Tax Cuts and Jobs Act, and interpretations thereof; uncertainties affecting our ability to estimate our tax rate and other factors discussed herein and in our other filings with the Securities and Exchange Commission (the “SEC”). These and other risks and uncertainties may cause our actual results to differ materially and adversely from those expected in any forward-looking statements. Readers are directed to risks and uncertainties identified below under “Risk Factors” and elsewhere in this report for additional detail regarding factors that may cause actual results to be different than those expressed in our forward-looking statements. Except as required by law, we undertake no obligation to revise or update publicly any forward-looking statements for any reason.
PART I
General
We are a leading manufacturer, remanufacturer, and distributor of aftermarket automotive and light truck applications. We also, to a lesser extent, are a manufacturer, remanufacturer, and distributor of heavy duty truck and industrial and agricultural application parts. These replacement parts are sold for use on vehicles after initial vehicle purchase. These automotive parts are sold to automotive retail chain stores and warehouse distributors throughout North America and to major automobile manufacturers for both their aftermarket programs and warranty replacement programs (“OES”). We estimate the market size to be over $125 billion for each of the light duty and heavy duty markets in North America.
The current population of light duty vehicles in the U.S. is approximately 271 million and the average age of these vehicles is approximately 11.7 years. The aged vehicle population remains favorable. Although miles driven fluctuate primarily based on fuel prices, it has steadily increased for the past year. We believe demand for aftermarket automotive parts generally increases with the age of vehicles. In addition, increases in miles driven can accelerate replacement rates.
The automotive and light truck parts aftermarket is divided into two markets. The first is the do-it-yourself (“DIY”) market, which is generally serviced by the large retail chain outlets. Consumers who purchase parts from the DIY channel generally install parts into their vehicles themselves. In most cases, this is a less expensive alternative than having the repair performed by a professional installer. The second is the professional installer market, commonly known as the do-it-for-me (“DIFM”) market. Traditional warehouse distributors, dealer networks, and commercial divisions of retail chains service this market. Generally, the consumer in this channel is a professional parts installer. Our products are distributed to both the DIY and DIFM markets.
The heavy duty truck, industrial, and agricultural aftermarket has some overlap with the automotive aftermarket as discussed above, but also has specialty distribution channels through the OES channel and auto-electric distributor channels.
In addition, we are now in the business of diagnostic equipment for alternators, starters, belt-start generators (stop start and hybrid technology), and electric power trains for electric vehicles. The global market for diagnostics is approximately $5 billion, with the smallest but fastest growing segment of this being in the electric vehicle market.
Growth Strategies
We are focused on growing our share in all channels within both the light duty and heavy duty aftermarket, including DIY, DIFM, and OES, as well as in the OE (original equipment) market for our diagnostics business. We are well positioned for growth in all channels, in particular the DIFM market in three ways: (i) our auto parts retail customers are expanding their efforts to target the DIFM market, (ii) we sell our products under private label and our own brand names directly to suppliers that focus on professional installers, and (iii) we sell our products to original equipment manufacturers for distribution to the professional installer both for warranty replacement and their general aftermarket channels. We have been successful in growing sales to all channels of the aftermarket.
Our goal is to take advantage of multiple growth strategies. To accomplish this, key elements of our strategy include:
| · |
Grow our current product lines both with existing and potential new customers. We continue to develop and offer current and new sales programs to ensure that we are doing all we can to support our customers’ businesses. We remain dedicated to managing growth and continuing to focus on enhancements to our infrastructure and making investments in resources to support our customers.
|
| · |
Introduction of new product lines. We continue to strive to expand our business by exploring new product lines including working with our customers to identify potential new product opportunities.
|
| · |
The strategic acquisition of other companies or businesses. We have in the past and intend to continue making strategic acquisitions to grow our business. We maintain an in-house acquisition team that continuously works to identify potential new targets.
|
| · |
Creating value for our customers. A core part of our strategy is ensuring that we add meaningful value for our customers. We consistently support and pilot our customers’ supply management initiatives in addition to providing demand analytics, a suite of inventory management services, a library of online training guides, market share, and retail store layout information to our customers.
|
| · |
Technological innovation. We continue to expand our research and development teams as we further develop in-house technologies and advanced testing methods. This elevated level of technology ensures our customers receive the highest quality products and support services that can be offered.
|
Products
Our products include (i) rotating electrical products such as alternators and starters, (ii) wheel hub assemblies and bearings, (iii) brake master cylinders, and (iv) other products, which include turbochargers, brake power boosters, and diagnostic equipment. We added turbochargers through an acquisition in July 2016. We began selling brake power boosters in August 2016. As a result of an acquisition in July 2017, our business also now includes developing and selling diagnostic equipment for alternators, starters, belt-start generators (stop start and hybrid technology), and electric power trains for electric vehicles.
Our OE diagnostic products are viewed as industry leading, paving the way for the development of increasingly better electric vehicle and hybrid vehicle applications. We produce diagnostic equipment for some of the top OE automotive companies in the world.
Our products meet or exceed original equipment manufacturer specifications. We produce both new and remanufactured units. Remanufacturing generally creates a supply of parts at a lower cost to the end user than newly manufactured parts and makes available automotive parts that are no longer manufactured. Our remanufactured parts are generally sold at competitively lower prices than most new replacement parts. We believe most of our automotive parts are non-elective replacement parts in all makes and models of vehicles because they are required for a vehicle to operate.
We recycle materials, including metal from the Used Cores and corrugated packaging, in keeping with our focus of positively impacting the environment.
The increasing complexity of cars and light trucks and the number of different makes and models of these vehicles have resulted in a significant increase in the number of different automotive parts required to service vehicles. We carry over 14,500 stock keeping units (“SKUs”) for automotive parts that are sold under our customers’ widely recognized private label brand names and our Quality-Built®, Pure Energy™, Xtreme®, Talon®, Reliance™ and other brand names.
Segment Reporting
Pursuant to the guidance provided under the Financial Accounting Standards Board (“FASB”) Accounting Standards Codification (“ASC”) for segment reporting, we have identified our chief executive officer as our chief operating decision maker (“CODM”), have reviewed the documents used by the CODM, and understand how such documents are used by the CODM to make financial and operating decisions. We have determined through this review process that our business comprises one reportable segment for purposes of recording and reporting our financial results.
Sales, Marketing and Distribution
We sell our products to the largest automotive chains primarily in North America, including Advance (inclusive of Carquest, Autopart International, and Worldpac), AutoZone, Genuine Parts (NAPA), O’Reilly, and Pep Boys, with an aggregate of approximately 25,000 retail outlets. In addition, we sell our products to OES customers, professional installers, and a diverse group of automotive warehouse distributors. We sell diagnostic equipment directly and indirectly to some of the world’s best OE automotive companies.
We publish printed and electronic catalogs with part numbers and applications for our products along with a detailed technical glossary and informational database. We believe that we maintain one of the most extensive catalog and product identification systems available to the market.
We ship our products from our facilities and utilize various third party warehouse distribution centers in North America.
Customers: Customer Concentration. While we continually seek to diversify our customer base, we currently derive, and have historically derived, a substantial portion of our sales from a small number of large customers. Sales to our four largest customers in the aggregate represented 88%, 87%, and 90%, and sales to our largest customer, AutoZone, represented 41%, 44%, and 48% of our net sales during fiscal 2018, 2017 and 2016, respectively. Any meaningful reduction in the level of sales to any of these customers, deterioration of the financial condition of any of these customers or the loss of any of these customers could have a materially adverse impact on our business, results of operations, and financial condition.
Customer Arrangements; Impact on Working Capital. We have various length agreements with our customers. Under these agreements, which in most cases have initial terms of at least four years, we are designated as the exclusive or primary supplier for specified categories of our products. Because of the very competitive nature of the market and the limited number of customers for these products, our customers have sought and obtained price concessions, significant marketing allowances and more favorable delivery and payment terms in consideration for our designation as a customer’s exclusive or primary supplier. These incentives differ from contract to contract and can include (i) the issuance of a specified amount of credits against receivables in accordance with a schedule set forth in the relevant contract, (ii) support for a particular customer’s research or marketing efforts provided on a scheduled basis, (iii) discounts granted in connection with each individual shipment of product, and (iv) store expansion or product development support. These contracts typically require that we meet ongoing performance standards. Our contracts with major customers expire at various dates through April 2021.
While these longer-term agreements strengthen our customer relationships, the increased demand for our products often requires that we increase our inventories and personnel. Customer demands that we purchase and maintain their Remanufactured Core inventory also requires the use of our working capital. The marketing and other allowances we typically grant our customers in connection with our new or expanded customer relationships adversely impact near-term revenues, profitability and associated cash flows from these arrangements. However, we believe the investment we make in these new or expanded customer relationships will improve our overall liquidity and cash flow from operations over time.
Competition
The automotive parts aftermarket is highly competitive. We compete with several large and medium sized remanufacturers and diagnostic companies, including BBB Industries, Remy, Cardone Industries, AVL, Horiba, Siemens, and a large number of smaller regional and specialty remanufacturers. We also compete with overseas manufacturers, particularly those located in China, who are increasing their operations and could become a significant competitive force in the future.
We believe that the reputations for quality and customer service that a supplier provides are significant factors in our customers’ purchase decisions. As we continually strive to increase our competitive advantages, we have created an online library of video courses, aimed at arming our customers as they seek to train the next generation of technicians. We also offer live and web-based training courses via our recently created education facility within our Torrance headquarters. We believe our ability to provide quality replacement automotive parts, rapid and reliable delivery capabilities as well as promotional support also distinguishes us from many of our competitors. In addition, favorable pricing, our core exchange program, and extended payment terms are also very important competitive factors in customers’ purchase decisions.
We seek to protect our proprietary processes and other information by relying on trade secret laws and non-disclosure and confidentiality agreements with certain of our employees and other persons who have access to that information.
Operations
Production Process. The majority of our products are remanufactured. Our remanufacturing process begins with the receipt of Used Cores from our customers or core brokers. The Used Cores are evaluated for inventory control purposes and then sorted by part number. Each Used Core is completely disassembled into its fundamental components. The components are cleaned in an environmentally sound process that employs customized equipment and cleaning materials in accordance with the required specifications of the particular component. All components known to be subject to major wear and those components determined not to be reusable or repairable are replaced by new components. Non-salvageable components of the Used Core are sold as scrap.
After the cleaning process is complete, the salvageable components of the Used Core are inspected and tested as prescribed by our IATF 16949 approved quality control program, which has been implemented throughout the production processes. IATF 16949 is an internationally recognized, world class, automotive quality system that was launched in 2017, replacing the previous ISO TS 16949 quality control program. Upon passage of all tests, which are monitored by designated quality control personnel, all the component parts are assembled in a work cell into a finished product. Inspection and testing are conducted at multiple stages of the remanufacturing process, and each finished product is inspected and tested on equipment designed to simulate performance under operating conditions. To maximize remanufacturing efficiency, we store component parts ready for assembly in our production facilities.
Our remanufacturing processes combine product families with similar configurations into dedicated factory work cells. This remanufacturing process, known as “lean manufacturing,” replaced the more traditional “batch” assembly line approach we had previously utilized and eliminated a large number of inventory moves and the need to track inventory movement through the remanufacturing process. This lean manufacturing process has been fully implemented at all of our production facilities. This manufacturing enables us to significantly reduce the time it takes to produce a finished product. We continue to explore opportunities for improving efficiencies in our remanufacturing process.
Offshore Remanufacturing. The majority of our remanufacturing operations are conducted at our facilities in Mexico and Malaysia. We continue to maintain production of certain remanufactured units that require specialized service and/or rapid turnaround in our U.S. facilities. In addition, we operate shipping and receiving warehouses and testing facilities in Singapore and China for our products.
Used Cores. The majority of our Used Cores are obtained from customers through the core exchange program. The core exchange program consists of the following steps:
| • |
Our customers purchase from us a remanufactured unit to be sold to their consumer.
|
| • |
Our customers offer their consumers a credit to exchange their used unit (Used Core) at the time the consumer purchases a remanufactured unit.
|
| • |
We offer our customers a credit, which reduces our accounts receivable, to send us these Used Cores.
|
Our customers are not obligated to send us all the Used Cores exchanged by their consumers. We have historically purchased Used Cores from core brokers to supplement the supply sent to us. Although this is not a primary source of Used Cores, it is a critical source for meeting our raw material demands. Remanufacturing consumes, on average, more than one Used Core for each remanufactured unit produced since not all Used Cores are reusable. The yield rates depend upon both the product and customer specifications.
The price of a finished remanufactured product sold is generally comprised of an amount for remanufacturing (“unit value”) and an amount separately invoiced for the Remanufactured Core included in the product (“Remanufactured Core charge”). The Remanufactured Core charge is equal to the credit we offer to induce the customer to use our core exchange program and send back the Used Cores. The ability to obtain Used Cores, materials, and components of the types and quantities we need is essential to our ability to meet demand.
Purchased Finished Goods. In addition to our remanufactured goods, we also purchase finished goods from various suppliers, including several located in Asia. We perform supplier qualification, product inspection and testing according to our IATF 16949 certified quality system to assure product quality levels. We also perform periodic site audits of our suppliers’ manufacturing facilities.
Return Rights. Under our customer agreements and general industry practice, our customers are allowed stock adjustments if their inventory of certain product lines exceeds the inventory necessary to support sales to their end-user consumers (stock adjustment returns). Customers have various contractual rights for stock adjustment returns, which are typically less than 5% of units sold. In some instances, we allow a higher level of returns in connection with significant restocking orders. Stock adjustment returns do not occur at any specific time during the year. In addition, we allow customers to return goods to us that their end-user consumers have returned to them, whether or not the returned item is defective (warranty returns). We seek to limit the aggregate general right of return to less than 20% of unit sales.
As is standard in the industry, we only accept returns from on-going customers. If a customer ceases doing business with us, we have no further obligation to accept additional product returns from that customer. Similarly, we accept product returns and grant appropriate credits to new customers from the time the new customer relationship is established.
Employees
We employed 2,996 full-time global employees as of March 31, 2018. We use independent contractors and temporary employees to supplement our workforce as needed. A union represents 2,266 of the employees at our Mexico facility. All other employees are non-union. We consider our relations with our employees to be satisfactory.
Governmental Regulation
Our operations are subject to federal, state and local laws and regulations governing, among other things, emissions to air, discharge to waters, and the generation, handling, storage, transportation, treatment and disposal of waste and other materials. We believe that our businesses, operations and facilities have been and are being operated in compliance in all material respects with applicable environmental and health and safety laws and regulations, many of which provide for substantial fines and criminal sanctions for violations. Potentially significant expenditures, however, could be required in order to comply with evolving environmental and health and safety laws, regulations or requirements that may be adopted or imposed in the future.
Access to Public Information
We file annual, quarterly and current reports, proxy statements and other information with the SEC. Our SEC filings are available free of charge to the public over the Internet at the SEC’s website at www.sec.gov. Our SEC filings are also available free of charge on our website www.motorcarparts.com. You may also read and copy any document we file with the SEC at its Public Reference Room at 100 F. Street, NE, Washington, D.C. 20549. Please call the SEC at (800) SEC-0330 for further information on the operation of the Public Reference Room.
While we believe the risk factors described below are all the material risks currently facing our business, additional risks we are not presently aware of or that we currently believe are immaterial may also impair our business operations. Our financial condition or results of operations could be materially and adversely impacted by these risks, and the trading price of our common stock could be adversely impacted by any of these risks. In assessing these risks, you should also refer to the other information included in or incorporated by reference into this Form 10-K, including our consolidated financial statements and related notes thereto appearing elsewhere or incorporated by reference in this Form 10-K.
We rely on a few large customers for a majority of our business, and the loss of any of these customers, significant changes in the prices, marketing allowances or other important terms provided to any of these customers or adverse developments with respect to the financial condition of these customers could reduce our net income and operating results.
Our net sales are concentrated among a small number of large customers. Sales to our four largest customers in the aggregate represented 88%, and sales to our largest customer represented 41% of our net sales during fiscal 2018. We are under ongoing pressure from our major customers to offer lower prices, extended payment terms, increased marketing and other allowances and other terms more favorable to these customers because our sales to these customers are concentrated, and the market in which we operate is very competitive. These customer demands have put continued pressure on our operating margins and profitability, resulted in periodic contract renegotiation to provide more favorable prices and terms to these customers and significantly increased our working capital needs. In addition, this customer concentration leaves us vulnerable to any adverse change in the financial condition of these customers. Changes in terms with, significant allowances for and collections from these customers could affect our operating results and cash flows. The loss of or a significant decline in sales to any of these customers could adversely affect our business, results of operations, and financial condition.
Our offshore remanufacturing and logistic activities expose us to increased political and economic risks and place a greater burden on management to achieve quality standards.
Our overseas operations, especially our operations in Mexico, increase our exposure to political, criminal or economic instability in the host countries and to currency fluctuations. Risks are inherent in international operations, including:
| · |
exchange controls and currency restrictions;
|
| · |
currency fluctuations and devaluations;
|
| · |
changes in local economic conditions;
|
| · |
repatriation restrictions (including the imposition or increase of withholding and other taxes on remittances and other payments by foreign subsidiaries);
|
| · |
global sovereign uncertainty and hyperinflation in certain foreign countries;
|
| · |
laws and regulations relating to export and import restrictions;
|
| · |
exposure to government actions; and
|
| · |
exposure to local political or social unrest including resultant acts of war, terrorism or similar events.
|
These and other factors may have a material adverse effect on our offshore activities and on our business, results of operations and financial condition. Our overall success as a business depends substantially upon our ability to manage our foreign operations. We may not continue to succeed in developing and implementing policies and strategies that are effective in each location where we do business, and failure to do so could materially and adversely impact our business, results of operations, and financial condition.
Interruptions or delays in obtaining component parts could impair our business and adversely affect our operating results.
In our remanufacturing processes, we obtain Used Cores, primarily through the core exchange program with our customers, and component parts from third-party manufacturers. We generally purchase up to 20% of our Used Cores from core brokers. Historically, the Used Core returned from customers together with purchases from core brokers have provided us with an adequate supply of Used Cores. If there was a significant disruption in the supply of Used Cores, whether as a result of increased Used Core acquisitions by existing or new competitors or otherwise, our operating activities could be materially and adversely impacted. In addition, a number of the other components used in the remanufacturing process are available from a very limited number of suppliers. We are, as a result, vulnerable to any disruption in component supply, and any meaningful disruption in this supply would materially and adversely impact our operating results.
Increases in the market prices of key component raw materials could increase the cost of our products and negatively impact our profitability.
In light of the continuous pressure on pricing which we have experienced from our large customers, we may not be able to recoup the higher costs of our products due to changes in the prices of raw materials, particularly aluminum and copper. If we are unable to recover a substantial portion of our raw materials from Used Cores returned to us by our customers through the core exchange program, the prices of Used Cores that we purchase may reflect the impact of changes in the cost of raw materials. However, we are unable to determine what adverse impact, if any, sustained raw material price increases may have on our product costs or profitability.
Substantial and potentially increasing competition could reduce our market share and significantly harm our financial performance.
While we believe that we are well positioned in the automotive aftermarket, this market is very competitive. In addition, other overseas manufacturers, particularly those located in China, are increasing their operations and could become a significant competitive force in the future. We may not be successful competing against other companies, some of which are larger than us and have greater financial and other resources at their disposal. Increased competition could put additional pressure on us to reduce prices or take other actions, which may have an adverse effect on our operating results. We may also lose significant customers or lines of business to competitors.
Our financial results are affected by automotive parts failure rates that are outside of our control.
Our operating results are affected over the long term by automotive parts failure rates. These failure rates are impacted by a number of factors outside of our control, including product designs that have resulted in greater reliability, the number of miles driven by consumers, and the average age of vehicles on the road. A reduction in the failure rates of automotive parts would adversely affect our sales and profitability.
Our operating results may continue to fluctuate significantly.
We have experienced significant variations in our annual and quarterly results of operations. These fluctuations have resulted from many factors, including shifts in the demand and pricing for our products, general economic conditions, including changes in prevailing interest rates, and the introduction of new products. Our gross profit percentage fluctuates due to numerous factors, some of which are outside of our control. These factors include the timing and level of marketing allowances provided to our customers, actual sales during the relevant period, pricing strategies, the mix of products sold during a reporting period, and general market and competitive conditions. We also incur allowances, accruals, charges and other expenses that differ from period to period based on changes in our business, which causes our operating income to fluctuate.
Our lenders may not waive future defaults under our credit agreements.
Our credit agreement with our lenders contains certain financial and other covenants. If we fail to meet any of these covenants in the future, there is no assurance that our lenders will waive any such defaults. If obtained, any such waiver may impose significant costs or covenants on us.
Unfavorable currency exchange rate fluctuations could adversely affect us.
We are exposed to market risk from material movements in foreign exchange rates between the U.S. dollar and the currencies of the foreign countries in which we operate. In fiscal 2018, approximately 13% of our total expenses were in currencies other than the U.S. dollar. As a result of our extensive operations in Mexico, our primary risk relates to changes in the rates between the U.S. dollar and the Mexican peso. To mitigate this currency risk, we enter into forward foreign exchange contracts to exchange U.S. dollars for Mexican pesos. We also enter into forward foreign exchange contracts to exchange U.S. dollars for Chinese yuan in order to mitigate risk related to our purchases and payments to our Chinese vendors. The extent to which we use forward foreign exchange contracts is periodically reviewed in light of our estimate of market conditions and the terms and length of anticipated requirements. The use of derivative financial instruments allows us to reduce our exposure to the risk that the eventual net cash outflow resulting from funding the expenses of the foreign operations will be materially affected by changes in the exchange rates. We do not engage in currency speculation or hold or issue financial instruments for trading purposes. These contracts generally expire in a year or less. Any change in the fair value of foreign exchange contracts is accounted for as an increase or decrease to general and administrative expenses in current period earnings.
We may continue to make strategic acquisitions of other companies or businesses and these acquisitions introduce significant risks and uncertainties, including risks related to integrating the acquired businesses and achieving benefits from the acquisitions.
In order to position ourselves to take advantage of growth opportunities, we have made, and may continue to make, strategic acquisitions that involve significant risks and uncertainties. These risks and uncertainties include:
| · |
the difficulty in integrating newly-acquired businesses and operations in an efficient and effective manner;
|
| · |
the challenges in achieving strategic objectives, cost savings and other benefits from acquisitions;
|
| · |
the potential loss of key employees of the acquired businesses;
|
| · |
the risk of diverting the attention of senior management from our operations;
|
| · |
risks associated with integrating financial reporting and internal control systems;
|
| · |
difficulties in expanding information technology systems and other business processes to accommodate the acquired businesses; and
|
| · |
future impairments of any goodwill of an acquired business.
|
We may also incur significant expenses to pursue and consummate acquisitions. Any of the foregoing, or a combination of them, could cause us to incur additional expenses and materially and adversely impact our business, financial condition, results of operations, or liquidity.
Our reliance on foreign suppliers for some of the automotive parts we sell to our customers or included in our products presents risks to our business.
A significant portion of automotive parts and components we use in our remanufacturing process are imported from suppliers located outside the U.S., including various countries in Asia. As a result, we are subject to various risks of doing business in foreign markets and importing products from abroad, such as:
| ● |
significant delays in the delivery of cargo due to port security considerations;
|
| ● |
imposition of duties, taxes, tariffs or other charges on imports;
|
| ● |
imposition of new legislation relating to import quotas or other restrictions that may limit the quantity of our product that may be imported into the U.S. from countries or regions where we do business;
|
| ● |
financial or political instability in any of the countries in which our product is manufactured;
|
| ● |
potential recalls or cancellations of orders for any product that does not meet our quality standards;
|
| ● |
disruption of imports by labor disputes or strikes and local business practices;
|
| ● |
political or military conflict involving the U.S., which could cause a delay in the transportation of our products and an increase in transportation costs;
|
| ● |
heightened terrorism security concerns, which could subject imported goods to additional, more frequent or more thorough inspections, leading to delays in deliveries or impoundment of goods for extended periods;
|
| ● |
natural disasters, disease epidemics and health related concerns, which could result in closed factories, reduced workforces, scarcity of raw materials and scrutiny or embargoing of goods produced in infected areas;
|
| ● |
inability of our non-U.S. suppliers to obtain adequate credit or access liquidity to finance their operations; and
|
| ● |
our ability to enforce any agreements with our foreign suppliers.
|
Any of the foregoing factors, or a combination of them, could increase the cost or reduce the supply of products available to us and materially and adversely impact our business, financial condition, results of operations or liquidity.
In addition, because we depend on independent third parties to manufacture a significant portion of our wheel hub, master cylinder, and other purchased finished goods, we cannot be certain that we will not experience operational difficulties with such manufacturers, such as reductions in the availability of production capacity, errors in complying with merchandise specifications, insufficient quality controls and failure to meet production deadlines or increases in manufacturing costs.
An increase in the cost or a disruption in the flow of our imported products may significantly decrease our sales and profits.
Merchandise manufactured offshore represents a significant portion of our total product purchases. A disruption in the shipping or cost of such merchandise may significantly decrease our sales and profits. In addition, if imported merchandise becomes more expensive or unavailable, the transition to alternative sources may not occur in time to meet our demands. Merchandise from alternative sources may also be of lesser quality and more expensive than those we currently import. Risks associated with our reliance on imported merchandise include disruptions in the shipping and importation or increase in the costs of imported products. For example, common risks may be:
| · |
raw material shortages;
|
| · |
work stoppages;
|
| · |
strikes and political unrest;
|
| · |
problems with oceanic shipping, including shipping container shortages;
|
| · |
increased customs inspections of import shipments or other factors causing delays in shipments;
|
| · |
economic crises;
|
| · |
international disputes and wars;
|
| · |
loss of “most favored nation” trading status by the U. S. in relations to a particular foreign country;
|
| · |
import duties;
|
| · |
import quotas and other trade sanctions; and
|
| · |
increases in shipping rates.
|
Products manufactured overseas and imported into the U.S. and other countries are subject to import restrictions and duties, which could delay their delivery or increase their cost.
During and following the 2016 U.S. presidential election, there has been discussion and commentary regarding potential significant changes to U.S. trade policies, legislation, treaties and tariffs, including NAFTA and trade policies and tariffs affecting China. There have also been discussions of a disallowance of tax deductions for imported merchandise or the imposition of unilateral tariffs on imported products. It is unknown at this time whether and to what extent new legislation will be passed into law, pending or new regulatory proposals will be adopted, international trade agreements will be negotiated, or the effect that any such action may have, either positively or negatively, on our industry, or on us. Similar to many other multinational corporations, we do a significant amount of business that would be impacted by these changes. If any new legislation and/or regulations are implemented, or if existing trade agreements are renegotiated, it may be time-consuming and expensive for us to alter our business operations in order to adapt to or comply with such changes. Such operational changes could have a material adverse effect on our business, financial condition and results of operations.
If our technology and telecommunications systems were to fail, or we were not able to successfully anticipate, invest in or adopt technological advances in our industry, it could have an adverse effect on our operations.
We rely on computer and telecommunications systems to communicate with our customers and vendors and manage our business. The temporary or permanent loss of our computer and telecommunications equipment and software systems, through casualty, operating malfunction, software virus or service provider failure, could disrupt our operations. In addition, our future growth may require additional investment in our systems to keep up with technological advances in our industry. If we are not able to invest in or adopt changes to our systems, or such upgrades take longer or cost more than anticipated, our business, financial condition and operating results may be adversely affected.
Cyber-attacks or other breaches of information technology security could adversely impact our business and operations.
Cyber-attacks or other breaches of network or information technology security may cause equipment failure or disruption to our operations. Such attacks, which include the use of malware, computer viruses and other means for disruption or unauthorized access, on companies have increased in frequency, scope and potential harm in recent years. While, to the best of our knowledge, we have not been subject to cyber-attacks or to other cyber incidents which, individually or in the aggregate, have been material to our operations or financial conditions, the preventive actions we take to reduce the risk of cyber incidents and protect our information technology and networks may be insufficient to repel a major cyber-attack in the future. To the extent that any disruption or security breach results in a loss or damage to our data or unauthorized disclosure of confidential information, it could cause significant damage to our reputation, affect our relationship with our customers, suppliers and employees, and lead to claims against us and ultimately harm our business. Additionally, we may be required to incur significant costs to protect against damage caused by these disruptions or security breaches in the future. While we maintain specific cyber insurance coverage, which would apply in the event of various breach scenarios, the amount of coverage may not be adequate in any particular case. Furthermore, because cyber threat scenarios are inherently difficult to predict and can take many forms, some breaches may not be covered under our cyber insurance coverage.
Regulations related to conflict minerals could adversely impact our business.
The Dodd-Frank Wall Street Reform and Consumer Protection Act (“Dodd-Frank”) contains provisions to improve transparency and accountability concerning the supply of certain minerals, known as “conflict minerals”, originating from the Democratic Republic of Congo (“DRC”) and adjoining countries. These rules could adversely affect the sourcing, supply, and pricing of materials used in our products, as the number of suppliers who provide conflict-free minerals may be limited. We may also suffer reputational harm if we determine that certain of our products contain minerals not determined to be conflict-free or if we are unable to modify our products to avoid the use of such materials. We may also face challenges in satisfying customers who may require that our products be certified as containing conflict-free minerals.
The products we manufacture or contract to manufacture contain small quantities of Tin and Gold. We manufacture or contract to manufacture one product with small quantities of Tantalum. For the reporting year ending December 31, 2017, 100% of applicable suppliers responded to our request for information on sourcing of their “conflict minerals.” This inquiry yielded 192 smelters, refiners, or metal processing facilities for these minerals that are, or could be, in our supply chain. Of these, 89% were validated as conflict-free, per publicly available information on the Conflict Free Sourcing Initiative website. For the majority of the remaining entities reported to us, there is insufficient data for the industry to determine the source of materials for their smelters.
Our strategy for managing risks associated with conflict minerals in products includes continuing to encourage our suppliers to engage in conflict-free sourcing, and obtaining data from our suppliers that is more applicable to the products we purchase. We continue to monitor progress on industry efforts to ascertain whether some facilities that suppliers identified are actually smelters. We do not believe conflict minerals pose risk to our operations. We are a member of the Automobile Industry Action Group (AIAG), and support their efforts in the conflict minerals area.
Natural disasters or other disruptions in our business in California and Baja California, Mexico could increase our operating expenses or cause us to lose revenues.
A substantial portion of our operations are located in California and Baja California, Mexico, including our headquarters, remanufacturing and warehouse facilities. Any natural disaster, such as an earthquake, or other damage to our facilities from weather, fire or other events could cause us to lose inventory, delay delivery of orders to customers, incur additional repair-related expenses, disrupt our operations or otherwise harm our business. These events could also disrupt our information systems, which would harm our ability to manage our operations worldwide and compile and report financial information. As a result, we could incur additional expenses or liabilities or lose revenues, which could exceed any insurance coverage and would adversely affect our financial condition and results of operations.
Weakness in conditions in the global credit markets and macroeconomic factors could adversely affect our financial condition and results of operations.
Any weakness in the credit markets could result in significant constraints on liquidity and availability of borrowing terms from lenders and accounts payable with vendors. Modest economic growth in most major industrial countries in the world and uncertain prospects for continued growth threaten to cause tightening of the credit markets, more stringent lending standards and terms, and higher interest rates. The persistence of these conditions could have a material adverse effect on our borrowings and the availability, terms and cost of such borrowings. In addition, deterioration in the U.S. economy could materially and adversely impact our operating results.
Our stock price may be volatile and could decline substantially.
Our stock price may decline substantially as a result of developments in our business, the volatile nature of the stock market, and other factors beyond our control. The stock market has, from time to time, experienced extreme price and volume fluctuations. Many factors may cause the market price for our common stock to decline, including (i) our operating results failing to meet the expectations of securities analysts or investors in any period, (ii) downward revisions in securities analysts’ estimates, (iii) market perceptions concerning our future earnings prospects, (iv) public or private sales of a substantial number of shares of our common stock, and (v) adverse changes in general market conditions or economic trends.
Our failure to implement and maintain effective internal control over financial reporting could result in material misstatements in our financial statements.
Section 404 of the Sarbanes-Oxley Act of 2002 (“SOX”) requires our management to assess the effectiveness of our internal control over financial reporting at the end of each fiscal year and certify whether or not internal control over financial reporting is effective. Our independent accountants are also required to express an opinion with respect to the effectiveness of our internal controls. Any failure to maintain or implement new or improved internal controls, or any difficulties we encounter in their implementation, could result in significant deficiencies or material weaknesses, cause us to fail to meet our periodic reporting obligations (which may result in our failure to maintain the listing standards for our common stock) or result in material misstatements in our financial statements. Any such failure could also adversely affect the results of periodic management evaluations and annual auditor attestation reports regarding the effectiveness of our internal control over financial reporting required under SOX.
Uncertainties in the interpretation and application of the Tax Cuts and Jobs Act of 2017 could materially affect our tax obligations and effective tax rate.
On December 22, 2017, the U.S. enacted comprehensive tax legislation, commonly referred to as the Tax Cuts and Jobs Act (the “Tax Act”). The Tax Act requires complex computations not previously required by U.S. tax law. As such, the application of accounting guidance for such items is currently uncertain. Further, compliance with the Tax Act and the accounting for such provisions require preparation and analysis of information not previously required or regularly produced. In addition, the U.S. Department of Treasury has broad authority to issue regulations and interpretative guidance that may significantly impact how we will apply the Tax Act and impact our results of operations in future periods. Accordingly, while we have provided a provisional estimate on the effect of the Tax Act in our accompanying audited financial statements, further regulatory or GAAP accounting guidance for the law, our further analysis on the application of the law, and refinement of our initial estimates and calculations could materially change our current provisional estimates, which could, in turn, materially affect our tax obligations and effective tax rate. There may also be significant future effects that these tax reforms will have on our financial results and our business strategies. In addition, there is a risk that states or foreign jurisdictions may amend their tax laws in response to these tax reforms, which could have a material impact on our future results.
None.
The following sets forth the location, type of facility, square footage and ownership interest in each of our facilities.
|
Location
|
Type of Facility
|
Approx.
Square
Feet
|
Leased
or
Owned
|
Expiration
|
|||||
|
Torrance, CA
|
Remanufacturing, Warehouse, Administrative, and Office
|
231,000
|
Leased
|
March 2022
|
|||||
|
Tijuana, Mexico (1)
|
Remanufacturing, Warehouse, and Office
|
312,000
|
Leased
|
December 2018
|
|||||
|
Tijuana, Mexico (2)
|
Remanufacturing, Warehouse, and Office
|
410,000
|
Leased
|
December 2032
|
|||||
|
Ontario, Canada
|
Manufacturing, Warehouse, and Office
|
30,000
|
Leased
|
December 2022
|
|||||
|
Singapore & Malaysia
|
Remanufacturing, Warehouse, and Office
|
74,000
|
Leased
|
Various through December 2021
|
|||||
|
Shanghai, China
|
Warehouse and Office
|
54,000
|
Leased
|
March 2019
|
|||||
|
Winchester, VA
|
Warehouse and Office
|
13,000
|
Leased
|
February 2021
|
|||||
| (1) |
All renewal options for our current lease for our remanufacturing, warehouse, and office space in Tijuana, Mexico, expiring on December 31, 2018, have been fully exercised. We would have to enter into a new agreement to extend this lease further. We can request an extension of the lease by sending a written notice to the landlord at least 150 days prior to the expiration date; however, there can be no assurance that the landlord would agree to the requested extension.
|
| (2) |
The shell building and ancillary improvements on our new distribution center in Tijuana, Mexico, were completed in the latter part of fiscal 2018. We began shipping certain products to our customers in the first quarter of fiscal 2019 and we expect this facility to be fully operational to ship all our products during fiscal 2019.
|
We believe the above mentioned facilities are sufficient to satisfy our foreseeable warehousing, production, distribution and administrative office space requirements for our current operations.
We are subject to various lawsuits and claims in the normal course of business. In addition, government agencies and self-regulatory organizations have the ability to conduct periodic examinations of and administrative proceedings regarding our business. We do not believe that the outcome of these other matters will have a material adverse effect on our financial position or future results of operations.
Not applicable.
PART II
| Item 5. |
Our common stock is traded on the NASDAQ Global Select Market under the trading symbol MPAA.
The following sets forth the high and low prices of our common stock:
|
Fiscal 2018
|
Fiscal 2017
|
|||||||||||||||
|
High
|
Low
|
High
|
Low
|
|||||||||||||
|
1st Quarter
|
$
|
31.57
|
$
|
25.39
|
$
|
37.70
|
$
|
25.50
|
||||||||
|
2nd Quarter
|
$
|
29.88
|
$
|
24.24
|
$
|
34.73
|
$
|
25.78
|
||||||||
|
3rd Quarter
|
$
|
30.16
|
$
|
23.92
|
$
|
29.41
|
$
|
21.75
|
||||||||
|
4th Quarter
|
$
|
28.98
|
$
|
20.11
|
$
|
30.87
|
$
|
25.09
|
||||||||
As of June 7, 2018, there were 18,893,102 shares of common stock outstanding held by 12 holders of record. We have never declared or paid dividends on our common stock. The declaration of any prospective dividends is at the discretion of the board of directors and will be dependent upon sufficient earnings, capital requirements and financial position, general economic conditions, state law requirements, and other relevant factors. Additionally, our new credit facility permits the payment of up to $20,000,000 of dividends per calendar year, subject to a minimum availability threshold and pro forma compliance with financial covenants.
Purchases of Equity Securities by the Issuer
Share repurchase activity during the fourth quarter of fiscal 2018 was as follows:
|
Periods
|
Total Number of
Shares Purchased
|
Average Price
Paid Per Share
|
Total Number of
Shares Purchased
as Part of Publicly
Announced Plans
or Programs
|
Approximate
Dollar Value of
Shares That May
Yet Be Purchased
Under the Plans
or Programs (1)
|
||||||||||||
|
January 1 - January 31, 2018:
|
||||||||||||||||
|
Open market and privately negotiated purchases
|
-
|
$
|
-
|
-
|
$
|
8,145,000
|
||||||||||
|
February 1 - February 28, 2018:
|
||||||||||||||||
|
Open market and privately negotiated purchases
|
208,081
|
$
|
22.94
|
208,081
|
8,370,000
|
|||||||||||
|
March 1 - March 31, 2018:
|
||||||||||||||||
|
Open market and privately negotiated purchases
|
-
|
$
|
-
|
-
|
8,370,000
|
|||||||||||
|
Total
|
208,081
|
208,081
|
$
|
8,370,000
|
||||||||||||
| (1) |
On February 2, 2018, our board of directors increased our share repurchase program authorization from $15,000,000 to $20,000,000 of our common stock. As of March 31, 2018, $11,630,000 of the $20,000,000 had been utilized and $8,370,000 remained available to repurchase shares under the authorized share repurchase program, subject to the limit in our credit facility. We retired the 511,746 shares repurchased under this program through March 31, 2018. Our share repurchase program does not obligate us to acquire any specific number of shares and shares may be repurchased in privately negotiated and/or open market transactions.
|
Equity Compensation Plan Information
The following summarizes our equity compensation plans as of March 31, 2018:
|
Plan Category
|
Number of securities to
be issued upon
exercise of outstanding
options, warrants and
rights
(a)
|
Weighted-average
exercise price of
outstanding options
warrants and rights
(b)
|
Number of securities
remaining available for
future issuance under
equity compensation plans
(excluding securities
reflected in column (a))
(c )
|
|||||||||
|
Equity compensation plans approved by security holders
|
1,277,126
|
(1)
|
$
|
16.97
|
(2)
|
1,810,786
|
(3)
|
|||||
|
Equity compensation plans not approved by security holders
|
N/A
|
N/A
|
N/A
|
|||||||||
|
Total
|
1,277,126
|
$
|
16.97
|
1,810,786
|
||||||||
| (1) |
Consists of (i) stock options issued under the 2004 Non-Employee Director Stock Option Plan, (ii) restricted stock units (“RSUs”) and stock options issued under the Third Amended and Restated 2010 Incentive Award Plan (the “2010 Plan”), and (iii) RSUs issued under our 2014 Non-Employee Director Incentive Award Plan (the “2014 Plan”).
|
| (2) |
The weighted average exercise price does not reflect the shares that will be issued in connection with the settlement of RSUs, since RSUs have no exercise price.
|
| (3) |
Consists of shares available for future issuance under our 2010 Plan and 2014 Plan.
|
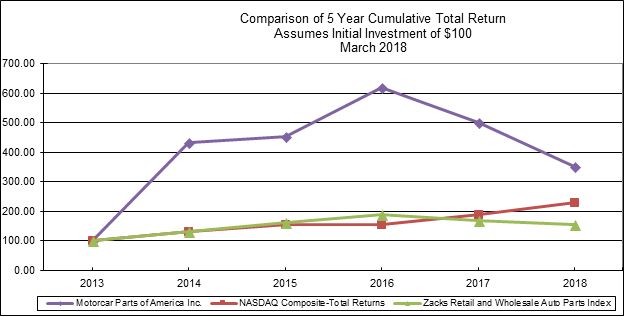
Stock Performance Graph
The following graph compares the cumulative return to holders of our common stock for the five years ending March 31, 2018 with the NASDAQ Composite Total Returns Index and the Zacks Retail and Wholesale Auto Parts Index. The comparison assumes $100 was invested at the close of business on March 31, 2013 in our common stock and in each of the comparison groups, and assumes reinvestment of dividends.
The following selected historical consolidated financial information for the periods indicated below has been derived from and should be read in conjunction with our consolidated financial statements and related notes thereto.
Our selected income statement data below represents our continuing operations and excludes the results of the discontinued subsidiary between the acquisition in May 2011 and its bankruptcy in June 2013.
|
Fiscal Years Ended March 31,
|
||||||||||||||||||||
|
Income Statement Data
|
2018
|
2017
|
2016
|
2015
|
2014
|
|||||||||||||||
|
Net sales
|
$
|
428,072,000
|
$
|
421,253,000
|
$
|
368,970,000
|
$
|
301,711,000
|
$
|
258,669,000
|
||||||||||
|
Operating income
|
49,624,000
|
67,972,000
|
38,286,000
|
33,586,000
|
32,104,000
|
|||||||||||||||
|
Net income
|
16,316,000
|
37,573,000
|
10,563,000
|
11,453,000
|
6,482,000
|
|||||||||||||||
|
Basic net income per share
|
$
|
0.87
|
$
|
2.02
|
$
|
0.58
|
$
|
0.68
|
$
|
0.45
|
||||||||||
|
Diluted net income per share
|
$
|
0.84
|
$
|
1.93
|
$
|
0.55
|
$
|
0.65
|
$
|
0.42
|
||||||||||
|
March 31,
|
||||||||||||||||||||
|
Balance Sheet Data
|
2018
|
2017
|
2016
|
2015
|
2014
|
|||||||||||||||
|
Total assets
|
$
|
494,497,000
|
$
|
436,139,000
|
$
|
399,057,000
|
$
|
413,078,000
|
$
|
318,853,000
|
||||||||||
|
Working capital (1)
|
(46,267,000
|
)
|
(20,651,000
|
)
|
(24,449,000
|
)
|
43,863,000
|
3,447,000
|
||||||||||||
|
Revolving loan
|
54,000,000
|
11,000,000
|
7,000,000
|
-
|
10,000,000
|
|||||||||||||||
|
Term loan
|
16,981,000
|
19,999,000
|
23,047,000
|
79,222,000
|
87,277,000
|
|||||||||||||||
|
Capital lease obligations
|
5,084,000
|
2,512,000
|
2,608,000
|
528,000
|
318,000
|
|||||||||||||||
|
Other long term liabilities
|
20,960,000
|
25,986,000
|
35,066,000
|
36,049,000
|
26,477,000
|
|||||||||||||||
|
Shareholders’ equity
|
$
|
274,976,000
|
$
|
248,681,000
|
$
|
210,808,000
|
$
|
190,203,000
|
$
|
109,636,000
|
||||||||||
| (1) |
Our working capital is calculated as current assets less current liabilities. We carry our core inventory as a long-term asset in our consolidated balance sheets. As a result of our retrospective adoption of new accounting guidance, our deferred tax assets and liabilities were classified as noncurrent in the consolidated balance sheets from March 31, 2016 onward.
|
The following discussion contains forward-looking statements, including, without limitation, our expectations and statements regarding our outlook and future revenues, expenses, results of operations, liquidity, plans, strategies and objectives of management and any assumptions underlying any of the foregoing. Our actual results may differ significantly from those projected in the forward-looking statements. Our forward-looking statements and factors that might cause future actual results to differ materially from our recent results or those projected in the forward-looking statements include, but are not limited to, those discussed in the section titled “Cautionary Note Regarding Forward-Looking Statements” and “Risk Factors” of this Annual Report on Form 10-K. Except as required by law, we assume no obligation to update the forward-looking statements or our risk factors for any reason.
Management Overview
We are a leading manufacturer, remanufacturer, and distributor of aftermarket automotive and light truck applications. We also, to a lesser extent, are a manufacturer, remanufacturer, and distributor of heavy duty truck and industrial and agricultural application parts. These replacement parts are sold for use on vehicles after initial vehicle purchase. These automotive parts are sold to automotive retail chain stores and warehouse distributors throughout North America and to major automobile manufacturers for both their aftermarket programs and warranty replacement programs (“OES”). We estimate the market size to be over $125 billion for each of the light duty and heavy duty markets in North America. We added turbochargers through an acquisition in July 2016. We began selling brake power boosters in August 2016. As a result of an acquisition in July 2017, our business also now includes developing and selling diagnostic equipment for alternators, starters, belt-start generators (stop start and hybrid technology), and electric power trains for electric vehicles.
The current population of light duty vehicles in the U.S. is approximately 271 million and the average age of these vehicles is approximately 11.7 years. The aged vehicle population remains favorable. Although miles driven fluctuate primarily based on fuel prices, it has steadily increased for the past year. We believe demand for aftermarket automotive parts generally increases with the age of vehicles. In addition, increases in miles driven can accelerate replacement rates.
The automotive and light truck parts aftermarket is divided into two markets. The first is the do-it-yourself (“DIY”) market, which is generally serviced by the large retail chain outlets. Consumers who purchase parts from the DIY channel generally install parts into their vehicles themselves. In most cases, this is a less expensive alternative than having the repair performed by a professional installer. The second is the professional installer market, commonly known as the do-it-for-me (“DIFM”) market. The traditional warehouse distributors, the dealer networks, and the commercial divisions of retail chains service this market. Generally, the consumer in this channel is a professional parts installer. Our products are distributed to both the DIY and DIFM markets.
The heavy duty truck, industrial and agricultural aftermarket has some overlap with the automotive aftermarket as discussed above, but also has specialty distribution channels through the OES channel and auto-electric distributor channels.
In addition, we are now in the business of diagnostic equipment for alternators, starters, belt-start generators (stop start and hybrid technology), and electric power trains for electric vehicles. The global market for diagnostics is approximately $5 billion, with the smallest but fastest growing segment of this being in the electric vehicle market.
Segment Reporting
Pursuant to the guidance provided under the FASB ASC for segment reporting, we have identified our chief executive officer as CODM, have reviewed the documents used by the CODM, and understand how such documents are used by the CODM to make financial and operating decisions. We have determined through this review process that our business comprises one reportable segment for purposes of recording and reporting our financial results.
Critical Accounting Policies
We prepare our consolidated financial statements in accordance with generally accepted accounting principles, or GAAP, in the United States. Our significant accounting policies are discussed in detail below and in Note 2 of the notes to consolidated financial statements.
In preparing our consolidated financial statements, we use estimates and assumptions for matters that are inherently uncertain. We base our estimates on historical experiences and reasonable assumptions. Our use of estimates and assumptions affect the reported amounts of assets, liabilities and the amount and timing of revenues and expenses we recognize for and during the reporting period. Actual results may differ from our estimates.
Our remanufacturing operations require that we acquire Used Cores, a necessary raw material, from our customers and offer our customers marketing and other allowances that impact revenue recognition. These elements of our business give rise to more complex accounting than many businesses our size or larger.
New Accounting Pronouncements Not Yet Adopted
Revenue Recognition
In May 2014, the FASB issued ASU 2014-09, Revenue from Contracts with Customers, codified in ASC 606, “Revenue Recognition - Revenue from Contracts with Customers” (“ASC 606”), which amends the guidance in the former ASC 605, “Revenue Recognition”. ASC 606 as initially issued was effective for annual periods beginning after December 15, 2016, and interim periods within that reporting period for a public entity. We may elect either a full retrospective transition method, which requires the restatement of all periods presented, or a modified retrospective transition method, which requires a cumulative-effect adjustment as of the date of initial adoption. In August 2015, the FASB delayed the effective date by one year to annual periods beginning after December 15, 2017, and interim periods within that reporting period for a public entity. Earlier application is permitted only as of annual reporting periods beginning after December 15, 2016, including interim reporting periods within that reporting period. We will adopt the new standard on April 1, 2018 and have elected to utilize the full retrospective transition method.
ASC 606 establishes the requirements for recognizing revenue from contracts with customers. The standard requires entities to apportion consideration from contracts to performance obligations on a relative standalone selling price basis, based on a five-step model. Under the new standard, revenue is recognized when a customer obtains control of a promised good or service and is recognized in an amount that reflects the consideration that the entity expects to receive in exchange for the good or service. In addition, the standard requires disclosure of the nature, amount, timing, and uncertainty of revenue and cash flows arising from contracts with customers.
Due to the impact of the new standard, we have made changes to our business processes, systems, and controls. A project team was formed and evaluated and guided the implementation process. We performed a preliminary assessment, which included the identification of the key contractual terms in our primary revenue streams and the comparison of historical accounting policies and practices to the requirements of the new standard by revenue stream. The preliminary assessment resulted in the identification of potential accounting differences that will arise from the application of the new standard. The implementation team completed its contract review phase of the project during the third quarter, which included identifying the population of contracts and completing an analysis of the potential accounting impacts of the new standard on individual contracts. During the fourth quarter, the implementation team identified the changes to business processes, systems, and controls to support recognition, presentation, and disclosure under the new standard and will implement these changes during the first quarter of fiscal 2019 as described in the subsequent paragraphs.
Our primary revenue stream is derived from the sale of remanufactured products to our customers pursuant to long-term customer contracts. We will continue to recognize revenue at a point in time as we satisfy our performance obligation of transferring control of the product to the customer. We recognize revenues net of anticipated returns, marketing allowances, volume discounts, and other forms of variable consideration more fully described below. We also reviewed customer options to acquire additional goods or services, and have preliminarily determined that no material rights exist within our contracts. We do not currently anticipate the adoption of ASU 2014-09 will have a material impact on previously reported revenue amounts. See discussion regarding the sale of Remanufactured Cores below.
We currently anticipate that the adoption of ASU 2014-09 will primarily impact reclassifications to certain balance sheet accounts to conform to the presentation and disclosure requirements of ASC 606. For example, we currently account for Remanufactured Cores anticipated to be returned as long-term core inventory and the refund liability as a contra-account receivable account as illustrated in Note 6 of the notes to consolidated financial statements for the year ended March 31, 2018. Under ASC 606, we currently anticipate we will reclassify this asset to a contractual asset and recognize a contractual liability for amounts expected to be refunded to customers.
We also analyzed specific contractual provisions related to sales contracts that include Remanufactured Cores. We recognize revenue for sales of cores not expected to be replaced by a similar Used Core sent back under the core exchange program only upon meeting certain criteria as described in Note 2, Summary of Significant Accounting Policies, to the consolidated financial statements for the year ended March 31, 2018. The adoption of ASU 2014-09 may result in an acceleration of revenue recognition, as it requires us to estimate the amount of cores not expected to be returned upon the initial recognition of revenue for contracts that include Remanufactured Cores. As we have elected the full retrospective method of adoption, the impact to each reporting period will be measured as the net impact of (i) the acceleration of revenue into a prior period versus what was previously recorded in that period and (ii) the acceleration of revenue into that period previously recognized in a later period (the change in the estimated volume of returns in the comparable recast periods). Given that third-party information available to meet the criteria outlined in Note 2, Summary of Significant Accounting Policies, may be available at different points of time in a given fiscal period, the timing of the revenue recognized in these periods may be less predictive under ASC 605 as compared to the estimation process required under ASU 2014-09. The anticipated increase to previously reported revenues for the year ended March 31, 2016 is less than $2.0 million. The anticipated decrease to previously reported revenues for the year ended March 31, 2017 is less than $0.9 million. The anticipated decrease to reported revenues in the current fiscal year ended March 31, 2018 is less than $0.4 million.
In order to properly determine the transaction price related to our sales contracts, we have also analyzed our various forms of consideration paid to our vendors, including up-front payments for future contracts. Based on the analysis completed through the year ended March 31, 2018, we currently do not anticipate a change to our legacy accounting practices as a result of the adoption of ASU 2014-09 to account for up-front payments to our vendors. Under current accounting practices, if we expect to generate future revenues associated with an up-front payment, then an asset is recognized and amortized over the appropriate period of time as a reduction of revenue. If we do not expect to generate additional revenue then the up-front payment is recognized in the consolidated statements of income when payment occurs as a reduction of revenue.
ASU 2014-09 also codified the guidance on other assets and deferred costs relating to contracts with customers with the addition of ASC 340-40. This guidance relates to the accounting for costs of an entity to obtain and fulfill a contract to provide goods or services to the customer. Under the new guidance, an entity shall recognize as an asset the incremental costs of obtaining a contract with a customer if the entity expects to recover those costs. In our review of the various costs to obtain contracts with our customers, we have preliminarily determined that currently no significant costs are incurred that meet the capitalization criteria. Our primary cost to fulfill contracts, other than inventory related costs, relates to shipping and handling activities, which continue to be expensed as incurred consistent with historical accounting practices.
The new guidance provides several practical expedients, which we anticipate adopting. The first of these practical expedients allows a company to expense incremental costs of obtaining a contract as incurred if the amortization period would have been one year or less. As noted above, we have preliminarily concluded that we do not have any such costs that qualify for capitalization but will apply the practical expedient to the extent that such costs incurred in prospective periods qualify. Similarly, we plan to adopt guidance that allows for the effects of a significant financing component to be ignored if a company expects that the period between the transfer of the goods and services to the customer and payment will be one year or less. Finally, we plan to adopt guidance that allows a company to account for shipping and handling activities that occur after control of the related good transfers as fulfillment activities instead of assessing such activities as performance obligations.
Financial Instruments
In January 2016, the FASB issued guidance that amends the classification and measurement of financial instruments. Changes to the current guidance primarily affect the accounting for equity investments, financial liabilities under the fair value option, and the presentation and disclosure requirements for financial instruments. In addition, the ASU clarifies guidance related to the valuation allowance assessment when recognizing deferred tax assets resulting from unrealized losses on available-for-sale debt securities. The new standard is effective for fiscal years, and interim periods within those fiscal years, beginning after December 15, 2017. We expect to apply the amendments in the new guidance by means of a cumulative-effect adjustment to the opening balance of retained earnings at the beginning of the first quarter of fiscal 2019. The adoption of the new guidance is not expected to have a material impact on our consolidated financial statements.
Leases
In February 2016, the FASB issued new guidance that requires balance sheet recognition of a right-of-use asset and lease liability by lessees for operating leases. The new guidance also requires new disclosures providing additional qualitative and quantitative information about the amounts recorded in the financial statements. The new guidance is effective for fiscal years beginning after December 15, 2018, including interim periods within those fiscal years. Early adoption is permitted. The new guidance requires a modified retrospective approach with optional practical expedients. We will adopt this guidance in the first quarter of fiscal 2020. We are currently evaluating the impact the provisions of this guidance will have on our consolidated financial statements, but expect that it will result in a significant increase to our long-term assets and liabilities on the consolidated balance sheets.
Business Combinations
In January 2017, the FASB issued guidance which clarifies the definition of a business to assist entities with evaluating whether transactions should be accounted for as acquisitions (or disposals) of assets or businesses. The new guidance is effective for fiscal years beginning after December 15, 2017, including interim periods within those fiscal years. A reporting entity should apply the amendment prospectively. The adoption of this guidance in the first quarter of fiscal 2019 is not expected to have any material impact on our consolidated financial statements.
Goodwill Impairment
In January 2017, the FASB issued guidance which simplifies the test for goodwill impairment. This standard eliminates Step 2 from the goodwill impairment test, instead requiring an entity to recognize a goodwill impairment charge for the amount by which the goodwill carrying amount exceeds the reporting unit’s fair value. This guidance is effective for interim and annual goodwill impairment tests in fiscal years beginning after December 15, 2019 with early adoption permitted. This guidance must be applied on a prospective basis. We are currently evaluating the impact the provisions of this guidance will have on our consolidated financial statements.
Modifications to Share-Based Payment Awards
In May 2017, the FASB issued guidance to provide clarity and reduce (i) the diversity in practice and (ii) the cost and complexity when applying the accounting guidance for equity-based compensation to a change to the terms or conditions of a share-based payment award. This update provides guidance about which changes to the terms or conditions of a share-based payment award require an entity to apply modification accounting. This guidance is effective for annual periods, and interim periods within those annual periods, beginning after December 15, 2017 with early adoption permitted. This guidance should be applied prospectively to an award modified on or after that adoption date. The adoption of this guidance in the first quarter of fiscal 2019 is not expected to have any material impact on our consolidated financial statements.
Derivatives and Hedging
In August 2017, the FASB issued guidance to improve the financial reporting of hedging relationships to better portray the economic results of an entity’s risk management activities in its financial statements. The amendments in this update also make certain targeted improvements to simplify the application of the hedge accounting guidance in current GAAP. The new guidance is effective for fiscal years beginning after December 15, 2018, including interim periods within those fiscal years; the guidance allows for early adoption in any interim period after issuance of the update. We are currently evaluating the impact this guidance will have on our consolidated financial statements.
Inventory
Non-core Inventory
Non-core inventory is comprised of (i) non-core raw materials, (ii) the non-core value of work in process, (iii) the non-core value of remanufactured finished goods, and (iv) purchased finished goods. Used Cores, the Used Core value of work in process, and the Remanufactured Core portion of finished goods are classified as long-term core inventory as described below under the caption “Long-term Core Inventory.” Used Cores are a source of raw materials used in the remanufacturing of our products.
Non-core inventory is stated at the lower of cost or net realizable value. The cost of non-core remanufactured inventory approximates average historical purchase prices paid for raw materials, and is based upon the direct costs of material and an allocation of labor and variable and fixed overhead costs. The cost of purchased finished goods inventory approximates average historical purchase prices paid, and an allocation of fixed overhead costs. The cost of non-core inventory is evaluated at least quarterly during the fiscal year and adjusted as necessary to reflect current lower of cost or net realizable value levels. These adjustments are determined for individual items of inventory within each of the three classifications of non-core inventory as follows:
| • |
Non-core raw materials are recorded at average cost, which is based on the actual purchase price of raw materials on hand. The average cost is updated quarterly. This average cost is used in the inventory costing process and is the basis for allocation of materials to finished goods during the production process.
|
| • |
Non-core work in process is in various stages of production and is valued at the average cost of materials issued to the open work orders. Historically, non-core work in process inventory has not been material compared to the total non-core inventory balance.
|
| • |
The cost of remanufactured finished goods includes the average cost of non-core raw materials and allocations of labor and variable and fixed overhead costs. The allocations of labor and variable and fixed overhead costs are determined based on the average actual use of the production facilities over the prior twelve months, which approximates normal capacity. This method prevents the distortion in allocated labor and overhead costs that would occur during short periods of abnormally low or high production. In addition, we exclude certain unallocated overhead such as severance costs, duplicative facility overhead costs, start-up costs, training, and spoilage from the calculation and expense these unallocated overhead as period costs.
|
We record an allowance for potentially excess and obsolete inventory based upon recent sales history, the quantity of inventory on-hand, and a forecast of potential use of the inventory. We periodically review inventory to identify excess quantities and part numbers that are experiencing a reduction in demand. Any part numbers with quantities identified during this process are reserved for at rates based upon management’s judgment, historical rates, and consideration of possible scrap and liquidation values which may be as high as 100% of cost if no liquidation market exists for the part. We recorded reserves of $6,682,000 and $4,125,000 for excess and obsolete inventory at March 31, 2018 and 2017, respectively. The quantity thresholds and reserve rates are subjective and are based on management’s judgment and knowledge of current and projected industry demand. The reserve estimates may, therefore, be revised if there are changes in the overall market for our products or market changes that in management’s judgment, impact our ability to sell or liquidate potentially excess or obsolete inventory.
We record vendor discounts as reductions of inventories that are recognized as reductions to cost of sales as the inventories are sold.
Inventory Unreturned
Inventory unreturned represents our estimate, based on historical data and prospective information provided directly by the customer, of finished goods shipped to customers that we expect to be returned, under our general right of return policy, after the balance sheet date. Because all cores are classified separately as long-term assets, the inventory unreturned balance includes only the added unit value of a finished good. The return rate is calculated based on expected returns within the normal operating cycle of one year. As such, the related amounts are classified in current assets.
Inventory unreturned is valued in the same manner as our finished goods inventory.
Long-term Core Inventory
Long-term core inventory consists of:
| • |
Used Cores purchased from core brokers and held in inventory at our facilities,
|
| • |
Used Cores returned by our customers and held in inventory at our facilities,
|
| • |
Used Cores returned by end-users to customers but not yet returned to us which are classified as Remanufactured Cores until they are physically received by us,
|
| • |
Remanufactured Cores held in finished goods inventory at our facilities; and
|
| • |
Remanufactured Cores held at customer locations as a part of the finished goods sold to the customer. For these Remanufactured Cores, we expect the finished good containing the Remanufactured Core to be returned under our general right of return policy or a similar Used Core to be returned to us by the customer, in each case, for credit.
|
Long-term core inventory is recorded at average historical purchase prices determined based on actual purchases of inventory on hand. The cost and net realizable value of Used Cores for which sufficient recent purchases have occurred are deemed the same as the purchase price for purchases that are made in arm’s length transactions.
Long-term core inventory recorded at average historical purchase prices is primarily made up of Used Cores for newer products related to more recent automobile models or products for which there is a less liquid market. We purchase these Used Cores from core brokers to supplement the yield from returned cores and the under return by consumers.
Used Cores obtained in core broker transactions are valued based on average purchase price. The average purchase price of Used Cores for more recent automobile models is retained as the cost for these Used Cores in subsequent periods even as the source of these Used Cores shifts to our core exchange program.
Long-term core inventory is recorded at the lower of cost or net realizable value. In the absence of sufficient recent purchases we use the net selling price that our customers have agreed to pay for Used Cores that are not returned to us under our core exchange program to assess whether Used Core cost exceeds Used Core net realizable value on a customer-by-customer basis.
We classify all of our core inventories as long-term assets. The determination of the long-term classification is based on our view that the value of the cores is not consumed or realized in cash during our normal operating cycle, which is one year for most of the cores recorded in inventory. According to guidance provided under the FASB ASC, current assets are defined as “assets or resources commonly identified as those which are reasonably expected to be realized in cash or sold or consumed during the normal operating cycle of the business.” We do not believe that the economic value of core inventories, which we classify as long-term, is consumed because the credits issued upon the return of Used Cores offset the amounts invoiced when the Remanufactured Cores included in finished goods were sold. We do not expect the economic value of core inventories to be consumed, and thus we do not expect to realize cash, until our relationship with a customer ends, a possibility that we consider remote based on existing long-term customer agreements and historical experience.
However, historically for a portion of finished goods sold, our customers will not send us a Used Core to obtain the credit we offer under our core exchange program. Therefore, based on our historical estimate, we derecognize the core value for these finished goods as we believe the economic value has been consumed and we have realized cash.
For these reasons, we concluded that it is more appropriate to classify core inventory as long-term assets.
Long-term Core Inventory Deposit
The long-term core inventory deposit represents the cost of Remanufactured Cores we have purchased from customers, which are held by the customers and remain on the customers’ premises. The costs of these Remanufactured Cores were established at the time of the transaction based on the then current cost, determined as noted under the caption “Long-term Core Inventory”. The selling value of these Remanufactured Cores was established based on agreed upon amounts with these customers. We expect to realize the selling value and the related cost of these Remanufactured Cores should our relationship with a customer end, a possibility that we consider remote based on existing long-term customer agreement and historical experience.
Our inventory balances are as follows at March 31:
|
2018
|
2017
|
|||||||
|
Non-core inventory
|
||||||||
|
Raw materials
|
$
|
25,805,000
|
$
|
21,515,000
|
||||
|
Work in process
|
635,000
|
641,000
|
||||||
|
Finished goods
|
53,973,000
|
48,337,000
|
||||||
|
80,413,000
|
70,493,000
|
|||||||
|
Less allowance for excess and obsolete inventory
|
(4,138,000
|
)
|
(2,977,000
|
)
|
||||
|
Total
|
$
|
76,275,000
|
$
|
67,516,000
|
||||
|
Inventory unreturned
|
$
|
7,508,000
|
$
|
7,581,000
|
||||
|
Long-term core inventory
|
||||||||
|
Used cores held at the Company's facilities
|
$
|
53,278,000
|
$
|
38,713,000
|
||||
|
Used cores expected to be returned by customers
|
12,970,000
|
11,752,000
|
||||||
|
Remanufactured cores held in finished goods
|
34,201,000
|
27,667,000
|
||||||
|
Remanufactured cores held at customers' locations (1)
|
203,751,000
|
185,938,000
|
||||||
|
304,200,000
|
264,070,000
|
|||||||
|
Less allowance for excess and obsolete inventory
|
(2,544,000
|
)
|
(1,148,000
|
)
|
||||
|
Total
|
$
|
301,656,000
|
$
|
262,922,000
|
||||
|
Long-term core inventory deposits
|
$
|
5,569,000
|
$
|
5,569,000
|
||||
| (1) |
Remanufactured cores held at customers’ locations represent the core portion of our customers’ finished goods at our customers’ locations.
|
Revenue Recognition
We recognize revenue when our performance is complete, and all of the following criteria have been met:
| • |
Persuasive evidence of an arrangement exists,
|
| • |
Delivery has occurred or services have been rendered,
|
| • |
The seller’s price to the buyer is fixed or determinable, and
|
| • |
Collectability is reasonably assured.
|
For products shipped free-on-board (“FOB”) shipping point, revenue is recognized on the date of shipment. For products shipped FOB destination, revenues are recognized on the estimated or actual date of delivery. We include shipping and handling charges in the gross invoice price to customers and classify the total amount as revenue. All shipping and handling costs are expensed as incurred and included in cost of sales.
Revenue Recognition; Net-of-Core-Value Basis
The price of a finished remanufactured product sold to customers is generally comprised of separately invoiced amounts for the Remanufactured Core included in the product (“Remanufactured Core value”) and the unit value. The unit value is recorded as revenue based on our then current price list, net of applicable discounts and allowances. Based on our experience, contractual arrangements with customers and inventory management practices, a significant portion of the remanufactured automotive parts we sell to customers are replaced by similar Used Cores sent back for credit by customers under our core exchange program. In accordance with our net-of-core-value revenue recognition policy, we do not recognize the Remanufactured Core value as revenue when the finished products are sold. We generally limit the number of Used Cores sent back under the core exchange program to the number of similar Remanufactured Cores previously shipped to each customer.
Revenue Recognition — Core Revenue
Full price Remanufactured Cores: When we ship a remanufactured product, we invoice certain customers for the Remanufactured Core value portion of the product at the full Remanufactured Core sales price but do not recognize revenue for the Remanufactured Core value at that time. For these Remanufactured Cores, we recognize core revenue based upon an estimate of the rate at which our customers will pay cash for Remanufactured Cores in lieu of sending back similar Used Cores for credits under our core exchange program.
Nominal price Remanufactured Cores: We invoice other customers for the Remanufactured Core value portion of the product shipped at a nominal Remanufactured Core price. Unlike the full price Remanufactured Cores, we only recognize revenue from nominal Remanufactured Cores not expected to be replaced by a similar Used Core sent back under the core exchange program when we believe that we have met all of the following criteria:
| • |
We have a signed agreement with the customer covering the nominally priced Remanufactured Cores not expected to be sent back under the core exchange program, and the agreement must specify the number of Remanufactured Cores our customer will pay cash for in lieu of sending back a similar Used Core under our core exchange program and the basis on which the nominally priced Remanufactured Cores are to be valued (normally the average price per Remanufactured Core stipulated in the agreement).
|
| • |
The contractual date for reconciling our records and customer’s records of the number of nominally priced Remanufactured Cores not expected to be replaced by similar Used Cores sent back under our core exchange program must be in the current or a prior period.
|
| • |
The reconciliation must be completed and agreed to by the customer.
|
| • |
The amount must be billed to the customer.
|
Revenue Recognition; General Right of Return
We allow our customers to return goods to us that their end-user customers have returned to them, whether or not the returned item is defective (warranty returns). In addition, under the terms of certain agreements with our customers and industry practice, our customers from time to time are allowed stock adjustments when their inventory of certain product lines exceeds the anticipated sales to end-user customers (stock adjustment returns). Customers have various contractual rights for stock adjustment returns, which are typically less than 5% of units sold. In some instances, we allow a higher level of returns in connection with significant restocking orders. In addition, we allow customers to return goods to us that their end-user consumers have returned to them. We seek to limit the aggregate general right of returns to less than 20% of unit sales.
We provide for such anticipated returns of inventory by reducing revenue and the related cost of sales for the units estimated to be returned as further described under the captions “Customer Finished Goods Returns Accrual” and “Inventory Unreturned”.
Our allowance for warranty returns is established based on a historical analysis of the level of this type of return as a percentage of total unit sales. Stock adjustment returns do not occur at any specific time during the year, and the expected level of these returns cannot be reasonably estimated based on a historical analysis. Our allowance for stock adjustment returns is based on specific customer inventory levels, inventory movements, and information on the estimated timing of stock adjustment returns provided to us by our customers. The return rate for stock adjustments is calculated based on expected returns within the normal operating cycle of one year.
Customer Finished Goods Returns Accrual
The customer finished goods returns accrual represents the non-core sales value of estimated warranty and stock adjustment returns and is classified as a current liability due to the expectation that these returns will occur within the normal operating cycle of one year. Our customer finished goods returns accrual was $17,805,000 and $17,667,000 at March 31, 2018 and 2017, respectively.
Accrued Core Payment
The accrued core payment represents the full Remanufactured Core sales price of Remanufactured Cores we have purchased from our customers, generally in connection with new business, which are held by these customers and remain on their premises. At the same time, we record the long-term core inventory for the Remanufactured Cores purchased at its cost, determined as noted under the caption “Long-term Core Inventory”. The difference between the full Remanufactured Core sales price of Remanufactured Cores and its related cost is treated as sales allowance reducing revenue when the purchases are made. We expect to realize the selling value and the related cost of these Remanufactured Cores should our relationship with a customer end, a possibility that we consider remote based on existing long-term customer agreement and historical experience.
The repayments for these Remanufactured Core inventory purchases are made through the issuance of credits against that customer’s receivables either on a one-time basis or over an agreed-upon period. The accrued core payment is recorded as current and noncurrent liability in the consolidated balance sheets based on whether repayments will occur within the normal operating cycle of one year. Our net accrued core payment was $35,009,000 and $24,063,000 at March 31, 2018 and 2017, respectively. This increase in our accrued core payment was due to increased core purchases in connection with new business awarded to us during fiscal 2018.
Sales Incentives
We provide various marketing allowances to our customers, including sales incentives and concessions. Marketing allowances related to a single exchange of product are recorded as a reduction of revenues at the time the related revenues are recorded or when such incentives are offered. Other marketing allowances, which may only be applied against future purchases, are recorded as a reduction to revenues in accordance with a schedule set forth in the relevant contract. Sales incentive amounts are recorded based on the value of the incentive provided.
Goodwill
We evaluate goodwill for impairment at least annually during the fourth quarter of each fiscal year or more frequently when an event occurs or circumstances change that indicate the carrying value may not be recoverable. We have concluded that there is one reporting unit and therefore test goodwill for impairment at the entity level. In testing for goodwill impairment, we may elect to utilize a qualitative assessment to evaluate whether it is more likely than not that the fair value of a reporting unit is less than its carrying amount. If our qualitative assessment indicates that goodwill impairment is more likely than not, we perform a two-step impairment test. We test goodwill for impairment under the two-step impairment test by first comparing the carrying value of net assets to the fair value of the reporting unit. If the fair value of the reporting unit exceeds the carrying value, goodwill is not considered impaired and no further testing is required. If the carrying value of the reporting unit exceeds the fair value, goodwill is potentially impaired and the second step of the impairment test must be performed. In the second step, we would compare the implied fair value of the goodwill to its carrying value to determine the amount of the impairment loss, if any. We completed the required annual testing of goodwill for impairment during the fourth quarter of fiscal 2018, and determined through the qualitative assessment that our goodwill of $2,551,000 at March 31, 2018 is not impaired.
Intangible Assets
Our intangible assets other than goodwill are finite–lived and amortized on a straight-line basis over their respective useful lives. We analyze our finite-lived intangible assets for impairment when and if indicators of impairment exist. At March 31, 2018, our net intangible assets were $3,766,000 and there were no indicators of impairment.
Income Taxes
We account for income taxes using the liability method, which measures deferred income taxes by applying enacted statutory rates in effect at the balance sheet date to the differences between the tax basis of assets and liabilities and their reported amounts in the financial statements. The resulting asset or liability is adjusted to reflect changes in the tax laws as they occur. A valuation allowance is provided to reduce deferred tax assets when it is more likely than not that a portion of the deferred tax asset will not be realized.
The primary components of our income tax expense are (i) the current liability or refund due for federal, state and foreign income taxes and (ii) the change in the amount of the net deferred income tax asset, including the effect of any change in the valuation allowance.
In December 2017, new tax legislation was enacted in the United States (Tax Reform Act) which resulted in significant changes to income tax expense. As a result of the Tax Reform Act, we re-measured certain deferred tax assets and liabilities based on the newly enacted federal rate of 21%. Accordingly, the federal net deferred tax assets were written down to account for the change. These tax changes represent provisional amounts based on our current interpretation of the Tax Reform Act and may change as we receive additional clarification and implementation guidance. We will continue to analyze the effects of the Tax Reform Act on our financial statements and operations. Any additional impacts from the enactment of the Tax Reform Act will be recorded as they are identified during the measurement period as provided for in accordance with Staff Accounting Bulletin No. 118.
Realization of deferred tax assets is dependent upon our ability to generate sufficient future taxable income. Significant judgment is required in determining our provision for income taxes, our deferred tax assets and liabilities and any valuation allowance recorded against our net deferred tax assets. We make these estimates and judgments about our future taxable income that are based on assumptions that are consistent with our future plans. A valuation allowance is established when we believe it is not more likely than not all or some of a deferred tax assets will be realized. In evaluating our ability to recover deferred tax assets within the jurisdiction in which they arise, we consider all available positive and negative evidence. Deferred tax assets arising primarily as a result of net operating loss carry-forwards and research and development credits in connection with our July 2017 acquisition have been offset completely by a valuation allowance due to the uncertainty of their utilization in future periods. Should the actual amount differ from our estimate, the amount of our valuation allowance could be impacted.
Financial Risk Management and Derivatives
We are exposed to market risk from material movements in foreign exchange rates between the U.S. dollar and the currencies of the foreign countries in which we operate. As a result of our significant operations in Mexico, our primary risk relates to changes in the rates between the U.S. dollar and the Mexican peso. To mitigate this currency risk, we enter into forward foreign exchange contracts to exchange U.S. dollars for Mexican pesos. We also enter into forward foreign exchange contracts to exchange U.S. dollars for Chinese yuan in order to mitigate risk related to our purchases and payments to our Chinese vendors. The extent to which we use forward foreign exchange contracts is periodically reviewed in light of our estimate of market conditions and the terms and length of anticipated requirements. The use of derivative financial instruments allows us to reduce our exposure to the risk that the eventual net cash outflow resulting from funding the expenses of the foreign operations will be materially affected by changes in the exchange rates. We do not engage in currency speculation or hold or issue financial instruments for trading purposes. These contracts generally expire in a year or less. Any changes in the fair value of foreign exchange contracts are accounted for as an increase or decrease to general and administrative expenses in current period earnings.
Share-based Payments
In accounting for share-based compensation awards, we follow the accounting guidance for equity-based compensation, which requires that we measure the cost of employee services received in exchange for an award of equity instruments based on the grant-date fair value of the award. The cost associated with stock options is estimated using the Black-Scholes option-pricing model. The cost associated with restricted stock units is measured based on the number of shares granted and the closing price of our common stock on the grant date, subject to continued employment. The cost of equity instruments is recognized in the consolidated statements of income on a straight-line basis over the period during which an employee is required to provide service in exchange for the award. In addition, we account for forfeitures as they occur.
Subsequent Events
Credit Facility
On June 5, 2018 we entered into an Amended and Restated Credit Facility (the “New Credit Facility”), with the lenders party thereto, and PNC Bank, National Association, as administrative agent, consisting of (i) a $200,000,000 revolving loan facility, subject to borrowing base restrictions, a $20,000,000 sublimit for borrowings by Canadian borrowers, and a $15,000,000 sublimit for letters of credit (the “New Revolving Facility) and (ii) a $30,000,000 term loan facility (the “New Term Loans”). The loans under the New Credit Facility mature on June 5, 2023. In connection with the New Credit Facility, the lenders were granted a security interest in substantially all of our assets.
Results of Operations
The following discussion and analysis should be read together with the financial statements and notes thereto appearing elsewhere herein.
The following summarizes certain key operating data for the periods indicated:
|
Fiscal Years Ended March 31,
|
||||||||||||
|
2018
|
2017
|
2016
|
||||||||||
|
Gross profit percentage
|
24.7
|
%
|
27.3
|
%
|
27.4
|
%
|
||||||
|
Cash flow (used in) provided by operations
|
$
|
(13,944,000
|
)
|
$
|
(5,269,000
|
)
|
$
|
15,334,000
|
||||
|
Finished goods turnover (1)
|
6.3
|
6.7
|
6.5
|
|||||||||
| (1) |
Finished goods turnover is calculated by dividing the cost of goods sold for the year by the average between beginning and ending non-core finished goods inventory values, for each fiscal year. We believe that this provides a useful measure of our ability to turn our inventory into revenues.
|
Fiscal 2018 Compared to Fiscal 2017
Net Sales and Gross Profit
The following summarizes net sales and gross profit:
|
Fiscal Years Ended March 31,
|
||||||||
|
2018
|
2017
|
|||||||
|
Net sales
|
$
|
428,072,000
|
$
|
421,253,000
|
||||
|
Cost of goods sold
|
322,199,000
|
306,207,000
|
||||||
|
Gross profit
|
105,873,000
|
115,046,000
|
||||||
|
Gross profit percentage
|
24.7
|
%
|
27.3
|
%
|
||||
Net Sales. Our net sales for fiscal 2018 increased by $6,819,000, or 1.6%, to $428,072,000 compared to net sales for fiscal 2017 of $421,253,000. Our prior year net sales were positively impacted by $9,261,000 due to the change in our estimate for anticipated stock adjustment returns. The increase in our fiscal 2018 net sales was primarily due to growth in sales of our rotating electrical products and brake booster products, in addition to sales of diagnostic equipment as a result of our July 2017 acquisition. Sales of rotating electrical products represented 78.0% and 78.6%, wheel hub products represented 16.9% and 18.5%, brake master cylinder products represented 2.3% and 2.9%, and other products represented 2.8% and 0%, of net sales for fiscal 2018 and 2017, respectively. Our net sales were further impacted by certain customer allowances as discussed below in Gross Profit paragraph.
Gross Profit. Our gross profit percentage was 24.7% for fiscal 2018 compared to 27.3% for fiscal 2017. Gross profit for fiscal 2018 was impacted by $8,459,000 for customer allowances and initial return and stock adjustment accruals related to new business entered into during fiscal 2018, less a cost of goods sold offset of $649,000, transition expenses of $1,831,000 in connection with the expansion of our operations in Mexico, and a cost of goods sold impact of $269,000 for inventory step-up amortization. In addition, our gross profit for fiscal 2018 was further impacted by higher returns and lower overhead absorption. Our gross profit for fiscal 2017 was impacted by $12,727,000 for customer allowances and initial return and stock adjustment accruals related to new business less a cost of goods sold offset of $568,000, and a cost of goods sold impact of $1,457,000 for start-up and ramp-up costs incurred related to our launch of brake power boosters. This decrease was partially offset by a 0.4% increase from the change in estimate relating to stock adjustments.
In addition, our gross profit was further impacted by the lower of cost or net realizable value revaluation for remanufactured cores held at customers’ locations of $9,091,000 for fiscal 2018 and $5,788,000 for fiscal 2017.
Operating Expenses
The following summarizes operating expenses:
|
Fiscal Years Ended March 31,
|
||||||||
|
2018
|
2017
|
|||||||
|
General and administrative
|
$
|
35,527,000
|
$
|
31,124,000
|
||||
|
Sales and marketing
|
15,030,000
|
12,126,000
|
||||||
|
Research and development
|
5,692,000
|
3,824,000
|
||||||
|
Percent of net sales
|
||||||||
|
General and administrative
|
8.3
|
%
|
7.4
|
%
|
||||
|
Sales and marketing
|
3.5
|
%
|
2.9
|
%
|
||||
|
Research and development
|
1.3
|
%
|
0.9
|
%
|
||||
General and Administrative. Our general and administrative expenses for fiscal 2018 were $35,527,000, which represents an increase of $4,403,000, or 14.1%, from general and administrative expenses for fiscal 2017 of $31,124,000. The increase in fiscal 2018 was primarily due to (i) $1,573,000 of increased employee-related expenses to support our growth initiatives, (ii) a gain of $2,313,000 recorded during fiscal 2018 due to the change in the fair value of the warrant liability compared to a gain of $3,764,000 recorded during fiscal 2017, (iii) $1,093,000 of increased general and administrative expenses at our offshore locations due primarily to support our growth initiatives and fluctuations in foreign currency exchange rates, (iv) $913,000 of general and administrative expenses attributable to our July 2017 acquisition, and (v) $285,000 of increased travel. These increases were partially offset by $1,341,000 of decreased legal and other professional services.
Sales and Marketing. Our sales and marketing expenses for fiscal 2018 increased $2,904,000, or 23.9%, to $15,030,000 from $12,126,000 for fiscal 2017. The increase was due primarily (i) $1,305,000 of sales and marketing expenses attributable to our July 2017 acquisition, (ii) $1,012,000 for personnel added to support our growth initiatives, and (iii) $503,000 of increased commissions.
Research and Development. Our research and development expenses increased by $1,868,000, or 48.8%, to $5,692,000 for fiscal 2018 from $3,824,000 for fiscal 2017. This increase was due primarily to (i) $1,755,000 attributable to our July 2017 acquisition and (ii) $399,000 for personnel added to support our growth initiatives. These increases were partially offset by (i) $170,000 of decreased expense for supplies and (ii) $119,000 of decreased expense for outside services.
Interest Expense
Interest Expense, net. Our interest expense, net for fiscal 2018 increased $2,351,000, or 18.0%, to $15,445,000 from $13,094,000 for fiscal 2017. The increase in interest expense in fiscal 2018 was due primarily to increased use of our accounts receivable discount programs, increased average outstanding borrowings as we continue to build our inventory to support anticipated higher sales, and the write-off of $231,000 of debt issuance costs.
Provision for Income Taxes
Income Tax. Our income tax expense was $17,863,000, an effective tax rate of 52.3%, and $17,305,000, an effective tax rate of 31.5% during fiscal 2018 and 2017, respectively. On December 22, 2017, the Tax Reform Act was enacted into law, which changed various corporate income tax provisions within the existing Internal Revenue Code. The Tax Reform Act, among other things, lowered the U.S. corporate tax rate from 35% to 21% effective January 1, 2018, while also repealing the deduction for domestic production activities, implementing a territorial tax system and imposing a repatriation tax on deemed repatriated earnings of foreign subsidiaries. As a result, we recorded a one-time non-cash tax charge of $4,863,000 related to the revaluation of deferred tax assets and liabilities and a one-time tax charge of $530,000 due to the transition tax on deemed repatriation of accumulated foreign income, during fiscal 2018.
In addition, the effective tax rate for fiscal 2018 is a blended rate reflecting the estimated benefit of one quarter of the federal tax rate reduction for fiscal 2018.
Fiscal 2017 Compared to Fiscal 2016
Net Sales and Gross Profit
The following summarizes net sales and gross profit:
|
Fiscal Years Ended March 31,
|
||||||||
|
2017
|
2016
|
|||||||
|
Net sales
|
$
|
421,253,000
|
$
|
368,970,000
|
||||
|
Cost of goods sold
|
306,207,000
|
268,046,000
|
||||||
|
Gross profit
|
115,046,000
|
100,924,000
|
||||||
|
Gross profit percentage
|
27.3
|
%
|
27.4
|
%
|
||||
Net Sales. Our net sales for fiscal 2017 increased by $52,283,000, or 14.2%, to $421,253,000 compared to net sales for fiscal 2016 of $368,970,000. The increase in our net sales was across all existing product lines. $9,261,000 of this increase is due to the change in our estimate for anticipated stock adjustment returns. Sales of rotating electrical products represented 78.6% and 78.7%, wheel hub products represented 18.5% and 19.6%, and brake master cylinder products represented 2.9% and 1.7%, of net sales for fiscal 2017 and 2016, respectively. The increase in net sales was partially offset by allowances and returns related to new business as discussed below in the Gross Profit paragraph.
Gross Profit. Our gross profit percentage remained substantially consistent at 27.3% for fiscal 2017 compared to 27.4% for fiscal 2016. Our gross profit for fiscal 2017 was impacted by $12,727,000 for customer allowances and initial return and stock adjustment accruals related to new business less a cost of goods sold offset of $568,000, and a cost of goods sold impact of $1,457,000 for start-up and ramp-up costs incurred related to our launch of brake power boosters. This decrease was partially offset by a 0.4% increase from the change in estimate relating to stock adjustments. Our gross profit for fiscal 2016 was impacted by $14,364,000 for customer allowances related to new business less a cost of goods sold offset of $809,000, and a cost of goods sold impact of $43,000 for start-up costs incurred related to our launch of brake power boosters and $453,000 for inventory step-up amortization.
In addition, our gross profit was further impacted by the lower of cost or net realizable value revaluation for remanufactured cores held at customers’ locations of $5,788,000 for fiscal 2017 and $2,700,000 for fiscal 2016.
Operating Expenses
The following summarizes operating expenses:
|
Fiscal Years Ended March 31,
|
||||||||
|
2017
|
2016
|
|||||||
|
General and administrative
|
$
|
31,124,000
|
$
|
49,665,000
|
||||
|
Sales and marketing
|
12,126,000
|
9,965,000
|
||||||
|
Research and development
|
3,824,000
|
3,008,000
|
||||||
|
Percent of net sales
|
||||||||
|
General and administrative
|
7.4
|
%
|
13.5
|
%
|
||||
|
Sales and marketing
|
2.9
|
%
|
2.7
|
%
|
||||
|
Research and development
|
0.9
|
%
|
0.8
|
%
|
||||
General and Administrative. Our general and administrative expenses for fiscal 2017 were $31,124,000, which represents a decrease of $18,541,000, or 37.3%, from general and administrative expenses for fiscal 2016 of $49,665,000. The reduction in fiscal 2017 was primarily due to (i) a $3,764,000 gain recorded due to the change in the fair value of the warrant liability during fiscal 2017 compared to a loss of $5,137,000 recorded during fiscal 2016, (ii) $8,805,000 of decreased legal expense as compared to fiscal 2016, which included $9,250,000 accrued in fiscal 2016 for the litigation settlement in the bankruptcy cases related to the discontinued subsidiaries partially offset by a $5,800,000 gain in connection with the settlement of litigation with Fenwick Automotive Products Limited and various of its subsidiaries, and (iii) $4,401,000 of decreased bad debt expense as compared to fiscal 2016, which included expense in fiscal 2016 resulting from the bankruptcy filing by one of our customers. These decreases were partially offset by (i) $974,000 of decreased gain recorded due to the change in the fair value of the contingent consideration in connection with our fiscal 2016 acquisition, (ii) $799,000 of increased share-based compensation, and (iii) $700,000 of increased general and administrative expenses at our offshore locations due primarily to our growth initiatives.
Sales and Marketing. Our sales and marketing expenses for fiscal 2017 increased $2,161,000, or 21.7%, to $12,126,000 from $9,965,000 for fiscal 2016. This increase in fiscal 2017 was due primarily to (i) $1,045,000 for personnel added to support our growth initiatives, (ii) $710,000 of increased commissions, (iii) $167,000 of increased outside services, (iv) $127,000 of increased travel, and (v) $97,000 of increased trade show expense.
Research and Development. Our research and development expenses increased by $816,000, or 27.1%, to $3,824,000 for fiscal 2017 from $3,008,000 for fiscal 2016. This increase in fiscal 2017 was due primarily to (i) $550,000 for personnel added to support our growth initiatives, (ii) $144,000 of increased supplies, and (iii) $90,000 of increased outside services.
Interest Expense
Interest Expense, net. Our interest expense, net for fiscal 2017 decreased $3,150,000, or 19.4%, to $13,094,000 from $16,244,000 for fiscal 2016. The decrease in interest expense in fiscal 2017 was due primarily to (i) the write-off of previous debt issuance costs of $5,108,000 in fiscal 2016 in connection with the financing agreement which was terminated when we entered into a new credit facility in June 2015 and (ii) lower interest rates and lower average outstanding balances on our loans. These decreases in interest expense were partially offset by higher interest rates and increased use of our accounts receivable discount programs during fiscal 2017.
Provision for Income Taxes
Income Tax. Our income tax expense was $17,305,000, an effective tax rate of 31.5%, and $11,479,000, an effective tax rate of 52.1% during fiscal 2017 and 2016, respectively. Our income tax rate for fiscal 2017 was positively impacted by (i) a non-taxable gain in connection with the fair value adjustments on the warrants compared to a non-deductible loss in fiscal 2016 and (ii) $748,000 of excess tax benefits recorded through the provision for income taxes in fiscal 2017 as a result of the early adoption of the FASB’s new guidance on share-based compensation. In addition, the income tax rates for all periods are increased by the inclusion of state income taxes and non-deductible executive compensation under Internal Revenue Code Section 162(m). These increases in all periods were partially offset by the benefit of lower statutory tax rates in foreign taxing jurisdictions.
Liquidity and Capital Resources
Overview
We had negative working capital (current assets minus current liabilities) of $46,267,000 and $20,651,000, a ratio of current assets to current liabilities of 0.74:1.00 and 0.86:1.00, at March 31, 2018 and 2017, respectively. The long-term classification of our core inventory, the build-up of our inventory to support anticipated higher sales, new business with existing and potential new customers, and the addition of any new product lines have in the past, and will continue to require the use of working capital to grow our business.
We generated cash during fiscal 2018 from the use of receivable discount programs with certain of our major customers and their respective banks, as well as from our credit facility. The cash generated from these activities was used primarily to build our inventory to support anticipated higher sales.
In May 2018, we entered into the New Credit Facility consisting of a $200,000,000 revolving loan facility and a $30,000,000 term loan facility, maturing in June 2023.
We believe our cash and cash equivalents, short-term investments, use of receivable discount programs, amounts available under our credit facility, and other sources are sufficient to satisfy our expected future working capital needs, repayment of the current portion of our term loans, and lease and capital expenditure obligations over the next 12 months.
Cash Flows
The following summarizes cash flows as reflected in the consolidated statements of cash flows:
|
Fiscal Years Ended March 31,
|
||||||||||||
|
2018
|
2017
|
2016
|
||||||||||
|
Cash provided by (used in):
|
||||||||||||
|
Operating activities
|
$
|
(13,944,000
|
)
|
$
|
(5,269,000
|
)
|
$
|
15,334,000
|
||||
|
Investing activities
|
(15,278,000
|
)
|
(5,683,000
|
)
|
(7,582,000
|
)
|
||||||
|
Financing activities
|
33,142,000
|
(1,849,000
|
)
|
(46,982,000
|
)
|
|||||||
|
Effect of exchange rates on cash and cash equivalents
|
100,000
|
(67,000
|
)
|
(103,000
|
)
|
|||||||
|
Net increase (decrease) in cash and cash equivalents
|
4,020,000
|
(12,868,000
|
)
|
(39,333,000
|
)
|
|||||||
|
Additional selected cash flow data:
|
||||||||||||
|
Depreciation and amortization
|
$
|
4,508,000
|
$
|
3,714,000
|
$
|
2,936,000
|
||||||
|
Capital expenditures
|
9,933,000
|
4,929,000
|
3,747,000
|
|||||||||
Fiscal 2018 Compared to Fiscal 2017
Net cash used in operating activities was $13,944,000 and $5,269,000 during fiscal 2018 and 2017, respectively. The significant changes in our operating activities during fiscal 2018 as compared to fiscal 2017 were due primarily to (i) decreased operating results (net income plus net add-back for non-cash transactions in earnings), (ii) increased payments of income taxes, (iii) decreases in accounts receivable and accounts payable during fiscal 2018 compared to increases during fiscal 2017, (iv) the build-up of our inventory to support anticipated higher sales, and (v) increased core purchases, including accrued core payments of $13,816,000 during fiscal 2018.
Net cash used in investing activities was $15,278,000 and $5,683,000 during fiscal 2018 and 2017, respectively. This change was due primarily to our increased capital expenditures and acquisition-related activities.
Net cash provided by financing activities was $33,142,000 during fiscal 2018 compared to net cash used in financing activities of $1,849,000 during fiscal 2017. This change was due mainly to (i) increased net borrowing primarily to build our inventory to support anticipated higher sales, (ii) repurchases of our common stock under our share repurchase program, and (iii) cash received upon exercise of the supplier warrant during fiscal 2018.
Fiscal 2017 Compared to Fiscal 2016
Net cash used in operating activities was $5,269,000 during fiscal 2017 compared to net cash provided by operating activities of $15,334,000 during fiscal 2016. The significant decreases in our operating activities were due primarily to (i) an increase in accounts receivable during fiscal 2017 compared to a decrease during fiscal 2016, (ii) payments made in connection with new business, (iii) a decrease in customer finished goods returns accrual during fiscal 2017 compared to an increase during fiscal 2016, and (iv) increased inventory levels to support our future growth. These decreases were partially offset by (i) increased operating results (net income plus net add-back for non-cash transactions in earnings) and (ii) decreased net repayments for Remanufactured Core inventory purchases recorded as accrued core payment in the consolidated balance sheets.
Net cash used in investing activities was $5,683,000 and $7,582,000 during fiscal 2017 and 2016, respectively. This change was due primarily to a decrease in cash used for the acquisition related activities during fiscal 2017 as compared to fiscal 2016.
Net cash used in financing activities was $1,849,000 and $46,982,000 during fiscal 2017 and 2016, respectively. This change was due mainly to (i) the net repayment of our long-term debt in fiscal 2016 in connection with the financing agreement which was terminated when we entered into a new credit facility in June 2015, (ii) the payment of debt issuance costs associated with this new credit facility, (iii) fewer stock options exercised during fiscal 2017 as compared to fiscal 2016, and (iv) the repurchase of shares under our share repurchase program during fiscal 2017.
Capital Resources
Debt
We are party to the following credit agreements.
Credit Facility
We are party to a $145,000,000 senior secured financing, as amended, (the “Credit Facility”) with the lenders party thereto, and PNC Bank, National Association, as administrative agent, consisting of (i) a $120,000,000 revolving loan facility, subject to borrowing base restrictions and a $15,000,000 sublimit for letters of credit (the “Revolving Facility”) and (ii) a $25,000,000 term loan facility (the “Term Loans”). The loans under the Credit Facility mature on June 3, 2020. In connection with the Credit Facility, the lenders were granted a security interest in substantially all of our assets. The Credit Facility permits the payment of up to $10,000,000 of dividends per calendar year, subject to a minimum availability threshold and pro forma compliance with financial covenants. This amount was increased to $15,000,000 under the April 2017 amendment to the Credit Facility.
In April 2017, we entered into a consent and fourth amendment to the Credit Facility (the “Fourth Amendment”) which, among other things, (i) increased the borrowing base limit with respect to inventory located in Mexico, (ii) amended the definition and calculation of consolidated EBITDA to raise the limitation on the add-back for non-capitalized transaction expenses related to the expansion of operations in Mexico, (iii) increased the annual limit on permitted stock repurchases and dividends, and (iv) modified certain other categories (including increasing certain baskets for permitted acquisitions) and thresholds to, among other things, further accommodate the expansion of our operations in Mexico.
In July 2017, we entered into a fifth amendment to the Credit Facility (the “Fifth Amendment”) which, among other things, amended the definition of permitted acquisitions, permitted indebtedness, and pledge agreements.
The Term Loans require quarterly principal payments of $781,250. The Credit Facility bears interest at rates equal to either LIBOR plus a margin of 2.50%, 2.75% or 3.00% or a reference rate plus a margin of 1.50%, 1.75% or 2.00%, in each case depending on the senior leverage ratio as of the applicable measurement date. There is also a facility fee of 0.25% to 0.375%, depending on the senior leverage ratio as of the applicable measurement date. The interest rate on our Term Loans and Revolving Facility was 4.42% and 4.52%, respectively, at March 31, 2018 and 3.29% and 3.55%, respectively, at March 31, 2017.
The Credit Facility, among other things, requires us to maintain certain financial covenants including a maximum senior leverage ratio and a minimum fixed charge coverage ratio. We were in compliance with all financial covenants as of March 31, 2018.
The following summarizes the financial covenants required under the Credit Facility:
|
Calculation as of
March 31, 2018
|
Financial covenants
required per the Credit
Facility
|
|||||||
|
Maximum senior leverage ratio
|
0.89
|
2.50
|
||||||
|
Minimum fixed charge coverage ratio
|
1.34
|
1.15
|
||||||
In addition to other covenants, the Credit Facility places limits on our ability to incur liens, incur additional indebtedness, make loans and investments, engage in mergers and acquisitions, engage in asset sales, redeem or repurchase capital stock, alter the business conducted by us and our subsidiaries, transact with affiliates, prepay, redeem or purchase subordinated debt, and amend or otherwise alter debt agreements.
We had $54,000,000 and $11,000,000 outstanding under the Revolving Facility at March 31, 2018 and 2017, respectively. In addition, $260,000 was reserved for standby letters of credit for workers’ compensation insurance and $600,000 for commercial letters of credit at March 31, 2018. At March 31, 2018, $65,140,000, subject to certain adjustments, was available under the Revolving Facility.
WX Agreement
In August 2012, we entered into a Revolving Credit/Strategic Cooperation Agreement (the “WX Agreement”) with Wanxiang America Corporation (the “Supplier”) and the discontinued subsidiaries. In connection with the WX Agreement, we issued a warrant (the “Supplier Warrant”) to the Supplier to purchase up to 516,129 shares of our common stock for an exercise price of $7.75 per share exercisable at any time after August 22, 2014 and on or prior to September 30, 2017.
On September 8, 2017, the Supplier exercised the Supplier Warrant in full and paid us $4,000,000. As a result of the exercise, the Supplier Warrant is no longer outstanding. The fair value of the Supplier Warrant on the exercise date was $9,566,000 using level 3 inputs and the Monte Carlo simulation model. The following assumptions were used to calculate the fair value of the Supplier Warrant: dividend yield of 0%, expected volatility of 26.4%, risk-free interest rate of 0.96%, subsequent financing probability of 0%, and an expected life of 0.06 years. We recorded a non-cash reclassification of the Supplier Warrant’s fair value to shareholders’ equity on the exercise date, with no further adjustments to the fair value of the Supplier Warrant being required. The fair value of the Supplier Warrant was $11,879,000 at March 31, 2017 and was included in other liabilities in the consolidated balance sheet.
During the years ended March 31, 2018 and 2017, a gain of $2,313,000 and $3,764,000, respectively, was recorded in general and administrative expenses due to the change in the fair value of this warrant liability.
Receivable Discount Programs
We use receivable discount programs with certain customers and their respective banks. Under these programs, we have options to sell those customers’ receivables to those banks at a discount to be agreed upon at the time the receivables are sold. These discount arrangements allows us to accelerate receipt of payment on customers’ receivables. While these arrangements have reduced our working capital needs, there can be no assurance that these programs will continue in the future. Interest expense resulting from these programs would increase if interest rates rise, if utilization of these discounting arrangements expands, if customers extend their payment to us, or if the discount period is extended to reflect more favorable payment terms to customers.
The following is a summary of the receivable discount programs:
|
Years Ended March 31,
|
||||||||
|
2018
|
2017
|
|||||||
|
Receivables discounted
|
$
|
357,224,000
|
$
|
352,369,000
|
||||
|
Weighted average days
|
340
|
342
|
||||||
|
Weighted average discount rate
|
3.3
|
%
|
2.9
|
%
|
||||
|
Amount of discount as interest expense
|
$
|
11,182,000
|
$
|
9,724,000
|
||||
Off-Balance Sheet Arrangements
At March 31, 2018, we had no off-balance sheet financing or other arrangements with unconsolidated entities or financial partnerships (such as entities often referred to as structured finance or special purpose entities) established for purposes of facilitating off-balance sheet financing or other debt arrangements or for other contractually narrow or limited purposes.
Multi-year Customer Agreements
We have or are renegotiating long-term agreements with many of our major customers. Under these agreements, which in most cases have initial terms of at least four years, we are designated as the exclusive or primary supplier for specified categories of our products. Because of the very competitive nature of the market and the limited number of customers for these products, our customers have sought and obtained price concessions, significant marketing allowances and more favorable delivery and payment terms in consideration for our designation as a customer’s exclusive or primary supplier. These incentives differ from contract to contract and can include (i) the issuance of a specified amount of credits against receivables in accordance with a schedule set forth in the relevant contract, (ii) support for a particular customer’s research or marketing efforts provided on a scheduled basis, (iii) discounts granted in connection with each individual shipment of product, and (iv) other marketing, research, store expansion or product development support. These contracts typically require that we meet ongoing performance standards. Our contracts with major customers expire at various dates through April 2021.
While these longer-term agreements strengthen our customer relationships, the increased demand for our products often requires that we increase our inventories and personnel. Customer demands that we purchase their Remanufactured Core inventory also require the use of our working capital. The marketing and other allowances we typically grant our customers in connection with our new or expanded customer relationships adversely impact the near-term revenues, profitability and associated cash flows from these arrangements. However, we believe the investment we make in these new or expanded customer relationships will improve our overall liquidity and cash flow from operations over time.
Share Repurchase Program
On February 2, 2018, our board of directors increased our share repurchase program authorization from $15,000,000 to $20,000,000 of our common stock. As of March 31, 2018, $11,630,000 of the $20,000,000 had been utilized and $8,370,000 remained available to repurchase shares under the authorized share repurchase program, subject to the limit in our credit facility. We retired the 511,746 shares repurchased under this program through March 31, 2018. Our share repurchase program does not obligate us to acquire any specific number of shares and shares may be repurchased in privately negotiated and/or open market transactions.
Capital Expenditures and Commitments
Our total capital expenditures, including capital leases, were $13,411,000 and $5,731,000 for fiscal 2018 and 2017, respectively. These capital expenditures primarily include the purchase of equipment for our current operations and the expansion of our operations in Mexico. We expect to invest approximately $17,000,000 in fiscal 2019 to support our growth initiatives and continued expansion of our operations in Mexico. We have used and expect to continue using our working capital and additional capital lease obligations to finance these capital expenditures.
Contractual Obligations
The following summarizes our contractual obligations and other commitments as of March 31, 2018 and the effect such obligations could have on our cash flows in future periods:
|
Payments Due by Period
|
||||||||||||||||||||
|
Contractual Obligations
|
Total
|
Less than
1 year |
2 to 3
years |
4 to 5
years |
More than 5
years |
|||||||||||||||
|
Capital lease obligations (1)
|
$
|
5,598,000
|
$
|
1,627,000
|
$
|
2,519,000
|
$
|
1,452,000
|
-
|
|||||||||||
|
Operating lease obligations (2)
|
53,061,000
|
5,873,000
|
8,938,000
|
7,426,000
|
$
|
30,824,000
|
||||||||||||||
|
Revolving loan
|
54,000,000
|
54,000,000
|
-
|
-
|
-
|
|||||||||||||||
|
Term loan (3)
|
18,559,000
|
3,820,000
|
14,739,000
|
-
|
-
|
|||||||||||||||
|
Accrued core payment (4)
|
36,778,000
|
17,421,000
|
14,516,000
|
4,841,000
|
-
|
|||||||||||||||
|
Unrecognized tax benefits (5)
|
-
|
-
|
-
|
-
|
-
|
|||||||||||||||
|
Other long-term obligations (6)
|
69,176,000
|
30,154,000
|
38,909,000
|
113,000
|
-
|
|||||||||||||||
|
Total
|
$
|
237,172,000
|
$
|
112,895,000
|
$
|
79,621,000
|
$
|
13,832,000
|
$
|
30,824,000
|
||||||||||
| (1) |
Capital lease obligations represent amounts due under capital leases for various types of equipment.
|
| (2) |
Operating lease obligations represent amounts due for rent under our leases for all our facilities (including our new distribution center in Tijuana, Mexico), certain equipment, and our Company automobile.
|
| (3) |
Term loan obligations represent the amounts due for principal payments as well as interest payments to be made. Interest payments were calculated based upon the interest rate for our term loan using the LIBOR option at March 31, 2018, which was 4.42%.
|
| (4) |
Accrued core payment represents the amounts due for principal and interest payments to be made in connection with the purchases of Remanufactured Cores from our customers, which are held by these customers and remain on their premises.
|
| (5) |
We are unable to reliably estimate the timing of future payments related to uncertain tax position liabilities at March 31, 2018 in the amount of $1,219,000; therefore, this amount has been excluded from the table above. However, future tax payment accruals related to uncertain tax positions are included in our consolidated balance sheets, reduced by the associated federal deduction for state taxes.
|
| (6) |
Other long-term obligations represent commitments we have with certain customers to provide marketing allowances in consideration for long-term agreements to provide products over a defined period. We are not obligated to provide these marketing allowances should our business relationships end with these customers.
|
Our primary market risk relates to changes in interest rates, foreign currency exchange rates, and customer credit. We do not enter into derivatives or other financial instruments for trading or speculative purposes. As our overseas operations expand, our exposure to the risks associated with foreign currency fluctuations will continue to increase.
Interest rate risk
We are exposed to changes in interest rates primarily as a result of our borrowing and receivable discount programs, which have interest costs that vary with interest rate movements. Our credit facility bears interest at variable base rates, plus an applicable margin. At March 31, 2018, our net debt obligations totaled $70,981,000. If interest rates were to increase 1%, our net annual interest expense would have increased by approximately $710,000. In addition, for each $10,000,000 of accounts receivable we discount over a period of 180 days, a 1% increase in interest rates would increase our interest expense by $50,000.
Foreign currency risk
We are exposed to foreign currency exchange risk inherent in our anticipated purchases and expenses denominated in currencies other than the U.S. dollar. We transact business in the following foreign currencies; Mexican pesos, Malaysian ringit, Singapore dollar, Chinese yuan, and the Canadian dollar. Our primary currency risks result from fluctuations in the value of the Mexican peso and to a lesser extent the Chinese yuan. To mitigate these risks, we enter into forward foreign currency exchange contracts to exchange U.S. dollars for these foreign currencies. The extent to which we use forward foreign currency exchange contracts is periodically reviewed in light of our estimate of market conditions and the terms and length of anticipated requirements. The use of derivative financial instruments allows us to reduce our exposure to the risk that the eventual net cash outflow resulting from funding the expenses of the foreign operations will be materially affected by changes in exchange rates. These contracts generally expire in a year or less. Any changes in the fair values of our forward foreign currency exchange contracts are reflected in current period earnings. Based upon our forward foreign currency exchange contracts related to these currencies, an increase of 10% in exchange rates at March 31, 2018 would have increased our general and administrative expenses by approximately $2,953,000. During fiscal 2018 and 2017, a gain of $752,000 and $843,000, respectively, were recorded in general and administrative expenses due to the change in the value of the forward foreign currency exchange contracts subsequent to entering into the contracts.
Credit Risk
We regularly review our accounts receivable and allowance for doubtful accounts by considering factors such as historical experience, credit quality and age of the accounts receivable, and the current economic conditions that may affect a customer’s ability to pay such amounts owed to us. We maintain an allowance for doubtful accounts that, in our opinion, provides for an adequate reserve to cover losses that may be incurred.
The information required by this item is set forth in the consolidated financial statements, commencing on page F-1 included herein.
None.
Evaluation of Disclosure Controls and Procedures
We have established disclosure controls and procedures to ensure that the information required to be disclosed by the Company in the reports that it files or submits under the Securities Exchange Act of 1934 is recorded, processed, summarized and reported within the time periods specified in the SEC rules and forms and that such information is accumulated and made known to the officers who certify the Company’s financial reports and to other members of senior management and the board of directors as appropriate to allow timely decisions regarding required disclosures.
Under the supervision and with the participation of management, including our chief executive officer, chief financial officer, and chief accounting officer, we have conducted an evaluation of the effectiveness of our disclosure controls and procedures as defined in Exchange Act Rules 13a-15(b) and 15d-15(e). Based on this evaluation, our chief executive officer, chief financial officer, and chief accounting officer concluded that MPA’s disclosure controls and procedures were effective as of March 31, 2018.
Management’s Report on Internal Control Over Financial Reporting
The Company’s management is responsible for establishing and maintaining adequate internal control over financial reporting as defined in Exchange Act Rules 13a-15(f) and 15d-15(f).
Internal control over financial reporting is a process designed to provide reasonable assurance regarding the reliability of financial reporting and the preparation of financial statements for external purposes in accordance with accounting principles generally accepted in the United State of America, applying certain estimates and judgments as required.
Internal control over financial reporting includes those policies and procedures that:
| 1. |
Pertain to the maintenance of records that, in reasonable detail, accurately and fairly reflect the transactions and dispositions of the assets of the company;
|
| 2. |
Provide reasonable assurance that transactions are recorded as necessary to permit preparation of financial statements in accordance with generally accepted accounting principles, and that receipts and expenditures of the company are being made only in accordance with authorizations of management and directors of the company; and
|
| 3. |
Provide reasonable assurance regarding prevention or timely detection of unauthorized acquisition, use, or disposition of the company’s assets that could have a material effect on the financial statements.
|
Because of its inherent limitations, internal control over financial reporting may not prevent or detect misstatements. Also, projections of any evaluation of effectiveness to future periods are subject to the risk that controls may become inadequate because of changes in conditions, or that the degree of compliance with the policies or procedures may deteriorate.
Under the supervision and with the participation of management, including our chief executive officer, chief financial officer, and chief accounting officer, we conducted an evaluation of the effectiveness of our internal control over financial reporting based on the criteria established in the 2013 Internal Control — Integrated Framework issued by the Committee of Sponsoring Organizations of the Treadway Commission. Based on this evaluation, management concluded that the Company’s internal control over financial reporting was effective as of March 31, 2018.
The effectiveness of our internal control over financial reporting as of March 31, 2018 has been audited by the Company’s independent registered public accounting firm, Ernst & Young LLP. Their assessment is included in the accompanying Report of Independent Registered Public Accounting Firm on Internal Control over Financial Reporting.
Changes in Internal Control Over Financial Reporting
There were no changes in MPA’s internal control over financial reporting during the fourth quarter ended March 31, 2018 that have materially affected, or are reasonably likely to materially affect, MPA’s internal control over financial reporting.
None.
PART III
The information required by this item is incorporated by reference to our Definitive Proxy Statement in connection with our next Annual Meeting of Stockholders (the “Proxy Statement”).
The information required by this item is incorporated by reference to the Proxy Statement.
| Item 12. |
The information required by this item is incorporated by reference to the Proxy Statement.
The information required by this item is incorporated by reference to the Proxy Statement.
The information required by this item is incorporated by reference to the Proxy Statement.
PART IV
| a. |
Documents filed as part of this report:
|
| (1) |
Index to Consolidated Financial Statements:
|
|
Reports of Independent Registered Public Accounting Firm
|
54
|
|
Consolidated Balance Sheets
|
F-1
|
|
Consolidated Statements of Income
|
F-2
|
|
Consolidated Statements of Comprehensive Income
|
F-3
|
|
Consolidated Statements of Shareholders’ Equity
|
F-4
|
|
Consolidated Statements of Cash Flows
|
F-5
|
|
Notes to Consolidated Financial Statements
|
F-6
|
|
(2)
|
Schedules:
|
|
Schedule II — Valuation and Qualifying Accounts
|
S-1
|
| (3) |
Exhibits:
|
|
Number
|
Description of Exhibit
|
Method of Filing
|
||
|
3.1
|
Certificate of Incorporation of the Company
|
Incorporated by reference to Exhibit 3.1 to the Company’s Registration Statement on Form SB-2 declared effective on March 22, 1994 (the “1994 Registration Statement”).
|
||
|
3.2
|
Amendment to Certificate of Incorporation of the Company
|
Incorporated by reference to Exhibit 3.2 to the Company’s Registration Statement on Form S-1 (No. 33-97498) declared effective on November 14, 1995 (the “1995 Registration Statement”).
|
||
|
Amendment to Certificate of Incorporation of the Company
|
Incorporated by reference to Exhibit 3.3 to the Company’s Annual Report on Form 10-K for the fiscal year ended March 31, 1997.
|
|||
|
Amendment to Certificate of Incorporation of the Company
|
Incorporated by reference to Exhibit 3.4 to the Company’s Annual Report on Form 10-K for the fiscal year ended March 31, 1998 (the “1998 Form 10-K”).
|
|||
|
Amendment to Certificate of Incorporation of the Company
|
Incorporated by reference to Exhibit C to the Company’s proxy statement on Schedule 14A filed with the SEC on November 25, 2003.
|
|||
|
Amended and Restated By-Laws of the Company
|
Incorporated by reference to Exhibit 3.1 to Current Report on Form 8-K filed on August 24, 2010.
|
|||
|
Certificate of Amendment of the Certificate of Incorporation of the Company
|
Incorporated by reference to Exhibit 3.1 to Current Report on Form 8-K filed on April 17, 2014.
|
|||
|
Amendment to the Amended and Restated By-Laws of the Company
|
Incorporated by reference to Exhibit 3.1 to Current Report on Form 8-K filed on June 14, 2016.
|
|
Number
|
Description of Exhibit
|
Method of Filing
|
||
|
Amendment to the Amended and Restated By-Laws of the Company
|
Incorporated by reference to Exhibit 3.1 to Current Report on Form 8-K filed on February 22, 2017.
|
|||
|
2004 Non-Employee Director Stock Option Plan
|
Incorporated by reference to Appendix A to the Proxy Statement on Schedule 14A for the 2004 Annual Shareholders Meeting.
|
|||
|
2010 Incentive Award Plan
|
Incorporated by reference to Appendix A to the Proxy Statement on Schedule 14A filed on December 15, 2010.
|
|||
|
Amended and Restated 2010 Incentive Award Plan
|
Incorporated by reference to Appendix A to the Proxy Statement on Schedule 14A filed on March 5, 2013.
|
|||
|
Second Amended and Restated 2010 Incentive Award Plan
|
Incorporated by reference to Appendix A to the Proxy Statement on Schedule 14A filed on March 3, 2014.
|
|||
|
2014 Non-Employee Director Incentive Award Plan
|
Incorporated by reference to Appendix B to the Proxy Statement on Schedule 14A filed on March 3, 2014.
|
|||
|
Third Amended and Restated 2010 Incentive Award Plan
|
Incorporated by reference to Appendix A to the Proxy Statement on Schedule 14A filed on November 20, 2017.
|
|||
|
10.1
|
Amendment to Lease, dated October 3, 1996, by and between the Company and Golkar Enterprises, Ltd. relating to additional property in Torrance, California
|
Incorporated by reference to Exhibit 10.17 to the December 31, 1996 Form 10-Q.
|
||
|
10.2
|
Lease Agreement, dated September 19, 1995, by and between Golkar Enterprises, Ltd. and the Company relating to the Company’s facility located in Torrance, California
|
Incorporated by reference to Exhibit 10.18 to the 1995 Registration Statement.
|
||
|
Form of Indemnification Agreement for officers and directors
|
Incorporated by reference to Exhibit 10.25 to the 1997 Registration Statement.
|
|||
|
Second Amendment to Lease, dated March 15, 2002, between Golkar Enterprises, Ltd. and the Company relating to property in Torrance, California
|
Incorporated by reference to Exhibit 10.44 to the 2003 10-K.
|
|||
|
Addendum to Vendor Agreement, dated May 8, 2004, between AutoZone Parts, Inc. and the Company
|
Incorporated by reference to Exhibit 10.15 to the 2004 10-K.
|
|||
|
Form of Orbian Discount Agreement between the Company and Orbian Corp.
|
Incorporated by reference to Exhibit 10.17 to the 2004 10-K.
|
|
Number
|
Description of Exhibit
|
Method of Filing
|
||
|
Form of Standard Industrial/Commercial Multi-Tenant Lease, dated May 25, 2004, between the Company and Golkar Enterprises, Ltd for property located at 530 Maple Avenue, Torrance, California
|
Incorporated by reference to Exhibit 10.18 to the 2004 10-K.
|
|||
|
Build to Suit Lease Agreement, dated October 28, 2004, among Motorcar Parts de Mexico, S.A. de CV, the Company and Beatrix Flourie Geoffroy
|
Incorporated by reference to Exhibit 99.1 to Current Report on Form 8-K filed on November 2, 2004.
|
|||
|
Amendment No. 3 to Pay-On-Scan Addendum, dated August 22, 2006, between AutoZone Parts, Inc. and the Company
|
Incorporated by reference to Exhibit 99.1 to Current Report on Form 8-K filed on August 30, 2006.
|
|||
|
Amendment No. 1 to Vendor Agreement, dated August 22, 2006, between AutoZone Parts, Inc. and Motorcar Parts of America, Inc.
|
Incorporated by reference to Exhibit 99.2 to Current Report on Form 8-K filed on August 30, 2006.
|
|||
|
Lease Agreement Amendment, dated October 12, 2006, between the Company and Beatrix Flourie Geoffroy
|
Incorporated by reference to Exhibit 99.1 to Current Report on Form 8-K filed on October 20, 2006.
|
|||
|
Third Amendment to Lease Agreement, dated as of November 20, 2006, between Motorcar Parts of America, Inc. and Golkar Enterprises, Ltd.
|
Incorporated by reference to Exhibit 99.1 to Current Report on Form 8-K filed on November 27, 2006.
|
|||
|
Amended and Restated Employment Agreement, dated as of December 31, 2008, by and between the Company and Selwyn Joffe
|
Incorporated by reference to Exhibit 10.1 to Current Report on Form 8-K filed January 7, 2009.
|
|||
|
Vendor Agreement dated as of March 31, 2009, between the Company and AutoZone Parts, Inc.
|
Incorporated by reference to Exhibit 10.1 to Current Report on Form 8-K filed May 5, 2009.
|
|||
|
Core Amendment to Vendor Agreement, dated as of March 31, 2009, between the Company and AutoZone Parts, Inc.
|
Incorporated by reference to Exhibit 10.2 to Current Report on Form 8-K filed May 5, 2009.
|
|||
|
Vendor Agreement Addendum, dated as of March 31, 2009, between the Company and AutoZone Parts, Inc.
|
Incorporated by reference to Exhibit 10.1 to Current Report on Form 8-K/A filed on December 23, 2009.
|
|||
|
Core Amendment to Vendor Agreement Addendum, dated as of March 31, 2009, between the Company and AutoZone Parts, Inc.
|
Incorporated by reference to Exhibit 10.2 to Current Report on Form 8-K/A filed on December 23, 2009.
|
|||
|
Master Vendor Agreement, dated as of April 1, 2009, between the Company and O’Reilly Automotive, Inc.
|
Incorporated by reference to Exhibit 10.1 to Current Report on Form 8-K filed on January 13, 2010.
|
|
Number
|
Description of Exhibit
|
Method of Filing
|
||
|
Letter Agreement, dated as of April 1, 2009, between the Company and O’Reilly Automotive, Inc.
|
Incorporated by reference to Exhibit 10.2 to Current Report on Form 8-K filed on January 13, 2010.
|
|||
|
Vendor Agreement Addendum, dated as of April 1, 2009 between the Company and O’Reilly Automotive, Inc.
|
Incorporated by reference to Exhibit 10.3 to Current Report on Form 8-K filed on January 13, 2010.
|
|||
|
Core Amendment No. 3 to Vendor Agreement, dated as of May 31, 2011, by and between Motorcar Parts of America, Inc. and AutoZone Parts, Inc.
|
Incorporated by reference to Exhibit 10.1 to Current Report on Form 8-K filed on June 16, 2011.
|
|||
|
Core Amendment No. 4 to Vendor Agreement, dated as of May 31, 2011, by and between Motorcar Parts of America, Inc. and AutoZone Parts, Inc.
|
Incorporated by reference to Exhibit 10.2 to Current Report on Form 8-K filed on June 16, 2011.
|
|||
|
Addendum No. 2 to Amendment No. 1 to Vendor Agreement, dated as of May 31, 2011, by and between Motorcar Parts of America, Inc. and AutoZone Parts, Inc.
|
Incorporated by reference to Exhibit 10.3 to Current Report on Form 8-K filed on June 16, 2011.
|
|||
|
Fifth Amendment, dated as of November 17, 2011, to that certain Standard Industrial Commercial Single Tenant Lease-Gross, dated as of September 19, 1995, between Golkar Enterprises, Ltd and Motorcar Parts of America, Inc., as amended
|
Incorporated by reference to Exhibit 10.1 to Current Report on Form 8-K filed on November 25, 2011.
|
|||
|
Right of First Refusal Agreement, dated May 3, 2012
|
Incorporated by reference to Exhibit 10.1 to Current Report on Form 8-K filed on May 7, 2012.
|
|||
|
Employment Agreement, dated as of May 18, 2012, between Motorcar Parts of America, Inc., and Selwyn Joffe
|
Incorporated by reference to Exhibit 10.1 to Current Report on Form 8-K filed on May 24, 2012.
|
|||
|
Revolving Credit/Strategic Cooperation Agreement, dated as of August 22, 2012, by and among Motorcar Parts of America, Inc. (solely for purposes of provisions specified thereto), Fenwick Automotive Products Limited and Wanxiang America Corporation
|
Incorporated by reference to Exhibit 10.1 to Current Report on Form 8-K filed on August 28, 2012.
|
|||
|
Guaranty, dated as of August 22, 2012, by Motorcar Parts of America, Inc. for the benefit of Wanxiang America Corporation
|
Incorporated by reference to Exhibit 10.2 to Current Report on Form 8-K filed on August 28, 2012.
|
|||
|
Warrant to Purchase Common Stock, dated as of August 22, 2012, issued by Motorcar Parts of America, Inc. to Wanxiang America Corporation
|
Incorporated by reference to Exhibit 10.3 to Current Report on Form 8-K filed on August 28, 2012.
|
|
Number
|
Description of Exhibit
|
Method of Filing
|
||
|
Form of Stock Option Notice for use in connection with stock options granted to Selwyn Joffe pursuant to the Motorcar Parts of America, Inc. 2010 Incentive Award Plan
|
Incorporated by reference to Exhibit 10.1 to Current Report on Form 8-K filed on August 12, 2013.
|
|||
|
Form of Stock Option Agreement for use in connection with stock options granted to Selwyn Joffe pursuant to the Motorcar Parts of America, Inc. 2010 Incentive Award Plan
|
Incorporated by reference to Exhibit 10.2 to Current Report on Form 8-K filed on August 12, 2013.
|
|||
|
Amended and Restated Financing Agreement, dated as of November 6, 2013, among Motorcar Parts of America, Inc., each lender from time to time party thereto, Cerberus Business Finance, LLC, as collateral agent, and PNC Bank, National Association, as administrative agent
|
Incorporated by reference to Exhibit 10.1 to Amended Quarterly Report on Form 10-Q/A filed on February 10, 2014.
|
|||
|
Third Amendment to Amended and Restated Financing Agreement, dated as of December 11, 2014, among Motorcar Parts of America, Inc., each lender from time to time party thereto, Cerberus Business Finance, LLC, as collateral agent, and PNC Bank, National Association, as administrative agent
|
Incorporated by reference to Exhibit 10.1 to the Current Report on Form 8-K filed on December 12, 2014.
|
|||
|
Fourth Amendment to Amended and Restated Financing Agreement, dated as of April 30, 2015, among Motorcar Parts of America, Inc., each lender from time to time party thereto, Cerberus Business Finance, LLC, as collateral agent, and PNC Bank, National Association, as administrative agent
|
Incorporated by reference to Exhibit 10.1 to the Current Report on Form 8-K filed on May 1, 2015.
|
|||
|
Revolving Credit, Term Loan and Security Agreement, dated as of June 3, 2015, among Motorcar Parts of America, Inc., each lender from time to time party thereto, and PNC Bank, National Association, as administrative agent
|
Incorporated by reference to Exhibit 10.1 to the Current Report on Form 8-K filed on June 8, 2015.
|
|||
|
First Amendment to Revolving Credit, Term Loan and Security Agreement, dated as of November 5, 2015, among Motorcar Parts of America, Inc., each lender from time to time party thereto, and PNC Bank, National Association, as administrative agent
|
Incorporated by reference to Exhibit 10.2 to the Quarterly Report on Form 10-Q filed on November 9, 2015.
|
|
Number
|
Description of Exhibit
|
Method of Filing
|
||
|
Consent and Second Amendment to Revolving Credit, Term Loan and Security Agreement, dated as of May 19, 2016, among Motorcar Parts of America, Inc., each lender from time to time party thereto, and PNC Bank, National Association, as administrative agent
|
Incorporated by reference to Exhibit 10.1 to Quarterly Report on Form 10-Q filed on August 9, 2016.
|
|||
|
Third Amendment to Revolving Credit, Term Loan and Security Agreement, dated as of March 24, 2017, among Motorcar Parts of America, Inc., each lender from time to time party thereto, and PNC Bank, National Association, as administrative agent
|
Incorporated by reference to Exhibit 10.38 to Annual Report on Form 10-K filed on June 14, 2017.
|
|||
|
Fourth Amendment to Revolving Credit, Term Loan and Security Agreement, dated as of April 24, 2017, among Motorcar Parts of America, Inc., each lender from time to time party thereto and PNC Bank, National Association, as administrative agent
|
Incorporated by reference to Exhibit 10.1 to Current Report on Form 8-K filed on April 27, 2017.
|
|||
|
Fifth Amendment to Revolving Credit, Term Loan and Security Agreement, dated as of July 18, 2017, among Motorcar Parts of America, Inc., each lender from time to time party thereto and PNC Bank, National Association, as administrative agent
|
Incorporated by reference to Exhibit 10.1 to Current Report on Form 8-K filed on July 24, 2017.
|
|||
|
Amended and Restated Credit Facility, dated as of June 5, 2018, among Motorcar Parts of America, Inc., each lender from time to time party thereto and PNC Bank, National Association, as administrative agent
|
Incorporated by reference to Exhibit 10.1 to Current Report on Form 8-K filed on June 11, 2018.
|
|||
|
Motorcar Parts of America, Inc., Code of Business Conduct and Ethics, as amended, effective January 15, 2015
|
Incorporated by reference to Exhibit 14.1 to Current Report on Form 8-K filed on January 20, 2015.
|
|||
|
List of Subsidiaries
|
Filed herewith.
|
|||
|
Consent of Independent Registered Public Accounting Firm Ernst & Young LLP
|
Filed herewith.
|
|||
|
Certification of Chief Executive Officer pursuant to Section 302 of the Sarbanes Oxley Act of 2002
|
Filed herewith.
|
|||
|
Certification of Chief Financial Officer pursuant to Section 302 of the Sarbanes Oxley Act of 2002
|
Filed herewith.
|
|
Number
|
Description of Exhibit
|
Method of Filing
|
||
|
Certification of Chief Accounting Officer pursuant to Section 302 of the Sarbanes Oxley Act of 2002
|
Filed herewith.
|
|||
|
Certifications of Chief Executive Officer, Chief Financial Officer and Chief Accounting Officer pursuant to Section 906 of the Sarbanes Oxley Act of 2002
|
Filed herewith.
|
|||
|
101.INS
|
XBRL Instance Document
|
Filed herewith.
|
||
|
101.SCM
|
XBRL Taxonomy Extension Schema Document
|
Filed herewith.
|
||
|
101.CAL
|
XBRL Taxonomy Extension Calculation Linkbase Document
|
Filed herewith.
|
||
|
101.DEF
|
XBRL Taxonomy Extension Definition Linkbase Document
|
Filed herewith.
|
||
|
101.LAB
|
XBRL Taxonomy Extension Label Linkbase Document
|
Filed herewith.
|
||
|
101.PRE
|
XBRL Taxonomy Extension Presentation Linkbase Document
|
Filed herewith.
|
|
*
|
Portions of this exhibit have been granted confidential treatment by the SEC.
|
|
**
|
Portions of this exhibit have been omitted pursuant to a confidential treatment request submitted separately to the SEC pursuant to Rule 24b-2 under the Securities Exchange Act of 1934, as amended.
|
The agreements and other documents filed as exhibits to this report are not intended to provide factual information or other disclosure other than with respect to the terms of the agreements or other documents themselves, and you should not rely on them for that purpose. In particular, any representations and warranties made by us in those agreements or other documents were made solely within the specific context of the relevant agreement or document and may not describe the actual state of affairs as of the date they were made or at any other time.
None.
Pursuant to the requirements of Section 15(d) of the Securities Exchange Act of 1934, the Registrant has duly caused this report to be signed on its behalf by the undersigned, thereunto duly authorized.
|
MOTORCAR PARTS OF AMERICA, INC.
|
||
|
Dated: June 14, 2018
|
By:
|
/s/ David Lee
|
|
David Lee
|
||
|
Chief Financial Officer
|
||
|
Dated: June 14, 2018
|
By:
|
/s/ Kevin Daly
|
|
Kevin Daly
|
||
|
Chief Accounting Officer
|
||
Pursuant to the requirements of the Securities Exchange Act of 1934, this Report on Form 10-K has been signed by the following persons on behalf of the Registrant in the capacities and on the dates indicated:
|
/s/ Selwyn Joffe
|
Chief Executive Officer and Director
|
June 14, 2018
|
|
Selwyn Joffe
|
(Principal Executive Officer) | |
|
/s/ David Lee
|
Chief Financial Officer
|
June 14, 2018
|
|
David Lee
|
(Principal Financial Officer)
|
|
|
/s/ Kevin Daly
|
Chief Accounting Officer
|
June 14, 2018
|
|
Kevin Daly
|
(Principal Accounting Officer)
|
|
|
/s/ Scott Adelson
|
Director
|
June 14, 2018
|
|
Scott Adelson
|
||
|
/s/ Rudolph Borneo
|
Director
|
June 14, 2018
|
|
Rudolph Borneo
|
||
|
/s/ Philip Gay
|
Director
|
June 14, 2018
|
|
Philip Gay
|
||
|
/s/ Duane Miller
|
Director
|
June 14, 2018
|
|
Duane Miller
|
||
|
/s/ Jeffrey Mirvis
|
Director
|
June 14, 2018
|
|
Jeffrey Mirvis
|
||
|
/s/ David Bryan
|
Director
|
June 14, 2018
|
|
David Bryan
|
||
|
/s/ Joseph Ferguson
|
Director
|
June 14, 2018
|
|
Joseph Ferguson
|
||
|
/s/ Barbara Whittaker
|
Director
|
June 14, 2018
|
|
Barbara Whittaker
|
||
|
/s/ Timothy Vargo
|
Director
|
June 14, 2018
|
|
Timothy Vargo
|
MOTORCAR PARTS OF AMERICA, INC.
AND SUBSIDIARIES
CONTENTS
|
Page
|
|
|
Reports of Independent Registered Public Accounting Firm
|
54
|
|
Consolidated Balance Sheets
|
F-1
|
|
Consolidated Statements of Income
|
F-2
|
|
Consolidated Statements of Comprehensive Income
|
F-3
|
|
Consolidated Statements of Shareholders’ Equity
|
F-4
|
|
Consolidated Statements of Cash Flows
|
F-5
|
|
Notes to Consolidated Financial Statements
|
F-6
|
|
Schedule II — Valuation and Qualifying Accounts
|
S-1
|
REPORT OF INDEPENDENT REGISTERED PUBLIC ACCOUNTING FIRM
To the Shareholders and the Board of Directors of Motorcar Parts of America, Inc.
Opinion on Internal Control over Financial Reporting
We have audited Motorcar Parts of America, Inc. and subsidiaries’ internal control over financial reporting as of March 31, 2018, based on criteria established in Internal Control-Integrated Framework issued by the Committee of Sponsoring Organizations of the Treadway Commission (2013 framework) (the COSO criteria). In our opinion, Motorcar Parts of America, Inc. and subsidiaries (the Company) maintained, in all material respects, effective internal control over financial reporting as of March 31, 2018, based on COSO criteria.
We also have audited, in accordance with the standards of the Public Company Accounting Oversight Board (United States) (PCAOB), the consolidated balance sheets of the Company as of March 31, 2018 and 2017, the related consolidated statements of income, comprehensive income, shareholders’ equity and cash flows for each of the three years in the period ended March 31, 2018, and the related notes and schedule and our report dated June 14, 2018 expressed an unqualified opinion thereon.
Basis for Opinion
The Company’s management is responsible for maintaining effective internal control over financial reporting and for its assessment of the effectiveness of internal control over financial reporting included in the accompanying Management’s Report on Internal Control Over Financial Reporting. Our responsibility is to express an opinion on the Company’s internal control over financial reporting based on our audit. We are a public accounting firm registered with the PCAOB and are required to be independent with respect to the Company in accordance with the U.S. federal securities laws and the applicable rules and regulations of the Securities and Exchange Commission and the PCAOB.
We conducted our audit in accordance with the standards of the PCAOB. Those standards require that we plan and perform the audit to obtain reasonable assurance about whether effective internal control over financial reporting was maintained in all material respects.
Our audit included obtaining an understanding of internal control over financial reporting, assessing the risk that a material weakness exists, testing and evaluating the design and operating effectiveness of internal control based on the assessed risk, and performing such other procedures as we considered necessary in the circumstances. We believe that our audit provides a reasonable basis for our opinion.
Definition and Limitation of Internal Control Over Financial Reporting
A company’s internal control over financial reporting is a process designed to provide reasonable assurance regarding the reliability of financial reporting and the preparation of financial statements for external purposes in accordance with generally accepted accounting principles. A company’s internal control over financial reporting includes those policies and procedures that (1) pertain to the maintenance of records that, in reasonable detail, accurately and fairly reflect the transactions and dispositions of the assets of the Company; (2) provide reasonable assurance that transactions are recorded as necessary to permit preparation of financial statements in accordance with generally accepted accounting principles, and that receipts and expenditures of the Company are being made only in accordance with authorizations of management and directors of the Company; and (3) provide reasonable assurance regarding prevention or timely detection of unauthorized acquisition, use, or disposition of the Company’s assets that could have a material effect on the financial statements.
Because of its inherent limitations, internal control over financial reporting may not prevent or detect misstatements. Also, projections of any evaluation of effectiveness to future periods are subject to the risk that controls may become inadequate because of changes in conditions, or that the degree of compliance with the policies or procedures may deteriorate.
|
/s/ Ernst & Young LLP
|
|
|
Los Angeles, California
|
|
|
June 14, 2018
|
REPORT OF INDEPENDENT REGISTERED PUBLIC ACCOUNTING FIRM
To the Shareholders and the Board of Directors of Motorcar Parts of America, Inc.
Opinion on the Financial Statements
We have audited the accompanying consolidated balance sheets of Motorcar Parts of America, Inc. and subsidiaries
(the Company) as of March 31, 2018 and 2017, and the related consolidated statements of income, comprehensive income, shareholders’ equity and cash flows for each of the three years in the period ended March 31, 2018, and the related notes and financial statement schedule listed in the index at Item 15(a)(2) (collectively referred to as the “consolidated financial statements”). In our opinion, the consolidated financial statements present fairly, in all material respects, the financial position of the Company at March 31, 2018 and 2017, and the results of its operations and its cash flows for each of the three years in the period ended March 31, 2018, in conformity with U.S. generally accepted accounting principles.
We also have audited, in accordance with the standards of the Public Accounting Oversight Board (United States) (PCAOB), the Company’s internal control over financial reporting as of March 31, 2018, based on criteria established in Internal Control-Integrated Framework issued by the Committee of Sponsoring Organizations of the Treadway Commission (2013 framework) and our report dated June 14, 2018 expressed an unqualified opinion thereon.
Basis for Opinion
These financial statements are the responsibility of the Company’s management. Our responsibility is to express an opinion on the Company’s financial statements based on our audits. We are a public accounting firm registered with the PCAOB and are required to be independent with respect to the Company in accordance with the U.S. federal securities laws and the applicable rules and regulations of the Securities and Exchange Commission and the PCAOB.
We conducted our audits in accordance with the standards of the PCAOB. Those standards require that we plan and perform the audit to obtain reasonable assurance about whether the financial statements are free of material misstatement, whether due to error or fraud. Our audits included performing procedures to assess the risks of material misstatement of the financial statements, whether due to error or fraud, and performing procedures that respond to those risks. Such procedures included examining, on a test basis, evidence regarding the amounts and disclosures in the financial statements. Our audits also included evaluating the accounting principles used and significant estimates made by management, as well as evaluating the overall presentation of the financial statements. We believe that our audits provide a reasonable basis for our opinion.
|
/s/ Ernst & Young LLP
|
|
|
We have served as the Company’s auditor since 2007
|
|
|
Los Angeles, California
|
|
|
June 14, 2018
|
MOTORCAR PARTS OF AMERICA, INC. AND SUBSIDIARIES
Consolidated Balance Sheets
March 31,
|
2018
|
2017
|
|||||||
|
ASSETS
|
||||||||
|
Current assets:
|
||||||||
|
Cash and cash equivalents
|
$
|
13,049,000
|
$
|
9,029,000
|
||||
|
Short-term investments
|
2,828,000
|
2,140,000
|
||||||
|
Accounts receivable — net
|
15,738,000
|
26,017,000
|
||||||
|
Inventory— net
|
76,275,000
|
67,516,000
|
||||||
|
Inventory unreturned
|
7,508,000
|
7,581,000
|
||||||
|
Income tax receivable
|
7,796,000
|
1,709,000
|
||||||
|
Prepaid expenses and other current assets
|
11,491,000
|
8,139,000
|
||||||
|
Total current assets
|
134,685,000
|
122,131,000
|
||||||
|
Plant and equipment — net
|
28,322,000
|
18,437,000
|
||||||
|
Long-term core inventory — net
|
301,656,000
|
262,922,000
|
||||||
|
Long-term core inventory deposits
|
5,569,000
|
5,569,000
|
||||||
|
Long-term deferred income taxes
|
10,556,000
|
13,546,000
|
||||||
|
Goodwill
|
2,551,000
|
2,551,000
|
||||||
|
Intangible assets — net
|
3,766,000
|
3,993,000
|
||||||
|
Other assets
|
7,392,000
|
6,990,000
|
||||||
|
TOTAL ASSETS
|
$
|
494,497,000
|
$
|
436,139,000
|
||||
|
LIABILITIES AND SHAREHOLDERS’ EQUITY
|
||||||||
|
Current liabilities:
|
||||||||
|
Accounts payable
|
$
|
73,273,000
|
$
|
85,960,000
|
||||
|
Accrued liabilities
|
11,799,000
|
10,077,000
|
||||||
|
Customer finished goods returns accrual
|
17,805,000
|
17,667,000
|
||||||
|
Accrued core payment
|
16,536,000
|
11,714,000
|
||||||
|
Revolving loan
|
54,000,000
|
11,000,000
|
||||||
|
Other current liabilities
|
4,471,000
|
3,300,000
|
||||||
|
Current portion of term loan
|
3,068,000
|
3,064,000
|
||||||
|
Total current liabilities
|
180,952,000
|
142,782,000
|
||||||
|
Term loan, less current portion
|
13,913,000
|
16,935,000
|
||||||
|
Long-term accrued core payment
|
18,473,000
|
12,349,000
|
||||||
|
Long-term deferred income taxes
|
226,000
|
180,000
|
||||||
|
Other liabilities
|
5,957,000
|
15,212,000
|
||||||
|
Total liabilities
|
219,521,000
|
187,458,000
|
||||||
|
Commitments and contingencies
|
||||||||
|
Shareholders’ equity:
|
||||||||
|
Preferred stock; par value $.01 per share, 5,000,000 shares authorized; none issued
|
-
|
-
|
||||||
|
Series A junior participating preferred stock; par value $.01 per share, 20,000 shares authorized; none issued
|
-
|
-
|
||||||
|
Common stock; par value $.01 per share, 50,000,000 shares authorized; 18,893,102 and 18,648,854 shares issued and outstanding at March 31, 2018 and 2017, respectively
|
189,000
|
186,000
|
||||||
|
Additional paid-in capital
|
213,609,000
|
205,646,000
|
||||||
|
Retained earnings
|
66,606,000
|
50,290,000
|
||||||
|
Accumulated other comprehensive loss
|
(5,428,000
|
)
|
(7,441,000
|
)
|
||||
|
Total shareholders’ equity
|
274,976,000
|
248,681,000
|
||||||
|
TOTAL LIABILITIES AND SHAREHOLDERS’ EQUITY
|
$
|
494,497,000
|
$
|
436,139,000
|
||||
The accompanying notes to consolidated financial statements are an integral part hereof.
MOTORCAR PARTS OF AMERICA, INC. AND SUBSIDIARIES
Consolidated Statements of Income
Years Ended March 31,
|
2018
|
2017
|
2016
|
||||||||||
|
Net sales
|
$
|
428,072,000
|
$
|
421,253,000
|
$
|
368,970,000
|
||||||
|
Cost of goods sold
|
322,199,000
|
306,207,000
|
268,046,000
|
|||||||||
|
Gross profit
|
105,873,000
|
115,046,000
|
100,924,000
|
|||||||||
|
Operating expenses:
|
||||||||||||
|
General and administrative
|
35,527,000
|
31,124,000
|
49,665,000
|
|||||||||
|
Sales and marketing
|
15,030,000
|
12,126,000
|
9,965,000
|
|||||||||
|
Research and development
|
5,692,000
|
3,824,000
|
3,008,000
|
|||||||||
|
Total operating expenses
|
56,249,000
|
47,074,000
|
62,638,000
|
|||||||||
|
Operating income
|
49,624,000
|
67,972,000
|
38,286,000
|
|||||||||
|
Interest expense, net
|
15,445,000
|
13,094,000
|
16,244,000
|
|||||||||
|
Income before income tax expense
|
34,179,000
|
54,878,000
|
22,042,000
|
|||||||||
|
Income tax expense
|
17,863,000
|
17,305,000
|
11,479,000
|
|||||||||
|
Net income
|
$
|
16,316,000
|
$
|
37,573,000
|
$
|
10,563,000
|
||||||
|
Basic net income per share
|
$
|
0.87
|
$
|
2.02
|
$
|
0.58
|
||||||
|
Diluted net income per share
|
$
|
0.84
|
$
|
1.93
|
$
|
0.55
|
||||||
|
Weighted average number of shares outstanding:
|
||||||||||||
|
Basic
|
18,854,993
|
18,608,812
|
18,233,163
|
|||||||||
|
Diluted
|
19,514,775
|
19,418,706
|
19,066,093
|
|||||||||
The accompanying notes to consolidated financial statements are an integral part hereof.
MOTORCAR PARTS OF AMERICA, INC. AND SUBSIDIARIES
Consolidated Statements of Comprehensive Income
Years Ended March 31,
|
2018
|
2017
|
2016
|
||||||||||
|
Net income
|
$
|
16,316,000
|
$
|
37,573,000
|
$
|
10,563,000
|
||||||
|
Other comprehensive income (loss), net of tax:
|
||||||||||||
|
Unrealized gain (loss) on short-term investments (net of tax of $118,000, $111,000, and $(8,000), respectively)
|
218,000
|
196,000
|
(13,000
|
)
|
||||||||
|
Foreign currency translation gain (loss)
|
1,795,000
|
(2,785,000
|
)
|
(2,321,000
|
)
|
|||||||
|
Total other comprehensive income (loss), net of tax
|
2,013,000
|
(2,589,000
|
)
|
(2,334,000
|
)
|
|||||||
|
Comprehensive income
|
$
|
18,329,000
|
$
|
34,984,000
|
$
|
8,229,000
|
||||||
The accompanying notes to consolidated financial statements are an integral part hereof.
MOTORCAR PARTS OF AMERICA, INC. AND SUBSIDIARIES
Consolidated Statements of Shareholders’ Equity
For the Years Ended March 31,
|
Common Stock
|
||||||||||||||||||||||||
|
Shares
|
Amount
|
Additional
Paid-in
Capital
Common
Stock
|
Retained
Earnings
(Accumulated
Deficit)
|
Accumulated
Other
Comprehensive
Income (Loss)
|
Total
|
|||||||||||||||||||
|
Balance at March 31, 2015
|
17,974,598
|
$
|
180,000
|
$
|
191,279,000
|
$
|
1,262,000
|
$
|
(2,518,000
|
)
|
$
|
190,203,000
|
||||||||||||
|
Compensation recognized under employee stock plans
|
-
|
-
|
2,584,000
|
-
|
-
|
2,584,000
|
||||||||||||||||||
|
Exercise of stock options
|
510,637
|
5,000
|
5,387,000
|
-
|
-
|
5,392,000
|
||||||||||||||||||
|
Issuance of common stock upon vesting of RSUs, net of shares withheld for employee taxes
|
46,516
|
-
|
(913,000
|
)
|
-
|
-
|
(913,000
|
)
|
||||||||||||||||
|
Tax benefit from employee stock options exercised
|
-
|
-
|
5,313,000
|
-
|
-
|
5,313,000
|
||||||||||||||||||
|
Unrealized gain (loss) on investments, net of tax
|
-
|
-
|
-
|
-
|
(13,000
|
)
|
(13,000
|
)
|
||||||||||||||||
|
Foreign currency translation
|
-
|
-
|
-
|
-
|
(2,321,000
|
)
|
(2,321,000
|
)
|
||||||||||||||||
|
Net income
|
-
|
-
|
-
|
10,563,000
|
-
|
10,563,000
|
||||||||||||||||||
|
Balance at March 31, 2016
|
18,531,751
|
$
|
185,000
|
$
|
203,650,000
|
$
|
11,825,000
|
$
|
(4,852,000
|
)
|
$
|
210,808,000
|
||||||||||||
|
Cumulative-effect adjustment
|
-
|
-
|
-
|
892,000
|
-
|
892,000
|
||||||||||||||||||
|
Balance at April 1, 2016
|
18,531,751
|
$
|
185,000
|
$
|
203,650,000
|
$
|
12,717,000
|
$
|
(4,852,000
|
)
|
$
|
211,700,000
|
||||||||||||
|
Compensation recognized under employee stock plans
|
-
|
-
|
3,383,000
|
-
|
-
|
3,383,000
|
||||||||||||||||||
|
Exercise of stock options
|
133,731
|
1,000
|
1,661,000
|
-
|
-
|
1,662,000
|
||||||||||||||||||
|
Issuance of common stock upon vesting of RSUs, net of shares withheld for employee taxes
|
53,031
|
1,000
|
(1,059,000
|
)
|
-
|
-
|
(1,058,000
|
)
|
||||||||||||||||
|
Repurchase and cancellation of treasury stock, including fees
|
(69,659
|
)
|
(1,000
|
)
|
(1,989,000
|
)
|
-
|
-
|
(1,990,000
|
)
|
||||||||||||||
|
Unrealized gain (loss) on investments, net of tax
|
-
|
-
|
-
|
-
|
196,000
|
196,000
|
||||||||||||||||||
|
Foreign currency translation
|
-
|
-
|
-
|
-
|
(2,785,000
|
)
|
(2,785,000
|
)
|
||||||||||||||||
|
Net income
|
-
|
-
|
-
|
37,573,000
|
-
|
37,573,000
|
||||||||||||||||||
|
Balance at March 31, 2017
|
18,648,854
|
$
|
186,000
|
$
|
205,646,000
|
$
|
50,290,000
|
$
|
(7,441,000
|
)
|
$
|
248,681,000
|
||||||||||||
|
Compensation recognized under employee stock plans
|
-
|
-
|
3,766,000
|
-
|
-
|
3,766,000
|
||||||||||||||||||
|
Exercise of stock options
|
55,351
|
1,000
|
480,000
|
-
|
-
|
481,000
|
||||||||||||||||||
|
Issuance of common stock upon vesting of RSUs, net of shares withheld for employee taxes
|
47,508
|
1,000
|
(597,000
|
)
|
-
|
-
|
(596,000
|
)
|
||||||||||||||||
|
Repurchase and cancellation of treasury stock, including fees
|
(374,740
|
)
|
(4,000
|
)
|
(9,247,000
|
)
|
-
|
-
|
(9,251,000
|
)
|
||||||||||||||
|
Exercise of warrant for shares of common stock
|
516,129
|
5,000
|
13,561,000
|
-
|
-
|
13,566,000
|
||||||||||||||||||
|
Unrealized gain (loss) on investments, net of tax
|
-
|
-
|
-
|
-
|
218,000
|
218,000
|
||||||||||||||||||
|
Foreign currency translation
|
-
|
-
|
-
|
-
|
1,795,000
|
1,795,000
|
||||||||||||||||||
|
Net income
|
-
|
-
|
-
|
16,316,000
|
-
|
16,316,000
|
||||||||||||||||||
|
Balance at March 31, 2018
|
18,893,102
|
$
|
189,000
|
$
|
213,609,000
|
$
|
66,606,000
|
$
|
(5,428,000
|
)
|
$
|
274,976,000
|
||||||||||||
The accompanying notes to consolidated financial statements are an integral part hereof.
MOTORCAR PARTS OF AMERICA, INC. AND SUBSIDIARIES
Consolidated Statements of Cash Flows
Years Ended March 31,
|
2018
|
2017
|
2016
|
||||||||||
|
Cash flows from operating activities:
|
||||||||||||
|
Net income
|
$
|
16,316,000
|
$
|
37,573,000
|
$
|
10,563,000
|
||||||
|
Adjustments to reconcile net income to net cash (used in) provided by operating activities:
|
||||||||||||
|
Depreciation
|
3,798,000
|
3,101,000
|
2,315,000
|
|||||||||
|
Amortization of intangible assets
|
710,000
|
613,000
|
621,000
|
|||||||||
|
Amortization of debt issuance costs
|
1,060,000
|
716,000
|
790,000
|
|||||||||
|
Write-off of debt issuance costs
|
-
|
-
|
5,108,000
|
|||||||||
|
Amortization of interest on accrued core payment
|
670,000
|
704,000
|
736,000
|
|||||||||
|
(Gain) loss due to the change in the fair value of the warrant liability
|
(2,313,000
|
)
|
(3,764,000
|
)
|
5,137,000
|
|||||||
|
Gain due to the change in the fair value of the contingent consideration
|
-
|
(16,000
|
)
|
(990,000
|
)
|
|||||||
|
Net provision for inventory reserves
|
8,491,000
|
3,864,000
|
4,518,000
|
|||||||||
|
Net provision for (recovery of) customer payment discrepancies
|
998,000
|
718,000
|
(299,000
|
)
|
||||||||
|
Net provision for doubtful accounts
|
21,000
|
3,000
|
4,404,000
|
|||||||||
|
Deferred income taxes
|
3,055,000
|
6,510,000
|
(3,781,000
|
)
|
||||||||
|
Share-based compensation expense
|
3,766,000
|
3,383,000
|
2,584,000
|
|||||||||
|
Loss on disposal of plant and equipment
|
161,000
|
13,000
|
7,000
|
|||||||||
|
Change in operating assets and liabilities, net of acquisitions:
|
||||||||||||
|
Accounts receivable
|
10,854,000
|
(18,145,000
|
)
|
4,647,000
|
||||||||
|
Inventory
|
(6,847,000
|
)
|
(10,058,000
|
)
|
3,054,000
|
|||||||
|
Inventory unreturned
|
73,000
|
2,939,000
|
(2,687,000
|
)
|
||||||||
|
Income tax receivable
|
(6,081,000
|
)
|
(1,686,000
|
)
|
3,981,000
|
|||||||
|
Prepaid expenses and other current assets
|
(2,507,000
|
)
|
(2,647,000
|
)
|
(1,216,000
|
)
|
||||||
|
Other assets
|
(384,000
|
)
|
(3,339,000
|
)
|
(477,000
|
)
|
||||||
|
Accounts payable and accrued liabilities
|
(11,621,000
|
)
|
12,446,000
|
6,620,000
|
||||||||
|
Customer finished goods returns accrual
|
138,000
|
(8,709,000
|
)
|
6,698,000
|
||||||||
|
Long-term core inventory
|
(45,839,000
|
)
|
(24,964,000
|
)
|
(53,408,000
|
)
|
||||||
|
Long-term core inventory deposits
|
-
|
-
|
26,002,000
|
|||||||||
|
Accrued core payment
|
10,276,000
|
(3,180,000
|
)
|
(11,266,000
|
)
|
|||||||
|
Other liabilities
|
1,261,000
|
(1,344,000
|
)
|
1,673,000
|
||||||||
|
Net cash (used in) provided by operating activities
|
(13,944,000
|
)
|
(5,269,000
|
)
|
15,334,000
|
|||||||
|
Cash flows from investing activities:
|
||||||||||||
|
Purchase of plant and equipment
|
(9,933,000
|
)
|
(4,929,000
|
)
|
(3,747,000
|
)
|
||||||
|
Purchase of business
|
(4,993,000
|
)
|
(705,000
|
)
|
(2,701,000
|
)
|
||||||
|
Additions to short term investments
|
(352,000
|
)
|
(49,000
|
)
|
(1,134,000
|
)
|
||||||
|
Net cash used in investing activities
|
(15,278,000
|
)
|
(5,683,000
|
)
|
(7,582,000
|
)
|
||||||
|
Cash flows from financing activities:
|
||||||||||||
|
Borrowings under revolving loan
|
84,000,000
|
65,001,000
|
29,000,000
|
|||||||||
|
Repayments under revolving loan
|
(41,000,000
|
)
|
(61,001,000
|
)
|
(22,000,000
|
)
|
||||||
|
Borrowings under term loan
|
-
|
-
|
25,000,000
|
|||||||||
|
Repayments of term loan
|
(3,125,000
|
)
|
(3,125,000
|
)
|
(86,063,000
|
)
|
||||||
|
Payments for debt issuance costs
|
(462,000
|
)
|
(433,000
|
)
|
(2,337,000
|
)
|
||||||
|
Payments on capital lease obligations
|
(905,000
|
)
|
(591,000
|
)
|
(374,000
|
)
|
||||||
|
Payment of contingent consideration
|
-
|
(314,000
|
)
|
-
|
||||||||
|
Exercise of stock options
|
481,000
|
1,662,000
|
5,392,000
|
|||||||||
|
Excess tax benefits from stock-based compensation
|
-
|
-
|
5,313,000
|
|||||||||
|
Cash used to net share settle equity awards
|
(596,000
|
)
|
(1,058,000
|
)
|
(913,000
|
)
|
||||||
|
Repurchase of common stock, including fees
|
(9,251,000
|
)
|
(1,990,000
|
)
|
-
|
|||||||
|
Exercise of warrant
|
4,000,000
|
-
|
-
|
|||||||||
|
Net cash provided by (used in) financing activities
|
33,142,000
|
(1,849,000
|
)
|
(46,982,000
|
)
|
|||||||
|
Effect of exchange rate changes on cash and cash equivalents
|
100,000
|
(67,000
|
)
|
(103,000
|
)
|
|||||||
|
Net increase (decrease) in cash and cash equivalents
|
4,020,000
|
(12,868,000
|
)
|
(39,333,000
|
)
|
|||||||
|
Cash and cash equivalents — Beginning of period
|
9,029,000
|
21,897,000
|
61,230,000
|
|||||||||
|
Cash and cash equivalents — End of period
|
$
|
13,049,000
|
$
|
9,029,000
|
$
|
21,897,000
|
||||||
|
Supplemental disclosures of cash flow information:
|
||||||||||||
|
Cash paid during the period for:
|
||||||||||||
|
Interest, net
|
$
|
13,623,000
|
$
|
11,674,000
|
$
|
9,812,000
|
||||||
|
Income taxes, net of refunds
|
19,657,000
|
12,378,000
|
3,762,000
|
|||||||||
|
Non-cash investing and financing activities:
|
||||||||||||
|
Property acquired under capital lease
|
$
|
3,478,000
|
$
|
802,000
|
$
|
2,454,000
|
||||||
|
Contingent consideration
|
-
|
-
|
1,320,000
|
|||||||||
The accompanying notes to consolidated financial statements are an integral part hereof.
MOTORCAR PARTS OF AMERICA, INC. AND SUBSIDIARIES
Notes to Consolidated Financial Statements
1. Company Background and Organization
Overview
Motorcar Parts of America, Inc. and its subsidiaries (the “Company”, or “MPA”) is a leading manufacturer, remanufacturer, and distributor of aftermarket automotive and light truck applications. The Company also, to a lesser extent, is a manufacturer, remanufacturer, and distributor of heavy duty truck and industrial and agricultural application parts. These replacement parts are sold for use on vehicles after initial vehicle purchase. These automotive parts are sold to automotive retail chain stores and warehouse distributors throughout North America and to major automobile manufacturers for both their aftermarket programs and warranty replacement programs (“OES”). The Company’s products include (i) rotating electrical products such as alternators and starters, (ii) wheel hub assemblies and bearings, (iii) brake master cylinders, and (iv) other products which include turbochargers, brake power boosters, and diagnostic equipment. The Company added turbochargers through an acquisition in July 2016. The Company began selling brake power boosters in August 2016. As a result of an acquisition in July 2017, its business also now includes developing and selling diagnostic equipment for alternators, starters, belt-start generators (stop start and hybrid technology), and electric power trains for electric vehicles.
The Company obtains used automotive parts, commonly known as Used Cores, primarily from its customers under the Company’s core exchange program. It also purchases Used Cores from vendors (core brokers). The customers grant credit to the consumer when the used part is returned to them, and the Company in turn provides a credit to the customers upon return to the Company. These Used Cores are an essential material needed for the remanufacturing operations.
The Company has remanufacturing, warehousing and shipping/receiving operations for automotive parts in North America and Asia. In addition, the Company utilizes various third party warehouse distribution centers in North America.
2. Summary of Significant Accounting Policies
New Accounting Pronouncements Not Yet Adopted
Revenue Recognition
In May 2014, the Financial Accounting Standard Board (the “FASB”) issued Accounting Standards Update (“ASU”) 2014-09, Revenue from Contracts with Customers, codified in Accounting Standards Codification (“ASC”) 606, “Revenue Recognition - Revenue from Contracts with Customers” (“ASC 606”), which amends the guidance in the former ASC 605, “Revenue Recognition”. ASC 606 as initially issued was effective for annual periods beginning after December 15, 2016, and interim periods within that reporting period for a public entity. The Company may elect either a full retrospective transition method, which requires the restatement of all periods presented, or a modified retrospective transition method, which requires a cumulative-effect adjustment as of the date of initial adoption. In August 2015, the FASB delayed the effective date by one year to annual periods beginning after December 15, 2017, and interim periods within that reporting period for a public entity. Earlier application is permitted only as of annual reporting periods beginning after December 15, 2016, including interim reporting periods within that reporting period. The Company will adopt the new standard on April 1, 2018 and has elected to utilize the full retrospective transition method.
ASC 606 establishes the requirements for recognizing revenue from contracts with customers. The standard requires entities to apportion consideration from contracts to performance obligations on a relative standalone selling price basis, based on a five-step model. Under the new standard, revenue is recognized when a customer obtains control of a promised good or service and is recognized in an amount that reflects the consideration that the entity expects to receive in exchange for the good or service. In addition, the standard requires disclosure of the nature, amount, timing, and uncertainty of revenue and cash flows arising from contracts with customers.
Due to the impact of the new standard, the Company has made changes to its business processes, systems, and controls. A project team was formed and evaluated and guided the implementation process. The Company performed a preliminary assessment, which included the identification of the key contractual terms in its primary revenue streams and the comparison of historical accounting policies and practices to the requirements of the new standard by revenue stream. The preliminary assessment resulted in the identification of potential accounting differences that will arise from the application of the new standard. The implementation team completed its contract review phase of the project during the third quarter, which included identifying the population of contracts and completing an analysis of the potential accounting impacts of the new standard on individual contracts. During the fourth quarter, the implementation team identified the changes to business processes, systems, and controls to support recognition, presentation, and disclosure under the new standard and will implement these changes during the first quarter of fiscal 2019 as described in the subsequent paragraphs.
The Company’s primary revenue stream is derived from the sale of remanufactured products to its customers pursuant to long-term customer contracts. The Company will continue to recognize revenue at a point in time as it satisfies its performance obligation of transferring control of the product to the customer. The Company recognizes revenues net of anticipated returns, marketing allowances, volume discounts, and other forms of variable consideration more fully described below. The Company also reviewed customer options to acquire additional goods or services and has preliminarily determined no material rights exist within its contracts. The Company does not currently anticipate that the adoption of ASU 2014-09 will have a material impact on previously reported revenue amounts. See discussion regarding Remanufactured Cores below.
The Company currently anticipates that the adoption of ASU 2014-09 will primarily impact reclassifications to certain balance sheet accounts to conform to the presentation and disclosure requirements of ASC 606. For example, the Company currently accounts for Remanufactured Cores anticipated to be returned as long-term core inventory and the refund liability as a contra-account receivable account as illustrated in Note 6. Under ASC 606, the Company currently anticipates it will reclassify this asset to a contractual asset and recognize a contractual liability for amounts expected to be refunded to customers.
The Company also analyzed specific contractual provisions related to sales contracts that include Remanufactured Cores. The Company recognizes revenue for sales of cores not expected to be replaced by a similar Used Core sent back under the core exchange program only upon meeting certain criteria as noted under the caption “Revenue Recognition” below. The adoption of ASU 2014-09 may result in an acceleration of revenue recognition, as it requires the Company to estimate the amount of cores not expected to be returned upon the initial recognition of revenue for contracts that include Remanufactured Cores. As the Company has elected the full retrospective method of adoption, the impact to each reporting period will be measured as the net impact of (i) the acceleration of revenue into a prior period versus what was previously recorded in that period and (ii) the acceleration of revenue into that period previously recognized in a later period (the change in the estimated volume of returns in the comparable recast periods). Given that third-party information available to meet the criteria outlined in Note 2, Summary of Significant Accounting Policies, may be available at different points of time in a given fiscal period, the timing of the revenue recognized in these periods may be less predictive under ASC 605 as compared to the estimation process required under ASU 2014-09. The anticipated increase to previously reported revenues for the year ended March 31, 2016 is less than $2.0 million. The anticipated decrease to previously reported revenues for the year ended March 31, 2017 is less than $0.9 million. The anticipated decrease to reported revenues in the current fiscal year ended March 31, 2018 is less than $0.4 million.
In order to properly determine the transaction price related to its sales contracts, the Company has also analyzed its various forms of consideration paid to its vendors including up-front payments for future contracts. Based on the analysis completed through the year ended March 31, 2018, the Company currently does not anticipate a change to its legacy accounting practices as a result of the adoption of ASU 2014-09 to account for up-front payments to its vendors. Under current accounting practices, if the Company expects to generate future revenues associated with an up-front payment, then an asset is recognized and amortized over the appropriate period of time as a reduction of revenue. If the Company does not expect to generate additional revenue then the up-front payment is recognized in the consolidated statements of income when payment occurs as a reduction of revenue.
ASU 2014-09 also codified the guidance on other assets and deferred costs relating to contracts with customers with the addition of ASC 340-40. This guidance relates to the accounting for costs of an entity to obtain and fulfill a contract to provide goods or services to the customer. Under the new guidance, an entity shall recognize as an asset the incremental costs of obtaining a contract with a customer if the entity expects to recover those costs. In the Company’s review of the various costs to obtain contracts with its customers, it has preliminarily determined that currently no significant costs are incurred that meet the capitalization criteria. The Company’s primary cost to fulfill contracts, other than inventory related costs, relates to shipping and handling activities, which continue to be expensed as incurred consistent with historical accounting practices.
The new guidance provides several practical expedients, which the Company anticipates adopting. The first of these practical expedients allows a company to expense incremental costs of obtaining a contract as incurred if the amortization period would have been one year or less. As noted above, the Company has preliminarily concluded that it does not have any such costs that qualify for capitalization but will apply the practical expedient to the extent that such costs incurred in prospective periods qualify. Similarly, the Company plans to adopt guidance which allows for the effects of a significant financing component to be ignored if a company expects that the period between the transfer of the goods and services to the customer and payment will be one year or less. Finally, the Company plans to adopt guidance that allows a company to account for shipping and handling activities that occur after control of the related good transfers as fulfillment activities instead of assessing such activities as performance obligations.
Financial Instruments
In January 2016, the FASB issued guidance that amends the classification and measurement of financial instruments. Changes to the current guidance primarily affect the accounting for equity investments, financial liabilities under the fair value option, and the presentation and disclosure requirements for financial instruments. In addition, the ASU clarifies guidance related to the valuation allowance assessment when recognizing deferred tax assets resulting from unrealized losses on available-for-sale debt securities. The new standard is effective for fiscal years, and interim periods within those fiscal years, beginning after December 15, 2017. The Company expects to apply the amendments in the new guidance by means of a cumulative-effect adjustment to the opening balance of retained earnings at the beginning of the first quarter of fiscal 2019. The adoption of the new guidance is not expected to have a material impact on the Company’s consolidated financial statements.
Leases
In February 2016, the FASB issued new guidance that requires balance sheet recognition of a right-of-use asset and lease liability by lessees for operating leases. The new guidance also requires new disclosures providing additional qualitative and quantitative information about the amounts recorded in the financial statements. The new guidance is effective for fiscal years beginning after December 15, 2018, including interim periods within those fiscal years. Early adoption is permitted. The new guidance requires a modified retrospective approach with optional practical expedients. The Company will adopt this guidance in the first quarter of fiscal 2020. The Company is currently evaluating the impact the provisions of this guidance will have on its consolidated financial statements, but expects that it will result in a significant increase to its long-term assets and liabilities on the consolidated balance sheets.
Business Combinations
In January 2017, the FASB issued guidance which clarifies the definition of a business to assist entities with evaluating whether transactions should be accounted for as acquisitions (or disposals) of assets or businesses. The new guidance is effective for fiscal years beginning after December 15, 2017, including interim periods within those fiscal years. A reporting entity should apply the amendment prospectively. The adoption of this guidance in the first quarter of fiscal 2019 is not expected to have any material impact on the Company’s consolidated financial statements.
Goodwill Impairment
In January 2017, the FASB issued guidance which simplifies the test for goodwill impairment. This standard eliminates Step 2 from the goodwill impairment test, instead requiring an entity to recognize a goodwill impairment charge for the amount by which the goodwill carrying amount exceeds the reporting unit’s fair value. This guidance is effective for interim and annual goodwill impairment tests in fiscal years beginning after December 15, 2019 with early adoption permitted. This guidance must be applied on a prospective basis. The Company is currently evaluating the impact the provisions of this guidance will have on its consolidated financial statements.
Modifications to Share-Based Payment Awards
In May 2017, the FASB issued guidance to provide clarity and reduce (i) the diversity in practice and (ii) the cost and complexity when applying the accounting guidance for equity-based compensation to a change to the terms or conditions of a share-based payment award. This update provides guidance about which changes to the terms or conditions of a share-based payment award require an entity to apply modification accounting. This guidance is effective for annual periods, and interim periods within those annual periods, beginning after December 15, 2017 with early adoption permitted. This guidance should be applied prospectively to an award modified on or after that adoption date. The adoption of this guidance in the first quarter of fiscal 2019 is not expected to have any material impact on the Company’s consolidated financial statements.
Derivatives and Hedging
In August 2017, the FASB issued guidance to improve the financial reporting of hedging relationships to better portray the economic results of an entity’s risk management activities in its financial statements. The amendments in this update also make certain targeted improvements to simplify the application of the hedge accounting guidance in current GAAP. The new guidance is effective for fiscal years beginning after December 15, 2018, including interim periods within those fiscal years; the guidance allows for early adoption in any interim period after issuance of the update. The Company is currently evaluating the impact this guidance will have on its consolidated financial statements.
Principles of Consolidation
The accompanying consolidated financial statements include the accounts of Motorcar Parts of America, Inc. and its wholly owned subsidiaries. All significant inter-company accounts and transactions have been eliminated.
Reclassification of Prior Period Balances
The income tax receivable has been reclassified from prepaid and other current assets in the consolidated balance sheet at March 31, 2017 to conform to the consolidated balance sheet presentation at March 31, 2018. In addition, the income tax receivable has been reclassified from prepaid and other current assets in the consolidated statements of cash flows for the years ended March 31, 2017 and 2016 to conform to the consolidated statement of cash flow presentation for the year ended March 31, 2018.
Segment Reporting
Pursuant to the guidance provided under the FASB ASC for segment reporting, the Company has identified its chief executive officer as chief operating decision maker (“CODM”), has reviewed the documents used by the CODM, and understands how such documents are used by the CODM to make financial and operating decisions. The Company has determined through this review process that it has one reportable segment for purposes of recording and reporting its financial results.
Cash and Cash Equivalents
Cash primarily consists of cash on hand and bank deposits. Cash equivalents consist of money market funds. The Company considers all highly liquid investments purchased with an original or remaining maturity of less than three months at the date of purchase to be cash equivalents. Cash and cash equivalents are maintained with various financial institutions.
Accounts Receivable
The allowance for doubtful accounts is developed based upon several factors including customer credit quality, historical write-off experience and any known specific issues or disputes which exist as of the balance sheet date. Accounts receivable are written off only when all collection attempts have failed. The Company does not require collateral for accounts receivable.
The Company has receivable discount programs that have been established with certain major customers and their respective banks. Under these programs, the Company has the option to sell those customers’ receivables to those banks at a discount to be agreed upon at the time the receivables are sold. Once the customer chooses which outstanding invoices are going to be made available for discounting, the Company can accept or decline the bundle of invoices provided. The receivable discount programs are non-recourse, and funds cannot be reclaimed by the customer or its bank after the related invoices have been discounted.
Inventory
Non-core Inventory
Non-core inventory is comprised of (i) non-core raw materials, (ii) the non-core value of work in process, (iii) the non-core value of remanufactured finished goods, and (iv) purchased finished goods. Used Cores, the Used Core value of work in process and the Remanufactured Core portion of finished goods are classified as long-term core inventory as described below under the caption “Long-term Core Inventory.” Used Cores are a source of raw materials used in the manufacturing of the Company’s products.
Non-core inventory is stated at the lower of cost or net realizable value. The cost of non-core remanufactured inventory approximates average historical purchase prices paid for raw materials, and is based upon the direct costs of material and an allocation of labor and variable and fixed overhead costs. The cost of purchased finished goods inventory approximates average historical purchase prices paid, and an allocation of fixed overhead costs. The cost of non-core inventory is evaluated at least quarterly during the fiscal year and adjusted as necessary to reflect current lower of cost or net realizable value levels. These adjustments are determined for individual items of inventory within each of the three classifications of non-core inventory as follows:
| • |
Non-core raw materials are recorded at average cost, which is based on the actual purchase price of raw materials on hand. The average cost is updated quarterly. This average cost is used in the inventory costing process and is the basis for allocation of materials to finished goods during the production process.
|
| • |
Non-core work in process is in various stages of production and is valued at the average cost of materials issued to open work orders. Historically, non-core work in process inventory has not been material compared to the total non-core inventory balance.
|
| • |
The cost of remanufactured finished goods includes the average cost of non-core raw materials and allocations of labor and variable and fixed overhead costs. The allocations of labor and variable and fixed overhead costs are determined based on the average actual use of the production facilities over the prior twelve months which approximates normal capacity. This method prevents the distortion in allocated labor and overhead costs that would occur during short periods of abnormally low or high production. In addition, the Company excludes certain unallocated overhead such as severance costs, duplicative facility overhead costs, start-up costs, training, and spoilage from the calculation and expenses these unallocated overhead as period costs.
|
The Company records an allowance for potentially excess and obsolete inventory based upon recent sales history, the quantity of inventory on-hand, and a forecast of potential use of the inventory. The Company periodically reviews inventory to identify excess quantities and part numbers that are experiencing a reduction in demand. Any part numbers with quantities identified during this process are reserved for at rates based upon management’s judgment, historical rates, and consideration of possible scrap and liquidation values which may be as high as 100% of cost if no liquidation market exists for the part. The Company had recorded reserves of $6,682,000 and $4,125,000 for excess and obsolete inventory at March 31, 2018 and 2017, respectively. The quantity thresholds and reserve rates are subjective and are based on management’s judgment and knowledge of current and projected industry demand. The reserve estimates may, therefore, be revised if there are changes in the overall market for the Company’s products or market changes that in management’s judgment, impact its ability to sell or liquidate potentially excess or obsolete inventory.
The Company records vendor discounts as a reduction of inventories that are recognized as a reduction to cost of sales as the inventories are sold.
Inventory Unreturned
Inventory unreturned represents the Company’s estimate, based on historical data and prospective information provided directly by the customer, of finished goods shipped to customers that the Company expects to be returned, under its general right of return policy, after the balance sheet date. Because all cores are classified separately as long-term assets, the inventory unreturned balance includes only the added unit value of a finished good. The return rate is calculated based on expected returns within the normal operating cycle of one year. As such, the related amounts are classified in current assets.
Inventory unreturned is valued in the same manner as the Company’s finished goods inventory.
Long-term Core Inventory
Long-term core inventory consists of:
| • |
Used Cores purchased from core brokers and held in inventory at the Company’s facilities,
|
| • |
Used Cores returned by the Company’s customers and held in inventory at the Company’s facilities,
|
| • |
Used Cores returned by end-users to customers but not yet returned to the Company are classified as Remanufactured Cores until they are physically received by the Company,
|
| • |
Remanufactured Cores held in finished goods inventory at the Company’s facilities; and
|
| • |
Remanufactured Cores held at customer locations as a part of the finished goods sold to the customer. For these Remanufactured Cores, the Company expects the finished good containing the Remanufactured Core to be returned under the Company’s general right of return policy or a similar Used Core to be returned to the Company by the customer, in each case, for credit.
|
Long-term core inventory is recorded at average historical purchase prices determined based on actual purchases of inventory on hand. The cost and net realizable value of Used Cores for which sufficient recent purchases have occurred are deemed the same as the purchase price for purchases that are made in arm’s length transactions.
Long-term core inventory recorded at average historical purchase prices is primarily made up of Used Cores for newer products related to more recent automobile models or products for which there is a less liquid market. The Company purchases these Used Cores from core brokers to supplement the yield from returned cores and the under return by consumers.
Used Cores obtained in core broker transactions are valued based on average purchase price. The average purchase price of Used Cores for more recent automobile models is retained as the cost for these Used Cores in subsequent periods even as the source of these Used Cores shifts to the core exchange program.
Long-term core inventory is recorded at the lower of cost or net realizable value. In the absence of sufficient recent purchases the Company uses the net selling price its customers have agreed to pay for Used Cores that are not returned to the Company under the Company’s core exchange program to assess whether Used Core cost exceeds Used Core net realizable value on a customer by customer basis.
The Company classifies all of its core inventories as long-term assets. The determination of the long-term classification is based on its view that the value of the cores is not consumed or realized in cash during the Company’s normal operating cycle, which is one year for most of the cores recorded in inventory. According to guidance provided under the FASB ASC, current assets are defined as “assets or resources commonly identified as those which are reasonably expected to be realized in cash or sold or consumed during the normal operating cycle of the business.” The Company does not believe that the economic value of core inventories, which the Company classifies as long-term, is consumed because the credits issued upon the return of Used Cores offset the amounts invoiced when the Remanufactured Cores included in finished goods were sold. The Company does not expect the economic value of core inventories to be consumed, and thus the Company does not expect to realize cash, until its relationship with a customer ends, a possibility that the Company considers remote based on existing long-term customer agreements and historical experience.
However, historically for certain finished goods sold, the Company’s customer will not send the Company a Used Core to obtain the credit the Company offers under its core exchange program. Therefore, based on the Company’s historical estimate, the Company derecognizes the core value for these finished goods as the Company believes the economic value has been consumed and the Company has realized cash.
For these reasons, the Company concluded that it is more appropriate to classify core inventory as long-term assets.
Long-term Core Inventory Deposit
The long-term core inventory deposit represents the cost of Remanufactured Cores the Company has purchased from customers, which are held by the customers and remain on the customers’ premises. The costs of these Remanufactured Cores were established at the time of the transaction based on the then current cost, determined as noted under the caption “Long-term Core Inventory”. The selling value of these Remanufactured Cores was established based on agreed upon amounts with these customers. The Company expects to realize the selling value and the related cost of these Remanufactured Cores should its relationship with a customer end, a possibility that the Company considers remote based on existing long-term customer agreements and historical experience.
Customer Finished Goods Returns Accrual
The customer finished goods returns accrual represents the Company’s estimate of its exposure to customer returns, including warranty returns, under its general right of return policy to allow customers to return items that their end user customers have returned to them and from time to time, stock adjustment returns when the customers’ inventory of certain product lines exceeds the anticipated sales to end-user customers. The customer finished goods returns accrual represents the non-core sales value of the estimated returns and is classified as a current liability due to the expectation that these returns will occur within the normal operating cycle of one year.
Accrued Core Payment
The accrued core payment represents the full Remanufactured Core sales price of Remanufactured Cores the Company has purchased from its customers, generally in connection with new business, which are held by these customers and remain on their premises. At the same time, the Company records the long-term core inventory for the Remanufactured Cores purchased at its cost, determined as noted under the caption “Long-term Core Inventory”. The difference between the full Remanufactured Core sales price of Remanufactured Cores and its related cost is treated as sales allowance reducing revenue when the purchases are made. The Company expects to realize the selling value and the related cost of these Remanufactured Cores should its relationship with a customer end, a possibility that the Company considers remote based on existing long-term customer agreements and historical experience.
The repayments for these Remanufactured Core inventory purchases are made through the issuance of credits against that customer’s receivables either on a one-time basis or over an agreed-upon period. The accrued core payment is recorded as a current and noncurrent liability in the consolidated balance sheets based on whether repayments will occur within the normal operating cycle of one year.
Income Taxes
The Company accounts for income taxes using the liability method, which measures deferred income taxes by applying enacted statutory rates in effect at the balance sheet date to the differences between the tax basis of assets and liabilities and their reported amounts in the financial statements. The resulting asset or liability is adjusted to reflect changes in the tax laws as they occur. A valuation allowance is provided to reduce deferred tax assets when it is more likely than not that a portion of the deferred tax asset will not be realized.
The primary components of the Company’s income tax provision are (i) the current liability or refund due for federal, state and foreign income taxes and (ii) the change in the amount of the net deferred income tax asset, including the effect of any change in the valuation allowance.
In December 2017, new tax legislation was enacted in the United States (Tax Reform Act) which resulted in significant changes to income tax expense. As a result of the Tax Reform Act, the Company re-measured certain deferred tax assets and liabilities based on the newly enacted federal rate of 21%. Accordingly, the federal net deferred tax assets were written down to account for the change. These tax changes represent provisional amounts based on the Company’s current interpretation of the Tax Reform Act and may change as it receives additional clarification and implementation guidance. The Company will continue to analyze the effects of the Tax Reform Act on its financial statements and operations. Any additional impacts from the enactment of the Tax Reform Act will be recorded as they are identified during the measurement period as provided for in accordance with Staff Accounting Bulletin No. 118.
Realization of deferred tax assets is dependent upon the Company’s ability to generate sufficient future taxable income. Significant judgment is required in determining the Company’s provision for income taxes, deferred tax assets and liabilities and any valuation allowance recorded against the Company’s net deferred tax assets. The Company makes these estimates and judgments about its future taxable income that are based on assumptions that are consistent with the Company’s future plans. A valuation allowance is established when the Company believes it is not more likely than not all or some of a deferred tax assets will be realized. In evaluating the Company’s ability to recover deferred tax assets within the jurisdiction in which they arise, the Company considers all available positive and negative evidence. Deferred tax assets arising primarily as a result of net operating loss carry-forwards and research and development credits in connection with the Company’s July 2017 acquisition have been offset completely by a valuation allowance due to the uncertainty of their utilization in future periods. Should the actual amount differ from the Company’s estimates, the amount of the valuation allowance could be impacted.
Plant and Equipment
Plant and equipment are stated at cost, less accumulated depreciation. The cost of additions and improvements are capitalized, while maintenance and repairs are charged to expense when incurred. Depreciation is provided on a straight-line basis in amounts sufficient to relate the cost of depreciable assets to operations over their estimated service lives. Machinery and equipment are depreciated over a range from five to ten years. Office equipment and fixtures are depreciated over a range from three to ten years. Leasehold improvements are depreciated over the lives of the respective leases or the service lives of the leasehold improvements, whichever is shorter. Depreciation of assets recorded under capital leases is included in depreciation expense.
Intangible Assets
The Company’s intangible assets other than goodwill are finite–lived and amortized on a straight-line basis over their respective useful lives. Finite-lived intangible assets are analyzed for impairment when and if indicators of impairment exist. At March 31, 2018, the Company’s intangible assets were $3,766,000 and there were no indicators of impairment.
Goodwill
The Company evaluates goodwill for impairment at least annually during the fourth quarter of each fiscal year or more frequently when an event occurs or circumstances change that indicate the carrying value may not be recoverable. The Company has concluded that there is one reporting unit and therefore, tests goodwill for impairment at the entity level. In testing for goodwill impairment, the Company may elect to utilize a qualitative assessment to evaluate whether it is more likely than not that the fair value of the reporting unit is less than its carrying amount. If the Company’s qualitative assessment indicates that goodwill impairment is more likely than not, a two-step impairment test is performed. The Company tests goodwill for impairment under the two-step impairment test by first comparing the carrying value of net assets to the fair value of the reporting unit. If the fair value of the reporting unit exceeds the carrying value, goodwill is not considered impaired and no further testing is required. If the carrying value of the reporting unit exceeds the fair value, goodwill is potentially impaired and the second step of the impairment test must be performed. In the second step, the Company would compare the implied fair value of the goodwill to its carrying value to determine the amount of the impairment loss, if any. The Company completed the required annual testing of goodwill for impairment during the fourth quarter of the year ended March 31, 2018, and determined through the qualitative assessment that its goodwill of $2,551,000 is not impaired.
Debt Issuance Costs
Debt issuance costs include fees and costs incurred to obtain financing. Debt issuance costs related to the Company’s term loans are presented in the balance sheet as a direct deduction from the carrying amount of the term loans. Debt issuance costs related to the Company’s revolving loan are presented in prepaid expenses and other current assets in the accompanying consolidated balance sheets, regardless of whether or not there are any outstanding borrowings under the revolving loan. These fees and costs are amortized using the straight-line method, which approximates the effective interest rate method, over the terms of the related loans and are included in interest expense in the Company’s consolidated statements of income.
Foreign Currency Translation
For financial reporting purposes, the functional currency of the foreign subsidiaries is the local currency. The assets and liabilities of foreign operations for which the local currency is the functional currency are translated into the U.S. dollar at the exchange rate in effect at the balance sheet date, while revenues and expenses are translated at average exchange rates during the year. The accumulated foreign currency translation adjustment is presented as a component of comprehensive income or loss in the consolidated statements of shareholders’ equity.
Revenue Recognition
The Company recognizes revenue when performance by the Company is complete and all of the following criteria have been met:
| • |
Persuasive evidence of an arrangement exists,
|
| • |
Delivery has occurred or services have been rendered,
|
| • |
The seller’s price to the buyer is fixed or determinable, and
|
| • |
Collectability is reasonably assured.
|
For products shipped free-on-board (“FOB”) shipping point, revenue is recognized on the date of shipment. For products shipped FOB destination, revenues are recognized on the estimated or actual date of delivery. The Company includes shipping and handling charges in its gross invoice price to customers and classifies the total amount as revenue. All shipping and handling costs are expensed as incurred and included in cost of sales.
The price of a finished remanufactured product sold to customers is generally comprised of separately invoiced amounts for the Remanufactured Core included in the product (“Remanufactured Core value”) and for the value added by remanufacturing (“unit value”). Unit value revenue is recorded based on the Company’s price list, net of applicable discounts and allowances. The Company allows customers to return slow moving and other inventory. The Company provides for such returns of inventory by reducing revenue and cost of sales for the unit value of goods sold that are expected to be returned based on a historical return analysis and information obtained from customers about current stock levels as further described under the captions “Customer Finished Goods Returns Accrual” and “Inventory Unreturned”.
The Company accounts for revenues and cost of sales on a net-of-core-value basis. The Company has determined that its business practices and contractual arrangements result in a significant portion of the Remanufactured Cores sold being replaced by similar Used Cores sent back for credit by customers under the Company’s core exchange program. Accordingly, the Company excludes the value of Remanufactured Cores from revenue.
When the Company ships a product, it recognizes an obligation to accept a similar Used Core sent back under the core exchange program by recording a contra receivable account based upon the Remanufactured Core price agreed upon by the Company and its customer. Upon receipt of a Used Core, the Company grants the customer a credit based on the Remanufactured Core price billed and restores the Used Core to on-hand inventory.
When the Company ships a product, it invoices certain customers for the Remanufactured Core portion of the product at full Remanufactured Core sales price. For these Remanufactured Cores, the Company recognizes core revenue based upon an estimate of the rate at which the Company’s customers will pay cash for Remanufactured Cores in lieu of sending back similar Used Cores for credits under the Company’s core exchange program.
In addition, the Company recognizes revenue related to Remanufactured Cores originally sold at a nominal price and not expected to be replaced by a similar Used Core under the core exchange program. Unlike the full price Remanufactured Cores, the Company only recognizes revenue from nominally priced Remanufactured Cores not expected to be replaced by a similar Used Core sent back under the core exchange program when the Company believes it has met all of the following criteria:
| • |
The Company has a signed agreement with the customer covering the nominally priced Remanufactured Cores not expected to be replaced by a similar Used Core sent back under the core exchange program. This agreement must specify the number of Remanufactured Cores its customer will pay cash for in lieu of sending back a similar Used Core and the basis on which the nominally priced Remanufactured Cores are to be valued (normally the average price per Remanufactured Core stipulated in the agreement).
|
| • |
The contractual date for reconciling the Company’s records and customer’s records of the number of nominally priced Remanufactured Cores not expected to be replaced by a similar Used Core sent back under the core exchange program must be in the current or a prior period.
|
| • |
The reconciliation of the nominally priced Remanufactured Cores must be completed and agreed to by the customer.
|
| • |
The amount must be billed to the customer.
|
Marketing Allowances
The Company records the cost of all marketing allowances provided to its customers. Such allowances include sales incentives and concessions. Voluntary marketing allowances related to a single exchange of product are recorded as a reduction of revenues at the time the related revenues are recorded or when such incentives are offered. Other marketing allowances, which may only be applied against future purchases, are recorded as a reduction to revenues in accordance with a schedule set forth in the relevant contract. Sales incentive amounts are recorded based on the value of the incentive provided. See Note 15 for a description of all marketing allowances.
Advertising Costs
The Company expenses all advertising costs as incurred. Advertising expenses for the years ended March 31, 2018, 2017 and 2016 were $610,000, $525,000 and $474,000, respectively.
Net Income Per Share
Basic net income per share is computed by dividing net income by the weighted average number of shares of common stock outstanding during the period. Diluted net income per share includes the effect, if any, from the potential exercise or conversion of securities, such as stock options and warrants, which would result in the issuance of incremental shares of common stock.
The following presents a reconciliation of basic and diluted net income per share.
|
Years Ended March 31,
|
||||||||||||
|
2018
|
2017
|
2016
|
||||||||||
|
Net income
|
$
|
16,316,000
|
$
|
37,573,000
|
$
|
10,563,000
|
||||||
|
Basic shares
|
18,854,993
|
18,608,812
|
18,233,163
|
|||||||||
|
Effect of dilutive stock options and warrants
|
659,782
|
809,894
|
832,930
|
|||||||||
|
Diluted shares
|
19,514,775
|
19,418,706
|
19,066,093
|
|||||||||
|
Net income per share:
|
||||||||||||
|
Basic net income per share
|
$
|
0.87
|
$
|
2.02
|
$
|
0.58
|
||||||
|
Diluted net income per share
|
$
|
0.84
|
$
|
1.93
|
$
|
0.55
|
||||||
The effect of dilutive options and warrants excludes (i) 448,039 shares subject to options with exercise prices ranging from $27.40 to $34.17 per share for the year ended March 31, 2018, (ii) 293,239 shares subject to options with exercise prices ranging from $28.68 to $34.17 per share for the year ended March 31, 2017, and (iii) 1,100 shares subject to options with an exercise price of $34.17 per share for the year ended March 31, 2016, which were anti-dilutive.
Use of Estimates
The preparation of consolidated financial statements in conformity with accounting principles generally accepted in the United States (“GAAP”) requires management to make estimates and assumptions that affect the reported amounts in the consolidated financial statements and accompanying notes. Actual results could differ from those estimates. On an on-going basis, the Company evaluates its estimates, including those related to the carrying amount of plant and equipment; valuation of acquisition-related intangible assets including goodwill, impairment of long-lived assets, valuation and return allowances for receivables, inventories, and deferred income taxes; accrued liabilities, warrant liability, share-based compensation, and litigation and disputes.
The Company uses significant estimates in the calculation of sales returns. These estimates are based on the Company’s historical return rates and an evaluation of estimated sales returns from specific customers.
The Company uses significant estimates in the calculation of the lower of cost or net realizable value of long-term core inventory.
The Company’s calculation of inventory reserves involves significant estimates. The basis for the inventory reserve is a comparison of inventory on hand to historical production usage or sales volumes.
The Company uses significant estimates in the calculation of its income tax provision or benefit by using forecasts to estimate whether it will have sufficient future taxable income to realize its deferred tax assets. There can be no assurances that the Company’s taxable income will be sufficient to realize such deferred tax assets.
The Company uses significant estimates in the ongoing calculation of potential liabilities from uncertain tax positions that are more likely than not to occur.
A change in the assumptions used in the estimates for sales returns, inventory reserves and income taxes could result in a difference in the related amounts recorded in the Company’s consolidated financial statements.
Financial Instruments
The carrying amounts of cash, short-term investments, accounts receivable, accounts payable and accrued liabilities approximate their fair value due to the short-term nature of these instruments. The carrying amounts of the revolving loan, term loan and other long-term liabilities approximate their fair value based on current rates for instruments with similar characteristics.
Share-Based Payments
In accounting for share-based compensation awards, the Company follows the accounting guidance for equity-based compensation, which requires that the Company measure the cost of employee services received in exchange for an award of equity instruments based on the grant-date fair value of the award. The cost associated with stock options is estimated using the Black-Scholes option-pricing model. The cost associated with restricted stock units is measured based on the number of shares granted and the closing price of the Company’s common stock on the grant date, subject to continued employment. The cost of equity instruments is recognized in the consolidated statements of income on a straight-line basis over the period during which an employee is required to provide service in exchange for the award. In addition, the Company accounts for forfeitures as they occur.
The Black-Scholes option-pricing model requires the input of subjective assumptions including the expected volatility of the underlying stock and the expected holding period of the option. These subjective assumptions are based on both historical and other information. Changes in the values assumed and used in the model can materially affect the estimate of fair value.
The following summarizes the Black-Scholes option-pricing model assumptions used to derive the weighted average fair value of the stock options granted during the periods noted.
|
Years Ended March 31,
|
||||||||||||
|
2018
|
2017
|
2016
|
||||||||||
|
Weighted average risk free interest rate
|
1.92
|
%
|
1.39
|
%
|
1.73
|
%
|
||||||
|
Weighted average expected holding period (years)
|
5.82
|
5.84
|
5.76
|
|||||||||
|
Weighted average expected volatility
|
47.28
|
%
|
47.42
|
%
|
46.84
|
%
|
||||||
|
Weighted average expected dividend yield
|
-
|
-
|
-
|
|||||||||
|
Weighted average fair value of options granted
|
$
|
12.63
|
$
|
13.09
|
$
|
14.14
|
||||||
Credit Risk
The majority of the Company’s sales are to leading automotive aftermarket parts suppliers. Management believes the credit risk with respect to trade accounts receivable is limited due to the Company’s credit evaluation process and the nature of its customers. However, should the Company’s customers experience significant cash flow problems, the Company’s financial position and results of operations could be materially and adversely affected, and the maximum amount of loss that would be incurred would be the outstanding receivable balance, Used Cores expected to be returned by customers, and the value of the Remanufactured Cores held at customers’ locations.
Deferred Compensation Plan
The Company has a deferred compensation plan for certain members of management. The plan allows participants to defer salary and bonuses. The assets of the plan are held in a trust and are subject to the claims of the Company’s general creditors under federal and state laws in the event of insolvency. Consequently, the trust qualifies as a Rabbi trust for income tax purposes. The plan’s assets consist primarily of mutual funds and are classified as available for sale. The investments are recorded at market value, with any unrealized gain or loss recorded as other comprehensive income or loss in shareholders’ equity. Adjustments to the deferred compensation liability are recorded in operating expenses. The Company did not redeem any of its short-term investments for the payment of deferred compensation liabilities during the years ended March 31, 2018 and 2017. The carrying value of plan assets was $2,828,000 and $2,140,000, and deferred compensation liability was $2,828,000 and $2,140,000 at March 31, 2018 and 2017, respectively. During the years ended March 31, 2018, 2017, and 2016, an expense of $118,000, $(14,000) and $409,000, respectively, was recorded for each year related to the deferred compensation plan.
Comprehensive Income or Loss
Comprehensive income or loss is defined as the change in equity during a period resulting from transactions and other events and circumstances from non-owner sources. The Company’s total comprehensive income or loss consists of net unrealized income or loss from foreign currency translation adjustments and unrealized gains or losses on short-term investments.
3. Acquisition
Pursuant to a share repurchase agreement dated July 18, 2017, the Company completed the acquisition of all the equity interests of D&V Electronics Ltd. (“D&V”) based in Ontario, Canada, a privately held developer and manufacturer of leading edge diagnostic equipment for alternators, starters, belt-start generators (stop start and hybrid technology), and electric power trains for electric vehicles.
The Company allocated the final purchase consideration to acquire D&V to finite-lived intangible assets of $308,000 for developed technology with an estimated useful life of 3 years and $185,000 for trademarks with an estimated useful life of 2 years, $3,379,000 for inventory, and other net assets of $1,121,000. The assets and results of operations of D&V were not significant to the Company’s consolidated financial position or results of operations, and thus pro forma information is not presented.
4. Goodwill and Intangible Assets
Goodwill
The following summarizes the change in the Company’s goodwill:
|
Years Ended March 31,
|
||||||||
|
2018
|
2017
|
|||||||
|
Balance at beginning of period
|
$
|
2,551,000
|
$
|
2,053,000
|
||||
|
Goodwill acquired
|
-
|
498,000
|
||||||
|
Translation adjustment
|
-
|
-
|
||||||
|
Impairment
|
-
|
-
|
||||||
|
Balance at end of period
|
$
|
2,551,000
|
$
|
2,551,000
|
||||
Intangible Assets
The following is a summary of acquired intangible assets subject to amortization at March 31:
|
2018
|
2017
|
|||||||||||||||||
|
Weighted
Average
Amortization
Period
|
Gross Carrying
Value
|
Accumulated
Amortization
|
Gross Carrying
Value
|
Accumulated
Amortization
|
||||||||||||||
|
Intangible assets subject to amortization
|
||||||||||||||||||
|
Trademarks
|
9 years
|
$
|
885,000
|
$
|
316,000
|
$
|
705,000
|
$
|
191,000
|
|||||||||
|
Customer relationships
|
13 years
|
5,900,000
|
2,937,000
|
5,900,000
|
2,421,000
|
|||||||||||||
|
Developed technology
|
3 years
|
301,000
|
67,000
|
-
|
-
|
|||||||||||||
|
Total
|
$
|
7,086,000
|
$
|
3,320,000
|
$
|
6,605,000
|
$
|
2,612,000
|
||||||||||
The Company did not retire any fully amortized intangible assets during the year ended March 31, 2018. The Company retired $33,000 of fully amortized intangible assets during the year ended March 31, 2017.
Amortization expense for acquired intangible assets is as follows:
|
Years Ended March 31,
|
||||||||||||
|
2018
|
2017
|
2016
|
||||||||||
|
Amortization expense
|
$
|
710,000
|
$
|
613,000
|
$
|
621,000
|
||||||
The estimated future amortization expense for acquired intangible assets subject to amortization is as follows:
|
Year Ending March 31,
|
||||
|
2019
|
$
|
771,000
|
||
|
2020
|
711,000
|
|||
|
2021
|
613,000
|
|||
|
2022
|
580,000
|
|||
|
2023
|
580,000
|
|||
|
Thereafter
|
511,000
|
|||
|
Total
|
$
|
3,766,000
|
||
5. Short-Term Investments
The short-term investments contain the assets of the Company’s deferred compensation plan. The plan’s assets consist primarily of mutual funds and are classified as available for sale. The Company did not redeem any short-term investments for the payment of deferred compensation liabilities during the years ended March 31, 2018 and 2017. At March 31, 2018 and 2017, the fair market value of the short-term investments was $2,828,000 and $2,140,000, and the deferred compensation liability to plan participants was $2,828,000 and $2,140,000, respectively.
6. Accounts Receivable — Net
Included in accounts receivable — net are significant offset accounts related to customer allowances (see Note 15), customer payment discrepancies, returned goods authorizations (“RGA”) issued for in-transit unit returns, estimated future credits to be provided for Used Cores returned by the customers (see Note 2) and potential bad debts. Due to the forward looking nature and the different aging periods of certain estimated offset accounts, they may not, at any point in time, directly relate to the balances in the accounts receivable—trade account.
Accounts receivable — net is comprised of the following at March 31:
|
2018
|
2017
|
|||||||
|
Accounts receivable — trade
|
$
|
83,700,000
|
$
|
76,902,000
|
||||
|
Allowance for bad debts
|
(4,142,000
|
)
|
(4,140,000
|
)
|
||||
|
Customer allowances earned
|
(11,370,000
|
)
|
(7,880,000
|
)
|
||||
|
Customer payment discrepancies
|
(1,110,000
|
)
|
(751,000
|
)
|
||||
|
Customer returns RGA issued
|
(15,274,000
|
)
|
(12,710,000
|
)
|
||||
|
Customer core returns accruals
|
(36,066,000
|
)
|
(25,404,000
|
)
|
||||
|
Less: total accounts receivable offset accounts
|
(67,962,000
|
)
|
(50,885,000
|
)
|
||||
|
Total accounts receivable — net
|
$
|
15,738,000
|
$
|
26,017,000
|
||||
Warranty Returns
The Company allows its customers to return goods that their customers have returned to them, whether or not the returned item is defective (“warranty returns”). The Company accrues an estimate of its exposure to warranty returns based on a historical analysis of the level of this type of return as a percentage of total unit sales. Amounts charged to expense for these warranty returns are considered in arriving at the Company’s net sales. At March 31, 2018 and 2017, the Company’s total warranty return accrual was $16,646,000 and $14,286,000, respectively, of which $7,204,000 and $5,303,000, respectively, was included in the customer returns RGA issued balance in the above table for expected credits to be issued against accounts receivable and $9,442,000 and $8,983,000, respectively, was included in the customer finished goods returns accrual in the consolidated balance sheets for estimated future warranty returns.
The following summarizes the change in the Company’s warranty return accrual:
|
Years Ended March 31,
|
||||||||||||
|
2018
|
2017
|
2016
|
||||||||||
|
Balance at beginning of period
|
$
|
14,286,000
|
$
|
10,845,000
|
$
|
10,904,000
|
||||||
|
Charged to expense
|
105,156,000
|
99,673,000
|
80,099,000
|
|||||||||
|
Amounts processed
|
(102,796,000
|
)
|
(96,232,000
|
)
|
(80,158,000
|
)
|
||||||
|
Balance at end of period
|
$
|
16,646,000
|
$
|
14,286,000
|
$
|
10,845,000
|
||||||
7. Inventory
Non-core inventory, inventory unreturned, long-term core inventory, and long-term core inventory deposits are as follows at March 31:
|
2018
|
2017
|
|||||||
|
Non-core inventory
|
||||||||
|
Raw materials
|
$
|
25,805,000
|
$
|
21,515,000
|
||||
|
Work in process
|
635,000
|
641,000
|
||||||
|
Finished goods
|
53,973,000
|
48,337,000
|
||||||
|
80,413,000
|
70,493,000
|
|||||||
|
Less allowance for excess and obsolete inventory
|
(4,138,000
|
)
|
(2,977,000
|
)
|
||||
|
Total
|
$
|
76,275,000
|
$
|
67,516,000
|
||||
|
Inventory unreturned
|
$
|
7,508,000
|
$
|
7,581,000
|
||||
|
Long-term core inventory
|
||||||||
|
Used cores held at the Company's facilities
|
$
|
53,278,000
|
$
|
38,713,000
|
||||
|
Used cores expected to be returned by customers
|
12,970,000
|
11,752,000
|
||||||
|
Remanufactured cores held in finished goods
|
34,201,000
|
27,667,000
|
||||||
|
Remanufactured cores held at customers' locations (1)
|
203,751,000
|
185,938,000
|
||||||
|
304,200,000
|
264,070,000
|
|||||||
|
Less allowance for excess and obsolete inventory
|
(2,544,000
|
)
|
(1,148,000
|
)
|
||||
|
Total
|
$
|
301,656,000
|
$
|
262,922,000
|
||||
|
Long-term core inventory deposits
|
$
|
5,569,000
|
$
|
5,569,000
|
||||
| (1) |
Remanufactured cores held at customers’ locations represent the core portion of the Company’s customers’ finished goods at the Company’s customers’ locations.
|
8. Plant and Equipment
The following summarizes plant and equipment, at cost, at March 31:
|
2018
|
2017
|
|||||||
|
Machinery and equipment
|
$
|
42,976,000
|
$
|
32,589,000
|
||||
|
Office equipment and fixtures
|
11,380,000
|
11,806,000
|
||||||
|
Leasehold improvements
|
7,832,000
|
7,641,000
|
||||||
|
62,188,000
|
52,036,000
|
|||||||
|
Less accumulated depreciation
|
(33,866,000
|
)
|
(33,599,000
|
)
|
||||
|
Total
|
$
|
28,322,000
|
$
|
18,437,000
|
||||
Plant and equipment located in the foreign countries where the Company has facilities, net of accumulated depreciation, totaled $14,919,000 and $3,855,000 at March 31, 2018 and 2017, respectively. These assets constitute substantially all the long-lived assets of the Company located outside of the United States.
9. Capital Lease Obligations
The Company leases various types of machinery and computer equipment under agreements accounted for as capital leases and included in plant and equipment as follows at March 31:
|
2018
|
2017
|
|||||||
|
Cost
|
$
|
7,092,000
|
$
|
3,663,000
|
||||
|
Less: accumulated depreciation
|
(1,446,000
|
)
|
(893,000
|
)
|
||||
|
Total
|
$
|
5,646,000
|
$
|
2,770,000
|
||||
Future minimum lease payments for the capital leases are as follows:
|
Year Ending March 31,
|
||||
|
2019
|
$
|
1,627,000
|
||
|
2020
|
1,474,000
|
|||
|
2021
|
1,045,000
|
|||
|
2022
|
839,000
|
|||
|
2023
|
613,000
|
|||
|
Total minimum lease payments
|
5,598,000
|
|||
|
Less amount representing interest
|
(514,000
|
)
|
||
|
Present value of future minimum lease payments
|
5,084,000
|
|||
|
Less current portion of lease payments
|
(1,388,000
|
)
|
||
|
Long-term portion of lease payments
|
$
|
3,696,000
|
||
The current portion of lease payments of $1,388,000 is included in other current liabilities and the long-term portion of lease payments of $3,696,000 is included in other liabilities in the accompanying consolidated balance sheet at March 31, 2018.
10. Accrued Core Payment
At March 31, 2018 and 2017, the Company recorded $35,009,000 and $24,063,000, respectively, representing the net accrued core payment for the Remanufactured Core inventory purchased from its customers, which are held by these customers and remain on their premises.
Future repayments for accrued core payment are as follows:
|
Year Ending March 31,
|
||||
|
2019
|
$
|
17,421,000
|
||
|
2020
|
7,865,000
|
|||
|
2021
|
6,651,000
|
|||
|
2022
|
4,841,000
|
|||
|
Total accrued core payment
|
36,778,000
|
|||
|
Less amount representing interest
|
(1,769,000
|
)
|
||
|
Present value of accrued core payment
|
35,009,000
|
|||
|
Less current portion of accrued core payment
|
(16,536,000
|
)
|
||
|
Long-term portion of accrued core payment
|
$
|
18,473,000
|
11. Debt
The Company has the following credit agreements.
Credit Facility
The Company is party to a $145,000,000 senior secured financing, as amended, (the “Credit Facility”) with the lenders party thereto, and PNC Bank, National Association, as administrative agent, consisting of (i) a $120,000,000 revolving loan facility, subject to borrowing base restrictions and a $15,000,000 sublimit for letters of credit (the “Revolving Facility”) and (ii) a $25,000,000 term loan facility (the “Term Loans”). The loans under the Credit Facility mature on June 3, 2020. In connection with the Credit Facility, the lenders were granted a security interest in substantially all of the assets of the Company. The Credit Facility permits the payment of up to $10,000,000 of dividends per calendar year, subject to a minimum availability threshold and pro forma compliance with financial covenants. This amount was increased to $15,000,000 under the April 2017 amendment to the Credit Facility.
In April 2017, the Company entered into a consent and fourth amendment to the Credit Facility (the “Fourth Amendment”) which, among other things, (i) increased the borrowing base limit with respect to inventory located in Mexico, (ii) amended the definition and calculation of consolidated EBITDA to raise the limitation on the add-back for non-capitalized transaction expenses related to the expansion of operations in Mexico, (iii) increased the annual limit on permitted stock repurchases and dividends, and (iv) modified certain other categories (including increasing certain baskets for permitted acquisitions) and thresholds to, among other things, further accommodate the expansion of operations in Mexico.
In July 2017, the Company entered into a fifth amendment to the Credit Facility (the “Fifth Amendment”) which, among other things, amended the definition of permitted acquisitions, permitted indebtedness, and pledge agreements.
The Term Loans require quarterly principal payments of $781,250. The Credit Facility bears interest at rates equal to either LIBOR plus a margin of 2.50%, 2.75% or 3.00% or a reference rate plus a margin of 1.50%, 1.75% or 2.00%, in each case depending on the senior leverage ratio as of the applicable measurement date. There is also a facility fee of 0.25% to 0.375%, depending on the senior leverage ratio as of the applicable measurement date. The interest rate on the Company’s Term Loans and Revolving Facility was 4.42% and 4.52%, respectively, at March 31, 2018 and 3.29% and 3.55%, respectively, at March 31, 2017.
The Credit Facility, among other things, requires the Company to maintain certain financial covenants including a maximum senior leverage ratio and a minimum fixed charge coverage ratio. The Company was in compliance with all financial covenants as of March 31, 2018.
In addition to other covenants, the Credit Facility places limits on the Company’s ability to incur liens, incur additional indebtedness, make loans and investments, engage in mergers and acquisitions, engage in asset sales, redeem or repurchase capital stock, alter the business conducted by the Company and its subsidiaries, transact with affiliates, prepay, redeem or purchase subordinated debt, and amend or otherwise alter debt agreements.
The following summarizes information about the Company’s Term Loans at March 31:
|
2018
|
2017
|
|||||||
|
Principal amount of term loan
|
$
|
17,188,000
|
$
|
20,312,000
|
||||
|
Unamortized financing fees
|
(207,000
|
)
|
(313,000
|
)
|
||||
|
Net carrying amount of term loan
|
16,981,000
|
19,999,000
|
||||||
|
Less current portion of term loan
|
(3,068,000
|
)
|
(3,064,000
|
)
|
||||
|
Long-term portion of term loan
|
$
|
13,913,000
|
$
|
16,935,000
|
||||
Future repayments of the Company’s Term Loans are as follows:
|
Year Ending March 31,
|
||||
|
2019
|
$
|
3,125,000
|
||
|
2020
|
3,125,000
|
|||
|
2021
|
10,938,000
|
|||
|
Total payments
|
$
|
17,188,000
|
||
The Company had $54,000,000 and $11,000,000 outstanding under the Revolving Facility at March 31, 2018 and 2017, respectively. In addition, $260,000 was reserved for standby letters of credit for workers’ compensation insurance and $600,000 for commercial letters of credit at March 31, 2018. At March 31, 2018, $65,140,000, subject to certain adjustments, was available under the Revolving Facility.
WX Agreement
In August 2012, the Company entered into a Revolving Credit/Strategic Cooperation Agreement (the “WX Agreement”) with Wanxiang America Corporation (the “Supplier”) and the discontinued subsidiaries. In connection with the WX Agreement, the Company issued a warrant (the “Supplier Warrant”) to the Supplier to purchase up to 516,129 shares of the Company’s common stock for an exercise price of $7.75 per share exercisable at any time after August 22, 2014 and on or prior to September 30, 2017.
On September 8, 2017, the Supplier exercised the Supplier Warrant in full and paid the Company $4,000,000. As a result of the exercise, the Supplier Warrant is no longer outstanding. The fair value of the Supplier Warrant on the exercise date was $9,566,000 using level 3 inputs and the Monte Carlo simulation model. The following assumptions were used to calculate the fair value of the Supplier Warrant: dividend yield of 0%, expected volatility of 26.4%, risk-free interest rate of 0.96%, subsequent financing probability of 0%, and an expected life of 0.06 years. The Company recorded a non-cash reclassification of the Supplier Warrant’s fair value to shareholders’ equity on the exercise date, with no further adjustments to the fair value of the Supplier Warrant being required. The fair value of the Supplier Warrant was $11,879,000 at March 31, 2017 and was included in other liabilities in the consolidated balance sheet.
During the years ended March 31, 2018 and 2017, a gain of $2,313,000 and $3,764,000, respectively, was recorded in general and administrative expenses due to the change in the fair value of this warrant liability.
12. Accounts Receivable Discount Programs
The Company uses receivable discount programs with certain customers and their respective banks. Under these programs, the Company may sell those customers’ receivables to those banks at a discount to be agreed upon at the time the receivables are sold. These discount arrangements allow the Company to accelerate receipt of payment on customers’ receivables.
The following is a summary of the Company’s accounts receivable discount programs:
|
Years Ended March 31,
|
||||||||
|
2018
|
2017
|
|||||||
|
Receivables discounted
|
$
|
357,224,000
|
$
|
352,369,000
|
||||
|
Weighted average days
|
340
|
342
|
||||||
|
Weighted average discount rate
|
3.3
|
%
|
2.9
|
%
|
||||
|
Amount of discount as interest expense
|
$
|
11,182,000
|
$
|
9,724,000
|
||||
13. Financial Risk Management and Derivatives
Purchases and expenses denominated in currencies other than the U.S. dollar, which are primarily related to the Company’s facilities overseas, expose the Company to market risk from material movements in foreign exchange rates between the U.S. dollar and the foreign currency. The Company’s primary risk exposure is from fluctuations in the value of the Mexican peso and to a lesser extent the Chinese yuan. To mitigate these risks, the Company enters into forward foreign currency exchange contracts to exchange U.S. dollars for these foreign currencies. The extent to which forward foreign currency exchange contracts are used is modified periodically in response to the Company’s estimate of market conditions and the terms and length of anticipated requirements.
The Company enters into forward foreign currency exchange contracts in order to reduce the impact of foreign currency fluctuations and not to engage in currency speculation. The use of derivative financial instruments allows the Company to reduce its exposure to the risk that the eventual cash outflow resulting from funding the expenses of the foreign operations will be materially affected by changes in exchange rates. The Company does not hold or issue financial instruments for trading purposes. The forward foreign currency exchange contracts are designated for forecasted expenditure requirements to fund foreign operations.
The Company had forward foreign currency exchange contracts with a U.S. dollar equivalent notional value of $31,304,000 and $26,880,000 at March 31, 2018 and 2017, respectively. These contracts generally expire in a year or less, at rates agreed at the inception of the contracts. The counterparty to this derivative transaction is a major financial institution with investment grade or better credit rating; however, the Company is exposed to credit risk with this institution. The credit risk is limited to the potential unrealized gains (which offset currency fluctuations adverse to the Company) in any such contract should this counterparty fail to perform as contracted. Any changes in the fair values of forward foreign currency exchange contracts are reflected in current period earnings and accounted for as an increase or offset to general and administrative expenses.
The following shows the effect of the Company’s derivative instruments on its consolidated statements of income:
|
Gain (Loss) Recognized within General and Administrative Expenses
|
||||||||||||
|
Derivatives Not Designated as
|
Years Ended March 31,
|
|||||||||||
|
Hedging Instruments
|
2018
|
2017
|
2016
|
|||||||||
|
Forward foreign currency exchange contracts
|
$
|
752,000
|
$
|
843,000
|
$
|
777,000
|
||||||
The fair value of the forward foreign currency exchange contracts of $1,179,000 and $427,000 are included in prepaid and other current assets in the accompanying consolidated balance sheets at March 31, 2018 and 2017, respectively.
14. Fair Value Measurements
The Company defines fair value as the price that would be received to sell an asset or paid to transfer a liability (an exit price) in the principal or most advantageous market for the asset or liability in an orderly transaction between market participants on the measurement date. The Company uses a three-tier valuation hierarchy based upon observable and unobservable inputs:
| • |
Level 1 — Valuation is based upon quoted prices (unadjusted) in active markets for identical assets or liabilities.
|
| • |
Level 2 — Valuation is based upon quoted prices for similar assets and liabilities in active markets, or other inputs that are observable for the asset or liability, either directly or indirectly, for substantially the full term of the financial instrument.
|
| • |
Level 3 — Valuation is based upon unobservable inputs that are significant to the fair value measurement.
|
The fair value hierarchy requires the use of observable market data when available. In instances in which the inputs used to measure fair value fall into different levels of the fair value hierarchy, the fair value measurement has been determined based on the lowest level input that is significant to the fair value measurement in its entirety. The Company’s assessment of the significance of a particular item to the fair value measurement in its entirety requires judgment, including the consideration of inputs specific to the asset or liability.
The following sets forth by level within the fair value hierarchy, the Company’s financial assets and liabilities that were accounted for at fair value on a recurring basis according to the valuation techniques the Company used to determine their fair values at:
|
March 31, 2018
|
March 31, 2017
|
|||||||||||||||||||||||||||||||
|
Fair Value Measurements
Using Inputs Considered as
|
Fair Value Measurements
Using Inputs Considered as
|
|||||||||||||||||||||||||||||||
|
Fair Value
|
Level 1
|
Level 2
|
Level 3
|
Fair Value
|
Level 1
|
Level 2
|
Level 3
|
|||||||||||||||||||||||||
|
Assets
|
||||||||||||||||||||||||||||||||
|
Short-term investments
|
||||||||||||||||||||||||||||||||
|
Mutual funds
|
$
|
2,828,000
|
$
|
2,828,000
|
-
|
-
|
$
|
2,140,000
|
$
|
2,140,000
|
-
|
-
|
||||||||||||||||||||
|
Prepaid expenses and other current assets
|
||||||||||||||||||||||||||||||||
|
Forward foreign currency exchange contracts
|
1,179,000
|
-
|
$
|
1,179,000
|
-
|
427,000
|
-
|
$
|
427,000
|
-
|
||||||||||||||||||||||
|
Liabilities
|
||||||||||||||||||||||||||||||||
|
Other current liabilities
|
||||||||||||||||||||||||||||||||
|
Deferred compensation
|
2,828,000
|
2,828,000
|
-
|
-
|
2,140,000
|
2,140,000
|
-
|
-
|
||||||||||||||||||||||||
|
Other liabilities
|
||||||||||||||||||||||||||||||||
|
Warrant liability
|
-
|
-
|
-
|
-
|
11,879,000
|
-
|
-
|
$
|
11,879,000
|
|||||||||||||||||||||||
Short-term Investments and Deferred Compensation
The Company’s short-term investments, which fund its deferred compensation liabilities, consist of investments in mutual funds. These investments are classified as Level 1 as the shares of these mutual funds trade with sufficient frequency and volume to enable the Company to obtain pricing information on an ongoing basis.
Forward Foreign Currency Exchange Contracts
The forward foreign currency exchange contracts are primarily measured based on the foreign currency spot and forward rates quoted by the banks or foreign currency dealers and classified as Level 2. During the years ended March 31, 2018 and 2017, gains of $752,000 and $843,000, respectively, were recorded in general and administrative expenses due to the change in the value of the forward foreign currency exchange contracts subsequent to entering into the contracts.
Level 3 Fair Value Measurements
The following summarizes the activity for Level 3 fair value measurements:
|
Years Ended March 31,
|
||||||||||||||||
|
2018
|
2017
|
|||||||||||||||
|
Supplier
Warrant
|
Contingent
Consideration
|
Supplier
Warrant
|
Contingent
Consideration
|
|||||||||||||
|
Beginning balance
|
$
|
11,879,000
|
$
|
-
|
$
|
15,643,000
|
$
|
330,000
|
||||||||
|
Newly issued
|
-
|
-
|
-
|
-
|
||||||||||||
|
Total (gain) loss included in net income
|
(2,313,000
|
)
|
-
|
(3,764,000
|
)
|
(16,000
|
)
|
|||||||||
|
Exercises/settlements (1)
|
(9,566,000
|
)
|
-
|
-
|
(314,000
|
)
|
||||||||||
|
Net transfers in (out) of Level 3
|
-
|
-
|
-
|
-
|
||||||||||||
|
Ending balance
|
$
|
-
|
$
|
-
|
$
|
11,879,000
|
$
|
-
|
||||||||
| (1) |
Represents the fair value of the Supplier Warrant as of the exercise date (see Note 11).
|
During the year ended March 31, 2018, the Company had no significant measurements of assets or liabilities at fair value on a nonrecurring basis subsequent to their initial recognition.
The carrying amounts of cash and cash equivalents, accounts receivable, accounts payable and accrued liabilities approximate their fair value due to the short-term nature of these instruments. The carrying amounts of the revolving loan, term loan and other long-term liabilities approximate their fair value based on current rates for instruments with similar characteristics.
15. Commitments and Contingencies
Operating Lease Commitments
The Company leases various facilities in North America and Asia under operating leases expiring through December 2032, which includes the 15-year lease for a new 410,000 square foot facility in Tijuana, Mexico. The Company also has short-term contracts of one year or less covering its third party warehouses that provide for contingent payments based on the level of sales that are processed through the third party warehouse.
The remaining future minimum rental payments under the above operating leases are as follows:
|
Year Ending March 31,
|
||||
|
2019
|
$
|
5,873,000
|
||
|
2020
|
4,437,000
|
|||
|
2021
|
4,501,000
|
|||
|
2022
|
4,360,000
|
|||
|
2023
|
3,066,000
|
|||
|
Thereafter
|
30,824,000
|
|||
|
Total minimum lease payments
|
$
|
53,061,000
|
||
During the years ended March 31, 2018, 2017 and 2016, the Company incurred total operating lease expenses of $4,362,000, $3,495,000 and $3,263,000, respectively.
Commitments to Provide Marketing Allowances under Long-Term Customer Contracts
The Company has or is renegotiating long-term agreements with many of its major customers. Under these agreements, which in most cases have initial terms of at least four years, the Company is designated as the exclusive or primary supplier for specified categories of the Company’s products. Because of the very competitive nature of the market and the limited number of customers for these products, the Company’s customers have sought and obtained price concessions, significant marketing allowances, and more favorable delivery and payment terms in consideration for the Company’s designation as a customer’s exclusive or primary supplier. These incentives differ from contract to contract and can include (i) the issuance of a specified amount of credits against receivables in accordance with a schedule set forth in the relevant contract, (ii) support for a particular customer’s research or marketing efforts provided on a scheduled basis, (iii) discounts granted in connection with each individual shipment of product, and (iv) other marketing, research, store expansion or product development support. These contracts typically require that the Company meet ongoing performance standards. The Company’s contracts with major customers expire at various dates through April 2021. While these longer-term agreements strengthen the Company’s customer relationships, the increased demand for the Company’s products often requires that the Company increase its inventories and personnel. Customer demands that the Company purchase their Remanufactured Core inventory also require the use of the Company’s working capital.
The marketing and other allowances the Company typically grants its customers in connection with its new or expanded customer relationships adversely impact the near-term revenues, profitability, and associated cash flows from these arrangements. Such allowances include sales incentives and concessions and typically consist of: (i) allowances which may only be applied against future purchases and are recorded as a reduction to revenues in accordance with a schedule set forth in the long-term contract, (ii) allowances related to a single exchange of product that are recorded as a reduction of revenues at the time the related revenues are recorded or when such incentives are offered, and (iii) allowances that are made in connection with the purchase of inventory from a customer.
The following summarizes the breakout of allowances discussed above, recorded as a reduction to revenues:
|
Years Ended March 31,
|
||||||||||||
|
2018
|
2017
|
2016
|
||||||||||
|
Allowances incurred under long-term customer contracts
|
$
|
24,829,000
|
$
|
23,684,000
|
$
|
29,845,000
|
||||||
|
Allowances related to a single exchange of product
|
79,813,000
|
67,262,000
|
47,451,000
|
|||||||||
|
Allowances related to core inventory purchase obligations
|
2,545,000
|
5,470,000
|
2,268,000
|
|||||||||
|
Total customer allowances recorded as a reduction of revenues
|
$
|
107,187,000
|
$
|
96,416,000
|
$
|
79,564,000
|
||||||
The following presents the Company’s commitments to incur allowances, excluding allowances related to a single exchange of product, which will be recognized as a charge against revenue, and customer Remanufactured Core purchase obligations, which will be recognized in accordance with the terms of the relevant long-term customer contracts:
|
Year Ending March 31,
|
||||
|
2019
|
$
|
30,154,000
|
||
|
2020
|
21,927,000
|
|||
|
2021
|
16,982,000
|
|||
|
2022
|
113,000
|
|||
|
Total marketing allowances
|
$
|
69,176,000
|
||
16. Significant Customer and Other Information
Significant Customer Concentrations
The Company’s largest customers accounted for the following total percentage of net sales:
|
Years Ended March 31,
|
||||||||||||
|
2018
|
2017
|
2016
|
||||||||||
|
Customer A
|
41
|
%
|
44
|
%
|
48
|
%
|
||||||
|
Customer B
|
24
|
%
|
20
|
%
|
18
|
%
|
||||||
|
Customer C
|
19
|
%
|
19
|
%
|
21
|
%
|
||||||
|
Customer D
|
4
|
%
|
4
|
%
|
3
|
%
|
||||||
The Company’s largest customers accounted for the following total percentage of accounts receivable — trade at March 31:
|
2018
|
2017
|
|||||||
|
Customer A
|
36
|
%
|
33
|
%
|
||||
|
Customer B
|
16
|
%
|
18
|
%
|
||||
|
Customer C
|
22
|
%
|
12
|
%
|
||||
|
Customer D
|
5
|
%
|
16
|
%
|
||||
Geographic and Product Information
The Company’s products are predominantly sold in the U.S. and accounted for the following total percentage of net sales:
|
Years Ended March 31,
|
||||||||||||
|
2018
|
2017
|
2016
|
||||||||||
|
Rotating electrical products
|
78
|
%
|
78
|
%
|
78
|
%
|
||||||
|
Wheel hub products
|
17
|
%
|
19
|
%
|
20
|
%
|
||||||
|
Brake master cylinders products
|
2
|
%
|
3
|
%
|
2
|
%
|
||||||
|
Other products
|
3
|
%
|
-
|
%
|
-
|
%
|
||||||
|
100
|
%
|
100
|
%
|
100
|
%
|
|||||||
Significant Supplier Concentrations
No suppliers accounted for more than 10% of the Company’s inventory purchases for the years ended March 31, 2018, 2017 and 2016.
17. Income Taxes
On December 22, 2017, comprehensive tax reform legislation known as the Tax Cuts and Jobs Act (the “Tax Reform Act”) was signed into law. The Tax Reform Act amends the Internal Revenue Code to reduce U.S. tax rates and modify policies, credits and deductions for individuals and businesses. The effects of the Tax Reform Act on the Company are as follows:
Remeasurement of Deferred Taxes
The Tax Reform Act permanently reduces the U.S. federal corporate income tax rate from 35% to 21%, effective for tax years beginning after 2017. GAAP requires an adjustment to deferred taxes as a result of a change in the corporate tax rate in the period that the change is enacted, with the change recorded to the current year tax provision. Accordingly, the Company has remeasured its deferred tax assets and liabilities at the new tax rate and recorded a one-time noncash tax charge of $4,863,000 to deferred income taxes for the year ended March 31, 2018. This charge is reflected in the Company’s increased effective tax rate for the year.
Mandatory Transition Tax
In connection with the move by the U.S. to a partial territorial tax system, the Tax Reform Act provides for the exclusion of foreign-sourced dividends received by a U.S. corporation from its foreign-owned corporations beginning in 2018. In addition, the Tax Reform Act imposes a toll charge in 2017 on the deemed repatriation of a U.S. shareholder’s pro-rata share of certain foreign subsidiaries’ post-1986 accumulated earnings. The toll charge assesses an effective tax rate of 15.5% on cash and other liquid assets of U.S.-owned foreign corporations, while subjecting all other property of such corporations to an effective tax rate of 8.0%, and allows for available foreign tax credits to reduce the resulting toll charge. Taxpayers may elect to pay this tax liability over eight years on an interest-free basis. The Company has accrued an estimated toll charge liability of $530,000, reflected in current taxes payable as of March 31, 2018.
Executive Compensation
The Tax Reform Act maintains the $1,000,000 limitation on deductible compensation to cover employees. However, it eliminates the current exception for performance-based compensation and expands the definition of covered employees to include the chief financial officer. The expansion of executive compensation limitations are effective in 2018. The modifications do not apply to remuneration paid pursuant to a written binding contract in effect on November 2, 2017 if it was not materially modified on or after that date.
As a result of the Tax Reform Act, the SEC provided guidance (Staff Accounting Bulletin 118 (“SAB 118”)) that allows public companies to record provisional amounts for those impacts, with the requirement that the accounting be completed in a period not to exceed one year from the date of enactment. As of March 31, 2018, the Company has not completed the accounting for the tax effects of the Tax Reform Act. Therefore, the Company has recorded provisional amounts for the effects of the Tax Reform Act, including but not limited to, the following primary impacts of the Tax Reform Act: remeasurement of deferred tax assets and liabilities and the estimated calculation of the one-time mandatory transition tax on undistributed earnings of foreign affiliates.
The income tax expense is as follows:
|
Years Ended March 31,
|
||||||||||||
|
2018
|
2017
|
2016
|
||||||||||
|
Current tax expense
|
||||||||||||
|
Federal
|
$
|
12,153,000
|
$
|
9,451,000
|
$
|
12,400,000
|
||||||
|
State
|
1,406,000
|
318,000
|
1,995,000
|
|||||||||
|
Foreign
|
1,215,000
|
1,455,000
|
803,000
|
|||||||||
|
Total current tax expense
|
14,774,000
|
11,224,000
|
15,198,000
|
|||||||||
|
Deferred tax expense (benefit)
|
||||||||||||
|
Federal
|
2,779,000
|
4,291,000
|
(2,929,000
|
)
|
||||||||
|
State
|
333,000
|
2,174,000
|
(757,000
|
)
|
||||||||
|
Foreign
|
(23,000
|
)
|
(384,000
|
)
|
(33,000
|
)
|
||||||
|
Total deferred tax expense (benefit)
|
3,089,000
|
6,081,000
|
(3,719,000
|
)
|
||||||||
|
Total income tax expense
|
$
|
17,863,000
|
$
|
17,305,000
|
$
|
11,479,000
|
||||||
Deferred income taxes consist of the following at March 31:
|
2018
|
2017
|
|||||||
|
Assets
|
||||||||
|
Accounts receivable valuation
|
$
|
3,915,000
|
$
|
4,697,000
|
||||
|
Allowance for customer incentives
|
2,038,000
|
2,894,000
|
||||||
|
Inventory obsolescence reserve
|
1,666,000
|
1,608,000
|
||||||
|
Stock options
|
1,728,000
|
1,971,000
|
||||||
|
Intangibles, net
|
59,000
|
339,000
|
||||||
|
Estimate for returns
|
1,115,000
|
3,191,000
|
||||||
|
Accrued compensation
|
1,152,000
|
1,785,000
|
||||||
|
Net operating losses
|
1,079,000
|
834,000
|
||||||
|
Tax credits
|
1,363,000
|
-
|
||||||
|
Other
|
2,091,000
|
2,065,000
|
||||||
|
Total deferred tax assets
|
$
|
16,206,000
|
$
|
19,384,000
|
||||
|
Liabilities
|
||||||||
|
Property and equipment, net
|
(1,025,000
|
)
|
(1,605,000
|
)
|
||||
|
Other
|
(3,072,000
|
)
|
(4,413,000
|
)
|
||||
|
Total deferred tax liabilities
|
$
|
(4,097,000
|
)
|
$
|
(6,018,000
|
)
|
||
|
Less valuation allowance
|
$
|
(1,779,000
|
)
|
$
|
-
|
|||
|
Net deferred tax assets
|
$
|
10,330,000
|
$
|
13,366,000
|
||||
|
Net long-term deferred income tax liability
|
(226,000
|
)
|
(180,000
|
)
|
||||
|
Net long-term deferred income tax asset
|
10,556,000
|
13,546,000
|
||||||
|
Total
|
$
|
10,330,000
|
$
|
13,366,000
|
||||
At March 31, 2018, the Company had state net operating loss carryforwards of $932,000. The net operating loss carryforwards expire between fiscal years 2022 and 2036.
Realization of deferred tax assets is dependent upon the Company’s ability to generate sufficient future taxable income. Significant judgment is required in determining the Company’s provision for income taxes, deferred tax assets and liabilities and any valuation allowance recorded against the Company’s net deferred tax assets. The Company makes these estimates and judgments about its future taxable income that are based on assumptions that are consistent with the Company’s future plans. A valuation allowance is established when the Company believes it is not more likely than not all or some of a deferred tax assets will be realized. In evaluating the Company’s ability to recover deferred tax assets within the jurisdiction in which they arise, the Company considers all available positive and negative evidence. Deferred tax assets arising primarily as a result of net operating loss carry-forwards and research and development credits in connection with the Company’s July 2017 acquisition have been offset completely by a valuation allowance due to the uncertainty of their utilization in future periods. Should the actual amount differ from the Company’s estimates, the amount of the valuation allowance could be impacted.
For the years ended March 31, 2018, 2017, and 2016, the primary components of the Company’s income tax expense were (i) the impact of the changes as a result of the Tax Reform Act, (ii) foreign income taxed at rates that are different from the federal statutory rate, (iii) non-deductible expenses in connection with the fair value adjustments on the warrants, (iv) impact of the non-deductible executive compensation under Internal Revenue Code Section 162(m), (v) the impact of uncertain tax positions, (vi) the change in the blended state rate, and (vii) the excess tax benefit relating to share-based compensation.
The difference between the income tax expense at the federal statutory rate and the Company’s effective tax rate is as follows:
|
Years Ended March 31,
|
||||||||||||
|
2018
|
2017
|
2016
|
||||||||||
|
Statutory federal income tax rate
|
31.5
|
%
|
35.0
|
%
|
35.0
|
%
|
||||||
|
State income tax rate, net of federal benefit
|
3.3
|
%
|
2.2
|
%
|
4.0
|
%
|
||||||
|
Excess tax benefit from stock compensation
|
(0.7
|
)%
|
(1.4
|
)%
|
-
|
%
|
||||||
|
Foreign income taxed at different rates
|
(2.6
|
)%
|
(0.7
|
)%
|
(0.8
|
)%
|
||||||
|
Warrants
|
(2.1
|
)%
|
(2.4
|
)%
|
8.2
|
%
|
||||||
|
Non-deductible executive compensation
|
1.0
|
%
|
0.8
|
%
|
2.2
|
%
|
||||||
|
Change in valuation allowance
|
4.9
|
%
|
-
|
%
|
-
|
%
|
||||||
|
Effects of mandatory redeemed repatriation
|
1.6
|
%
|
-
|
%
|
-
|
%
|
||||||
|
Effects of U.S. tax rate changes
|
14.2
|
%
|
-
|
%
|
-
|
%
|
||||||
|
Uncertain Tax Positions
|
0.6
|
%
|
(0.2
|
)%
|
0.4
|
%
|
||||||
|
Other income tax
|
0.6
|
%
|
(1.8
|
)%
|
3.1
|
%
|
||||||
|
52.3
|
%
|
31.5
|
%
|
52.1
|
%
|
|||||||
The Company and its subsidiaries file income tax returns in the U.S. federal jurisdiction and various state and foreign jurisdictions with varying statutes of limitations. At March 31, 2018, the Company is not under examination in any jurisdiction and the years ended March 31, 2017, 2016, and 2015 remain subject to examination. The Company believes no significant changes in the unrecognized tax benefits will occur within the next 12 months.
A reconciliation of the beginning and ending amount of unrecognized tax benefits is as follows:
|
Years Ended March 31,
|
||||||||||||
|
2018
|
2017
|
2016
|
||||||||||
|
Balance at beginning of period
|
$
|
1,092,000
|
$
|
1,181,000
|
$
|
1,117,000
|
||||||
|
Additions based on tax positions related to the current year
|
234,000
|
141,000
|
57,000
|
|||||||||
|
Additions for tax positions of prior year
|
-
|
106,000
|
217,000
|
|||||||||
|
Reductions for tax positions of prior year
|
(107,000
|
)
|
-
|
(210,000
|
)
|
|||||||
|
Settlements
|
-
|
(336,000
|
)
|
-
|
||||||||
|
Balance at end of period
|
$
|
1,219,000
|
$
|
1,092,000
|
$
|
1,181,000
|
||||||
At March 31, 2018, 2017 and 2016, there are $1,054,000, $840,000 and $678,000 of unrecognized tax benefits that if recognized would affect the annual effective tax rate.
The Company recognizes interest and penalties accrued related to unrecognized tax benefits as part of income tax expense. During the years ended March 31, 2018, 2017, and 2016, the Company recognized approximately $5,000, $51,000, and $34,000 in interest and penalties. The Company had approximately $146,000 and $141,000 for the payment of interest and penalties accrued at March 31, 2018 and 2017, respectively.
18. Defined Contribution Plans
The Company has a 401(k) plan covering all employees who are 21 years of age with at least six months of service. The plan permits eligible employees to make contributions up to certain limitations, with the Company matching 50% of each participating employee’s contribution up to the first 6% of employee compensation. Employees are immediately vested in their voluntary employee contributions and vest in the Company’s matching contributions ratably over five years. The Company’s matching contribution to the 401(k) plan was $389,000, $353,000, and $347,000 for the years ended March 31, 2018, 2017, and 2016, respectively.
19. Share-based Payments
At March 31, 2018, there were 342,000 shares of the Company’s common stock reserved for grants to the Company’s non-employee directors under the 2014 Non-Employee Director Incentive Award Plan (the “2014 Plan”). Under the 2014 Plan, (i) 35,659 and 37,383 of restricted stock units were issued and (ii) 236,976 and 263,078 shares of common stock were available for grant under this plan at March 31, 2018 and 2017, respectively.
At March 31, 2018, there were 3,950,000 shares of common stock reserved for grant to all employees of the Company under the 2010 Incentive Award Plan (the “2010 Plan”). Under the 2010 Plan, (i) 98,169 and 88,894 shares of restricted stock units were outstanding, (ii) options to purchase 1,046,298 and 898,009 shares of common stock were outstanding, and (iii) 1,573,810 and 688,765 shares of common stock were available for grant at March 31, 2018 and 2017, respectively.
In addition, at March 31, 2018 and 2017, options to purchase 97,000 and 128,000 shares of common stock, respectively, were outstanding under the 2004 Non-Employee Director Stock Option Plan. There were no options outstanding to purchase common stock under the 2003 Long-Term Incentive Plan at March 31, 2018 and options to purchase 10,350 shares of common stock were outstanding under this plan at March 31, 2017. No options remain available for grant under these plans.
The shares of common stock issued upon exercise of a previously granted stock option are considered new issuances from shares reserved for issuance upon adoption of the various plans. The Company requires that the option holders provide a written notice of exercise to the stock plan administrator and payment for the shares prior to issuance of the shares.
Stock Options
The following is a summary of stock option activity during the year:
|
Number of
Shares
|
Weighted Average
Exercise Price
|
|||||||
|
Outstanding at March 31, 2016
|
1,036,359
|
$
|
14.92
|
|||||
|
Granted
|
170,890
|
$
|
27.27
|
|||||
|
Exercised
|
(55,351
|
)
|
$
|
8.65
|
||||
|
Forfeited
|
(8,600
|
)
|
$
|
28.92
|
||||
|
Outstanding at March 31, 2017
|
1,143,298
|
$
|
16.97
|
|||||
At March 31, 2018, options to purchase 325,274 shares of common stock were unvested at the weighted average exercise price of $28.23.
Based on the market value of the Company’s common stock at March 31, 2018, 2017, and 2016, the pre-tax intrinsic value of options exercised was $913,000, $2,477,000, and $14,002,000, respectively. The total fair value of stock options vested during the years ended March 31, 2018, 2017, and 2016 was $1,572,000, $1,290,000, and $905,000, respectively.
The following summarizes information about the options outstanding at March 31, 2018:
|
Options Outstanding
|
Options Exercisable
|
||||||||||||||||||||||||
|
Range of
Exercise price
|
Shares
|
Weighted
Average
Exercise
Price
|
Weighted
Average
Remaining
Life
In Years
|
Aggregate
Intrinsic
Value
|
Shares
|
Weighted
Average
Exercise
Price
|
Aggregate
Intrinsic
Value
|
||||||||||||||||||
|
$4.17 to $6.25
|
49,000
|
$
|
4.87
|
1.35
|
49,000
|
$
|
4.87
|
||||||||||||||||||
|
$6.26 to $7.43
|
354,534
|
6.48
|
4.70
|
354,534
|
6.48
|
||||||||||||||||||||
|
$7.44 to $19.94
|
211,132
|
9.86
|
5.23
|
211,132
|
9.86
|
||||||||||||||||||||
|
$19.95 to $34.17
|
528,632
|
27.96
|
8.12
|
203,358
|
27.54
|
||||||||||||||||||||
|
1,143,298
|
$
|
16.97
|
6.24
|
$ |
8,555,000
|
818,024
|
$
|
12.49
|
$ |
8,555,000
|
|||||||||||||||
The aggregate intrinsic values in the above table represent the pre-tax value of all in-the-money options if all such options had been exercised on March 31, 2018 based on the Company’s closing stock price of $21.43 as of that date.
At March 31, 2018, there was $2,795,000 of total unrecognized compensation expense from stock-based compensation granted under the plans, which is related to non-vested shares. The compensation expense is expected to be recognized over a weighted average vesting period of 1.7 years.
Restricted Stock Units (“RSUs”)
During the years ended March 31, 2018 and 2017, the Company granted 77,854 and 62,637 shares of RSUs, respectively, with an estimated grant date fair value of $2,157,000 and $1,774,000, respectively, which was based on the closing market price on the date of grant. The fair value related to these awards is recognized as compensation expense over the vesting period. These awards generally vest in three equal installments beginning each anniversary from the grant date, subject to continued employment. Upon vesting, these awards may be net share settled to cover the required withholding tax with the remaining amount converted into an equivalent number of shares of common stock. Total shares withheld during the years ended March 31, 2018 and 2017 were 21,361 and 36,586, respectively, and was based on the value of these awards as determined by the Company’s closing stock price on the vesting date.
The following is a summary of changes in the status of non-vested RSUs during the year:
|
Number of
Shares
|
Weighted Average
Grant Date Fair
Value
|
|||||||
|
Non-vested at March 31, 2017
|
126,277
|
$
|
28.26
|
|||||
|
Granted
|
77,854
|
$
|
27.70
|
|||||
|
Vested
|
(68,869
|
)
|
$
|
27.41
|
||||
|
Forfeited
|
(1,434
|
)
|
$
|
28.37
|
||||
|
Non-vested at March 31, 2018
|
133,828
|
$
|
28.37
|
|||||
As of March 31, 2018, there was $2,648,000 of unrecognized compensation expense related to these awards, which will be recognized over the remaining vesting period of approximately 1.9 years.
20. Litigation
The Company is subject to various lawsuits and claims. In addition, government agencies and self-regulatory organizations have the ability to conduct periodic examinations of and administrative proceedings regarding the Company’s business. Management does not believe that the outcome of these other matters will have a material adverse effect on its financial position or future results of operations.
21. Share Repurchase Program
As of March 31, 2018, the Company’s board of directors had approved a stock repurchase program of up to $20,000,000 of its common stock. As of March 31, 2018, $11,630,000 of the $20,000,000 had been utilized and $8,370,000 remained available to repurchase shares under the authorized share repurchase program, subject to the limit in the Company’s credit facility. The Company retired the 511,746 shares repurchased under this program through March 31, 2018. The Company’s share repurchase program does not obligate it to acquire any specific number of shares and shares may be repurchased in privately negotiated and/or open market transactions.
22. Accumulated Other Comprehensive Income (Loss)
The following summarizes the changes in accumulated other comprehensive income (loss) for the years ended March 31:
|
2018
|
2017
|
|||||||||||||||||||||||
|
Unrealized
Gain
on Short-Term
Investments
|
Foreign
Currency
Translation
|
Total
|
Unrealized
Gain
on Short-Term
Investments
|
Foreign
Currency
Translation
|
Total
|
|||||||||||||||||||
|
Beginning balance
|
$
|
528,000
|
$
|
(7,969,000
|
)
|
$
|
(7,441,000
|
)
|
$
|
332,000
|
$
|
(5,184,000
|
)
|
$
|
(4,852,000
|
)
|
||||||||
|
Other comprehensive income (loss), net of tax
|
218,000
|
1,795,000
|
2,013,000
|
196,000
|
(2,785,000
|
)
|
(2,589,000
|
)
|
||||||||||||||||
|
Amounts reclassified from other comprehensive income (loss), net of tax
|
-
|
-
|
-
|
-
|
-
|
-
|
||||||||||||||||||
|
Ending balance
|
$
|
746,000
|
$
|
(6,174,000
|
)
|
$
|
(5,428,000
|
)
|
$
|
528,000
|
$
|
(7,969,000
|
)
|
$
|
(7,441,000
|
)
|
||||||||
23. Subsequent Events
Credit Facility
On June 5, 2018 the Company entered into an Amended and Restated Credit Facility (the “New Credit Facility”), with the lenders party thereto, and PNC Bank, National Association, as administrative agent, consisting of (i) a $200,000,000 revolving loan facility, subject to borrowing base restrictions, a $20,000,000 sublimit for borrowings by Canadian borrowers, and a $15,000,000 sublimit for letters of credit (the “New Revolving Facility) and (ii) a $30,000,000 term loan facility (the “New Term Loans”). The loans under the New Credit Facility mature on June 5, 2023. In connection with the New Credit Facility, the lenders were granted a security interest in substantially all of the assets of the Company.
24. Unaudited Quarterly Financial Data
The following summarizes selected quarterly financial data for the year ended March 31, 2018.
|
First
Quarter
|
Second
Quarter
|
Third
Quarter
|
Fourth
Quarter
|
|||||||||||||
|
Net sales
|
$
|
95,063,000
|
$
|
111,774,000
|
$
|
100,127,000
|
$
|
121,108,000
|
||||||||
|
Cost of goods sold
|
69,224,000
|
84,612,000
|
77,583,000
|
90,780,000
|
||||||||||||
|
Gross profit
|
25,839,000
|
27,162,000
|
22,544,000
|
30,328,000
|
||||||||||||
|
Operating expenses:
|
||||||||||||||||
|
General and administrative
|
6,187,000
|
8,615,000
|
11,915,000
|
8,810,000
|
||||||||||||
|
Sales and marketing
|
3,394,000
|
3,457,000
|
4,048,000
|
4,131,000
|
||||||||||||
|
Research and development
|
1,002,000
|
1,240,000
|
1,678,000
|
1,772,000
|
||||||||||||
|
Total operating expenses
|
10,583,000
|
13,312,000
|
17,641,000
|
14,713,000
|
||||||||||||
|
Operating income
|
15,256,000
|
13,850,000
|
4,903,000
|
15,615,000
|
||||||||||||
|
Other expense:
|
||||||||||||||||
|
Interest expense, net
|
3,314,000
|
3,522,000
|
3,953,000
|
4,656,000
|
||||||||||||
|
Income before income tax expense
|
11,942,000
|
10,328,000
|
950,000
|
10,959,000
|
||||||||||||
|
Income tax expense
|
4,316,000
|
4,027,000
|
7,756,000
|
1,764,000
|
||||||||||||
|
Net income (loss)
|
$
|
7,626,000
|
$
|
6,301,000
|
$
|
(6,806,000
|
)
|
$
|
9,195,000
|
|||||||
|
Basic net income (loss) per share
|
$
|
0.41
|
$
|
0.34
|
$
|
(0.36
|
)
|
$
|
0.48
|
|||||||
|
Diluted net income (loss) per share
|
$
|
0.39
|
$
|
0.33
|
$
|
(0.36
|
)
|
$
|
0.47
|
|||||||
The following summarizes selected quarterly financial data for the year ended March 31, 2017:
|
First
Quarter
|
Second
Quarter
|
Third
Quarter
|
Fourth
Quarter
|
|||||||||||||
|
Net sales
|
$
|
85,412,000
|
$
|
108,836,000
|
$
|
112,595,000
|
$
|
114,410,000
|
||||||||
|
Cost of goods sold
|
65,021,000
|
78,178,000
|
80,225,000
|
82,783,000
|
||||||||||||
|
Gross profit
|
20,391,000
|
30,658,000
|
32,370,000
|
31,627,000
|
||||||||||||
|
Operating expenses:
|
||||||||||||||||
|
General and administrative
|
3,625,000
|
9,869,000
|
7,952,000
|
9,678,000
|
||||||||||||
|
Sales and marketing
|
2,634,000
|
2,707,000
|
3,234,000
|
3,551,000
|
||||||||||||
|
Research and development
|
869,000
|
905,000
|
1,039,000
|
1,011,000
|
||||||||||||
|
Total operating expenses
|
7,128,000
|
13,481,000
|
12,225,000
|
14,240,000
|
||||||||||||
|
Operating income
|
13,263,000
|
17,177,000
|
20,145,000
|
17,387,000
|
||||||||||||
|
Other expense:
|
||||||||||||||||
|
Interest expense, net
|
2,819,000
|
3,189,000
|
3,357,000
|
3,729,000
|
||||||||||||
|
Income before income tax expense
|
10,444,000
|
13,988,000
|
16,788,000
|
13,658,000
|
||||||||||||
|
Income tax expense
|
2,936,000
|
4,845,000
|
5,678,000
|
3,846,000
|
||||||||||||
|
Net income
|
$
|
7,508,000
|
$
|
9,143,000
|
$
|
11,110,000
|
$
|
9,812,000
|
||||||||
|
Basic net income per share
|
$
|
0.40
|
$
|
0.49
|
$
|
0.59
|
$
|
0.53
|
||||||||
|
Diluted net income per share
|
$
|
0.39
|
$
|
0.47
|
$
|
0.57
|
$
|
0.50
|
||||||||
Quarterly and year-to-date computations of per share amounts are made independently. Therefore, the sum of per share amounts for the quarters may not agree with per share amounts for the year shown elsewhere in the Annual Report on Form 10-K.
Schedule II — Valuation and Qualifying Accounts
Accounts Receivable — Allowance for doubtful accounts
|
Years Ended
March 31,
|
Description
|
Balance at
beginning of
period
|
Charge to
(recovery of)
bad debts
expense
|
Acquisition
|
Amounts
written off
|
Balance at
end of
period
|
||||||||||||||||
|
2018
|
Allowance for doubtful accounts
|
$
|
4,140,000
|
$
|
21,000
|
$
|
-
|
$
|
19,000
|
$
|
4,142,000
|
|||||||||||
|
2017
|
Allowance for doubtful accounts
|
$
|
4,284,000
|
$
|
3,000
|
$
|
-
|
$
|
147,000
|
$
|
4,140,000
|
|||||||||||
|
2016
|
Allowance for doubtful accounts
|
$
|
629,000
|
$
|
4,404,000
|
$
|
-
|
$
|
749,000
|
$
|
4,284,000
|
|||||||||||
Accounts Receivable — Allowance for customer-payment discrepancies
|
Years Ended
March 31,
|
Description
|
Balance at
beginning of
period
|
Charge to
(recovery of)
discrepancies
expense
|
Acquisition
|
Amounts
Processed
|
Balance at
end of
period
|
||||||||||||||||
|
2018
|
Allowance for customer-payment discrepancies
|
$
|
751,000
|
$
|
998,000
|
$
|
-
|
$
|
639,000
|
$
|
1,110,000
|
|||||||||||
|
2017
|
Allowance for customer-payment discrepancies
|
$
|
703,000
|
$
|
718,000
|
$
|
-
|
$
|
670,000
|
$
|
751,000
|
|||||||||||
|
2016
|
Allowance for customer-payment discrepancies
|
$
|
852,000
|
$
|
(299,000
|
)
|
$
|
-
|
$
|
(150,000
|
)
|
$
|
703,000
|
|||||||||
Inventory — Allowance for excess and obsolete inventory
|
Years Ended
March 31,
|
Description
|
Balance at
beginning of
period
|
Provision for
excess and
obsolete
inventory
|
Acquisition
|
Amounts
written off
|
Balance at
end of
period
|
||||||||||||||||
|
2018
|
Allowance for excess and obsolete inventory
|
$
|
4,125,000
|
$
|
8,491,000
|
$
|
77,000
|
(1)
|
$
|
6,011,000
|
$
|
6,682,000
|
||||||||||
|
2017
|
Allowance for excess and obsolete inventory
|
$
|
3,626,000
|
$
|
3,864,000
|
$
|
-
|
$
|
3,365,000
|
$
|
4,125,000
|
|||||||||||
|
2016
|
Allowance for excess and obsolete inventory
|
$
|
2,675,000
|
$
|
4,518,000
|
$
|
-
|
$
|
3,567,000
|
$
|
3,626,000
|
|||||||||||
| (1) |
Allowance for excess and obsolete inventory established in the opening balance sheet in connection with the Company’s July 2017 acquisition.
|
S-1