Attached files
| file | filename |
|---|---|
| EX-31.2 - EX 31.2 - SUPERVALU INC | f18form10-kaex312.htm |
| EX-31.1 - EX 31.1 - SUPERVALU INC | f18form10-kaex311.htm |
UNITED STATES
SECURITIES AND EXCHANGE COMMISSION
Washington, D.C. 20549
FORM 10-K/A
(Amendment No. 1)
(Mark One)
ý | ANNUAL REPORT PURSUANT TO SECTION 13 OR 15(d) OF THE SECURITIES EXCHANGE ACT OF 1934 |
For the fiscal year ended February 24, 2018
OR
¨ | TRANSITION REPORT PURSUANT TO SECTION 13 OR 15(d) OF THE SECURITIES EXCHANGE ACT OF 1934 |
For the transition period from to .
Commission file number: 1-5418

SUPERVALU INC.
(Exact name of registrant as specified in its charter)
DELAWARE | 41-0617000 | |
(State or other jurisdiction of incorporation or organization) | (I.R.S. Employer Identification No.) | |
11840 VALLEY VIEW ROAD EDEN PRAIRIE, MINNESOTA | 55344 | |
(Address of principal executive offices) | (Zip Code) | |
Registrant’s telephone number, including area code: (952) 828-4000
Securities registered pursuant to Section 12(b) of the Act:
Title of each class | Name of each exchange on which registered | |
Common Stock, par value $0.01 per share | New York Stock Exchange | |
Securities registered pursuant to Section 12(g) of the Act: None
Indicate by check mark if the registrant is a well-known seasoned issuer, as defined in Rule 405 of the Securities Act. Yes ý No ¨
Indicate by check mark if the registrant is not required to file reports pursuant to Section 13 or Section 15(d) of the Act. Yes ¨ No ý
Indicate by check mark whether the registrant (1) has filed all reports required to be filed by Section 13 or 15(d) of the Securities Exchange Act of 1934 during the preceding 12 months (or for such shorter period that the registrant was required to file such reports), and (2) has been subject to such filing requirements for the past 90 days. Yes ý No ¨
Indicate by check mark whether the registrant has submitted electronically and posted on its corporate Web site, if any, every Interactive Data File required to be submitted and posted pursuant to Rule 405 of Regulation S-T (§232.405 of this chapter) during the preceding 12 months (or for such shorter period that the registrant was required to submit and post such files). Yes ý No ¨
Indicate by check mark if disclosure of delinquent filers pursuant to Item 405 of Regulation S-K (§229.405 of this chapter) is not contained herein, and will not be contained, to the best of registrant’s knowledge, in definitive proxy or information statements incorporated by reference in Part III of this Form 10-K or any amendment to this Form 10-K. ý
Indicate by check mark whether the registrant is a large accelerated filer, an accelerated filer, a non-accelerated filer, smaller reporting company, or an emerging growth company. See the definitions of “large accelerated filer,” “accelerated filer” and “smaller reporting company” and “emerging growth company” in Rule 12b-2 of the Exchange Act.
Large accelerated filer x | Accelerated filer ¨ | Non-accelerated filer ¨ | Smaller reporting company ¨ | Emerging growth company ¨ | ||||
If an emerging growth company, indicate by check mark if the registrant has elected not to use extended transition period for complying with any new or revised financial accounting standards provided pursuant to Section 13(a) of the Exchange Act. ¨
Indicate by check mark if the registrant is a shell company (as defined in Rule 12b-2 of the Exchange Act). Yes ¨ No ý
The aggregate market value of the voting and non-voting stock held by non-affiliates of the registrant as of September 8, 2017 was approximately $750,406,810 (based upon the closing price of registrant’s Common Stock on the New York Stock Exchange).
As of April 20, 2018, there were 38,405,453 shares of the registrant’s common stock outstanding.
DOCUMENTS INCORPORATED BY REFERENCE
None.
EXPLANATORY NOTE
SUPERVALU INC. (“Supervalu”) is filing this Amendment No. 1 to Annual Report on Form 10-K (this “Amendment”) to amend the Annual Report on Form 10-K for the fiscal year ended February 24, 2018 (File Number 001-05418) (the “Form 10-K”) as filed by Supervalu with the U.S. Securities and Exchange Commission (the “SEC”) on April 24, 2018. This Amendment is being filed solely to provide the information required by Part III of Form 10-K. In connection with the filing of this Amendment and pursuant to the rules of the SEC, we are including with this Amendment certain currently dated certifications of Supervalu’s principal executive officer and principal financial officer.
This Amendment does not modify or update the other disclosures presented in the Form 10-K. Except as expressly provided herein, this Amendment does not reflect events occurring after the filing of the original Form 10-K (i.e., those events occurring after April 24, 2018) or modify or update those disclosures that may be affected by subsequent events. Accordingly, this Amendment should be read in conjunction with the Form 10-K and Supervalu’s other filings with the SEC.
2
SUPERVALU INC.
Annual Report on Form 10-K/A (Amendment No. 1)
TABLE OF CONTENTS
Item | Page | |
10. | ||
11. | ||
12. | ||
13. | ||
14. | ||
15. | ||
2
BASIS OF PRESENTATION
Unless otherwise indicated, all references to “Supervalu,” “we,” “us,” “our,” “ourselves” and the “Company” relate to SUPERVALU INC. and its wholly and majority-owned subsidiaries unless the context indicates otherwise.
PART III
ITEM 10. DIRECTORS, EXECUTIVE OFFICERS AND CORPORATE GOVERNANCE
The following sets forth information concerning members of the the Board of Directors:
 | Donald R. Chappel, Chairman Director Since: 2010 Independent Age: 66 • Supervalu Committees: Corporate Governance and Nominating Committee• Retired Senior Vice President and Chief Financial Officer of The Williams Companies, Inc.• Former director of the general partner of Williams PartnersMr. Chappel is the retired Senior Vice President and Chief Financial Officer of The Williams Companies, Inc., a position he held from April 2003 until his retirement in November 2017. Williams is one of the leading energy infrastructure companies in North America. Williams owns an approximate 74% interest in Williams Partners L.P. (“Williams Partners”), including all of the general partnership interest. Williams Partners is a large-cap master limited partnership (“MLP”) with operations across the natural gas value chain from gathering, processing and interstate transportation of natural gas and natural gas liquids to petchem production of ethylene, propylene and other olefins. Williams Partners was formerly known as Access Midstream Partners, L.P. and in February 2015 merged with another energy infrastructure MLP controlled by Williams also known as Williams Partners L.P. (“Pre-Merger Williams Partners”). Access Midstream Partners was the surviving entity in the merger and changed its name to Williams Partners L.P. Mr. Chappel served as a director of the general partner of Williams Partners from 2012, and as its Chief Financial Officer from December 31, 2014, until his retirement in November 2017. Mr. Chappel served as Chief Financial Officer and a director of the general partner of Pre-Merger Williams Partners from 2005 until its merger in 2015. Mr. Chappel was Chief Financial Officer, from 2007, and a director, from 2008, of the general partner of Williams Pipeline Partners L.P., until its merger with Pre-Merger Williams Partners in 2010. Williams Pipeline Partners L.P. was an energy pipeline MLP formed and controlled by Williams. Prior to joining Williams, Mr. Chappel held various financial, administrative and operational leadership positions. Mr. Chappel is included in Institutional Investor magazine’s Best CFOs listing for 2006 to 2008 and 2010 to 2014. Among his many qualifications, Mr. Chappel brings significant experience in finance and accounting as a senior finance executive of several large public companies. Mr. Chappel serves as a director of two non-profit organizations, The Children’s Hospital Foundation at St. Francis and Family & Children’s Services of Oklahoma. |
3
 | Irwin S. Cohen Director Since: 2003 Independent Age: 77 • Supervalu Committees: Audit Committee (Chair) • Retired Partner of Deloitte & Touche LLP• Founder of Deloitte’s Consumer Products, Retail and Services Practice and former Global Managing Partner• Director of Stein Mart, Inc., Chair of Audit Committee Mr. Cohen is a Retired Partner of Deloitte & Touche LLP, a professional services firm providing audit, tax, financial advisory and consulting services. Mr. Cohen, who joined Deloitte in 1962 and became a partner in 1972, served as the Global Managing Partner of the Consumer Products, Retail and Services Practice of Deloitte from 1997 to 2003. Mr. Cohen also founded and led Deloitte’s Consumer Products, Retail and Services Practice as it grew to serve over 100 countries in Europe, Asia Pacific and the Americas. Mr. Cohen brings considerable experience in retail and accounting as a result of his experience with Deloitte. Mr. Cohen is also a director and chair of the Audit Committee of Stein Mart, Inc., a discount fashion retailer with sales in excess of $1 billion. In addition, he currently serves or has served on the boards of several private and non-profit companies. |
 | Philip L. Francis Director since: 2006 Independent Age: 71 • Supervalu Committees: Leadership Development and Compensation Committee (Chair)• Former President and Chief Executive Officer of Shaw’s Supermarkets, Inc. and Cardinal Foods• Retired Executive Chairman of PetSmart, Inc.• Director of At Home Group, Inc.• Former director of CareFusionMr. Francis retired in 2012 from PetSmart, Inc. after serving ten years as Chief Executive Officer and two years as the Executive Chairman. PetSmart is a specialty retailer of services and solutions for pets. Prior to joining PetSmart, Mr. Francis was the President and Chief Executive Officer of Shaw’s Supermarkets, Inc. and Cardinal Foods. His formal education includes a Bachelor of Science degree from the University of Illinois in Agricultural Science and an MBA in Marketing and Management from Indiana University. Among his many qualifications, Mr. Francis brings significant retail industry experience, as well as experience in business strategy as a senior executive of a large public company. Mr. Francis is a director of At Home Group, Inc., a retail chain specializing in home décor products. He previously served as a director of PetSmart, Inc. from 1989 to 2012, and as a director of CareFusion from 2009 until it was sold in March 2015. He is active with several non-profit or service organizations that include Teach for America, Greater Phoenix Leadership (past chairman), Federal Reserve Board-Western Region Advisory Council, and TGEN-Translational Genomics Research Institute. He is a past campaign chair and board chair of Valley of the Sun United Way and is active in UMOM (homeless) and ASU Idea Enterprise. |
4
 | Mark Gross Director Since: 2016 President and Chief Executive Officer Age: 55 • President and Chief Executive Officer of Supervalu • Founder and former President of Surry Investment Advisors LLC• Former Co-President, Chief Financial Officer and General Counsel of C&S Wholesale Grocers and President of its retail grocery affiliateMr. Gross has served as the President and Chief Executive Officer of the Company since February 5, 2016. Prior to joining the Company, Mr. Gross had served since 2006 as President of Surry Investment Advisors LLC, an advisory firm that Mr. Gross founded to provide services to grocery distributors and retailers with respect to strategic and operational matters. In this role, Mr. Gross assisted grocery clients on several multi-billion dollar acquisitions and divestitures and consulted with private equity firms with respect to investments in food retail, distribution and consumer packaged goods sectors. From 1997 to 2006, Mr. Gross worked at C&S Wholesale Grocers, most significantly serving as Co-President of C&S from 2005 to 2006. Additionally, during his tenure with C&S, Mr. Gross served as Chief Financial Officer and General Counsel of C&S, and President of its retail grocery affiliate. Among his many qualifications, Mr. Gross brings a wealth of grocery wholesale and retail industry experience, including significant experience in business strategy and operations as a senior executive of a large grocery wholesale company and as an advisor to several grocery companies and investors. Mr. Gross graduated cum laude from the University of Pennsylvania Law School and holds a BA from Dartmouth College where he graduated with highest honors in his major. |
 | Eric G. Johnson Director Since: 2013 Independent Age: 67 • Supervalu Committees: Corporate Governance and Nominating Committee (Chair)• President and Chief Executive Officer of Baldwin Richardson Foods Company• Former Chief Executive Officer of Johnson Products Company• Director of Lincoln National Corporation, Chairman of Finance Committee Mr. Johnson is the President and Chief Executive Officer of Baldwin Richardson Foods Company (“Baldwin Richardson”), one of the largest African-American-owned businesses in the food industry, a position he has held since 1997. Baldwin Richardson is a major producer of products and ingredients for McDonald’s, Kellogg, General Mills and Frito Lay. Baldwin Richardson also has retail brands and foodservice products that it distributes nationally. Mr. Johnson purchased Baldwin Ice Cream Co. in 1992, and, in 1997, he completed the acquisition of Richardson Foods from Quaker Oats Company to form Baldwin Richardson. From 1989 to 1991, Mr. Johnson served as Chief Executive Officer of Johnson Products Company. Among his many qualifications, Mr. Johnson brings considerable food industry and business experience from the perspective of a manufacturer and supplier of food products to the retail and foodservice markets. Mr. Johnson serves as a member of the Board of Directors for Lincoln National Corporation and is chairman of its Finance Committee. He also sits on the Board of Trustees for Babson College and serves on the Board of the Urban League of Rochester. Mr. Johnson is a graduate of Babson College. |
5
 | Mathew M. Pendo Director Since: 2014 Independent Age: 54 • Supervalu Committees: Corporate Governance and Nominating Committee • Managing Director of Oaktree Capital• Former Managing Director at Sandler O’Neill Partners• Former Director of Ally Financial Inc.Mr. Pendo serves as Managing Director of Oaktree Capital, an investment firm that specializes in less efficient markets and alternative investments, and has held that position since June 2015. Prior to joining Oaktree, from September 2013 until June 2015, Mr. Pendo served as a Managing Director at Sandler O’Neill Partners, an investment banking boutique focused on the financial services industry. Prior to joining Sandler O’Neill Partners, Mr. Pendo served as the Chief Investment Officer for the Troubled Asset Relief Program (“TARP”) at the U.S. Department of the Treasury from November 2010 until March 2013. He previously served as Managing Director Investment Banking for Barclays Capital from 2003 until October 2010, where he served as Co-Head of the Industrials Group and the U.S. Investment Banking Group. Among his many qualifications, Mr. Pendo brings substantial financial and investment banking experience to the Board. Mr. Pendo previously served as a director of Ally Financial Inc., a bank holding company focused on the auto finance and online banking industries, from 2013 to 2015. Mr. Pendo holds a Bachelor of Arts degree in Economics from Princeton University and received a Distinguished Service Award from the U.S. Department of Treasury for his work overseeing TARP’s investment activities. |
6
 | Francesca Ruiz de Luzuriaga Director Since: 2015 Independent Age: 64 • Supervalu Committees: Audit Committee• Former Chief Operating Officer of Mattel Interactive, a business unit of Mattel, Inc.• Former Executive Vice President, Worldwide Business Planning and Resources, and former Chief Financial Officer of Mattel, Inc. • Director of Office Depot, Inc., member of Compensation and Governance Committees • Former Director of Providian Financial Corporation and OfficeMax IncorporatedMs. Luzuriaga has been an independent business development consultant since 2000. Previously, she was the Chief Operating Officer of Mattel Interactive, a business unit of Mattel, Inc., one of the major toy manufacturers in the world, from 1999 to 2000. Prior to holding this position, she served Mattel as its Executive Vice President, Worldwide Business Planning and Resources, from 1997 to 1999, and as its Chief Financial Officer from 1995 to 1997. Among her many qualifications, Ms. Luzuriaga brings substantial prior leadership experience in the operations and strategy side of businesses, both in the United States and internationally, as well as financial expertise and experience in corporate finance. Ms. Luzuriaga is a director and serves on the Compensation and Governance Committees for Office Depot, Inc. Previously, she was a director of OfficeMax Incorporated from 1998 to November 2013. She has been a director since January 2012, and chair of the Board since January 2017, of SCAN Health Plan, a not-for-profit Medicare Advantage health plan, as well as a director of its Foundation since January 2017. From 2002 until 2005, she was also a director of Providian Financial Corporation. |
 | Frank A. Savage Director Since: 2014 Independent Age: 70 • Supervalu Committees: Leadership Development and Compensation Committee• Senior Advisor to Lazard Ltd.• Former Vice Chairman of U.S. Investment Banking at Lazard Ltd., and current Senior Advisor • Former Co-Head of Lazard’s Restructuring Group and member of Lazard’s Deputy Chairman Committee• Director of Rite Aid CorporationMr. Savage has been a senior advisor to investment banking firm Lazard Ltd. (“Lazard”) since January 2014 and served as Vice Chairman of U.S. Investment Banking at Lazard from 2009 to December 2013. He was the Co-Head of Lazard’s Restructuring Group from June 1999 to December 2013 and also served on Lazard’s Deputy Chairman Committee from 2006 to December 2013. Prior to joining Lazard, Mr. Savage served as Co-Head of the Restructuring Practice at investment banking firm BT Alex. Brown Inc. and before that was the Head of the Restructuring Group at investment bank UBS AG. Mr. Savage holds a degree from the University of Pennsylvania’s Wharton School of Business. Among his many qualifications, Mr. Savage brings extensive financial, restructuring and investment banking experience to the Board. Mr. Savage has served as a director of Rite Aid Corporation since June 2015. |
7
 | Mary A. Winston Director Since: 2016 Independent Age: 56 • Supervalu Committees: Leadership Development and Compensation Committee; Audit Committee• Former Executive Vice President and Chief Financial Officer of Family Dollar Stores, Inc.• Founder and President of WinsCo Enterprises, Inc.• Former Senior Vice President and Chief Financial Officer for Giant Eagle, Inc.• Director of Dover Corporation, Member of Finance and Compensation Committees, Former Chair of Audit Committee• Director of Domtar Corporation, Member of Audit and Finance Committees• Director of Acuity BrandsMs. Winston is the founder and President of WinsCo Enterprises, Inc., a consulting firm providing financial and board governance advisory services, and has held that position since 2016. Ms. Winston previously served from 2012 until August 2015 as Executive Vice President - Chief Financial Officer of Family Dollar Stores, Inc., a discount retailer with more than 8,300 stores and nearly $11 billion in revenues prior to its acquisition by Dollar Tree in July 2015. Before joining Family Dollar, from 2008 to 2012, Ms. Winston served as Senior Vice President and Chief Financial Officer for Giant Eagle, Inc., a regional grocery and fuel retailer. Ms. Winston was Founder and President of WinsCo Financial, LLC, a financial solutions consulting firm, from 2007 to 2008 and served as Executive Vice President and Chief Financial Officer of Scholastic Corporation, a children’s publishing and media company, from 2004 to 2007. Among her many qualifications, Ms. Winston brings corporate executive leadership experience as well as extensive financial management and leadership. Ms. Winston has served as a director of Dover Corporation, a diversified industrial manufacturing company, since 2005, where she served as chair of its Audit Committee from 2008 to 2018 and now serves on its Finance and Compensation Committees. She has served as a director and member of the Audit and Finance Committees of Domtar Corporation, a paper, pulp and consumer personal care products manufacturer, since 2015, and as a director of Acuity Brands, Inc., a provider of indoor and outdoor lighting and energy management solutions, since April 2017. Ms. Winston previously served as a director of Plexus Corporation, an electronic manufacturing services company, from 2008 to February 2016. Ms. Winston is also Board chair and President of the Carolinas chapter of the National Association of Corporate Directors. |
8
The following table provides certain information concerning the executive officers of Supervalu as of April 24, 2018.
Name | Age | Present Position | Calendar Year Elected to Present Position | Other Positions Recently Held with Supervalu | ||||
Mark Gross(1) | 55 | President and Chief Executive Officer | 2016 | |||||
Rob N. Woseth(2) | 47 | Executive Vice President and Chief Financial Officer | 2018 | Executive Vice President, Chief Strategy Officer, 2013-2018; and Interim Chief Financial Officer, 2017-2018 | ||||
Randy G. Burdick(3) | 60 | Executive Vice President, Chief Information Officer | 2013 | |||||
Anne M. Dament(4) | 51 | Executive Vice President, Retail, Marketing and Private Brands | 2017 | Senior Vice President, Retail, Merchandising and Marketing, January 2017-October 2017 | ||||
Stuart D. McFarland(5) | 40 | Senior Vice President, General Counsel and Corporate Secretary | 2017 | Vice President, Associate General Counsel and Assistant Corporate Secretary, 2014-2017; Director and Associate General Counsel, 2013-2014, Senior Attorney, 2012-2013; and Attorney 2010-2012 | ||||
Michael C. Stigers(6) | 59 | Executive Vice President, Wholesale | 2015 | President of Cub Foods, 2014-2015; President, Northern and Western Region of Wholesale, 2013-2014; President of Shaw’s, 2011-2013 | ||||
James W. Weidenheimer(7) | 59 | Executive Vice President, Corporate Development and Chief Innovation Officer | 2016 | |||||
(1) | Mark Gross was appointed President and Chief Executive Officer in February 2016. Prior to joining Supervalu, from 2006 to 2016 Mr. Gross served as President of Surry Investment Advisors LLC, an advisory firm that he founded to provide consulting services to grocery distributors and retailers with respect to strategic and operational matters. From 1997 to 2006, Mr. Gross held various positions at C&S Wholesale Grocers, Inc., a wholesale grocery distributor (“C&S”), including serving as Co-President of C&S’s overall operations from 2005 to 2006. Additionally, during his tenure with C&S, Mr. Gross served as Chief Financial Officer, General Counsel, and President of its affiliated retail grocery operations. |
(2) | Rob N. Woseth was appointed Executive Vice President and Chief Financial Officer in February 2018. He served as Executive Vice President, Chief Strategy Officer from March 2013 to February 2018 and as Interim Chief Financial Officer from July 2017 to February 2018. Prior to joining Supervalu, Mr. Woseth served as Vice President Business Development and Strategy at Albertson’s LLC, a grocery company, from 2006 to 2013. |
(3) | Randy G. Burdick was appointed Executive Vice President, Chief Information Officer in March 2013. Prior to joining Supervalu, Mr. Burdick served as Executive Vice President and Chief Information Officer at OfficeMax, an office supplies retailer, from 2005-2013. |
(4) | Anne M. Dament was appointed Executive Vice President, Retail, Marketing and Private Brands, in November 2017. She served as Senior Vice President, Retail, Merchandising and Marketing from January 2017 to November 2017. Prior to joining Supervalu, Ms. Dament served as Senior Vice President, Merchandising at Target Corporation, a general merchandise retailer, from April 2015 to November 2016. Ms. Dament previously served as Vice President, Merchandising Solutions, from January 2009 to September 2012 and as Vice President, Services from September 2012 to April 2015 at PetSmart, Inc., a specialty retailer of services and solutions for pets. |
(5) | Stuart D. McFarland was appointed Senior Vice President, General Counsel and Corporate Secretary in November 2017. He served as Vice President, Associate General Counsel and Assistant Corporate Secretary from July 2014 to November 2017, Director and Associate General Counsel from August 2013 to July 2014, Senior Attorney from October 2012 to August 2013, and Attorney from August 2010 to October 2012. Prior to joining Supervalu, Mr. McFarland was an associate at the law firm of Gibson, Dunn & Crutcher LLP in Los Angeles. |
(6) | Michael C. Stigers was appointed Executive Vice President, Wholesale in December 2015. He served as President of Cub Foods from December 2014 to December 2015, President, Northern and Western Region of Wholesale, from 2013 to 2014, and President of Shaw’s, a retail banner that we formerly owned, from 2011 to 2013. Prior to joining Supervalu, Mr. Stigers served as President of PW Supermarkets, Inc., an operator of retail grocery supermarkets, from 2006 to 2010 and as Chief Executive Officer in 2010. In April 2011, creditors filed a petition for involuntary bankruptcy against PW Supermarkets in U.S. Bankruptcy Court, Northern District of California to force PW Supermarkets into a Chapter 7 liquidation. The bankruptcy case was transferred to the Oakland Division in October 2014 and remains pending in that court. |
(7) | James W. Weidenheimer was appointed Executive Vice President, Corporate Development and Chief Innovation Officer in April 2016. Prior to joining Supervalu, Mr. Weidenheimer served as Senior Vice President of Corporate Development for C&S from 2008 to 2016, where Mr. Weidenheimer oversaw significant M&A activity and led the development of procurement and distribution outsourcing plans. From 1998 to 2008, Mr. Weidenheimer had operating responsibility for finance, treasury, procurement, facilities, internal audit, quality assurance and inventory control at C&S. |
9
Directors are elected for a term of one year and until their successors are elected and qualified. The term of office of each executive officer is from one annual meeting of the Board of Directors until the next annual meeting of the Board of Directors or until a successor is elected. There are no family relationships between or among any of our directors and executive officers.
Audit Committee
The Board maintained a standing Audit Committee during fiscal 2018. The following directors served on the Audit Committee in fiscal 2018: Irwin S. Cohen (Chair), Francesca Ruiz de Luzuriaga and Mary A. Winston. The Board determined that all such members of the Audit Committee were financially literate under the NYSE listing standards and that each member qualified as an “audit committee financial expert” under the NYSE listing standards and the rules of the SEC.
The primary responsibilities of the Audit Committee are to assist the Board of Directors in:
• | its oversight of our accounting and financial reporting principles and policies, and our internal controls and procedures; |
• | its review and oversight of our financial statements and the independent registered public accounting firm; |
• | selecting, appointing, compensating, evaluating and, where deemed appropriate, replacing the independent registered public accounting firm, which reports directly to the Audit Committee; |
• | evaluating the independence of the independent registered public accounting firm; |
• | its oversight of our major financial risk exposures and assessment of the steps that we have taken to assess and manage such exposures; and |
• | its oversight of our compliance with legal and regulatory requirements. |
In addition, the Audit Committee has the responsibility to:
• | review the scope of the annual audit plan and organizational structure of the internal auditors, and the results of the internal auditor’s activities; |
• | regularly meet separately with the senior internal audit executive, who reports functionally to the Audit Committee and administratively to our Chief Financial Officer, and the independent registered public accounting firm; |
• | review reports by the independent registered public accounting firm describing and assessing our internal controls and discuss the adequacy and effectiveness of our internal controls and any specified audit procedures taken in light of any material weakness or significant deficiencies identified by us or the independent registered public accounting firm; and |
• | establish procedures concerning the receipt, retention and treatment of complaints regarding financial reporting, accounting, internal accounting controls or auditing and federal securities law matters. |
Code of Ethics
We have adopted a code of ethics called the Code of Business Conduct that applies to our principal executive officer, principal financial officer, principal accounting officer and controller, or persons performing similar functions and all other employees, and a Code of Business Conduct and Ethics that applies to our directors. The Codes are posted on our website at www.supervalu.com. We intend to satisfy the disclosure requirement under Item 5.05 of Form 8-K regarding an amendment to, or waiver from, a provision of the code of ethics that applies to Supervalu’s principal executive officer, principal financial officer, principal accounting officer and controller, or persons performing similar functions, by posting such information on our website at the address specified above.
Our Governance Principles and charters for each Committee of our Board of Directors are also available on our website. The Codes, Governance Principles and charters are also available in print to any stockholder who submits a request to: Corporate Secretary, SUPERVALU INC., P.O. Box 990, Minneapolis, Minnesota 55440.
Information on our website is not deemed to be incorporated by reference into this Amendment.
Section 16(a) Beneficial Ownership Reporting Compliance
The rules of the SEC require our directors, executive officers and holders of more than 10% of our common stock to file reports of stock ownership and changes in ownership with the SEC. Based solely on a review of the Section 16 reports filed by our directors and executive officers and written representations of our directors and executive officers, we believe that our directors and executive officers complied with all Section 16(a) filing requirements for fiscal year 2018.
10
ITEM 11. EXECUTIVE COMPENSATION
COMPENSATION DISCUSSION AND ANALYSIS
This Compensation Discussion and Analysis (“CD&A”) provides an overview of our fiscal 2018 business transformation and highlights, a detailed explanation of our executive compensation philosophy and programs and decisions made with respect to compensation for the Named Executive Officers (“NEOs”) below. Our fiscal 2018 included 52 weeks, starting on February 26, 2017 and ending on February 24, 2018. Compensation provided to our NEOs is also outlined in the Summary Compensation Table on page 27 of this Amendment and other compensation-related tables that follow in this Amendment.
Named Executive Officers | Title(s) Held During Fiscal 2018 | Dates From Start of Fiscal 2018 |
Mark Gross | -President and Chief Executive Officer | February 26, 2017 to present |
Rob N. Woseth(1) | -Executive Vice President, Chief Strategy Officer -Interim Chief Financial Officer | February 26, 2017 to February 24, 2018 July 6, 2017 to February 24, 2018 |
James W. Weidenheimer | -Executive Vice President, Corporate Development and Chief Innovation Officer | February 26, 2017 to present |
Michael C. Stigers | -Executive Vice President, Wholesale | February 26, 2017 to present |
Randy G. Burdick | -Executive Vice President, Chief Information Officer | February 26, 2017 to present |
Bruce H. Besanko | -Former Executive Vice President, Chief Operating Officer and Chief Financial Officer | February 26, 2017 to July 5, 2017 |
(1) Mr. Woseth was promoted to the position of Executive Vice President and Chief Financial Officer effective the first day of fiscal 2019, February 25, 2018.
Summary: Our compensation is tied closely to our strategy
We are leveraging our position as the largest public grocery wholesaler in the United States to transform our business and build upon our core competencies to become the wholesale supplier of choice to grocery retailers and to benefit from the rapidly changing food sector.
The individual elements and overall philosophy of our executive compensation plans are designed to support our transformation, as well as maintain and grow our existing core business. Accordingly, our plans include elements that align NEO compensation to:
• | absolute and relative shareholder return; |
• | achievement of annual operational and financial goals that reflect growing our top-line sales while delivering Adjusted EBITDA; |
• | achievement of our business transformation goals that support long-term returns; and |
• | rewarding and shaping our executives’ leadership strengths and contributions. |
This close alignment between our executive compensation and our strategy and long-term stockholder interests continues our philosophy from fiscal 2017. We received 98.1% approval from our voting stockholders for our 2017 advisory “say-on-pay” referendum.
We open this CD&A with a short summary of who we are and what our key strategic initiatives were over the last year. We believe you will see in this CD&A the strong tie between these initiatives and our executive compensation programs in fiscal 2018.
Who We Are
We are the largest public company grocery wholesaler in the United States. We operate a network of 28 distribution centers covering approximately 21 million square feet from which we deliver a broad assortment of products to retailers, including independent retailers operating diverse formats, regional and national chains, our corporate-owned retail stores and military commissaries. We enable our customers to better serve their consumers by leveraging scale efficiencies in procurement, logistics and merchandising; supplying a broad assortment of products, including an industry-leading portfolio of private, ethnic and specialty brands; and offering a suite of professional services. Our business is classified into two reportable segments: Wholesale and Retail.
During fiscal 2018, we expanded our Wholesale capabilities and distribution network through the acquisitions of Unified Grocers, Inc. (“Unified”) and Associated Grocers of Florida, Inc. (“AG Florida”), as well as new distribution centers in Harrisburg, Pennsylvania and Joliet, Illinois. We serve customers in nearly all U.S. states, as well as internationally, including in the Caribbean, Central and South America and Asia.
11
We also operate three retail banners (in continuing operations) with strong local and regional recognition: Cub Foods, Shoppers Food & Pharmacy and Hornbacher’s. The retail banners extend our Wholesale value proposition and offer consumers an assortment of products and services at competitive prices through a network of well-maintained stores.
Strategic Transformation and Initiatives
We began a strategic transformation in 2016 to become the wholesale supplier of choice for grocery retailers across the United States, all in furtherance of our goal to deliver long-term value to our stockholders. To further align our executive compensation with the priority of transforming our business, we introduced a business transformation metric in our annual incentive plan this year (see “Total Direct Compensation for our Executive Officers — Annual Incentive Plan — Annual incentive metrics — Business Transformation Metric”). The Wholesale and Retail leadership team that we appointed in the last two years to lead and manage the continued execution of our four strategic pillars continue to drive our transformation to grow our core Wholesale business, optimize our asset base, de-lever our balance sheet and take advantage of strategic and opportunistic mergers and acquisitions.
Grow our Core Wholesale Business
• | We have added more than $5 billion in run-rate sales to grow our core Wholesale business to nearly $13 billion, when annualizing the sales from Unified and AG Florida. These acquisitions, plus the addition of significant new Wholesale customers, such as The Fresh Market, drove our growth in fiscal 2018. |
• | We made strategic capital investments of approximately $135 million in fiscal 2018 toward the purchase and improvement of distribution warehouses, including Harrisburg, Pennsylvania and Joliet, Illinois, to support the growth of our Wholesale business, including our Market Centre division that supplies specialty and ethnic foods and non-food products, to solidify our East Coast distribution and to enable further growth in certain key markets. |
Optimize our Asset Base
• | We sold a majority of our Farm Fresh retail stores and pharmacy assets for a total of $53 million in March 2018. |
• | We announced that we are pursuing the sale of our corporately owned and operated retail operations of Shop ‘n Save (based in St. Louis) and Shop ‘n Save East (with stores in West Virginia, Maryland, Pennsylvania and Virginia) in April 2018. These operations along with Farm Fresh are now reported in discontinued operations. |
• | We sold our minority interest in an entity that operates multiple franchised Cub Foods stores in the Minneapolis - St. Paul, Minnesota market in February 2018. |
De-lever the Balance Sheet
• | The sale of Save-A-Lot for $1.3 billion in late fiscal 2017 significantly reduced our debt and improved our balance sheet, eliminating high levels of capital expenditures for retail operations and increasing our flexibility and resources to execute our wholesale growth strategy in fiscal 2018. |
• | We announced a sale leaseback transaction in April 2018 for eight of our distribution centers, with expected gross proceeds of approximately $483 million before costs and taxes, the net proceeds of which will be used to further reduce outstanding debt and improve our balance sheet. We closed on seven of the eight properties in May 2018 and expect to close on the remaining property by October 2018, as originally intended. |
Strategic and Opportunistic Mergers and Acquisitions
• | We expanded our Wholesale business and distribution network on the West Coast through the acquisition of Unified on June 23, 2017, a business that had $3.7 billion of annual net sales, including Market Centre. |
• | We expanded our Wholesale business and distribution network in Florida through the acquisition of AG Florida on December 8, 2017, a business that had $0.6 billion in annual net sales, including international customers and specialty and ethnic foods to local wholesale customers. |
• | We have increased our expected run-rate cost synergies of approximately $95 million to be achieved by the end of the third year following the respective closings of the Unified and AG Florida transactions, of which we realized approximately $23 million in fiscal 2018. |
• | We expect the food wholesale industry consolidation to continue and believe our strategy enables us to build upon the recent acquisitions of Unified and AG Florida to further grow and expand our capabilities through merger and acquisition opportunities. |
We believe we had significant success rapidly and strategically transforming our business in fiscal 2018 as described above. Fiscal 2018 results were above expectations and, as intended with our pay-for-performance philosophy, that
12
performance translated into higher incentive payouts to our NEOs, as discussed further below, including a maximum payout under our Business Transformation metric.
Business Strategies and Initiatives
While we have been strategically transforming our business, we also continued to execute on our Wholesale and Retail business strategies in fiscal 2018. In Wholesale, we continued to execute on our three-pronged strategy of:
• | retaining existing customers by anticipating, listening to and meeting our customer needs and differentiating ourselves through our service levels, pricing, product offerings and professional services; |
• | growing our business with existing customers by marketing our fresh product offerings, such as produce, our ethnic and specialty capabilities and our professional service offerings to help our customers compete and grow their businesses, including retail store support, advertising, couponing, e-commerce, network and data hosting solutions, training and certifications classes and administrative back-office solutions; and |
• | affiliating new customers, including traditional and non-traditional formats, and aggressively pursuing external growth and market opportunities. We are also expanding the Market Centre product offerings into our supply chain and continuing to optimize our product offerings to anticipate and meet our customers’ needs. |
In Retail, we executed on a strategy to drive profitable retail sales through competitive pricing, strong, event-based promotions, and enhancing merchandising displays and product offerings such as Quick & Easy meal solutions, including meal kits and grab ‘n go options. We also made targeted and innovative capital investments in our continuing operations banners for new stores, relocations and store remodels.
“Say-on-Pay,” Frequency of Votes on Executive Compensation and Stockholder Outreach
We believe that open dialogue with our stockholders and incorporating their feedback in our compensation decisions is important. One form of feedback from our stockholders is our annual advisory vote to approve the compensation paid to our NEOs, commonly referred to as “say-on-pay.” The Board and the Leadership Development and Compensation Committee of the Board (the “Committee”) reviews and considers the say-on-pay voting results when evaluating our executive compensation programs. At the 2017 Annual Meeting of Stockholders, our stockholders voted to approve, on an advisory basis, the compensation of our NEOs with 98.1% of the voted shares voting “For” the proposal, a slight increase from our prior year’s results. The Board and the Committee viewed this result as a continued strong expression of support by our stockholders for our executive compensation programs.
At the 2017 Annual Meeting of Stockholders, we provided our stockholders with an advisory vote on the frequency of conducting an advisory vote on the compensation of our NEOs. Our stockholders could vote on their preferred voting frequency by choosing the option of one year, two years or three years, or they could abstain from voting. A substantial majority, 77.5%, of votes were to continue an annual advisory vote to approve the compensation paid to our NEOs. While this vote was advisory and not binding on the Board of Directors or the Company, the Board determined to continue the annual advisory vote. This “say-on-pay” frequency vote will be held again in six years.
In addition to regular communication with our stockholders about our business results, we welcome feedback from our stockholders on our executive compensation programs and corporate governance.
13
Executive Compensation Policies and Practices
Our executive compensation program is designed to provide appropriate performance incentives for our executive officers, while avoiding compensation practices that do not promote the interests of our stockholders.
Executive Compensation Governance: What We Do | |||
ü | Maintain a strong alignment between executive compensation and performance. | ü | Require our NEOs to adhere to restrictive covenants upon separation from Supervalu, including non-compete, non-solicitation and non-disclosure obligations. |
ü | Directly link a significant portion of our executives’ incentive opportunities to stock price performance. | ü | Conduct an annual Peer Group review and competitive benchmarking to align executive compensation to market. |
ü | Align executive incentives with both absolute measures of financial and stock price performance, and relative stock price performance. | ü | Review the Committee charter annually to incorporate any new best practices or other changes deemed necessary. |
ü | Maintain stock ownership and retention guidelines. | ü | Limit the amount and number of executive perquisites. |
ü | Maintain a recoupment (or clawback) policy. | ü | Use an independent compensation consultant retained by the Committee. |
Executive Compensation Governance: What We Don’t Do | |||
x | Provide single-trigger change-of-control benefits for any employees. | x | Utilize incentives that motivate excessive risk-taking. |
x | Permit payment of dividends on unearned performance share units. | x | Allow adjustments for option exercise prices (re-pricing) without stockholder approval, except to adjust for stock splits or similar transactions. |
x | Provide for tax gross-ups, whether associated with potential change-of-control golden parachute excise taxes or otherwise. | x | Allow directors or executive officers to pledge, engage in short sales, hedge or trade put and call options with respect to our securities. |
Compensation Philosophy & Pay-for-Performance
Our executive compensation programs are designed to:
• | align our executives’ interests with those of our stockholders by delivering a greater percentage of variable pay as executives reach more senior levels in the organization; |
• | reward strong financial performance, effective strategic leadership and the creation of long-term value for our stockholders; |
• | attract, motivate and retain leaders who help us achieve our objectives; |
• | enhance alignment with our stockholders’ interests and executive retention with the use of multi-year vesting and stock ownership guidelines for our executives; |
• | maintain an emphasis on consistent and sustainable top-line and bottom-line growth, while discouraging excessive risk-taking; and |
• | provide competitive total direct compensation for our executives. |
We believe that our compensation policies and practices are effective in achieving pay-for-performance balance. In keeping with our pay-for-performance philosophy, our fiscal 2018 annual incentive program was tied to the objective performance criteria of Consolidated Sales and Consolidated Adjusted EBITDA, with achievement of a minimum Consolidated Adjusted EBITDA threshold required for any payout on these metrics, plus a performance criterion based on business transformation initiatives. In addition, we make a significant portion of our NEOs’ compensation dependent on the performance of our common stock. As a result, the value of our long-term incentive awards for fiscal 2018 was closely tied to our long-term stock price performance, including our absolute total stockholder return (“TSR”) and our TSR relative to our Peer Group (described below), which we refer to as “Relative TSR.” Both forms of compensation are discussed in more detail later in this CD&A.
Assessing the Competitive Market
We assess our executives’ total target compensation opportunities with reference to the median of the competitive market. In assessing competitiveness, the Committee reviews compensation information from our Peer Group, as well as compensation information available from third-party surveys. This information is used to inform the Committee of competitive pay practices, including the relative mix among elements of compensation. This information is also used to determine, as a point of reference
14
for each NEO, a midpoint (or median) within the competitive compensation range, for base salary, annual incentive, long-term equity incentive and the total of these elements.
The Committee also recognizes that comparative pay assessments have inherent limitations, due to the lack of precise comparability of executive positions between companies, as well as the companies themselves. As a result, the competitive medians are used only as a guide and are not the sole determinative factor for making NEO compensation decisions. In exercising its judgment, the Committee looks beyond the competitive market data and considers individual job responsibilities, individual performance, experience, compensation history, internal comparisons, compensation at former employers (in the case of new hires) and our performance.
The third-party compensation surveys used by the Committee provide data on similarly-sized organizations based on revenue and industry. In fiscal 2018, the Committee referenced comparable positions from our Peer Group, as well as Willis Towers Watson’s Food Industry and General Industry surveys. Both surveys were size-adjusted in determining market median pay for our NEOs.
Peer Group
In April 2017, Exequity LLP (“Exequity”) assisted the Committee in reviewing and updating our Peer Group for fiscal 2018 so that it aligned with our industry (wholesale distribution company with regional retail grocery segments), revenue base (approximately $13 billion in annual revenue at that time) and employee base (approximately 31,000 employees at that time). Based upon the Committee’s assessment of operational comparability, the competitive landscape and our focus on our core Wholesale business, the changes made to our Peer Group for fiscal 2018 were to add Performance Food Group Company, United Natural Foods, Inc., US Foods Holding Corp., Big Lots, Inc., Dollar General Corporation and Dollar Tree Inc., and remove Publix Super Markets, Inc., Toys “R” Us, Inc. and Whole Foods Markets, Inc. The Committee believes that this group of companies represents a highly appropriate mix of size-relevant distributors (both food-oriented and more broadly) available for benchmarking pay for our NEOs for fiscal 2018.
Our fiscal 2018 Peer Group consisted of 15 companies that have median revenues of approximately $13 billion.
Fiscal 2018 Peer Companies | |
Big Lots, Inc. | SYNNEX Corporation |
Core-Mark Holding Company, Inc. | Sysco Corporation |
Dollar General Corporation | Tech Data Corporation |
Dollar Tree, Inc. | United Natural Foods, Inc. |
Office Depot, Inc. | US Foods Holding Corp. |
Performance Food Group Company | WESCO International Inc. |
SpartanNash Company | W. W. Grainger, Inc. |
Staples, Inc. | |
15
Fiscal 2018 Named Executive Officer Pay Mix
Our executive compensation program directly links a substantial portion of our executives’ compensation to our performance through our annual bonus and long-term incentive plans. Total direct compensation includes base salary, target annual incentive compensation and the grant value of long-term incentive compensation. The mix of targeted total direct compensation elements for our Chief Executive Officer (“CEO”) and our other continuing NEOs is below, with each element of compensation described as a percentage of targeted total direct compensation.
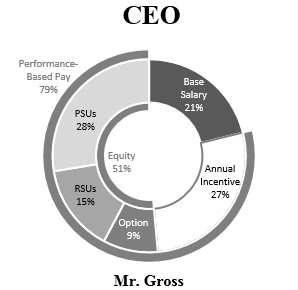
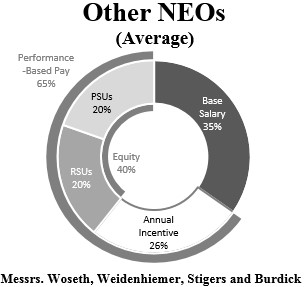
Our compensation programs are structured to align the interests of our executive officers with the interests of our stockholders. Seventy-nine percent (79%) of Mr. Gross’s targeted total direct compensation is tied to Company performance and stock price. On average, 65% of the targeted total direct compensation for our other continuing NEOs is tied to Company performance and stock price. These percentages reflect our commitment to aligning the interests of our executives with those of our stockholders by delivering progressively higher amounts of at-risk pay to our CEO and other NEOs.
Compensation Oversight and the Role of Executive Officers
Our annual review of executive compensation occurs at the April meeting of the Committee and the Board. As delegated by the Board, compensation for our NEOs is reviewed and approved by the Committee and, with respect to the CEO, ratified by the independent members of the Board. As part of that review, the Committee takes into consideration competitive market analyses, annual performance evaluations and the recommendations of our Chief Human Resources Officer (which for fiscal 2018 was an Interim Chief Human Resources Officer), the Committee’s independent compensation consultant(s) and, other than with respect to the CEO’s pay, the CEO. The Committee annually reviews the relationship of target compensation levels for each NEO relative to the median pay levels of executives at companies in our Peer Group for base salary, annual incentives and long-term incentive compensation and relative to the compensation target for the CEO. The Committee also annually reviews internal equity relationships for comparable positions across the Company. With respect to the compensation of our CEO, the CEO does not participate in any such approval or ratification.
Significant Compensation Decisions
Fiscal 2018
• | Annual Incentive Plan: We revised the structure of our annual incentive plan for fiscal 2018. For fiscal 2018, all executive officers participated under the same annual incentive plan rather than having different metrics and payouts for our business segment leaders. The plan contained three metrics: Consolidated Adjusted EBITDA, Consolidated Sales and our Business Transformation metric. Consistent with practices among our Peer Group, we also set the performance threshold for our Consolidated Adjusted EBITDA qualifier to 85% of target. We believe this threshold aligned with our peers and took into account the highly competitive grocery environment. The qualifier applied to payouts on the Consolidated Adjusted EBITDA and Consolidated Sales metrics. Our fiscal 2018 annual incentive plan structure reflects our desire to simplify the compensation programs for our executive officers. |
• | Long-Term Incentive Plan: We continued the use of performance share units (“PSUs”) in fiscal 2018. The Committee felt that our long-term incentives (“LTI”) for fiscal 2018 should even more closely align with stock price improvements given our ongoing strategic transformation. As a result, the PSU awards granted for fiscal 2018 were tied to relative and absolute TSR growth metrics. In addition to the PSUs, our LTI plan for fiscal 2018 included restricted stock unit (“RSU”) grants similar to fiscal 2017. |
16
At the time of the fiscal 2018 LTI grants in April 2017, the Committee believed that we had made strong progress and built momentum towards achieving our strategic vision. Additionally, our NEOs continued to engage in several key initiatives intended to continue to execute on our vision and transform the business for the benefit of our stockholders. As a result, the Committee increased the value of PSUs granted to our NEOs in fiscal 2018. The incremental amounts of the PSU awards varied by NEO, as detailed in the “Annual Incentive Plan Targets and Payouts for our NEOs” table below, and was determined based on a variety of factors, including then-current incentive compensation, scope of responsibilities and role in driving our strategic transformation.
Pursuant to his employment agreement, Mr. Gross received a $500,000 grant of stock options for fiscal 2018. Additionally, Mr. Gross received a PSU award (target value of $1,500,000) and a time-based RSU award ($800,000) to retain Mr. Gross and to further incentivize his progress towards our business transformation, which grants were incremental to the fiscal 2018 LTI target grant value initially established for Mr. Gross. Similarly, each of Messrs. Stigers and Weidenheimer received a RSU award ($100,000) that was incremental to the fiscal 2018 LTI target grant value established for each of them, in consideration of each of their contributions and responsibilities in driving new affiliations for our Wholesale business.
• | CEO & NEO Pay Changes: In April 2017, the Committee approved, and the independent members of our Board ratified, increases to Mr. Gross’s base salary (from $1,000,000 to $1,150,000 effective April 23, 2017) and target bonus opportunity percentage (from 100% to 130% of base salary; retroactive to the beginning of fiscal 2018). These increases were provided in recognition of Mr. Gross’s performance in his first year as President and Chief Executive Officer and to more closely align his total direct compensation with the median CEO compensation of the Peer Group and the general industry. The Committee also approved base pay increases for Messrs. Woseth and Stigers as detailed under “Total Direct Compensation for our Executive Officers — Base Salaries” below, while reducing the target LTI award value for Mr. Woseth by $40,000. The Committee also approved increasing the target LTI award value for Mr. Burdick by $50,000. These pay changes were made in recognition of each executives’ contributions to our business and strategic transformation and to better align their total direct compensation with the market. |
Named Executive Officers no longer with the Company
• | Bruce H. Besanko: In connection with Mr. Besanko voluntarily leaving the Company in July 2017, he was not eligible for an annual bonus payout and forfeited any unvested equity awards that were outstanding. |
Fiscal 2019
• | NEO Pay Changes: Effective February 25, 2018, Mr. Woseth was named Executive Vice President and Chief Financial Officer. In connection with this election, the Committee approved the following changes to Mr. Woseth’s compensation: (i) Mr. Woseth’s annual base salary was increased from $500,000 to $550,000 effective with the first pay period following the date of his appointment; and (ii) Mr. Woseth’s target LTI grant value for fiscal 2019 increased to $675,000. Mr. Woseth’s target annual incentive for fiscal 2019 remained 75% of his base salary, but will be calculated based on his increased base salary of $550,000. In March 2018, the Committee approved an increase to Mr. Stigers’ base salary (from $525,000 to $575,000 effective June 4, 2018). The increase was provided in recognition of his performance and to more closely align his total direct compensation with the market median compensation for similarly situated executives in our Peer Group. |
• | Annual Incentive Plan: The annual incentive plan for fiscal 2019 is very similar to that of fiscal 2018 and continues to utilize the three metrics of Consolidated Adjusted EBITDA, Consolidated Sales and Business Transformation. For fiscal 2019, we continue to apply a Consolidated Adjusted EBITDA qualifier as a performance threshold for any payout on the Consolidated Adjusted EBITDA and Consolidated Sales metrics, which qualifier was increased to 88% of target for fiscal 2019. |
• | Long-Term Incentive Plan: To further align our executive compensation with stockholders, all equity awards to our NEOs under our LTI plan for fiscal 2019 are in the form of PSUs. Approximately half of each NEO’s PSU award will be earned based on the achievement of three strategic metrics and the remaining portion of each NEO’s PSU award will be earned based on the achievement of certain Supervalu stock price performance levels. The grant value for each NEO’s PSU award in fiscal 2019 was increased in acknowledgement of the demand that has been and will continue to be placed on each NEO to achieve our fiscal 2019 goals and continue our transformation. The Committee believes these PSU awards further focus our executive team on driving stock performance and delivering long-term value to our stockholders. |
• | Peer Group: For fiscal 2019, we adjusted our Peer Group to (1) place a heavier emphasis on distribution; (2) take into account that our recent acquisitions have resulted in our revenue exceeding the median of the fiscal 2018 Peer Group; and (3) increase the number of peer companies to 18. |
17
Total Direct Compensation for our Executive Officers
The fundamental elements of our fiscal 2018 executive compensation program and the key characteristics and objective(s) of each element are presented in the following sections.
Base Salaries
We pay our NEOs and other executives an annual base salary that is intended to provide executives with a competitive fixed component of pay to support retention and recruitment of executive talent. Base salary levels for our NEOs are based on individual performance and experience, job responsibility and internal equity, and also take into consideration the competitive market median. We do not guarantee salary adjustments on an annual basis. During April of each year, the Committee considers adjustments to base salary as a part of our overall compensation assessment for our executives. For fiscal 2018, the Committee determined that base salaries for Messrs. Gross, Woseth and Stigers would be increased as detailed below to better align pay internally and with market median levels. The effective date of these increases was April 23, 2017 for the CEO and June 4, 2017 for the other NEOs.
Base Salary Changes for our Continuing NEOs
NEO | Fiscal 2017 Base Salary(1) | Fiscal 2018 Base Salary(1) | % Change |
Mark Gross | $1,000,000 | $1,150,000 | 15.0% |
Rob N. Woseth | $420,000 | $500,000 | 19.0% |
James W. Weidenheimer | $575,000 | $575,000 | 0.0% |
Michael C. Stigers | $475,000 | $525,000 | 10.5% |
Randy G. Burdick | $550,000 | $550,000 | 0.0% |
(1) Represents end of fiscal year base salary amounts. | |||
Annual Incentive Plan
We provide our executives with annual incentive compensation through plans that are designed to align a significant portion of their total cash compensation with the financial and strategic performance of the Company. Each executive is assigned a target amount of annual incentive compensation as part of his or her total cash compensation, but the amount of annual incentive compensation paid depends on the performance of the Company.
Annual incentive targets. Target amounts of annual incentive compensation for our NEOs were determined based on job responsibilities, internal parity, alignment with Peer Group pay levels and input from the Committee’s independent compensation consultant. The Committee established annual minimum, target and maximum bonus opportunities expressed as a percentage of base salary for each NEO in fiscal 2018, which were then ratified by the independent members of the Board for the CEO. The Committee’s objectives were to set targets such that total cash compensation (base salary and annual incentive at target) was generally aligned with the Peer Group median for each role, with a substantial portion of compensation linked to Company performance. Individuals with greater job responsibilities or scope generally had a greater proportion of their total cash compensation tied to Company performance through the annual incentive plan.
Annual incentive metrics. Performance metrics for our fiscal 2018 annual incentive plan for NEOs were Consolidated Adjusted EBITDA, Consolidated Sales and a new Business Transformation (“BT”) metric. In fiscal 2018, all NEOs participated in the same annual incentive plan to align focus, resources and efforts across our functional teams.
Consolidated Adjusted EBITDA Metric. Our Consolidated Adjusted EBITDA metric creates a focus on delivering strong bottom-line performance while reinforcing the importance of balancing growth and profitability. Consolidated Adjusted EBITDA is a qualifier metric for our 2018 annual incentive plan, such that no payouts under the plan for the Consolidated Sales or the Consolidated Adjusted EBITDA metrics occur unless the minimum Adjusted EBITDA performance threshold of eighty five percent (85%) of strike zone performance target is met (regardless of the results underlying the sales metric). We utilized a range, or “strike zone,” for our performance target in fiscal 2018 due to the stretch nature of the target and our expected variability in performance as we transform our business in a competitive industry. The dollar amounts of the strike zone target performance are provided below under “— Annual incentive performance.”
Adjusted EBITDA is a non-GAAP measure (as defined below). We use Adjusted EBITDA to analyze underlying core business trends, to understand operating performance and for compensation purposes. We believe Adjusted EBITDA performance provides our management and investors with useful supplemental information, such as additional understanding of the underlying factors and trends affecting our core business. See “Supplemental Non-GAAP Financial Information Used In Compensation Performance Metrics” below for additional detail on this non-GAAP measure.
18
Consolidated Sales Metric. Our Consolidated Sales metric consists of the combined net sales of our Wholesale and Retail businesses in fiscal 2018. This metric emphasizes driving top-line growth across our Company, including maintaining customers, affiliating new customers and continuing our strategic efforts around business growth.
Business Transformation Metric. The BT metric was added for the fiscal 2018 annual incentive plan to further align our executive compensation with our focus and priority on transforming our business and becoming the wholesale supplier of choice for grocery retailers across the United States. The BT metric provides for payouts independent of the Consolidated Adjusted EBITDA qualifier. Performance under the BT metric can include accomplishing or making significant progress towards:
• | evolving Supervalu to the business of the future including through thoughtful acquisitions or divestitures; |
• | driving top-line growth through notable new customer affiliations, expansion of new businesses or products or meaningful expansion with current customers; and |
• | simplifying our business and efficiently using capital and reducing overhead expense. |
Metrics for all executives are tracked regularly, are well understood and our executives can deliver against these metrics by taking actions to improve operating performance.
Annual Incentive Plan Metrics, Weightings and Payout Levels for our NEOs
Metric | Metric Weight | Threshold Payout | Target Payout | Maximum Payout |
Consolidated Adjusted EBITDA* | 50% | 35% | 100% | 200% |
Consolidated Sales | 30% | 25% | 100% | 200% |
Business Transformation | 20% | 0% | 100% | 200% |
*Note: Metric represents a plan qualifier for NEOs. If the plan qualifier threshold is not met, no payments are made under the plan for the Consolidated Adjusted EBITDA metric or the Consolidated Sales metric.
The threshold and maximum level of performance for Consolidated Adjusted EBITDA was widened from 95% – 105% of target in fiscal 2017 to 85% – 115% of target for fiscal 2018 to better align with market and peers and to recognize the highly competitive grocery environment. The threshold and maximum level of performance for Consolidated Sales was 90% – 110% of target for fiscal 2018.
Annual incentive performance. The amount paid to an NEO under the annual incentive plan for fiscal 2018 may range from 0% to 200% of the NEO’s prorated target amount for that year. The fiscal 2018 targets that the Committee established for the performance metrics were intended to encourage our executives to meet or exceed operational goals. At the time the performance targets were set, the target goals were characterized as stretch goals, meaning that depending on our ability to grow sales and Adjusted EBITDA while controlling our costs, this level of performance was uncertain, but could reasonably be achieved. The following table illustrates the target and actual performance attained during fiscal 2018:
Annual Incentive Plan Metric Performance for our NEOs
Metric Weight | Threshold | Target | Maximum | Results | Metric Performance | Weighted Payout | |
Metric | (dollars in millions) | ||||||
Consolidated Adjusted EBITDA | 50% | $383 | $450 - $474 | $545 | $442 | 93% | 46% |
Consolidated Sales | 30% | $11,852 | $13,169 | $14,486 | $13,055 | 94% | 28% |
Business Transformation (BT) | 20% | See Performance below | 200% | 40% | |||
Total | 100% | 114% | |||||
The Committee reviewed our performance under the BT metric against its design to incentivize transformational growth that will strengthen the Company and benefit our stockholders over the long-term. The Committee approved a 200% payout on the BT metric based on significant accomplishments achieved in fiscal 2018. As detailed above under “— Strategic Transformation and Initiatives,” we continued to significantly transform our business in fiscal 2018 including:
• | completing the acquisitions of Unified and AG Florida. These transactions added $4.3 billion of annual net sales. We have also made significant progress in integrating these companies and realizing the expected synergies, including increasing the targeted synergies from $76 million to $96 million to be achieved by the end of the third year following the respective closings; |
19
• | aligning our distribution network, with the completed acquisitions of distribution centers in Harrisburg, Pennsylvania and Joliet, Illinois, in addition to the facilities owned and operated by Unified and AG Florida. Among other benefits, our network alignment will help expand Market Centre across the United States; |
• | progressing significantly toward the sale of Farm Fresh and pursuit of the sales of Shop ‘n Save and Shop ‘n Save East; and |
• | retaining our Wholesale customer base. |
Annual Incentive Plan Targets and Payouts for our NEOs
NEO | Base Salary (fiscal 2018 year-end) | Incentive Target as % of Base Salary | Incentive Target in Dollars | Payout Percentage | Payment Earned |
Mark Gross(1) | $1,150,000 | 127% | $1,465,000 | 114% | $1,676,854 |
Rob N. Woseth(2) | $500,000 | 72% | $358,846 | 114% | $410,739 |
James W. Weidenheimer | $575,000 | 75% | $431,250 | 114% | $493,613 |
Michael C. Stigers(3) | $525,000 | 73% | $383,653 | 114% | $439,135 |
Randy G. Burdick | $550,000 | 75% | $412,500 | 114% | $472,152 |
Bruce H. Besanko(4) | $268,269 | 100% | $268,269 | 0% | $0 |
(1) | Mr. Gross’s base salary increased from $1,000,000 to $1,150,000 effective April 23, 2017 and his incentive target adjusted from 100% to 130%, with his bonus target adjustment retroactive to the beginning of the fiscal year. |
(2) | Mr. Woseth’s base salary increased from $420,000 to $500,000 effective June 4, 2017 and his incentive target remained at 75%. |
(3) | Ms. Stigers’s base salary increased from $475,000 to $525,000 effective June 4, 2017 and his incentive target remained at 75%. |
(4) | Mr. Besanko left the Company on July 5, 2017 and his base salary has been adjusted to reflect this departure before the end of fiscal 2018. He did not receive a payout associated with his annual incentive plan for fiscal 2018. |
Annual incentive plan metric adjustments. In April of each year, following preparation of our consolidated financial statements, the Committee reviews our performance and determines the extent to which performance goals under the annual incentive plan are met. In making its determination, the Committee may make discretionary adjustments to our originally established targets or to our results such that our performance results may differ from the numbers reported in our financial statements. In applying these discretionary adjustments, the Committee may exclude all or a portion of both the positive or negative effect of external events that are outside the control of our executives, such as natural disasters, litigation or changes in accounting or taxation standards.
For fiscal 2018, the Committee did not make any adjustments to the targets set under the fiscal 2018 annual incentive plan but did approve two discretionary adjustments to results, which the independent members of the Board ratified with respect to the CEO’s annual incentive payout. The two discretionary adjustments affected both the Consolidated Adjusted EBITDA and Consolidated Sales results as outlined in the table below. The results were objectively calculated based on our original plan for these metrics and then adjusted to: (1) remove the Consolidated Sales and Consolidated Adjusted EBITDA from Unified and AG Florida, which were acquired during the year and not considered when adopting the fiscal 2018 bonus targets; and (2) include the results of operations from our retail stores that were classified in the fourth quarter of fiscal 2018 as assets held for sale and reported in our consolidated financial statements within discontinued operations (Farm Fresh, Shop ‘n Save (based in St. Louis) and Shop ‘n Save East (with stores in West Virginia, Maryland, Pennsylvania and Virginia)).
Adjustments to Results under Fiscal 2018 Annual Incentive Plan
(dollars in millions) | Consolidated Adjusted EBITDA | Consolidated Sales |
Reported Results | $436 | $14,157 |
Discontinued Operations Adjustment | $42 | $1,522 |
Unified Acquisition Adjustment | $(31) | $(2,492) |
AG Florida Acquisition Adjustment | $(5) | $(132) |
Bonus Performance Results | $442 | $13,055 |
20
Long-Term Incentives and Other Stock-Based Awards
We provide long-term incentive compensation opportunities to reinforce the link between the interests of our executives and stockholders. The awards are intended to motivate our executives to improve financial performance over multiple years, to reward our executives for achieving long-term objectives and to drive retention. The awards are also an important component in making our compensation program competitive with the market, yet represent a variable, at-risk pay component that meets the objectives of our compensation philosophy.
We currently grant all LTI and other stock-based awards under our amended and restated SUPERVALU INC. 2012 Stock Plan (the “2012 Stock Plan”) that was approved by our stockholders at our 2016 Annual Meeting of Stockholders. In April of each year, the Committee reviews and approves annual grants of stock-based awards to equity-eligible employees. LTI amounts for our NEOs are informed by internal equity considerations, as well as survey and Peer Group data. For fiscal 2018, the Committee approved our annual LTI compensation in the form of PSUs and RSUs, as well as stock options for our CEO pursuant to his employment agreement, as follows:
50% of initial annual LTI target value in the form of PSUs. We continually review our LTI program to align our executives with our long-term stockholders’ interests and strategic objectives. As part of this review and after considering recent LTI compensation data from companies inside and outside our Peer Group, we continued to utilize PSUs in our LTI program for fiscal 2018. In fiscal 2018, PSUs represented 50% of the initial annual target value for LTI. In addition, for fiscal 2018 the Committee considered the importance of retaining our NEOs as we continued to engage in several key initiatives to transform our business for the benefit of our stockholders, against the retentive value of outstanding awards.
As a result of that review, the Committee increased the target value of PSUs to our NEOs in fiscal 2018. The incremental amount of the PSU awards varied by NEO and was determined based on a variety of factors, including current incentive compensation, scope of responsibilities and role in driving our strategic transformation. Any payouts for the PSUs granted in fiscal 2018 are formulaically determined as discussed below and cliff vest after three years if the Company achieves the pre-determined performance thresholds. An NEO may forfeit all or a portion of the PSUs if he or she does not remain employed by the Company throughout the three-year performance period.
50% of initial annual LTI target value in the form of time-vesting RSUs. RSUs reward and retain NEOs by offering the opportunity to receive Supervalu common stock if they remain employed through the vesting period. RSUs vest 34% on the first anniversary of the grant date and 33% on the second and third anniversaries of the grant date. As part of the review discussed above, the Committee increased the RSU value for Messrs. Weidenheimer and Stigers in recognition of their contributions to our performance, as well as their responsibilities in continuing to transform our business and drive new Wholesale affiliations.
The table below summarizes the grant date value of our long-term incentive awards for fiscal 2018. These awards reflect a blend of considerations, including market value for the NEO’s role, the need for strong incentives that facilitate improved performance, enduring retention, as well as internal equity. Importantly, these grant date values are opportunities not realized values. The ultimate amount realized from these awards may vary substantially as driven by performance against specific financial and total shareholder return goals, as well as the long-term performance of our stock. The realizable value of these awards are directly aligned with shareholder value.
Long-Term Incentive Grants for our NEOs
NEO | Performance Share Units | Restricted Stock Units | Non-Qualified Stock Options | Total Fiscal 2018 LTI Target Value | PSUs | RSUs | Stock Options | |||||||||
(in shares) | ||||||||||||||||
Mark Gross | $ | 1,500,000 | $ | 800,000 | $ | 500,000 | $ | 2,800,000 | 51,387 | 27,407 | 35,903 | |||||
Rob N. Woseth | $ | 452,500 | $ | 317,500 | $ | — | $ | 770,000 | 15,502 | 10,877 | — | |||||
James W. Weidenheimer | $ | 442,500 | $ | 412,500 | $ | — | $ | 855,000 | 15,160 | 14,132 | — | |||||
Michael C. Stigers | $ | 442,500 | $ | 412,500 | $ | — | $ | 855,000 | 15,160 | 14,132 | — | |||||
Randy G. Burdick | $ | 375,000 | $ | 275,000 | $ | — | $ | 650,000 | 12,847 | 9,421 | — | |||||
Bruce H. Besanko | $ | 830,000 | $ | 700,000 | $ | — | $ | 1,530,000 | 28,434 | 23,891 | — | |||||
PSU Performance Criteria
PSUs will result in the issuance of shares of our common stock to NEOs if we achieve the performance goals within applicable performance periods for the PSUs. PSU performance goals are selected based on long-term objectives for our Company and to further align our executive compensation with the interests of our stockholders. PSUs granted under the fiscal
21
2018 LTI plan will vest in February 2020 subject to the satisfaction of the performance goals. There were no PSUs scheduled to vest in fiscal 2018.
The following paragraphs detail the performance goals for the PSUs granted in fiscal 2018:
Absolute TSR growth (“Absolute TSR”) weighted 70%. The use of a multi-year Absolute TSR metric is intended to align the interests of our NEOs with those of our stockholders. Performance is measured as a cumulative percentage growth over the three-year life of the PSUs. Share prices are measured as the average closing stock price for our common stock over a 20-day period prior to the beginning and end of the performance period. Results may be adjusted to account for changes to our structure, such as spin-offs or share splits that occur during the performance period. The actual number of shares delivered at the end of the three-year performance period for this metric may be anywhere from 0% to 200%, depending on Company performance for that period. Performance that is below the threshold will result in zero payout for this portion of the PSU award.
Relative TSR growth (“Relative TSR”) weighted 30%. The use of a multi-year Relative TSR metric is intended to reward our NEOs based on our TSR performance compared to the TSR performance of our Peer Group. Performance is measured as a cumulative percentage growth over the three-year life of the awards and will be stack-ranked against a set of Relative TSR peers. Share prices are measured as the average closing stock price for common stock over a 20-day period prior to the beginning and end of the performance period. The actual number of shares delivered at the end of the three-year performance period for this metric may be anywhere from 0% to 200%, depending on Company stock performance for that period adjusted for any share splits or other corporate actions during the performance period. Performance that is below the 25th percentile will result in no payout for this portion of the PSU award. The Relative TSR comparator group used to determine our ranking is based on the same Peer Group used for benchmarking our executive compensation for fiscal 2018 as detailed above under “Significant Compensation Decisions — Fiscal 2019 — Peer Group.”
PSU Metric Performance Payout Ranges
The table below reflects the performance payout ranges used for our fiscal 2018 PSU metrics. Payouts are linearly interpolated for performance between threshold and maximum. Additional details on the target, actual performance and payout levels will be disclosed at the end of the performance period in fiscal 2021.
PSU Metric Performance Payout Ranges
Metric | Threshold (1) | Target | Maximum |
Absolute TSR (70% weighting) | 50% | 100% | 200% |
Relative TSR (30% weighting) | 25% | 100% | 200% |
(1) Performance below the applicable TSR threshold results in no payout for that metric. | |||
Other Benefits
We offer other health, welfare and retirement benefits, including 401(k) and deferred compensation, to our NEOs to help attract, reward and retain key talent by offering competitive overall benefit coverage. Our NEOs are eligible to participate in these benefits but there is no enhanced benefit for our NEOs. Greater detail for each of these compensation components is provided in the tables that follow the Summary Compensation Table under “Executive Compensation.”
Perquisites
In our industry, it is common for spouses or significant others to attend major industry events. We allow for the reimbursement of customary expenses such as meeting fees, meals, lodging, travel and organized event activities when a spouse or significant other accompanies an executive on business trips or to conferences where spouses or significant others are generally invited or reasonably expected to attend and, in each case, the CEO approves such attendance and reimbursement does not exceed $9,000 per NEO in a fiscal year.
We allow employees to use the Company’s aircraft for personal use when traveling to the same destination as the CEO, and the CEO may approve an employee’s spouse or significant other accompanying the employee when the employee is traveling for personal or business purposes. Any imputed income from this usage is reported as income to the employee, and no tax indemnification is provided. Our CEO is also permitted to use the Company’s aircraft for personal use but is required to reimburse the Company to the extent the incremental or variable costs from his personal use exceeds $50,000 in a fiscal year, provided that personal use included in such $50,000 amount must be ancillary to his business use of the aircraft. Any amounts in excess of or outside of the $50,000 allowance must be reimbursed to the Company. Any imputed income from the CEO’s personal use of the aircraft will be reported as income to the CEO, and no tax indemnification is provided.
22
Post-Employment Compensation
We have post-employment arrangements in place for our NEOs that define the amounts each NEO would be entitled to receive in the event of a termination of his or her employment by the Company, as described in more detail in “Executive Compensation — Post-Employment Compensation” below. These arrangements are generally competitive with the protection provided to similarly-situated executives, and are therefore deemed by the Committee to be aligned with market practices.
Role of the Compensation Consultant
The Committee has the authority to retain outside compensation consultants to assist in the evaluation of executive compensation or to otherwise advise the Committee. The Committee directs the work of such consultants, and decisions regarding compensation of our NEOs are ultimately made by the Committee as delegated by the Board and, in the case of our CEO, ratified by the independent members of the Board.
The Committee continued to retain Exequity as its independent compensation consultant for the first part of fiscal 2018, including to consult with the Committee on our Peer Group and our compensation program for fiscal 2018. In December 2018, the Committee retained Meridian Compensation Partners, LLC (“Meridian”) as its independent compensation consultant. Each of Exequity and Meridian is a nationally recognized independent provider of executive compensation advisory services with no legal or financial connection to any other service provider. In fiscal 2018, each of Exequity and Meridian supported the Committee by: providing competitive data on compensation and relative performance of Peer Group companies (which information allowed the Committee to make informed decisions with the benefit of understanding the factors shaping the external marketplace for executive compensation); providing an updated comprehensive review of our executive compensation program; providing input and suggested approaches with respect to our pay programs; making presentations on regulatory and legislative matters affecting executive compensation; and consulting on other matters as requested.
The Committee determined that the work of each of Exequity and Meridian did not raise any conflicts of interest in fiscal 2018. In making this assessment, the Committee considered the applicable SEC and NYSE independence factors, including the other services each of the consultants provided to the Company, the level of fees received from the Company as a percentage of each of the consultants’ total revenue, policies and procedures employed by the consultants to prevent conflicts of interest, and whether the individual advisers to the Committee from Exequity or Meridian own any Company stock or have any business or personal relationships with members of the Committee or our executive officers.
The Committee has adopted a policy whereby any consulting work done by its independent compensation consultant with expected billings in excess of $25,000, excluding work for the Committee, is subject to pre-approval by the Committee Chair. Exequity, Meridian and their affiliates did not perform any work in fiscal 2018 for the Company outside of their role as compensation consultants to the Committee and as consultants to the Corporate Governance and Nominating Committee regarding director compensation; therefore, no pre-approval was required.
Other Compensation-Related Policies
In addition to the compensation programs detailed above, we have several other policies and programs that impact the compensation of our NEOs and that help support the continued retention and recruitment of key executive talent.
Executive Stock Ownership and Retention Program and Anti-Hedging/Pledging Policy
The Company has an executive stock ownership and retention program for our NEOs and other executives to ensure that our executives experience the same downside risk and upside potential that our stockholders experience. The current stock ownership and retention program requirements for our senior officers, including our NEOs, are as follows:
Stock Ownership Guidelines
Position | Multiple of Base Salary |
Chief Executive Officer | 5 times |
Chief Financial Officer | 4 times |
Executive Vice Presidents | 3 times |
Corporate Senior Vice Presidents & Business Unit Presidents | 1 times |
For purposes of complying with our executive stock ownership and retention program, stock is considered owned if the shares are owned outright, if the shares are owned by immediate family members or legal entities established for their benefit, or if the shares are in the form of unvested restricted stock or stock-settled restricted stock units. None of outstanding unexercised stock options, performance share units nor cash-settled restricted stock units are considered owned for purposes of our program.
23
Until an executive has met the ownership multiple set forth above, the executive is required to retain shares equal to 50% of the net after-tax profit received from stock option exercises or the vesting of restricted stock or restricted stock units. This 50% retention requirement can be satisfied on either an individual basis for each stock option exercise or restricted stock or restricted stock unit vesting event, or on a cumulative basis by aggregating all shares held from the exercise of stock options or the vesting of restricted stock or restricted stock units from the date the executive first met our stock ownership requirement.
In fiscal 2018, all of our NEOs were in compliance with our executive stock ownership and retention program through compliance with the retention requirements. Certain of our NEOs continue to work towards satisfying the ownership multiples set forth above.
Our NEOs and other senior officers may not pledge owned shares as security, enter into any risk hedging arrangements or engage in any short sales or trading in put and call options with respect to the Company’s securities.
Recoupment Policy
Our recoupment (or “clawback”) policy allows for recovery of the following compensation elements:
• | all amounts paid under the annual incentive plan, including any discretionary amounts, that were paid with respect to any fiscal year that is restated; and |
• | all awards under the long-term incentive program, the 2012 Stock Plan or any preceding or successor plans that were issued or paid with respect to any fiscal year that is restated. |
This policy applies in the event there is an accounting restatement due to the material noncompliance under any financial reporting requirements that results in performance-based compensation that would have been a lower amount if it had been calculated based on such restated results.
Deductibility of Compensation
Section 162(m) of the Internal Revenue Code has historically disallowed a federal income tax deduction to public companies for compensation greater than $1 million paid in any tax year to covered executive officers unless the compensation meets the requirements of the “qualified performance-based compensation” exemption under that section. As discussed below, recent legislation has eliminated the “qualified performance-based compensation” exemption for tax years after 2017. As a general matter, while the Committee considers tax deductibility as one of several relevant factors in determining compensation, it continues to retain the flexibility to design and maintain executive compensation arrangements that it believes will attract and retain executive talent, even if such compensation is not deductible by the Company for federal income tax purposes.
In fiscal 2018, the Committee established incentive pools for NEOs, as well as other executives whose compensation is determined by the Committee, for annual incentive plan payouts and PSU payouts. This “umbrella” plan structure created a pool from which payments can be made if we achieved certain financial targets; however, the actual amount of any payout was based on the performance under the metrics of our annual incentive plans or PSU grants, as applicable, as described above. This structure was designed to permit us to grant awards that may qualify for the “qualified performance-based compensation” exemption; however, as noted above, this exemption was eliminated by recent tax legislation, effective for taxable years beginning after December 31, 2017. The recent tax legislation also expanded the group of executives covered by Section 162(m). Therefore, we expect that compensation paid to our covered executive officers in excess of $1 million in 2018 and later tax years will not be deductible by the Company unless it qualifies for limited transition relief that applies to certain arrangements in place as of November 2, 2017.
Because of uncertainties in the application and interpretation of Section 162(m) in the absence at this juncture of regulatory guidance on the scope of the transition relief or otherwise, no assurance can be given that awards paid in 2018 and later years that were originally intended to qualify for the “qualified performance-based compensation” exemption, or that were otherwise expected to be deductible prior to the recent tax legislation, will in fact be deductible. Nonetheless, as in prior years, the Committee believes that the tax deduction limitation imposed by Section 162(m) should not be permitted to compromise the ability to design and maintain executive compensation arrangements that will attract and retain executive talent. Accordingly, achieving the desired flexibility in the design and delivery of compensation may result in compensation that is not deductible for federal income tax purposes.
24
Supplemental Non-GAAP Financial Information Used in Compensation Performance Metrics
Our Consolidated Financial Statements are prepared and presented in accordance with generally accepted accounting principles in the United States (“GAAP”). The “Compensation Discussion and Analysis” contains references to certain financial measurements that are not measured in accordance with GAAP (“non-GAAP”). The measures and items identified below, such as Adjusted EBITDA, are provided as a supplement to our results of operations. We consider these non-GAAP financial measures to assess the performance of our business, understand underlying operating performance and core business trends, which we use to facilitate operating performance comparisons of our business on a consistent basis over time, and as a compensation performance measure. The measures and items identified below, such as Adjusted EBITDA, are provided as a supplement to our results of operations and related analysis, and should not be considered superior to, a substitute for or an alternative to any financial measure of performance prepared and presented in accordance with GAAP. In each of these measures, certain items are omitted either because they are non-cash items or are items that are not considered in our supplemental assessment of ongoing business performance. Certain of these adjustments are considered in similar supplemental analyses by other companies, such as depreciation and amortization, impairment charges and certain other adjustments.
We believe these non-GAAP measures are useful to investors and financial institutions because Adjusted EBITDA provides additional understanding of other factors and trends affecting our business, which are used in the business planning process to understand expected performance, to evaluate results against those expectations, and as one of the compensation performance measures under certain compensation programs and plans. We believe Adjusted EBITDA is more reflective of factors that affect our underlying operating performance and facilitate operating performance comparisons of our business segments on a consistent basis over time.
Investors are cautioned that there are material limitations associated with the use of non-GAAP financial measures as an analytical tool. Certain adjustments to our GAAP financial measures reflected below exclude items that may be considered recurring in nature and may be reflected in our financial results for the foreseeable future. These measurements and items may be different from non-GAAP financial measures used by other companies. All measurements are provided with a reconciliation from a GAAP measurement. The non-GAAP financial measures below should only be considered as an additional supplement to our financial results reported in accordance with GAAP and should be reviewed in conjunction with our results reported in accordance with GAAP in our Annual Report on Form 10-K for the fiscal year ended February 24, 2018.
There are significant limitations to using Adjusted EBITDA as a financial measure including, but not limited to, it not reflecting cash expenditures for capital assets or contractual commitments, changes in working capital, income taxes, capital lease obligations and debt service expenses that are recurring in our results of operations.
We define Adjusted EBITDA as Net earnings (loss) from continuing operations, plus Interest expense, net and Income tax provision (benefit), less Net earnings attributable to noncontrolling interests calculated in accordance with GAAP, plus non-GAAP adjustments for Depreciation and amortization, LIFO charge (credit), certain employee-related costs and pension-related charges (including severance costs, pension settlement charges, multiemployer pension withdrawal charges, accelerated stock- based compensation charges and other items), certain non-cash asset impairment and other charges (including asset write-offs, store closures and market exits), certain gains and losses on the sale of property, goodwill and intangible asset impairment charges, costs related to the separation of businesses, legal settlement charges and gains, contract breakage costs and certain other non-cash charges or items, as determined by management.
25
The following table reconciles Adjusted EBITDA to Net earnings from continuing operations:
2018 (52 weeks) | |||
Net earnings from continuing operations | $ | 49 | |
Less: net earnings attributable to noncontrolling interests | (1) | ||
Income tax provision | 28 | ||
Interest expense, net | 132 | ||
Depreciation and amortization | 197 | ||
LIFO charge | 1 | ||
Merger and integration costs(1) | 37 | ||
Legal reserve charge(2) | 9 | ||
Severance costs(3) | 8 | ||
Store closure charges and costs(4) | 3 | ||
Asset impairment and other charges, net of gains(5) | 2 | ||
Gain on sale of property(6) | (3) | ||
Vendor settlement income(7) | (5) | ||
Benefit plan termination gain(8) | (8) | ||
Gain on sale of unconsolidated affiliates(9) | (13) | ||
Adjusted EBITDA | $ | 436 | |
(1) | Merger and integration costs relate to the acquisition and integration of Unified and AG Florida and primarily reflect employee severance and transition costs, acquisition costs and a multiemployer pension withdrawal charge. We expect to continue to incur merger and integration costs until the completion of the integration of Unified and AG Florida. |
(2) | Legal reserve charge reflects a settlement for certain legal proceedings. |
(3) | Severance costs primarily reflect termination costs for employees who are not part of our ongoing business. |
(4) | Store closure charges and costs include impairment, severance and related costs due to store closures, including the sale of pharmacy prescription files related to a store closure. |
(5) | Asset impairment charges include non-cash charges related to our Retail business in fiscal 2018. |
(6) | Gain on sale of property primarily reflects cash received in excess of the property’s carrying value. |
(7) | Vendor settlement income reflect funds received from vendors related to prior year claim settlements. |
(8) | Benefit plan termination gain reflects the cancellation of certain non-qualified benefit plans. |
(9) | Gain on sale of unconsolidated affiliates reflects the proceeds received from the sale of equity investments. |
REPORT OF THE LEADERSHIP DEVELOPMENT AND COMPENSATION COMMITTEE
The Leadership Development and Compensation Committee has reviewed and discussed the Compensation Discussion and Analysis required by Item 402(b) of Regulation S-K with management and, based on such review and discussion, the Committee recommended to the Board that the Compensation Discussion and Analysis be included in this Amendment.
Respectfully submitted, | |
Philip L. Francis, Chair Frank A. Savage Mary A. Winston | |
26
EXECUTIVE COMPENSATION
The following tables and accompanying narrative disclosure should be read in conjunction with the “Compensation Discussion and Analysis,” which sets forth the objectives of Supervalu’s executive compensation and benefit program. All share amounts, equity award totals and share prices have been restated to give effect to the 1-for-7 reverse stock split that was effective on August 1, 2017.
The table below shows compensation for the last three fiscal years for the individuals who served as Chief Executive Officer and Chief Financial Officer during any part of fiscal 2018 and each of the other three most highly compensated executive officers who were still serving at the end of fiscal 2018.
SUMMARY COMPENSATION TABLE
Name and Principal Position | Year | Salary ($)(1) | Bonus ($) | Stock Awards ($)(2) | Option Awards ($)(3) | Non-Equity Incentive Plan Compensation ($)(4) | Change in Pension Value and Non-Qualified Deferred Compensation Earnings ($)(5) | All Other Compensation ($)(6) | Total ($) | |||||||
Mark Gross | 2018 | 1,126,923 | — | 2,635,986 | 499,848 | 1,676,854 | — | 26,557 | 5,966,168 | |||||||
President and Chief | 2017 | 1,000,000 | — | 3,534,569 | — | 191,072 | — | 20,166 | 4,745,807 | |||||||
Executive Officer | 2016 | 61,538 | 300,000 | — | 3,374,995 | — | — | 64,084 | 3,800,617 | |||||||
Rob N. Woseth | 2018 | 478,461 | — | 871,350 | — | 410,739 | — | 25,903 | 1,786,453 | |||||||
Executive Vice President | 2017 | 414,615 | 110,000 | 566,386 | 168,734 | 59,416 | 456 | 1,895 | 1,321,502 | |||||||
and Chief Financial Officer | ||||||||||||||||
James W. Weidenheimer | 2018 | 575,000 | — | 954,129 | — | 493,613 | — | 2,683 | 2,025,425 | |||||||
Executive Vice President, | 2017 | 486,538 | 475,000 | 659,436 | 156,234 | 69,723 | — | 20,405 | 1,867,336 | |||||||
Corporate Development and | ||||||||||||||||
Chief Innovation Officer | ||||||||||||||||
Michael C. Stigers | 2018 | 511,538 | — | 954,129 | — | 439,135 | 1,329 | 9,433 | 1,915,564 | |||||||
Executive Vice President, | 2017 | 475,000 | 85,000 | 524,437 | 156,234 | 94,725 | 480 | 17,418 | 1,353,294 | |||||||
Wholesale | ||||||||||||||||
Randy G. Burdick | 2018 | 550,000 | — | 733,991 | — | 472,152 | — | 8,586 | 1,764,729 | |||||||
Executive Vice President, | 2017 | 547,308 | 110,000 | 419,546 | 124,989 | 78,432 | — | 1,639 | 1,281,914 | |||||||
Chief Information Officer | 2016 | 540,000 | — | 249,996 | 249,963 | 232,571 | — | 1,608 | 1,274,138 | |||||||
Bruce H. Besanko(7) | 2018 | 268,269 | — | 1,715,916 | — | — | 664 | 58,687 | 2,043,536 | |||||||
Former Executive Vice | 2017 | 750,000 | 155,000 | 1,174,739 | 349,965 | 143,304 | — | 46,614 | 2,619,622 | |||||||
President, Chief Operating | 2016 | 705,289 | — | 600,004 | 590,953 | 405,012 | — | 161,671 | 2,462,929 | |||||||
Officer and Chief Financial Officer | ||||||||||||||||
(1) | Amounts shown are not reduced to reflect an NEO’s election, if any, to defer receipt of salary under the Executive Deferred Compensation Plan described below. |
(2) | The amounts shown in this column reflect the full aggregate grant date fair value calculated in accordance with Financial Accounting Standards Board Accounting Standards Codification Topic 718 (“FASB ASC 718”), excluding the effect of estimated forfeitures for: (a) fiscal 2016 for restricted stock awards, (b) fiscal 2018 and 2017 for both restricted stock units and performance share units, and (c) fiscal 2016 for both cash-settled and stock-settled restricted stock units. Details of the 2018 grants are provided in the Grants of Plan-Based Awards for Fiscal 2018 table below. In accordance with FASB ASC 718, the grant date fair value for the restricted stock and the restricted stock units equals the closing stock price on the date of grant. For the performance share units granted in fiscal 2018 and 2017, the grant date fair value is calculated using the Monte Carlo simulation value based on the probable satisfaction of the performance conditions for such awards. Refer to Note 1 — Summary of Significant Accounting Policies and Note 14 — Stock-Based Awards within Part II, Item 8 of our Annual Report on Form 10-K for the fiscal year ended February 24, 2018 for our policy and assumptions made in determining the grant date fair value of stock-based awards. Note that the amounts reported in this column do not necessarily correspond to the actual economic value that will be received by our NEOs from restricted stock, restricted stock units and performance share units upon vesting. |
(3) | The amounts shown in this column reflect the full aggregate grant date fair value of option awards granted in fiscal years 2018, 2017 and 2016 calculated in accordance with FASB ASC 718, excluding the effect of estimated forfeitures. Refer to Note 1 — Summary of Significant Accounting Policies and Note 14 — Stock-Based Awards within Part II, Item 8 of our Annual Report on Form 10-K for the fiscal year ended February 24, 2018 for our policy and assumptions made in determining the grant date fair value of option awards. Note that the amounts reported in this column do not necessarily correspond to the actual economic value that will be received by our NEOs from the options. |
27
(4) | Non-equity incentive plan compensation for fiscal 2018, 2017 and 2016 represents the amounts earned in recognition of the achievement of performance goals under our annual incentive plan. |
(5) | This column represents both changes in pension value for our NEOs and above-market interest earnings on deferred compensation. In fiscal 2018 and 2017, no NEOs were eligible for pension benefits. For fiscal 2018 and 2017, the amounts in this column represent the above-market interest earnings on deferred compensation. |
(6) | The following components comprise the amounts of “All Other Compensation” for our NEOs for fiscal 2018: |
Name | Health Savings Account Employer Contributions ($) | Life Insurance ($)(a) | Aircraft ($)(b) | New Hire Benefits ($)(c) | Termination Benefits ($)(d) | Deferred Comp Company Match ($)(e) | 401(k) Company Match ($) | Total ($) |
Mark Gross | 900 | 1,512 | 15,283 | 1,652 | — | — | 7,210 | 26,557 |
Rob N. Woseth | 900 | 696 | — | — | — | 17,360 | 6,947 | 25,903 |
James W. Weidenheimer | — | 773 | — | 1,910 | — | — | — | 2,683 |
Michael C. Stigers | — | 689 | — | — | — | 1,797 | 6,947 | 9,433 |
Randy G. Burdick | 900 | 739 | — | — | — | — | 6,947 | 8,586 |
Bruce H. Besanko | — | 336 | — | — | 49,810 | 1,594 | 6,947 | 58,687 |
(a) | Represents premiums paid for current employee life insurance coverage under the group term life policy maintained by the Company for the benefit of the NEO. |
(b) | For Mr. Gross, this amount is associated with his personal use of the Company aircraft in conjunction with business travel. We calculate the incremental cost to the Company of any personal use of the corporate aircraft based on the cost of fuel, trip-related maintenance, crew travel expenses, on-board catering, landing fees, trip-related hangar and parking costs and other variable costs. Because the corporate aircraft is primarily for business travel, we do not include the fixed costs that do not change based on usage, such as pilots’ salaries, the purchase cost of the corporate aircraft and the cost of maintenance not related to trips. No tax indemnification is provided by the Company relating to personal use of the aircraft. Messrs. Stigers, Weidenheimer and Woseth each had limited personal use of the Company aircraft under our aircraft use policy for which there was no aggregate incremental cost. |
(c) | For Mr. Gross and Mr. Weidenheimer, these amounts represent relocation benefits under the Company’s relocation program. |
(d) | For Mr. Besanko, this amount represents accrued vacation time that was paid out in connection with his resignation. |
(e) | For fiscal 2018, this includes contributions accrued for the Company’s deferred compensation plan participants as a Company match. |
(7) | Mr. Besanko resigned from the Company effective July 5, 2017. |
28
GRANTS OF PLAN-BASED AWARDS FOR FISCAL 2018
Name | Grant Date | Approval Date | Estimated Possible Payouts under Non-Equity Incentive Plan Awards(1) | Estimated Future Payouts under Equity Incentive Plan Awards(2) | All Other Stock Awards: Number of Shares of Stock or Units (#)(3) | All Other Option Awards: Number of Securities Underlying Options (#) | Exercise or Base Price of Option Awards ($/Share) | Grant Date Fair Value of Stock and Option Awards ($) | ||||
Threshold ($) | Target ($) | Max ($) | Threshold (#) | Target (#) | Max (#) | |||||||
Mark Gross | 366,250 | 1,465,000 | 2,930,000 | |||||||||
4/27/2017 | 4/20/2017 | 17,986 | 35,971 | 71,942 | 1,188,491 | |||||||
4/27/2017 | 4/20/2017 | 3,854 | 15,416 | 30,832 | 647,484 | |||||||
4/27/2017 | 4/20/2017 | 27,407 | 800,010 | |||||||||
4/27/2017 | 4/20/2017 | 35,903(4) | 29.19 | 499,848 | ||||||||
Rob N. Woseth | 89,712 | 358,846 | 717,692 | |||||||||
4/27/2017 | 4/20/2017 | 5,426 | 10,851 | 21,702 | 358,526 | |||||||
4/27/2017 | 4/20/2017 | 1,163 | 4,651 | 9,302 | 195,324 | |||||||
4/27/2017 | 4/20/2017 | 10,877 | 317,500 | |||||||||
James W. Weidenheimer | 107,813 | 431,250 | 862,500 | |||||||||
4/27/2017 | 4/20/2017 | 5,306 | 10,612 | 21,224 | 350,606 | |||||||
4/27/2017 | 4/20/2017 | 1,137 | 4,548 | 9,096 | 191,010 | |||||||
4/27/2017 | 4/20/2017 | 14,132 | 412,513 | |||||||||
Michael C. Stigers | 95,913 | 383,653 | 767,306 | |||||||||
4/27/2017 | 4/20/2017 | 5,306 | 10,612 | 21,224 | 350,606 | |||||||
4/27/2017 | 4/20/2017 | 1,137 | 4,548 | 9,096 | 191,010 | |||||||
4/27/2017 | 4/20/2017 | 14,132 | 412,513 | |||||||||
Randy G. Burdick | 103,125 | 412,500 | 825,000 | |||||||||
4/27/2017 | 4/20/2017 | 4,497 | 8,993 | 17,986 | 297,124 | |||||||
4/27/2017 | 4/20/2017 | 964 | 3,854 | 7,708 | 161,868 | |||||||
4/27/2017 | 4/20/2017 | 9,421 | 274,999 | |||||||||
Bruce H. Besanko | 187,500 | 750,000 | 1,500,000 | |||||||||
4/27/2017 | 4/20/2017 | 9,952 | 19,904 | 39,808 | 657,633 | |||||||
4/27/2017 | 4/20/2017 | 2,133 | 8,530 | 17,060 | 358,278 | |||||||
4/27/2017 | 4/20/2017 | 23,981 | 700,005 | |||||||||
(1) | Represents range of possible payouts under our annual incentive plan. The actual amount of the award earned for fiscal 2018 is presented in the Non-Equity Incentive Plan Compensation column of the Summary Compensation Table. Annual incentive awards are performance-based, and are only paid if certain minimum performance criteria are met. The threshold amount represents the minimum payout that will be earned, if the minimum performance criteria for each metric are met. The threshold amount represents a payout of 25% of the participant’s annual target award and the maximum amount reflects a payout of 200% of such target award. The threshold, target and maximum amounts have been prorated for any NEO who was hired during fiscal 2018 or had an adjustment to his or her base salary or annual incentive target during fiscal 2018. The annual incentive plan and these pro-rations are described above in “CD&A — Total Direct Compensation for our Executive Officers — Annual Incentive Plan.” |
(2) | Represents range of possible payouts under our fiscal 2018 long-term incentive PSU awards granted under our 2012 Stock Plan. The PSU awards are performance-based, are paid only if certain minimum performance criteria are met, settle in stock, and vest on the third anniversary of the grant date. The PSU awards were designed to reward the achievement of an Absolute TSR goal (weighted at 70%) and a Relative TSR goal (weighted at 30%), over a three-year performance period. The performance metrics and methodology for calculating payments are described above in “CD&A — Total Direct Compensation for our Executive Officers — Long-Term Incentives and Other Stock-Based Awards.” The threshold amount represents the minimum payout that will be earned, if the minimum performance criteria for each metric are met. For Absolute TSR, the threshold amount represents a payout of 50% of the participant’s target award and the maximum amount reflects a payout of 200% of such target award. For Relative TSR, the threshold amount represents a payout of 25% of the participant’s target award and the maximum amount reflects a payout of 200% of such target award. |
(3) | Represents a stock-settled restricted stock unit granted under our 2012 Stock Plan. The award vests with respect to 34%, 33% and 33% on each of the first, second and third anniversaries of the grant date. |
(4) | Represents a stock option granted under our 2012 Stock Plan. The option vests with respect to 34%, 33% and 33% on each of the first, second and third anniversaries of the grant date. |
29
OUTSTANDING EQUITY AWARDS AT FEBRUARY 24, 2018
Option Awards | Stock Awards | ||||||||||||||||||
Name | Number of Securities Underlying Unexercised Options (#) Exercisable | Number of Securities Underlying Unexercised Options (#) Unexercisable | Option Exercise Price ($) | Option Expiration Date | Number of Shares or Units of Stock Held that have not Vested (#) | Market Value of Shares or Units of Stock that have not Vested ($)(17) | Equity Incentive Plan Awards: Number of Unearned Shares, Units or Other Rights that have not Vested (#) | Equity Incentive Plan Awards: Market or Payout Value of Unearned Shares, Units or Other Rights that have not Vested ($)(17) | |||||||||||
Mark Gross | 35,903 | (1) | $29.19 | 4/27/2027 | 27,407 | (3) | 376,298 | 17,986 | (4) | 246,941 | |||||||||
155,552 | (2) | 76,615 | (2) | $29.75 | 2/5/2026 | 3,854 | (5) | 52,915 | |||||||||||
9,499 | (6) | 130,414 | |||||||||||||||||
9,499 | (7) | 130,414 | |||||||||||||||||
Totals: | 155,552 | 112,518 | 27,407 | 376,298 | 40,837 | 560,685 | |||||||||||||
Rob N. Woseth | 3,071 | (8) | 5,961 | (8) | $39.48 | 4/28/2026 | 10,877 | (3) | 149,341 | 5,426 | (4) | 74,492 | |||||||
8,422 | (9) | 4,148 | (9) | $61.53 | 4/30/2025 | 2,821 | (12) | 38,732 | 1,163 | (5) | 15,965 | ||||||||
21,343 | (10) | $52.50 | 5/16/2024 | 1,810 | (13) | 24,851 | 1,069 | (6) | 14,671 | ||||||||||
26,675 | (11) | $45.43 | 5/7/2023 | 1,069 | (7) | 14,671 | |||||||||||||
7,143 | (11) | $45.43 | 5/7/2023 | ||||||||||||||||
Totals: | 66,654 | 10,109 | 15,508 | 212,925 | 8,725 | 119,798 | |||||||||||||
James W. Weidenheimer | 2,843 | (8) | 5,520 | (8) | $39.48 | 4/28/2026 | 14,132 | (3) | 194,032 | 5,306 | (4) | 72,851 | |||||||
2,612 | (12) | 35,863 | 1,137 | (5) | 15,611 | ||||||||||||||
1,710 | (14) | 23,478 | 990 | (6) | 13,586 | ||||||||||||||
990 | (7) | 13,586 | |||||||||||||||||
Totals: | 2,843 | 5,520 | 18,454 | 253,373 | 8,422 | 115,634 | |||||||||||||
Michael C. Stigers | 2,843 | (8) | 5,520 | (8) | $39.48 | 4/28/2026 | 14,132 | (3) | 194,032 | 5,306 | (4) | 72,851 | |||||||
4,991 | (9) | 2,458 | (9) | $61.53 | 4/30/2025 | 2,612 | (12) | 35,863 | 1,137 | (5) | 15,611 | ||||||||
14,229 | (10) | $52.50 | 5/16/2024 | 1,072 | (13) | 14,719 | 990 | (6) | 13,586 | ||||||||||
17,783 | (11) | $45.43 | 5/7/2023 | 990 | (7) | 13,586 | |||||||||||||
6,386 | (15) | $15.96 | 7/17/2022 | ||||||||||||||||
Totals: | 46,232 | 7,978 | 17,816 | 244,614 | 8,422 | 115,634 | |||||||||||||
Randy G. Burdick | 2,275 | (8) | 4,416 | (8) | $39.48 | 4/28/2026 | 9,421 | (3) | 129,350 | 4,497 | (4) | 61,737 | |||||||
6,238 | (9) | 3,073 | (9) | $61.53 | 4/30/2025 | 2,090 | (12) | 28,696 | 964 | (5) | 13,229 | ||||||||
15,810 | (10) | $52.50 | 5/16/2024 | 1,340 | (13) | 18,398 | 792 | (6) | 10,867 | ||||||||||
19,759 | (11) | $45.43 | 5/7/2023 | 792 | (7) | 10,867 | |||||||||||||
22,857 | (11) | $45.43 | 5/7/2023 | ||||||||||||||||
Totals: | 66,939 | 7,489 | 12,851 | 176,444 | 7,043 | 96,700 | |||||||||||||
Bruce H. Besanko (16) | — | — | — | — | — | — | |||||||||||||
(1) | This non‑qualified stock option vests 34%, 33% and 33% on each anniversary of the grant date, with vesting dates of April 27, 2018, April 27, 2019 and April 27, 2020. |
(2) | This non‑qualified stock option vests 34%, 33% and 33% on each anniversary of the grant date, with vesting dates of February 5, 2017, February 5, 2018 and February 5, 2019. |
(3) | Represents a stock‑settled restricted stock unit that vests 34%, 33% and 33% on each anniversary of the grant date, with vesting dates of April 27, 2018, April 27, 2019 and April 27, 2020. |
(4) | Represents performance share units that were granted on April 27, 2017. These cliff vest on the third anniversary of the grant date, subject to the achievement of our Absolute TSR metric for fiscal 2018 awards. In calculating the number of performance share units and their value, we are required by SEC rules to use the number of units that have not vested and not been earned, based on achieving threshold performance goals. No performance units were earned by the NEOs in fiscal 2018. |
(5) | Represents performance share units that were granted on April 27, 2017. These cliff vest on the third anniversary of the grant date, subject to the achievement of our Relative TSR metric for fiscal 2018 awards. In calculating the number of performance share units and their value, we are required by SEC rules to use the number of units that have not vested and not been earned, based on achieving threshold performance goals. No performance units were earned by the NEOs in fiscal 2018. |
(6) | Represents performance share units that were granted on April 28, 2016. These cliff vest on the third anniversary of the grant date, subject to the achievement of our Absolute TSR metric for fiscal 2017 awards. In calculating the number of performance share units and their value, we are required by SEC rules to use the number of units that have not vested and not been earned, based on achieving threshold performance goals. No performance units were earned by the NEOs in fiscal 2018. |
(7) | Represents performance share units that were granted on April 28, 2016. These cliff vest on the third anniversary of the grant date, subject to the achievement of our EBITDA Growth metric for fiscal 2017 awards. In calculating the number of performance share units and their value, we are required |
30
by SEC rules to use the number of units that have not vested and not been earned, based on achieving threshold performance goals. No performance units were earned by the NEOs in fiscal 2018.
(8) | This non‑qualified stock option vests 34%, 33% and 33% on each anniversary of the grant date, with vesting dates of April 28, 2017, April 28, 2018 and April 28, 2019. |
(9) | This non‑qualified stock option vests 34%, 33% and 33% on each anniversary of the grant date, with vesting dates of April 30, 2016, April 30, 2017 and April 30, 2018. |
(10) | This non‑qualified stock option vests 34%, 33% and 33% on each anniversary of the grant date, with vesting dates of May 16, 2015, May 16, 2016 and May 16, 2017. |
(11) | This non‑qualified stock option vests 34%, 33% and 33% on each anniversary of the grant date, with vesting dates of May 7, 2014, May 7, 2015 and May 7, 2016. |
(12) | Represents a stock‑settled restricted stock unit that vests 34%, 33% and 33% on each anniversary of the grant date, with vesting dates of April 28, 2017, April 28, 2018 and April 29, 2019. |
(13) | Represents a restricted stock award that vests 34%, 33% and 33% on each anniversary of the grant date, with vesting dates of April 30, 2016, April 30, 2017 and April 30, 2018. |
(14) | Represents a restricted stock award granted in connection with the hiring of Mr. Weidenheimer. The award vests 50% on each anniversary of the grant date, with vesting dates on April 28, 2017 and April 28, 2018. |
(15) | This non‑qualified stock option vests in three equal installments per year, with vesting dates of July 17, 2013, July 17, 2014 and July 17, 2015. |
(16) | Mr. Besanko’s employment terminated on July 5, 2017. His unvested equity awards forfeited and his vested options expired on October 5, 2017. |
(17) | The amounts shown in this column are calculated using a per share value of $13.73, the closing market price of a share of our common stock on the NYSE on February 23, 2018 (the last trading day of our 2018 fiscal year). |
OPTION EXERCISES AND STOCK VESTED FOR FISCAL 2018
Option Awards | Stock Awards | ||||
Name | Number of Shares Acquired on Exercise (#)(1) | Value Realized on Exercise ($)(1) | Number of Shares Acquired on Vesting (#) | Value Realized on Vesting ($)(2) | |
Mark Gross | — | — | — | — | |
Rob N. Woseth | — | — | 4,323 | 122,067 | |
James W. Weidenheimer | — | — | 3,055 | 87,679 | |
Michael C. Stigers | — | — | 3,125 | 88,351 | |
Randy G. Burdick | — | — | 3,202 | 90,414 | |
Bruce H. Besanko | — | — | 7,268 | 205,622 | |
(1) | There were no options exercised by our NEOs in fiscal 2018. |
(2) | Amounts reflect the market value of the Company’s common stock on the day the stock vested, determined by multiplying the number of shares acquired on vesting by the closing sales price for the Company’s common stock on the NYSE on the vesting date. |
Retirement Benefits
We previously provided various retirement benefits to certain of our executives under our SUPERVALU INC. Retirement Plan, the SUPERVALU INC. Excess Benefits Plan and the “Pension Make-Up Benefit” under the SUPERVALU INC. Executive Deferred Compensation Plan (the “EDCP”). These plans have since been frozen with respect to benefits for grandfathered participants, and none of our NEOs participate in, or are currently eligible for any retirement benefits under, any of these plans. Our NEOs are eligible to participate in our 401(k) plan that is available to most employees.
Deferred Compensation
Under our Executive Deferred Compensation Plan (2008 Statement), eligible executives may elect to defer, on a pre-tax basis, up to 50% of base salary and may elect to defer up to 100% of annual incentive compensation during the plan year. The program allows executives to save for retirement on a tax-deferred basis. Under this unfunded plan, amounts deferred by the executive accumulate on a tax-deferred basis and are credited at an effective annual interest rate equal to Moody’s Corporate Bond Index, set as of October 1 of the preceding year.
31
NONQUALIFIED DEFERRED COMPENSATION IN FISCAL 2018
Name | Executive Contributions in Last Fiscal Year ($) | Company Contributions in Last Fiscal Year ($) | Aggregate Earnings in Last Fiscal Year($)(1) | Aggregate Withdrawals/ Distributions ($) | Aggregate Balance at Last Fiscal Year End ($) |
Mark Gross | — | — | — | — | — |
Rob N. Woseth | — | 17,360 | 2,568 | — | 80,244 |
James W. Weidenheimer | — | — | — | — | — |
Michael C. Stigers | 35,945 | 1,797 | 8,853 | 61,732 | 228,016 |
Randy G. Burdick | — | — | — | — | — |
Bruce H. Besanko | 31,877 | 1,594 | 4,953 | — | 129,961 |
(1) | Earnings for the current and inactive plans are determined based on a combination of a fixed percentage rate as well as variable interest rate methodologies based on current account balances. |
SUPERVALU INC. Executive Deferred Compensation Plan
The EDCP provides that an eligible executive can elect to defer between 5% and 50% of base salary and between 5% and 100% of annual incentive compensation. A new deferral election can be made before the beginning of each calendar year and is effective for that calendar year as to base salary and for the fiscal year that begins in that calendar year as to incentive compensation. The amount deferred for a year is credited to an unfunded bookkeeping account for that year and that account is credited from time to time with interest at a rate determined by reference to Moody’s Corporate Average Bond Index for the year ending in the October preceding the calendar year. With each deferral election, the employee also makes an election of (i) whether the account for that year will be distributed in a lump sum or in 5, 10 or 15 annual installments and (ii) the time when distribution of that year’s account will be paid in a lump sum or commenced in installments (either a specified date or upon separation from service). Supervalu may, in its discretion, credit additional amounts to a participant’s account. If distribution is to be made to a “key employee,” the portion of the benefit attributable to deferral after December 31, 2004, will be delayed for six months following separation from service. Subject to limited exceptions, all amounts are 100% non-forfeitable. A “key employee” is determined by the definition provided by the IRS. The EDCP allowed executives the opportunity to elect deferral of both fiscal 2018 base salary and bonus.
32
Post-Employment Compensation
Executive Severance Plan
The Company offers an executive severance plan to provide transitional assistance to executives who are separated from employment with the Company. No changes were made to the severance plan during fiscal 2018, and the plan is summarized below:
Plan Provision | Description | |
Severance Triggers | • | Involuntary termination without “cause” as defined below, subject to certain exclusions. |
• | “Cause” is defined as continued failure to perform duties, conviction of a felony, conduct materially and demonstrably injurious to the Company, personal dishonesty that results in substantial personal enrichment or failure to comply with certain Company policies. | |
Severance Benefits | • | 2 times for our CEO, 1.5 times for EVPs, and 1 time for SVPs, of annual base salary at time of termination. |
• | 2 times for our CEO, 1.5 times for EVPs, and 1 time for SVPs, of the average of the performance results (expressed as a percentage) used to determine the NEOs’ bonus amounts under the annual bonus plan for the preceding three years (or all bonus amounts, if the NEO has been employed fewer than three years), multiplied by the NEO’s current target bonus amount. | |
• | Pro rata annual incentive, including the portion paid in stock, and payments for each long-term incentive plan cycle, not completed as of the termination date. | |
• | Reimbursement for COBRA coverage for medical and/or dental insurance. | |
• | Outplacement services not to exceed $25,000, paid to an outplacement provider and not to the executive. | |
• | Repayment of severance benefits received by an NEO whom the Company rehires in any capacity within six months of the termination date. | |
• | Requires execution of a release of claims acceptable to the Company. | |
Covenants | • | Non-disclosure of confidential information; non-solicitation of employees; non-solicitation of existing or prospective customers, vendors and suppliers; non-competition; return of property; and non-disparagement covenants. |
Executive Change of Control Agreements
Our objective is to provide NEOs and other executives with protection under a market competitive change of control severance agreement. The Committee believes that this benefit helps to maintain the impartiality and objectivity of our executives in the event of a change of control situation so that our stockholders’ interests are protected. The Committee reviews this change of control policy periodically to address whether these protections are consistent with the Committee’s philosophy and our competitive market, as well as in compliance with federal tax rules affecting nonqualified deferred compensation.
In November 2013, the Board approved, including only the independent members of the Board with respect to the CEO, a change of control severance agreement that the Company subsequently entered into at varying times with each of our NEOs. The change of control agreements provide each executive with certain benefits listed in the table below if the executive’s employment is involuntarily terminated without “cause” or due to a voluntary resignation for “good reason” within two years following a change of control or in certain situations prior to a change of control, known as a “double trigger.”
Each agreement includes covenants regarding confidentiality, non-competition, non-solicitation of employees, customers, vendors and suppliers, non-disparagement of the Company, return of Company property and mandatory arbitration.
A “change of control” generally includes the occurrence of any of the following events or circumstances:
• | the acquisition of 50% or more of the outstanding shares of Supervalu or the combined voting power of the outstanding voting shares of Supervalu, other than any acquisition from or by Supervalu or any Supervalu-sponsored employee benefit plan; |
• | consummation of any merger or other business combination of Supervalu, sale or lease of all, or substantially all, of the assets of Supervalu or any combination of the foregoing, unless following such transaction Supervalu historic stockholders retain at least 60% ownership of the surviving entity and/or the purchaser or lessee; or |
33
• | a change in our Board’s composition within any 24-month period such that a majority of the Board’s members does not include those who were members at the date of the beginning of such employment period. |
“Cause” generally means:
• | the continued failure of the executive to substantially perform his or her duties after written demand and after the executive has had six months to improve performance to meet the Company’s expectations; |
• | the conviction of, or plea of guilty or nolo contendere to, a felony; |
• | the willful engaging in conduct that is materially and demonstrably injurious to Supervalu; |
• | an act or acts of personal dishonesty intended to result in substantial personal enrichment at the expense of the Company; or |
• | failure to comply with Company policies related to the Code of Business Conduct, Equal Employment Opportunities and Harassment or Workplace Violence. |
“Good reason” generally means:
• | the executive’s annual base salary is reduced below the amount in effect on the date immediately prior to the change of control date; |
• | the executive’s actual annual bonus is less than the target bonus as it existed on the date immediately prior to the change of control date; |
• | the executive’s title is reduced from the title held on the date immediately prior to the change of control date; |
• | the executive’s duties and responsibilities are materially and adversely diminished other than a general reduction of the number or scope of personnel supervised as part of the Company’s restructuring or recapitalization; |
• | the program of long-term incentive compensation is materially and adversely diminished, which for these purposes means a reduction of 15% or more of the annualized target dollar amount of long-term incentive as it existed on the date immediately prior to the change of control date; or |
• | the relocation of the place of employment by more than 45 miles, the failure to provide for the assumption of the agreement by any successor entity or a material breach by the Company of the agreement. |
The definitions of change of control and good reason as described above are more restrictive than the definitions in effect prior to the adoption of the new form of change of control agreement in November 2013. The form of change of control agreement, as amended in fiscal 2014, is summarized below:
Agreement Provision | Description | |
Severance Benefits | • | 2 times for our CEO and other NEOs, of annual base salary and target annual incentive, plus welfare benefits continuation. |
• | Earned but unpaid salary and accrued vacation, and annual bonus plan and long-term incentive plan amounts due, but not yet paid. | |
• | Pro rata annual incentive based on actual performance results for the year of termination. | |
• | Reimbursement for COBRA coverage for medical, dental and life insurance. | |
• | Outplacement services not to exceed $25,000, paid to an outplacement provider and not to the executive. | |
• | “Best net” reduction of compensation to avoid excise tax. | |
• | Requires execution of a release of claims acceptable to the Company. | |
Covenants | • | Non-disclosure of confidential information; non-solicitation of employees; non-solicitation of existing or prospective customers, vendors and suppliers; non-competition; return of property; and non-disparagement covenants. |
34
Accelerated Vesting Provision in CEO Inducement Awards
The long-term incentive awards granted to Mr. Gross for fiscal year 2017 and the stock option awards granted to Mr. Gross for fiscal 2018 provide that if Mr. Gross is terminated without cause or he resigns for good reason, the unvested stock options will vest as to a prorated portion of the options scheduled to vest on the next anniversary of his start date, and his fiscal 2017 performance share units will vest as to a portion of the award based on the actual attainment of performance goals over the entire three-year performance period and prorated for the portion of that period during which he was employed.
Supervalu Equity and Retirement Compensation Plans upon Change of Control
Several of our compensation and benefit plans contain provisions for enhanced benefits upon a change of control of Supervalu. These enhanced benefits include immediate vesting of stock options, performance share units, restricted stock and restricted stock unit awards upon a change of control, or in the case of such equity awards granted after May 2010, if employment terminates under specified circumstances within two years of a change of control.
See the Potential Payments Table below for payments that each NEO would be entitled to receive in the event of a termination of his or her employment by Supervalu without cause or by the NEO for good reason, following or in anticipation of a change of control of Supervalu.
Potential Payments and Benefits upon Retirement, Disability or Death
There are no special benefits provided to an NEO in the event of a qualified retirement, long-term disability or death with the exception of certain equity agreements. Certain of our option agreements provide for a longer exercise period for retirement-eligible employees who are age 60 or older and have at least 15 years of service. This benefit allows for the exercise period to be the earlier of five years or the expiration date from termination. No NEO currently meets the age and service requirements. Accelerated vesting of equity awards would occur for all NEOs upon death or disability.
See the Potential Payments Table below for payments that each NEO would be entitled to receive in the event of his or her qualified retirement, long-term disability or death.
POTENTIAL PAYMENTS TABLE
The table below sets forth the amounts each NEO would be entitled to receive, other than accrued but unpaid base salary and any benefits payable or provided under broad-based employee benefit plans and programs, including accrued vacation and paid time off, in the event of: qualified retirement; long-term disability; death; a termination of employment by Supervalu without cause; and a termination of employment by Supervalu without cause or by the NEO for good reason following or in anticipation of a change of control of Supervalu. The amounts shown assume that the retirement, disability, death, termination without cause or termination following or in anticipation of a change of control described in the preceding sentence was effective as of February 23, 2018, the last trading day of our 2018 fiscal year. In addition, each NEO is entitled to receive a prorated bonus for the year of termination based on actual performance results; however, since our NEOs became entitled to these bonus payments on the last day of the fiscal year, no amount of such benefit is accelerated or enhanced by virtue of a termination of employment on that date. Mr. Besanko is omitted from the table below because he voluntarily resigned his employment effective July 5, 2017 and he was not entitled to any additional or accelerated benefits regarding his resignation.
Type of Payment | Retirement ($) | Disability ($) | Death ($) | Termination Without Cause ($)(1) | Certain Terminations following Change of Control ($) |
Mark Gross | |||||
Base salary (by plan multiple)(2) | — | — | — | 2,300,000 | 2,300,000 |
Bonus (by plan multiple)(3) | — | — | — | 1,996,842 | 2,990,000 |
Unvested stock options(4)(5) | — | — | — | — | — |
Unvested restricted stock(4) | — | 376,298 | 376,298 | — | 376,298 |
Unvested performance share units(6) | — | 921,420 | 921,420 | 688,587 | 1,748,859 |
Health and welfare benefits | — | — | — | 20,888 | 20,888 |
Outplacement services | — | — | — | 25,000 | 25,000 |
Total | — | 1,297,718 | 1,297,718 | 5,031,317 | 7,461,045 |
35
Type of Payment | Retirement ($) | Disability ($) | Death ($) | Termination Without Cause ($)(1) | Certain Terminations following Change of Control ($) |
Rob N. Woseth | |||||
Base salary (by plan multiple)(2) | — | — | — | 750,000 | 1,000,000 |
Bonus (by plan multiple)(3) | — | — | — | 358,112 | 750,000 |
Unvested stock options(4) | — | — | — | — | — |
Unvested restricted stock(4) | — | 212,925 | 212,925 | — | 212,925 |
Unvested performance share units(6) | — | 147,707 | 147,707 | — | 330,207 |
Health and welfare benefits | — | — | — | 13,137 | 13,137 |
Outplacement services | — | — | — | 25,000 | 25,000 |
Total | — | 360,632 | 360,632 | 1,146,249 | 2,331,269 |
James W. Weidenheimer | |||||
Base salary (by plan multiple)(2) | — | — | — | 862,500 | 1,150,000 |
Bonus (by plan multiple)(3) | — | — | — | 432,009 | 862,500 |
Unvested stock options(4) | — | — | — | — | — |
Unvested restricted stock(4) | — | 253,373 | 253,373 | — | 253,373 |
Unvested performance share units(6) | — | 140,430 | 140,430 | — | 316,833 |
Health and welfare benefits | — | — | — | 18,539 | 18,539 |
Outplacement services | — | — | — | 25,000 | 25,000 |
Total | — | 393,803 | 393,803 | 1,338,048 | 2,626,245 |
Michael C. Stigers | |||||
Base salary (by plan multiple)(2) | — | — | — | 787,500 | 1,050,000 |
Bonus (by plan multiple)(3) | — | — | — | 416,538 | 787,500 |
Unvested stock options(4) | — | — | — | — | — |
Unvested restricted stock(4) | — | 244,614 | 244,614 | — | 244,614 |
Unvested performance share units(6) | — | 140,430 | 140,430 | — | 316,833 |
Health and welfare benefits | — | — | — | 13,316 | 13,316 |
Outplacement services | — | — | — | 25,000 | 25,000 |
Total | — | 385,044 | 385,044 | 1,242,354 | 2,437,263 |
Randy G. Burdick | |||||
Base salary (by plan multiple)(2) | — | — | — | 825,000 | 1,100,000 |
Bonus (by plan multiple)(3) | — | — | — | 393,923 | 825,000 |
Unvested stock options(4) | — | — | — | — | — |
Unvested restricted stock(4) | — | 176,444 | 176,444 | — | 176,444 |
Unvested performance share units(6) | — | 115,593 | 115,593 | — | 263,328 |
Health and welfare benefits | — | — | — | 15,246 | 15,246 |
Outplacement services | — | — | — | 25,000 | 25,000 |
Total | — | 292,037 | 292,037 | 1,259,169 | 2,405,018 |
(1) | These amounts exclude reimbursements for COBRA. |
(2) | Base salary multiple for “Termination Without Cause” is 2x for the CEO, 1.5x for EVPs and 1x for SVPs. Base salary multiple for “Change of Control” is 2x for the CEO and other NEOs. |
(3) | Bonus multiple for “Termination Without Cause” is 2x for the CEO, 1.5x for EVPs and 1x for SVPs. Bonus multiple for “Change of Control” is 2x for the CEO and other NEOs. |
(4) | The values presented for unvested stock options and unvested restricted stock and restricted stock units are calculated by multiplying the number of unvested shares by the closing stock price on the NYSE on February 23, 2018 ($13.73), the last trading day of our 2018 fiscal year, net of the exercise price in the case of stock options. Unvested shares are accelerated for “Disability,” “Death” and “Change of Control.” |
(5) | Mr. Gross’s employment agreement provides for a prorated payout for his February 2016 and April 2017 stock option grants in the event of a “Termination Without Cause.” These payouts currently have no value as the exercise prices of $29.75 and $29.19, respectively, are higher than our $13.73 closing stock price on the NYSE on February 23, 2018. |
36
(6) | The values presented for unvested performance share units are calculated by multiplying the number of PSUs by the closing stock price on the NYSE on February 23, 2018 ($13.73), the last trading day of our 2018 fiscal year. No NEOs are retirement eligible so any unvested PSUs are forfeited in the event of an NEO’s retirement. The value of unvested PSUs in the event of “Disability” or “Death” represents two-thirds (2/3) of the outstanding fiscal 2017 PSUs based on completion of two years of the 3-year performance period and one-third (1/3) of the outstanding fiscal 2018 PSUs based on completion of one year of the 3-year performance period, at target shares. The value of unvested PSUs in the event of a “Change of Control” represents the target number of PSUs accelerated in full upon the Change of Control, which assumes a “double-trigger” has occurred as detailed above. |
For fiscal 2017 PSUs, per the terms of Mr. Gross’s employment agreement, in the event of a termination without cause (or his resignation for good reason) the PSU will payout pro-rata at actual. The value of these fiscal 2017 unvested PSUs represents two-thirds (2/3) of the outstanding PSUs based on completion of two years of the 3-year performance period, and assumes performance at target.
CEO Pay Ratio
We are now required under the Dodd-Frank Act to disclose our estimated CEO to median employee pay ratio.
Our CEO to median employee pay ratio and annual total compensation amount disclosed in this section are reasonable estimates that have been calculated using methodologies and assumptions permitted by SEC rules. We identified our median employee by using total cash compensation as our consistently applied compensation measure for all employees, excluding our CEO, who were employed by the Company as of December 31, 2017. All employees of the Company as of this measurement date are included in our calculation, whether full-time, part-time, temporary, seasonal, or on a leave of absence. Employees from Unified and AG Florida who joined the Company through acquisitions during the second half of the year are included in our calculation. Based on this analysis, our median employee was identified as a bookkeeper with total compensation of $35,086 during our 2018 fiscal year.
After identifying our median employee, we calculated annual total compensation for such employee for fiscal 2018 using the same methodology we use for our NEOs as set forth in our Summary Compensation Table above under “Executive Compensation — Summary Compensation Table.” As illustrated in the table below, our CEO to median employee pay ratio is approximately 170:1 calculated as follows:
Name and/or Position | Salary ($) | Stock Awards ($) | Option Awards ($) | Non-Equity Incentive Compensation ($) | All Other Compensation ($) | Total ($) |
Mark Gross (CEO) | 1,126,923 | 2,635,986 | 499,848 | 1,676,854 | 26,557 | 5,966,168 |
Median Employee | 35,086 | — | — | — | — | 35,086 |
CEO Pay to Median Employee Pay Ratio ($5,966,168 / $35,086) = 170:1
37
DIRECTOR COMPENSATION
Annual compensation for non-employee directors is comprised of the following components: cash compensation, consisting of an annual retainer and committee retainer, and equity compensation, consisting of an annual deferred retainer payable in Supervalu common stock. In addition, our non-employee directors may receive stock options from time to time. Each of these components is described in more detail below.
The Corporate Governance and Nominating Committee reviews the compensation of our directors on a periodic basis. Based upon its review, the Corporate Governance and Nominating Committee makes recommendations to the Board of Directors. In fiscal 2018, the Corporate Governance and Nominating Committee, in consultation with Exequity, the Committee’s former independent compensation consultant, reviewed the Company’s director compensation relative to the Company’s peer group. Based on this review, the Corporate Governance and Nominating Committee recommended, and the Board of Directors approved, making no changes to director compensation other than to reduce the Non-Executive Chair retainer from $150,000 to $125,000, all of which retainer Mr. Chappel deferred under the SUPERVALU INC. Directors’ Deferred Compensation Plan (2009 Restatement) (the “Directors’ Deferred Compensation Plan”) described below.
Annual Board/Committee and Chairperson Retainers
Non-employee directors receive an annual cash retainer of $85,000 per year. In addition, the Chair of each Board committee receives the following annual retainer: Audit Committee Chair and Leadership Development and Compensation Committee Chair, $25,000; and Corporate Governance and Nominating Committee Chair, $20,000. Also, each non-employee director committee member receives the following annual retainer for each committee served on: Audit Committee, $15,000; Leadership Development and Compensation Committee, $15,000; and Corporate Governance and Nominating Committee, $10,000. Mr. Chappel receives an annual cash retainer of $125,000 per year for his role as Non-Executive Chair, in addition to his compensation as a non-employee director. The $85,000 cash retainer is prorated for directors who are appointed to the Board between annual meeting dates based on their appointment date.
Annual Deferred Stock Retainer
We also compensate each non-employee director by providing him or her with $115,000 in Supervalu common stock as soon as administratively practicable after each annual meeting of stockholders and upon the completion of any then-existing black-out period. The trustee of the Directors’ Deferred Compensation Plan described below, purchases shares of Supervalu common stock that are then allocated to the director in an account under the trust. Alternatively, we may from time to time deliver newly issued shares of Supervalu common stock to the trustee rather than the trustee purchasing shares on the open market. The number of shares allocated to each director is based upon the price of the Company’s common stock on the date the shares are credited. The annual deferred stock retainer is prorated for directors who are appointed to the Board between annual meeting dates.
The following table summarizes the components of annual compensation for directors:
Cash retainer | $85,000 | ||
Lead Director retainer, if any | $25,000 | ||
Non-Executive Chair retainer | $125,000 | ||
Corporate Governance and Nominating Committee retainer | $10,000 | ||
Audit Committee and Leadership Development and Compensation Committee retainer | $15,000 per committee | ||
Corporate Governance and Nominating Committee Chair retainer | $20,000 | ||
Audit Committee Chair and Leadership Development and Compensation Committee Chair retainer | $25,000 per committee | ||
Deferred Stock retainer | $115,000 | ||
38
Deferred Compensation Program
Directors may elect to defer payment of their cash retainers under the Directors’ Deferred Compensation Plan. Under the Directors’ Deferred Compensation Plan, a non-employee director may elect to have payment of all or a portion of the cash retainers deferred and credited to a deferred stock account or into a deferred cash account. If a director chooses to defer cash retainers into a deferred stock account, Supervalu then credits the director’s account with an additional amount equal to 10% of the amount of cash retainers the director has elected to defer and contributes the total amount in the director’s account to a grantor (“rabbi”) trust that uses the amount to purchase shares of Supervalu common stock, which are then allocated to an account for the director under the trust. Alternatively, we may from time to time deliver newly issued shares of Supervalu common stock to the trustee rather than the trustee purchasing shares on the open market. Each director is entitled to direct the trustee to vote all shares allocated to the director’s account in the trust. The common stock in each director’s deferred stock account will be distributed to the director after the director leaves the Board, in accordance with the director’s payment election. Until that time, the trust assets remain subject to the claims of our creditors. Dividends paid on the shares of common stock held in each of the directors’ accounts are used to purchase additional shares for these accounts each quarter. If a director chooses to defer all or a portion of cash retainers into a deferred cash account, interest is payable on the amount of deferred cash compensation at an annual rate equal to the twelve-month rolling average of Moody’s Corporate Average Bond Index for the twelve-month period ending in the month of October preceding the first day of the calendar year. Payment in cash is made from the cash account after the director leaves the Board, in accordance with the director’s payment election. Non-employee directors who are former employees of Supervalu are not eligible to participate in the Directors’ Deferred Compensation Plan.
Reimbursements and Expenses
Non-employee directors are reimbursed for expenses (including costs of travel, food and lodging) incurred in attending Board, committee and stockholder meetings. While travel to such meetings may include the use of the Company aircraft, if available or appropriate under the circumstances, the directors generally use commercial air service. In fiscal 2018, no non-employee director traveled on the Company aircraft. Directors are also reimbursed for participation in director education programs in the amount up to $7,500 for each director, plus expenses, to be used every two years.
From time to time, spouses may join non-employee directors on the Company aircraft when a non-employee director is traveling to or from a Board, committee or stockholder meeting or any other meeting of the Company where such non-employee director is invited to do so by the CEO. This travel may result in the non-employee director recognizing income for tax purposes. The Company does not reimburse the non-employee director for the taxes incurred in connection with such income. In fiscal 2018, no non-employee director or his or her spouse traveled on the Company aircraft.
Non-employee directors are eligible to use the Company aircraft for personal purposes to the extent that the Company aircraft is already traveling on Company business or at the direction of the CEO and there is available space for such non-employee director. Any such personal use of the Company aircraft may result in the non-employee director recognizing income for tax purposes, and the Company does not reimburse the non-employee directors for any taxes incurred in connection with such personal use. In fiscal 2018, no non-employee director traveled on the Company aircraft.
39
The table below sets forth the compensation paid to non-employee directors who served during fiscal 2018 for their service during that year:
DIRECTOR COMPENSATION FOR FISCAL 2018
Name | Fees Earned or Paid In Cash($)(1) | Stock Awards($)(2) | Total ($) |
Donald R. Chappel | 220,000 | 137,000 | 357,000 |
Irwin S. Cohen | 125,000 | 115,000 | 240,000 |
Philip L. Francis | 125,000 | 115,000 | 240,000 |
Eric G. Johnson | 115,000 | 126,500 | 241,500 |
Mathew M. Pendo | 95,000 | 115,000 | 210,000 |
Francesca Ruiz de Luzuriaga | 100,000 | 115,000 | 215,000 |
Wayne C. Sales(3) | — | — | — |
Frank A. Savage | 100,000 | 125,000 | 225,000 |
Gerald L. Storch(3) | — | — | — |
Mary A. Winston | 115,000 | 115,000 | 230,000 |
(1) | Reflects the amount of cash compensation earned in fiscal 2018 for Board and committee service. Amounts shown include any amounts deferred by the director under the Directors’ Deferred Compensation Plan described above. |
(2) | Includes (a) the annual deferred stock retainer for each director as described above and (b) any additional shares of common stock awarded to a director as a result of the director’s deferral of fees earned under the Directors’ Deferred Compensation Plan described above. The grant date fair value of stock awards are calculated in accordance with Financial Accounting Standards Board Accounting Standards Codification Topic 718. Refer to Note 1 — Summary of Significant Accounting Policies and Note 14 — Stock‑Based Awards within Part II, Item 8 of our Annual Report on Form 10‑K for the fiscal year ended February 24, 2018 for our policy and assumptions made in determining the grant date fair value of stock‑based awards. The amounts shown above also reflect the full grant date fair value of stock awards made during fiscal 2018. As of February 24, 2018, the last day of our fiscal year, each of our non-employee directors had shares credited to their account under the Directors’ Deferred Compensation Plan Trust as follows: Mr. Chappel, 54,020 shares; Mr. Cohen, 36,640 shares; Mr. Francis, 29,578 shares; Mr. Johnson, 27,033 shares; Mr. Pendo, 12,061 shares; Ms. Ruiz de Luzuriaga, 9,833 shares; Mr. Savage, 23,226 shares; and Ms. Winston, 8,642 shares. |
(3) | Mr. Sales resigned from the Board on May 23, 2017. Mr. Storch did not stand for re-election as a director when his term ended at the 2017 Annual Meeting of Stockholders on July 19, 2017. The compensation for each of Messrs. Sales’ and Storch’s service was paid to them in fiscal 2017 in accordance with our historical compensation payment schedule. |
Compensation Committee Interlocks and Insider Participation
The following directors served on the Leadership Development and Compensation Committee in fiscal 2018: Donald R. Chappel (member and Chair until July 19, 2017), Philip L. Francis (member for all of fiscal 2018; Chair since July 19, 2017), Mathew M. Pendo (member until July 19, 2017), Frank A. Savage (member since July 19, 2017) and Mary A. Winston. None of these individuals has ever served as an officer or employee of the Company or any of the Company’s subsidiaries or has any relationships with the Company or any of its subsidiaries requiring disclosure under “Policy and Procedures Regarding Transactions with Related Persons.”
Compensation Risk Assessment
The Company has historically maintained a prudent and appropriately risk-balanced approach to its incentive compensation programs to ensure that such programs promote the long-term interests of our stockholders and do not contribute to unnecessary risk taking, and will continue to do so. The Company, through its Leadership Development and Compensation Committee, regularly engages in a process to evaluate whether its executive and broad-based compensation programs contribute to unnecessary risk-taking and has concluded that the risks arising from these programs are not reasonably likely to have a material adverse effect on the Company. The Leadership Development and Compensation Committee directly engages its compensation consultant to assist in its evaluation. In accordance with the Leadership Development and Compensation Committee’s direction, Exequity performed a compensation risk assessment of the Company’s executive and broad-based compensation programs for fiscal 2018 and made an independent report to the Leadership Development and Compensation Committee. The risk assessment completed by Exequity for fiscal 2018 concluded, and management agreed, that the Company’s executive and broad-based compensation programs for fiscal 2018 do not create risks that are reasonably likely to have a material adverse effect on the Company, noting that no compensation program was identified that would encourage excessive risk taking.
40
ITEM 12. SECURITY OWNERSHIP OF CERTAIN BENEFICIAL OWNERS AND MANAGEMENT AND RELATED STOCKHOLDER MATTERS
Security Ownership of Certain Beneficial Owners
The following table sets forth information with respect to the only persons or groups known to us as of June 7, 2018, to be the beneficial owners of more than five percent of Supervalu common stock. The figures in the “Percent of Class” column are based on 38,618,556 shares of common stock issued and outstanding on June 7, 2018.
Special Note on Blackwells: Based on an analysis of the itemized information presented in the Schedule 13D and the preliminary proxy statement filed by Blackwells Capital LLC (“Blackwells”) on May 29, 2018, Mr. Aintabi and Blackwells together own 1,126,700 call options with a weighted average strike price of $22.25, but are short 1,092,600 call options with a weighted average strike price of $22.62. If all of these options were settled as of June 1, 2018, Blackwells and Mr. Aintabi would acquire a net 34,100 shares for a net aggregate exercise price of $357,100. Blackwells and Mr. Aintabi own 1,674,105 shares of Supervalu common stock outright. Blackwells and Mr. Aintabi also own 1,156,800 put options, offset by a short position of 48,500 puts. These put options are nearly all in-the-money as of the date of this Amendment.
Name and Address of Beneficial Owner | Amount and Nature of Beneficial Ownership | Percent of Class | |
(1) | BlackRock, Inc., 55 East 52nd Street, New York, NY 10055 | 4,873,089 | 12.6% |
(2) | The Vanguard Group, 100 Vanguard Blvd., Malvern, PA 19355 | 3,926,387 | 10.2% |
(3) | Jason Aintabi and Blackwells Capital LLC, 600 Madison Avenue, 18th Floor, New York, NY 10022 | 2,800,805** | 7.3% |
(4) | Towle & Co., 1610 Des Peres Road, Suite 250, St. Louis, MO 63131 | 2,579,143 | 6.7% |
(5) | Dimensional Fund Advisors LP, 6300 Bee Cave Rd., Austin, TX 78746 | 2,043,760 | 5.3% |
(6) | Louis A. Amen, 7200 Dominion Circle, Commerce, CA 90040 | 2,030,661 | 5.3% |
(1) | Share ownership is as of December 31, 2017, as set forth in a Schedule 13G/A (Amendment No. 6) filed with the SEC on January 19, 2018. According to that filing, BlackRock, Inc., a parent holding company, is deemed to beneficially own 4,873,089 shares of Supervalu common stock, with sole dispositive power as to all of such shares and sole voting power as to 4,775,631 shares. |
(2) | Share ownership is as of December 31, 2017, as set forth in a Schedule 13G/A (Amendment No. 4) filed with the SEC on February 9, 2018. According to that filing, The Vanguard Group (“Vanguard”) is deemed to beneficially own 3,926,387 shares of Supervalu common stock. Vanguard reported sole voting power with respect to 42,336 shares, shared voting power with respect to 4,105 shares, sole dispositive power with respect to 3,882,847 shares and shared dispositive power with respect to 43,540 shares. The filing reports that Vanguard Fiduciary Trust Company, a wholly owned subsidiary of The Vanguard Group, Inc., has beneficial ownership of 39,435 shares as a result of its serving as investment manager of collective trust accounts, and that Vanguard Investments Australia, Ltd., a wholly owned subsidiary of The Vanguard Group, Inc., has beneficial ownership of 7,006 shares as a result of its serving as investment manager of Australian investment offerings. |
(3) | Share ownership is as of May 29, 2018, as set forth in a Schedule 13D filed with the SEC on May 29, 2018. According to that filing, Mr. Aintabi, an affiliate of Blackwells, is deemed to beneficially own 2,800,805 shares of Supervalu common stock, which are comprised of (i) 96,605 shares directly beneficially owned by Mr. Aintabi, (ii) 460,400 shares underlying call options exercisable within 60 days of May 29, 2018, (iii) 1,577,500 shares directly beneficially owned by Blackwells and (iv) 666,300 shares underlying call options exercisable within 60 days of May 29, 2018. Mr. Aintabi reported sole voting power and dispositive power with respect to all such shares. Blackwells reported shared voting power and dispositive power with respect to 2,243,800 shares. |
**See “Special Note on Blackwells” above.
(4) | Share ownership is as of March 31, 2018, as set forth in a Schedule 13F filed with the SEC on May 8, 2018. According to that filing, Towle & Co. is deemed to beneficially own 2,579,143 shares of Supervalu common stock and has sole voting and dispositive power with respect to all of such shares. |
(5) | Share ownership is as of December 31, 2017, as set forth in a Schedule 13G filed with the SEC on February 9, 2018. According to that filing, Dimensional Fund Advisors LP is deemed to beneficially own 2,043,760 shares of Supervalu common stock, with sole dispositive power as to all of such shares and sole voting power as to 1,960,305 shares. |
(6) | Share ownership is as of January 31, 2018, as set forth in a Schedule 13G filed with the SEC on February 14, 2018. According to that filing, Louis A. Amen beneficially owns 2,030,661 shares of Supervalu common stock and has sole voting and dispositive power with respect to all of such shares. |
41
Security Ownership of Management
The following table sets forth information as of June 7, 2018 concerning beneficial ownership of Supervalu’s common stock by each of our directors and director nominees, for each of our current executive officers named in the Summary Compensation Table (the “Named Executive Officers” or “NEOs”) and for all of our directors and executive officers as a group. The figures in the “Percent of Class” column are based on 38,618,556 shares of common stock issued and outstanding on June 7, 2018.
The definition of beneficial ownership for annual report purposes includes shares over which a person has sole or shared voting power or dispositive power, whether or not a person has any economic interest in the shares. The definition also includes shares that a person has a right to acquire currently or within 60 days.
Name of Beneficial Owner | Amount and Nature of Beneficial Ownership (1)(2) | Percent of Class |
Donald R. Chappel | 55,449 | * |
Irwin S. Cohen | 36,640 | * |
Philip L. Francis | 30,435 (3) | * |
Eric G. Johnson | 27,033 | * |
Mathew M. Pendo | 12,061 | * |
Francesca Ruiz de Luzuriaga | 10,547 | * |
Frank A. Savage | 23,226 | * |
Mary A. Winston | 8,642 | * |
Mark Gross | 174,227 | * |
Rob N. Woseth | 84,156 | * |
James W. Weidenheimer | 13,069 | * |
Michael C. Stigers | 63,671 | * |
Randy G. Burdick | 83,072 | * |
Bruce H. Besanko | 32,791 | * |
All current directors and executive officers as a group (15 persons) | 637,363 | 1.6% |
* | Less than 1% |
(1) | All persons listed have sole voting and investment power with respect to all of the shares listed except the following non-employee directors who have sole voting power, but no investment power, over shares held in the Directors’ Deferred Compensation Plan, as follows: Mr. Chappel, 54,020 shares; Mr. Cohen, 36,640 shares; Mr. Francis, 29,578 shares; Mr. Johnson, 27,033 shares; Mr. Pendo, 12,061 shares; Ms. Luzuriaga, 9,833 shares; Mr. Savage, 23,226 shares; and Ms. Winston, 8,642 shares. |
(2) | Includes shares underlying options exercisable or exercisable within 60 days of June 7, 2018, as follows: Mr. Gross, 167,760 shares; Mr. Woseth, 73,783 shares; Mr. Weidenheimer, 5,603 shares; Mr. Stigers, 51,450 shares; Mr. Burdick, 72,221 shares; and all current directors and executive officers as a group, 391,994 shares. |
(3) | Includes 857 shares held in a trust for which Mr. Francis and his spouse serve as the trustees. |
42
The following table sets forth information as of February 24, 2018 about our common stock that may be issued under all of our equity compensation plans:
Equity Compensation Plan Information
(shares not in millions) Plan Category | Number of securities to be issued upon exercise of outstanding options, warrants and rights | Weighted average exercise price of outstanding options, warrants and rights | Number of securities remaining available for future issuance under equity compensation plans (excluding securities reflected in column (a)) | ||||||
(a) | (b) | (c) | |||||||
Equity compensation plans approved by security holders(1) | 1,709,961 | $ | 44.15 | 3,864,479(2) | |||||
Equity compensation plans not approved by security holders | — | $ | — | — | |||||
Total | 1,709,961 | $ | 44.15 | 3,864,479(2) | |||||
(1) | Includes Supervalu’s 2012 Stock Plan and Supervalu’s Directors’ Deferred Compensation Plan. |
(2) | Consists of 3,568,295 shares available for issuance under the 2012 Stock Plan and 296,184 shares available for issuance under the Directors’ Deferred Compensation Plan. The 2012 Stock Plan provides that any shares subject to awards under the 2007 Stock Plan as of May 23, 2016 that cease for any reason to be subject to such awards (other than by reason of exercise or settlement of such awards to the extent they are exercised for or settled in vested and non-forfeitable shares) are added to the 2012 Stock Plan reserve for issuance. The 3,568,295 shares available for issuance under the 2012 Stock Plan includes 366,114 shares that have been added from awards that had been outstanding under the 2007 Stock Plan as of May 23, 2016. |
ITEM 13. CERTAIN RELATIONSHIPS AND RELATED TRANSACTIONS, AND DIRECTOR INDEPENDENCE
Policy and Procedures Regarding Transactions with Related Persons
Policy and Procedures
The Board has adopted a “Policy and Procedures Regarding Transactions with Related Persons.” This policy delegates to the Audit Committee responsibility for reviewing, approving or ratifying transactions with “related persons” that are required to be disclosed under the rules of the SEC. Under the policy, a “related person” includes any of the directors or executive officers of the Company, certain stockholders and their immediate family members. The policy applies to transactions where the Company is a participant, a related person will have a direct or indirect material interest and the amount involved exceeds $120,000. Under the policy, management of the Company is responsible for disclosing to the Audit Committee all material information related to any covered transaction in order to give the Audit Committee an opportunity to authorize, approve or ratify the covered transaction based upon its determination that the covered transaction is fair and reasonable and on terms no less favorable to the Company than could be obtained in a comparable arm’s-length transaction with an unrelated third party. A copy of the Policy and Procedures Regarding Transactions with Related Persons is available on our website at www.supervalu.com. Click on the “Investors” link and then the caption “Corporate Governance.”
Transactions with Related Persons
Director Mr. Johnson, Baldwin Richardson
Mr. Johnson, a director of the Company, is the President and Chief Executive Officer of Baldwin Richardson. The equity in Baldwin Richardson is owned as follows: 68% by Mr. Johnson; 29% by an irrevocable trust (for which Mr. Johnson does not serve as trustee) for the benefit of his four adult children who live outside of his household; and 3% by unrelated parties. The Company purchased approximately $393,000 in retail products from Baldwin Richardson during fiscal 2018. The amount purchased during fiscal 2018 represented less than one percent of the consolidated gross revenues of Baldwin Richardson and the Company, respectively, for each company’s 2018 fiscal year. The relationship between the Company and Baldwin Richardson began several years before Mr. Johnson became a director, and these transactions were entered into in the ordinary course of business and at arm’s length. The Audit Committee ratified this ongoing relationship with Baldwin Richardson under our Policy and Procedures Regarding Transactions with Related Persons. The Board determined that this relationship would not interfere with Mr. Johnson’s exercise of independent judgment in carrying out the responsibilities of a director and that Mr. Johnson met the requirements for independence under the NYSE listing standards and the rules of the SEC.
43
Stockholder Louis A. Amen
Mr. Amen is the Executive Chairman of Super A Foods, which is a wholesale customer of the Company that purchases approximately $26 million in products per year from the Company. Super A Foods became a customer of the Company in June 2017 when the Company acquired Unified. Mr. Amen, through a family trust, became a greater than 5% stockholder of the Company in January 2018. Mr. Amen and his wife are owners of a majority of the equity interests in Super A Foods. Super A Foods has approximately $100 million in total annual revenues. Accordingly, the Company’s sales to Super A Foods represent approximately 25% of its total revenues. Mr. Amen is personally involved in managing the relationship between Super A Foods and the Company. Since Mr. Amen only became a related person in January 2018, and the Company’s relationship with Super A Foods predated this event, the terms of the current relationship between Super A Foods and the Company predated Mr. Amen’s status as a related person. The Audit Committee ratified this ongoing relationship with Super A Foods under our Policy and Procedures Regarding Transactions with Related Persons. Going forward, any new arrangements with Super A Foods will be reviewed by the Company’s Chief Financial Officer to ensure that the terms of the relationship reflect arm’s length terms, and therefore are fair and reasonable to the Company.
Director Independence
The Board believes that a majority of its members should be independent, non-employee directors. It is the Board’s policy that no more than one member of the Board will be an employee of Supervalu. This management member will typically be the CEO. Currently, Mr. Gross, the Company’s President and Chief Executive Officer, is the only employee member of the Board.
The Board has determined that each of the current non-employee members of the Board is an independent director under the NYSE listing standards and the rules of the SEC: Donald R. Chappel, Irwin S. Cohen, Philip L. Francis, Eric G. Johnson, Mathew M. Pendo, Francesca Ruiz de Luzuriaga, Frank A. Savage and Mary A. Winston. Mr. Gross is the only current employee director and director nominee, and he is not independent.
In determining the independence of the current non-employee directors, the Board considered the following transactions, relationships and arrangements:
• | Mr. Johnson. In determining the independence of Mr. Johnson, the Board considered the relationship between the Company and Baldwin Richardson. See “Policy and Procedures Regarding Transactions with Related Persons — Transactions with Related Persons — Director Mr. Johnson, Baldwin Richardson” above for additional detail regarding this relationship. The Board determined that this relationship would not interfere with Mr. Johnson’s exercise of independent judgment in carrying out the responsibilities of a director and that Mr. Johnson met the requirements for independence under the NYSE listing standards and the rules of the SEC. |
• | Ms. Luzuriaga. Ms. Luzuriaga’s brother-in-law is the Chief Accounting Officer at Chubb. Chubb is one of our insurance companies and we have paid approximately $445,000 in total insurance premiums to Chubb over the past three fiscal years. This aggregate amount represented less than one percent of the consolidated gross revenues of Chubb and the Company for each company’s last fiscal year. These transactions were entered into in the ordinary course of business and at arm’s length. Additionally, our relationship with Chubb predated Ms. Luzuriaga’s service on the Board, and Ms. Luzuriaga’s brother-in-law is in a role where he would not be directly involved with the relationship between Chubb and the Company. Accordingly, the Board determined that this relationship was not material to either company and, therefore, does not impair Ms. Luzuriaga’s independence. |
• | Mr. Savage. Mr. Savage’s son is an employee of Bank of America serving in a director role. We use Bank of America for cash management services, and Bank of America is a lender in our revolving credit facility and underwriter of long-term debt. For cash management services, we have paid Bank of America approximately $250,000 in total service fees during the last three fiscal years. In its role as a lender and underwriter on debt transactions, we have paid Bank of America approximately $40,000 during the last three fiscal years. The aggregate of these amounts represented less than one percent of the consolidated gross revenues of Bank of America and the Company for each company’s last fiscal year. These transactions were entered into in the ordinary course of business and at arm’s length, our relationships with Bank of America predated Mr. Savage’s service on the Board and Mr. Savage’s son is not directly involved with the relationships between Bank of America and the Company. Accordingly, the Board determined that these relationships were not material to either company and, therefore, do not impair Mr. Savage’s independence. |
Mr. Savage is a senior advisor to Lazard Ltd., which we retained in fiscal 2018 to provide advisory services to us. As a senior advisor, Mr. Savage is not a partner in, or a controlling shareholder or employee of, Lazard, but rather he provides advisory services to Lazard on a consulting basis. Mr. Savage has informed the Company that he receives a consulting fee from Lazard that is not tied to any particular engagement, has access to an office at Lazard and is eligible for a “referral fee” if he refers new business to Lazard. Mr. Savage has confirmed that he would not receive any referral fee, bonus or other incremental compensation from Lazard in connection with our engagement of Lazard. Furthermore, Mr. Savage recused himself from the decision to retain Lazard and was not personally involved in the
44
services Lazard provided to us. Accordingly, the Board determined that this relationship does not impair Mr. Savage’s independence.
ITEM 14. PRINCIPAL ACCOUNTING FEES AND SERVICES
The Audit Committee has a formal policy concerning the approval of audit and non-audit services to be provided by Supervalu’s independent registered public accounting firm. The policy requires that the Audit Committee pre-approve all audit services, engagement fees and terms and all engagements for permitted non-audit services, subject to the de minimis exceptions permitted pursuant to the Securities Exchange Act of 1934, as amended. The Chair of the Audit Committee is authorized to grant such pre-approvals in the event there is a need for such approvals prior to the next full Audit Committee meeting, provided all such pre-approvals are then reported to the full Audit Committee at its next scheduled meeting.
During fiscal 2018 and 2017, KPMG LLP, our independent registered public accounting firm (“KPMG”) provided various audit and audit-related services to Supervalu. The Audit Committee pre-approved all audit services, audit-related services and tax services provided by KPMG in fiscal 2018 and 2017. The following table presents fees for professional services charged by KPMG to Supervalu by type and amount for fiscal 2018 and 2017.
($ in thousands) | 2018 (3) | 2017 (4) | |||||
Audit fees | $ | 3,966 | $ | 3,060 | |||
Audit-related fees(1) | 463 | 1,340 | |||||
Total audit and audit-related fees | 4,429 | 4,400 | |||||
Tax fees(2) | 210 | — | |||||
Total fees | $ | 4,639 | $ | 4,400 | |||
(1) | Audit-related fees consist principally of fees for audits of financial statements of certain businesses and subsidiaries, and audits of financial statements of certain employee benefit plans. Audit-related fees for fiscal 2017 included audits of Save-A-Lot’s carve-out financial statements in anticipation of its divestiture. |
(2) | Tax fees consist of fees related to tax compliance, including review of tax returns. |
(3) | Fees for fiscal 2018 are estimates. |
(4) | Fees for fiscal 2017 reflect final amounts billed. |
45
PART IV
ITEM 15. EXHIBITS AND FINANCIAL STATEMENT SCHEDULES
SIGNATURES
Pursuant to the requirements of Section 13 or 15(d) of the Securities Exchange Act of 1934, SUPERVALU INC. has duly caused this Amendment No. 1 to Annual Report on Form 10-K/A to be signed on its behalf by the undersigned, thereunto duly authorized.
SUPERVALU INC. | |||
(Registrant) | |||
Dated: June 12, 2018 | By: | /S/ MARK GROSS | |
Mark Gross | |||
President and Chief Executive Officer | |||
46