Attached files
| file | filename |
|---|---|
| 8-K - 8-K - PetIQ, Inc. | f8-k.htm |
Exhibit 99.1
|
|
WILLIAM BLAIR & COMPANY ANNUAL GROWTH STOCK CONFERENCE 38th |
|
|
SAFE HARBOR STATEMENT AND NON-GAAP DISCLOSURES This presentation contains forward-looking statements within the meaning of the federal securities laws, which statements involve substantial risks and uncertainties. Forward-looking statements generally relate to future events and include, without limitation, projections, forecasts and estimates about possible or assumed future results of the Company’s business, financial condition, liquidity, results of operations, plans and objectives. In some cases, you can identify forward-looking statements because they contain words such as “may,” “might,” “will,” “would,” “should,” “expect,” “plan,” “anticipate,” “could,” “intend,” “target,” “project,” “contemplate,” “believe,” “estimate,” “predict,” “likely,” “potential” or “continue” or the negative of these words or other similar terms or expressions that concern our expectations, strategy, plans or intentions. These forward-looking statements are necessarily based upon estimates and assumptions that, while considered reasonable by the Company and its management, are inherently uncertain. Factors that may cause actual results to differ materially from current expectations include, but are not limited to, those factors identified in the Company’s prospectus in the sections titled “Risk factors,” “Special note regarding forward-looking statements” and “Management’s discussion and analysis of financial condition and results of operations.” New risks and uncertainties arise over time, and it is not possible for us to predict all such factors or how they may affect us. Nothing in this presentation should be regarded as a representation by any person that the forward-looking statements set forth herein will be achieved or that any of the contemplated results of such forward-looking statements will be achieved. You should not place undue reliance on forward-looking statements, which speak only as of the date they are made. The Company undertakes no duty to update these forward-looking statements. Certain of the economic and market information contained herein has been obtained from published sources and/or prepared by other parties. None of the Company or any of its directors, stockholders, officers, affiliates, employees, agents or advisers, nor any other person, assumes any responsibility for the accuracy, reliability or completeness of any information in this presentation, and we expressly disclaim any obligation or undertaking to release publicly any updates or revisions to any forward-looking statements to reflect any change in expectation or events, conditions or circumstances on which such statements are based. This presentation includes certain non-GAAP financial measures, including Adjusted EBITDA. These non-GAAP financial measures should be considered only as supplemental to, and not as superior to, financial measures prepared in accordance with GAAP. Please refer to the Appendix of this presentation for a reconciliation of Adjusted EBITDA to net income, the most directly comparable financial measure prepared in accordance with U.S. GAAP. This presentation is confidential and may not be reproduced or otherwise distributed or disseminated, in whole or part, without the prior written consent of the Company, which consent may be withheld in its sole and absolute discretion. Any investment in the Company will be subject to certain risks related to the nature of the Company’s business and the structure and operations of the Company. Any investment in the Company should be made only with an appreciation of the applicable risks, which are described in the Company’s filings with the SEC. |
|
|
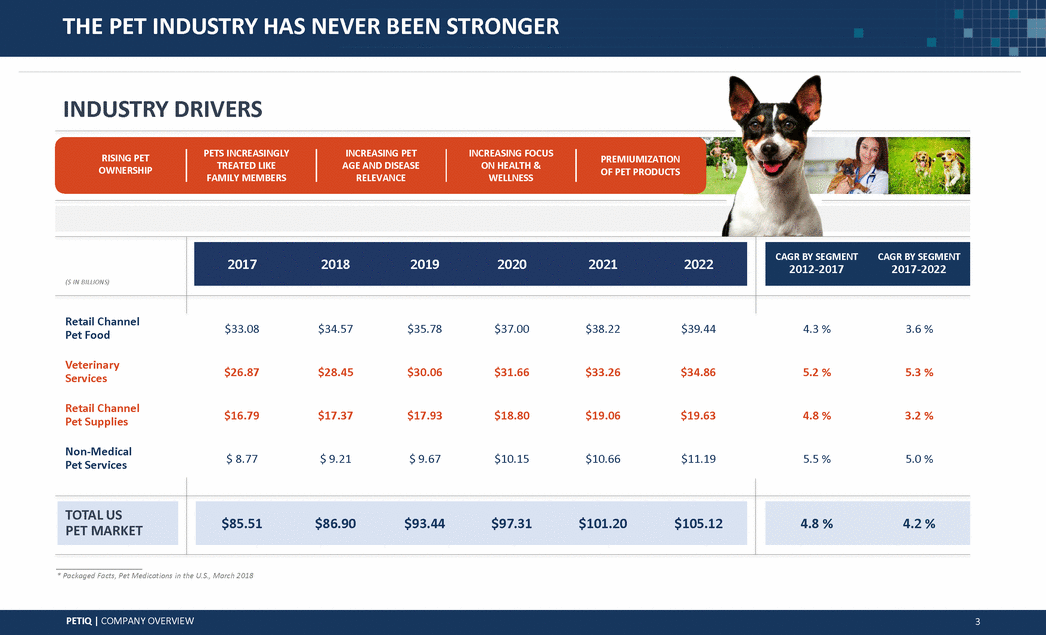
THE PET INDUSTRY HAS NEVER BEEN STRONGER INDUSTRY DRIVERS PETS INCREASINGLY TREATED LIKE FAMILY MEMBERS INCREASING PET AGE AND DISEASE RELEVANCE INCREASING FOCUS ON HEALTH & WELLNESS RISING PET OWNERSHIP PREMIUMIZATION OF PET PRODUCTS Retail Channel Pet Food $33.08 $34.57 $35.78 $37.00 $38.22 $39.44 4.3 % 3.6 % Veterinary Services $26.87 $28.45 $30.06 $31.66 $33.26 $34.86 5.2 % 5.3 % Retail Channel Pet Supplies $16.79 $17.37 $17.93 $18.80 $19.06 $19.63 4.8 % 3.2 % Non-Medical Pet Services $ 8.77 $ 9.21 $ 9.67 $10.15 $10.66 $11.19 5.5 % 5.0 % * Packaged Facts, Pet Medications in the U.S., March 2018 PETIQ | COMPANY OVERVIEW 3 PET MARKET TOTAL US 4.8 %4.2 % $85.51$86.90$93.44$97.31$101.20$105.12 ($ IN BILLIONS) 2012-20172017-2022 CAGR BY SEGMENTCAGR BY SEGMENT 201720182019202020212022 |
|
|
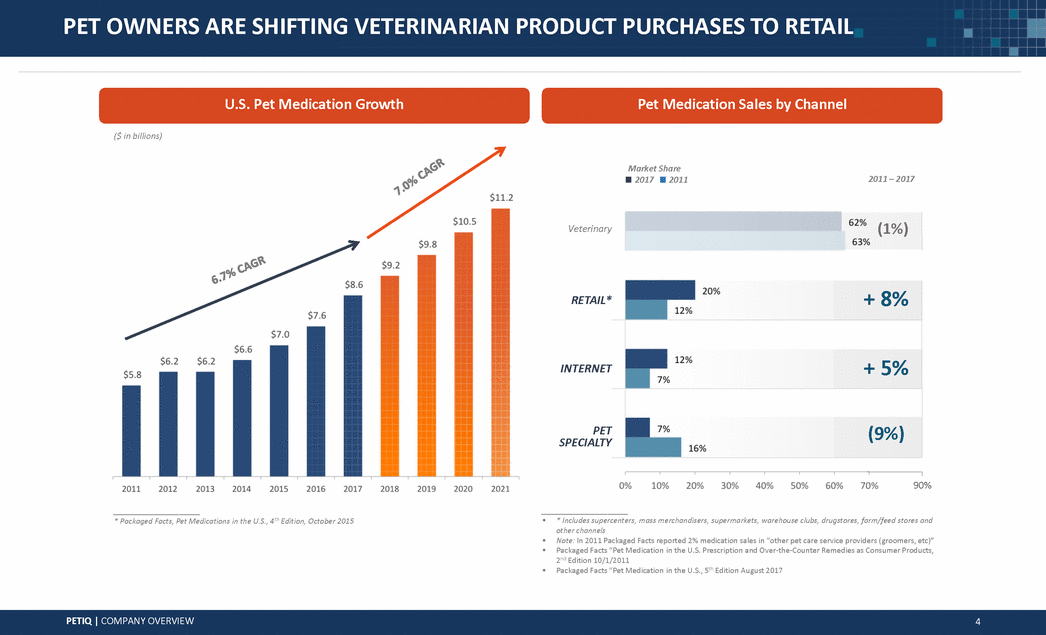
PET OWNERS ARE SHIFTING VETERINARIAN PRODUCT PURCHASES TO RETAIL U.S. Pet Medication Growth Pet Medication Sales by Channel ($ in billions) Market Share - 2017 - 2011 2011 – 2017 (1%) Veterinary RETAIL* INTERNET PET SPECIALTY 90% * Packaged Facts, Pet Medications in the U.S., 4th Edition, October 2015 • * Includes supercenters, mass merchandisers, supermarkets, warehouse clubs, drugstores, farm/feed stores and other channels Note: In 2011 Packaged Facts reported 2% medication sales in “other pet care service providers (groomers, etc)” Packaged Facts “Pet Medication in the U.S. Prescription and Over-the-Counter Remedies as Consumer Products, 2nd Edition 10/1/2011 Packaged Facts “Pet Medication in the U.S., 5th Edition August 2017 • • • PETIQ | COMPANY OVERVIEW 4 + 8% + 5% (9%) |
|
|
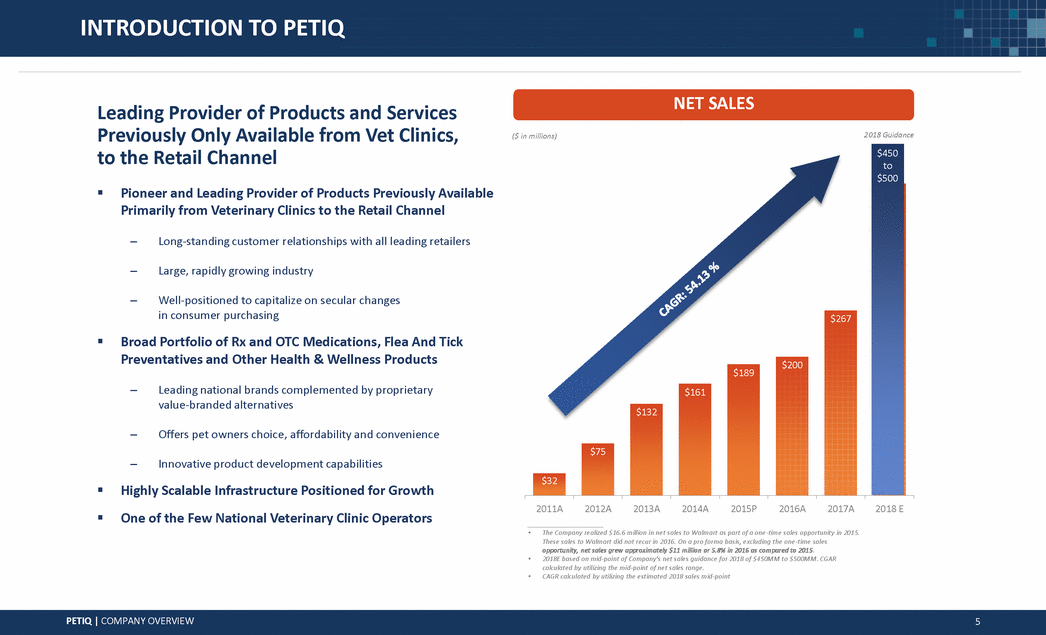
INTRODUCTION TO PETIQ NET SALES Leading Provider of Products and Services Previously Only Available from Vet Clinics, to the Retail Channel 2018 Guidance ($ in millions) $450 to $500 $450 Pioneer and Leading Provider of Products Previously Available Primarily from Veterinary Clinics to the Retail Channel – Long-standing customer relationships with all leading retailers – Large, rapidly growing industry – Well-positioned to capitalize on secular changes in consumer purchasing $267 Broad Portfolio of Rx and OTC Medications, Flea And Tick Preventatives and Other Health & Wellness Products $200 $189 – Leading national brands complemented by proprietary value-branded alternatives $161 $132 – Offers pet owners choice, affordability and convenience $75 – Innovative product development capabilities $32 Highly Scalable Infrastructure Positioned for Growth One of the Few National Veterinary Clinic Operators 2011A 2012A 2013A 2014A 2015P 2016A 2017A 2018 E • The Company realized $16.6 million in net sales to Walmart as part of a one -time sales opportunity in 2015. These sales to Walmart did not recur in 2016. On a pro forma basis, excluding the one -time sales opportunity, net sales grew approximately $11 million or 5.8% in 2016 as compared to 2015. 2018E based on mid-point of Company’s net sales guidance for 2018 of $450MM to $500MM. CGAR calculated by utilizing the mid-point of net sales range. CAGR calculated by utilizing the estimated 2018 sales mid-point • • PETIQ | COMPANY OVERVIEW 5 |
|
|
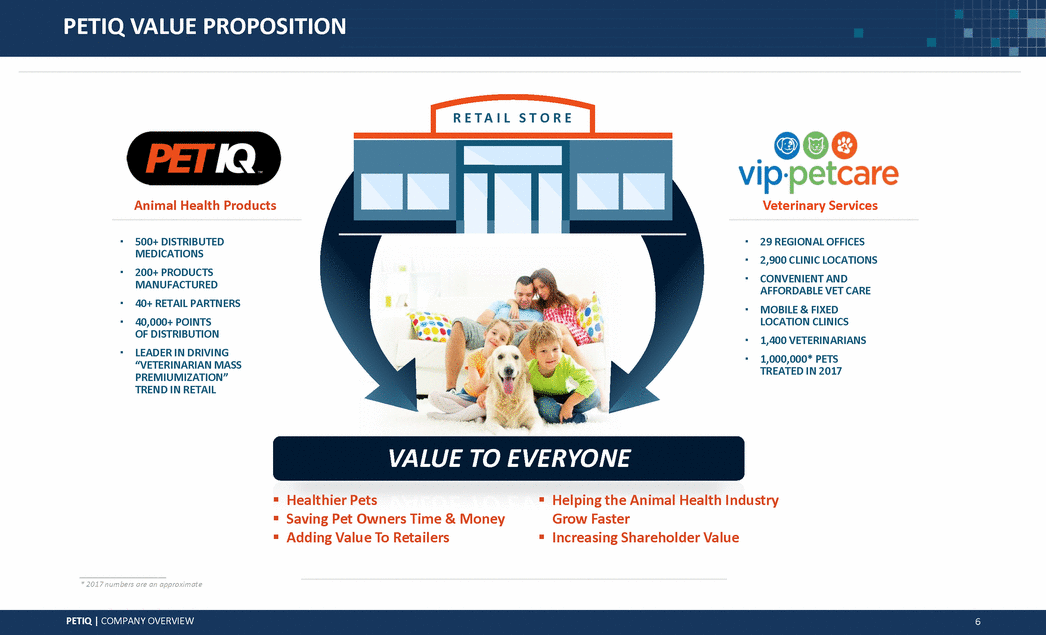
PETIQ VALUE PROPOSITION R E T A I L S T O R E Animal Health Products Veterinary Services ▪ ▪ ▪ ▪ 500+ DISTRIBUTED MEDICATIONS 200+ PRODUCTS MANUFACTURED 40+ RETAIL PARTNERS 40,000+ POINTS OF DISTRIBUTION LEADER IN DRIVING “VETERINARIAN MASS PREMIUMIZATION” TREND IN RETAIL 29 REGIONAL OFFICES 2,900 CLINIC LOCATIONS CONVENIENT AND AFFORDABLE VET CARE MOBILE & FIXED LOCATION CLINICS 1,400 VETERINARIANS 1,000,000* PETS TREATED IN 2017 ▪ ▪ ▪ ▪ ▪ ▪ ▪ VALUE TO EVERYONE Healthier Pets Saving Pet Owners Time & Money Adding Value To Retailers Helping the Animal Health Industry Grow Faster Increasing Shareholder Value * 2017 numbers are an approximate PETIQ | COMPANY OVERVIEW 6 |
|
|
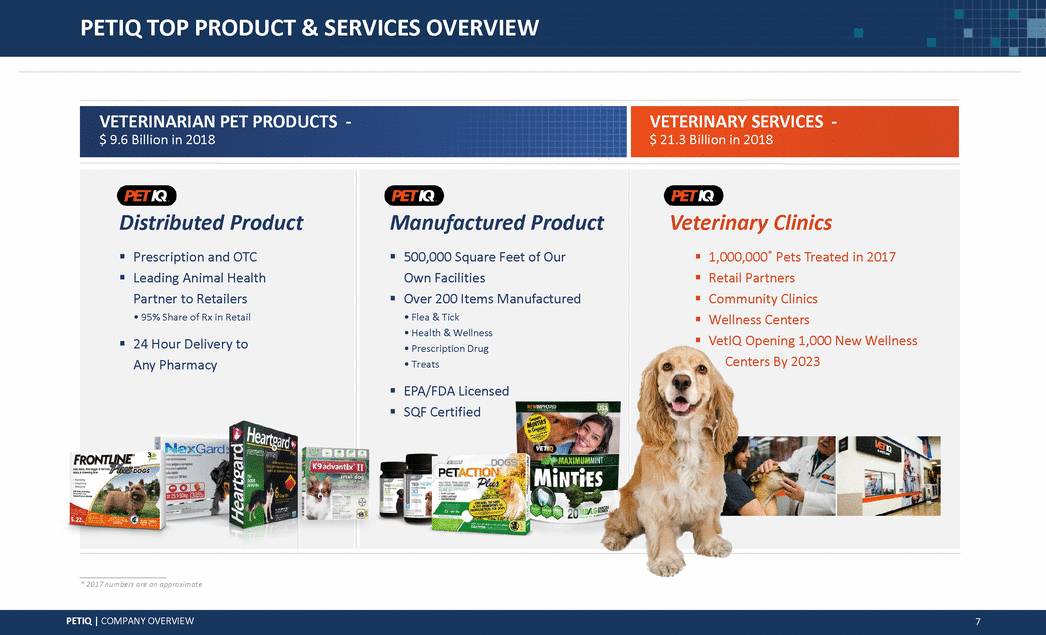
PETIQ TOP PRODUCT & SERVICES OVERVIEW VETERINARIAN PET PRODUCTS $ 9.6 Billion in 2018 - VETERINARY SERVICES $ 21.3 Billion in 2018 - Centers By 2023 * 2017 numbers are an approximate PETIQ | COMPANY OVERVIEW 7 Veterinary Clinics 1,000,000* Pets Treated in 2017 Retail Partners Community Clinics Wellness Centers VetIQ Opening 1,000 New Wellness Distributed Product Prescription and OTC Leading Animal Health Partner to Retailers • 95% Share of Rx in Retail 24 Hour Delivery to Any Pharmacy Manufactured Product 500,000 Square Feet of Our Own Facilities Over 200 Items Manufactured • Flea & Tick • Health & Wellness • Prescription Drug • Treats EPA/FDA Licensed SQF Certified |
|
|
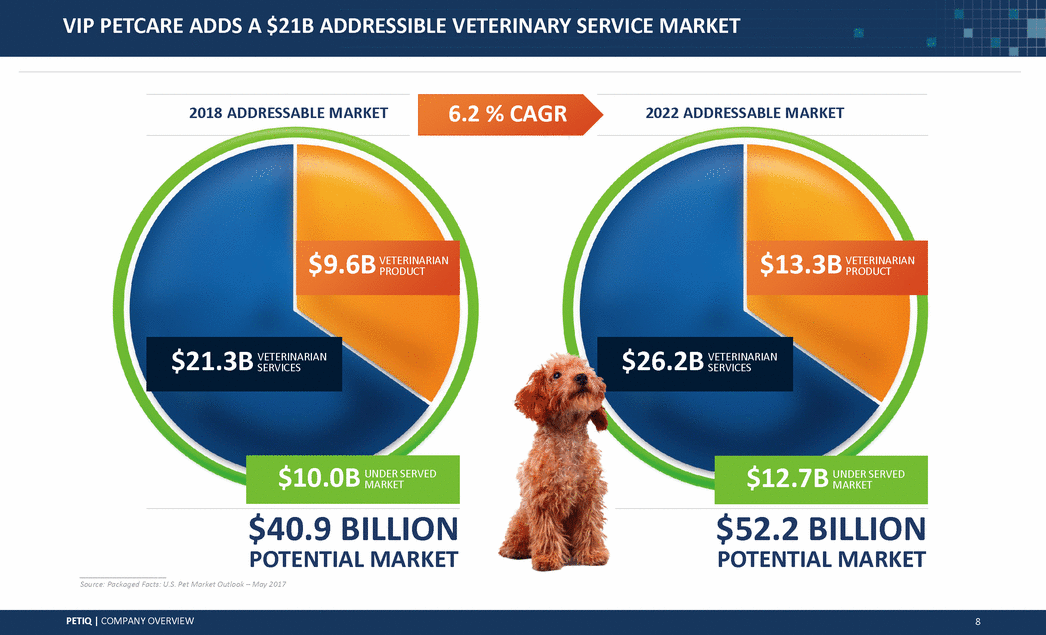
VIP PETCARE ADDS A $21B ADDRESSIBLE VETERINARY SERVICE MARKET 6.2 % CAGR 2018 ADDRESSABLE MARKET 2022 ADDRESSABLE MARKET $13.3B VETERINARIAN PRODUCT PRODUCT SERVICES UNDER SERVED $40.9 BILLION $52.2 BILLION POTENTIAL MARKET POTENTIAL MARKET Source: Packaged Facts: U.S. Pet Market Outlook – May 2017 PETIQ | COMPANY OVERVIEW 8 $10.0B MARKET $12.7B UNDER SERVED MARKET $26.2B VETERINARIAN SERVICES |
|
|
Stronger & More Diversified Platform for Growth PETIQ | COMPANY OVERVIEW 9 |
|
|
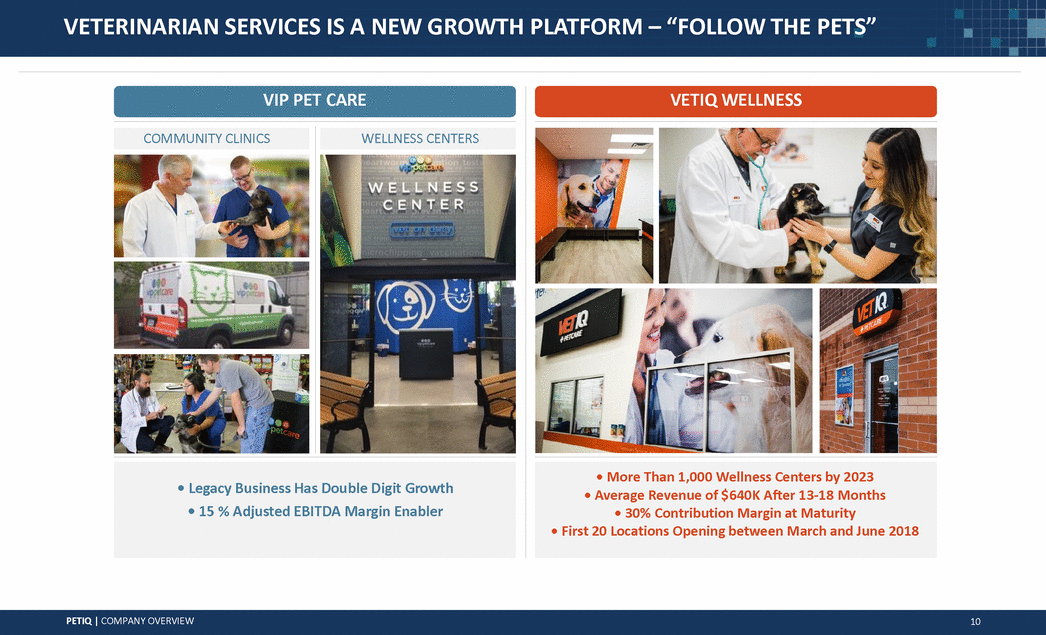
VETERINARIAN SERVICES IS A NEW GROWTH PLATFORM – “FOLLOW THE PETS” VIP PET CARE VETIQ WELLNESS PETIQ | COMPANY OVERVIEW 10 • Legacy Business Has Double Digit Growth • 15 % Adjusted EBITDA Margin Enabler • More Than 1,000 Wellness Centers by 2023 • Average Revenue of $640K After 13-18 Months • 30% Contribution Margin at Maturity • First 20 Locations Opening between March and June 2018 WELLNESS CENTERS COMMUNITY CLINICS |
|
|
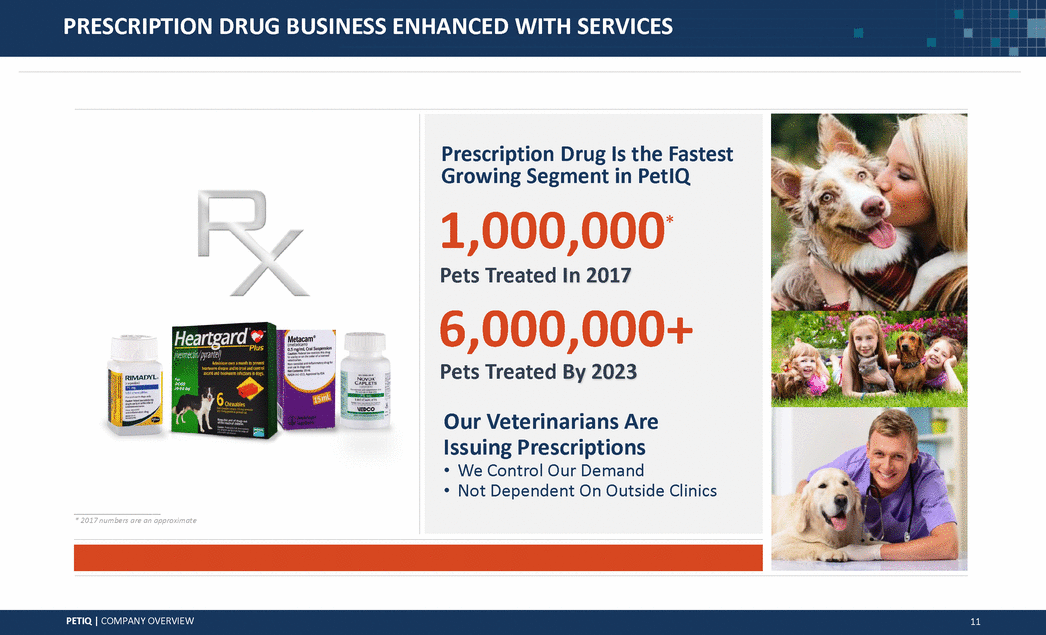
PRESCRIPTION DRUG BUSINESS ENHANCED WITH SERVICES Growing Segment in PetIQ * 2017 numbers are an approximate PETIQ | COMPANY OVERVIEW 11 Prescription Drug Is the Fastest 1,000,000* Pets Treated In 2017 6,000,000+ Pets Treated By 2023 Our Veterinarians Are Issuing Prescriptions • We Control Our Demand • Not Dependent On Outside Clinics |
|
|
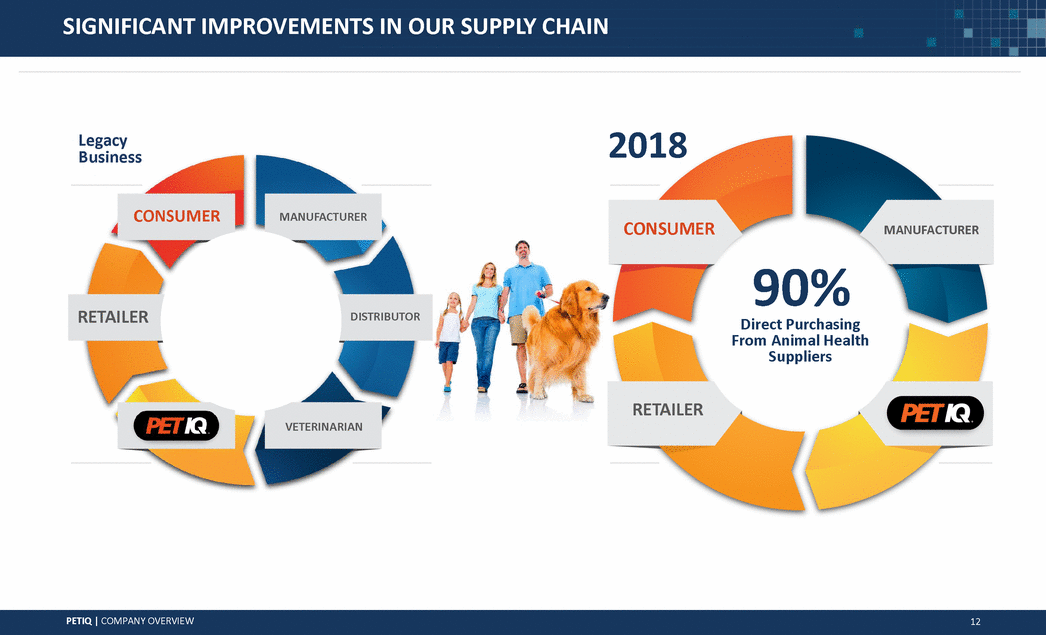
SIGNIFICANT IMPROVEMENTS IN OUR SUPPLY CHAIN 2018 Legacy Business CONSUMER MANUFACTURER CONSUMER MANUFACTURER 90% RETAILER DISTRIBUTOR Direct Purchasing From Animal Health Suppliers RETAILER VETERINARIAN PETIQ | COMPANY OVERVIEW 12 |
|
|
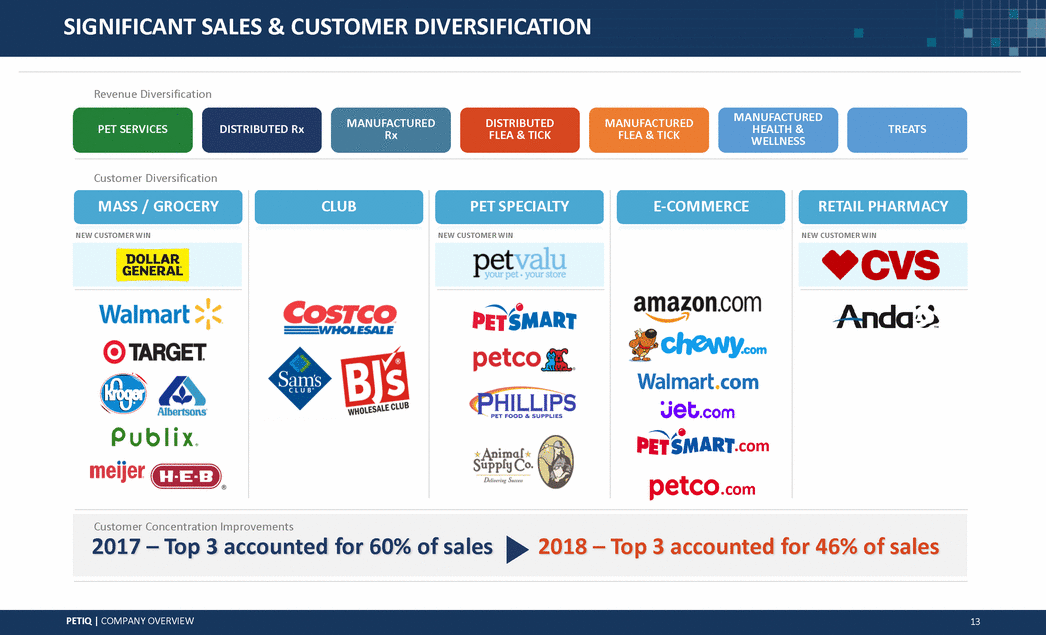
SIGNIFICANT SALES & CUSTOMER DIVERSIFICATION Revenue Diversification MANUFACTURED HEALTH & WELLNESS MANUFACTURED Rx DISTRIBUTED FLEA & TICK MANUFACTURED FLEA & TICK PET SERVICES DISTRIBUTED Rx TREATS Customer Diversification MASS / GROCERY NEW CUSTOMER WIN CLUB PET SPECIALTY NEW CUSTOMER WIN E-COMMERCE RETAIL PHARMACY NEW CUSTOMER WIN .com .com PETIQ | COMPANY OVERVIEW 13 Customer Concentration Improvements 2017 – Top 3 accounted for 60% of sales2018 – Top 3 accounted for 46% of sales |
|
|
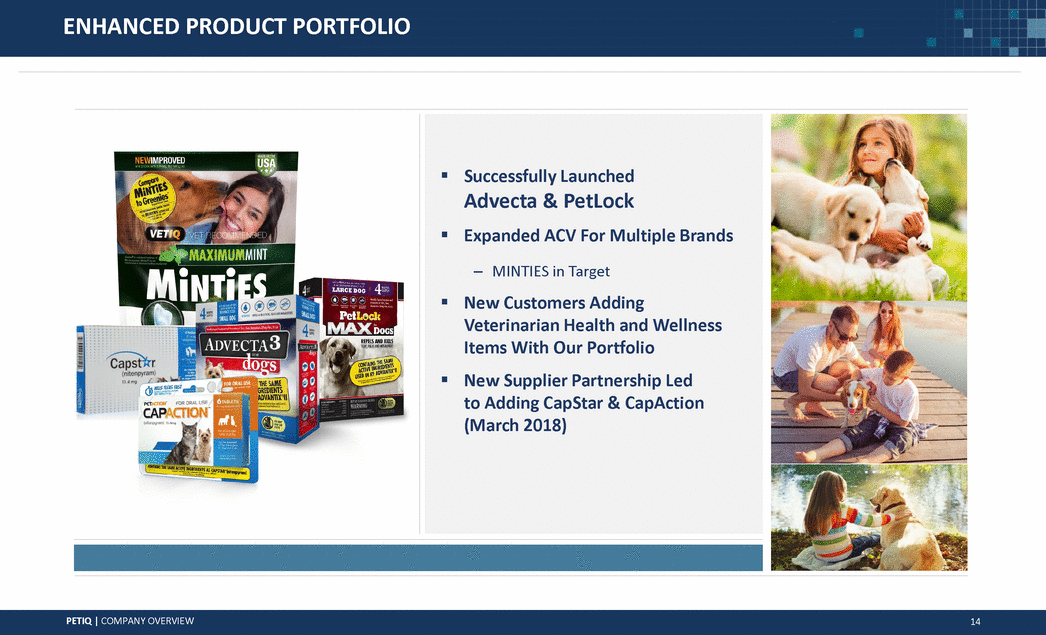
ENHANCED PRODUCT PORTFOLIO PETIQ | COMPANY OVERVIEW 14 Successfully Launched Advecta & PetLock Expanded ACV For Multiple Brands – MINTIES in Target New Customers Adding Veterinarian Health and Wellness Items With Our Portfolio New Supplier Partnership Led to Adding CapStar & CapAction (March 2018) |
|
|
Financial Performance PETIQ | COMPANY OVERVIEW 15 |
|
|
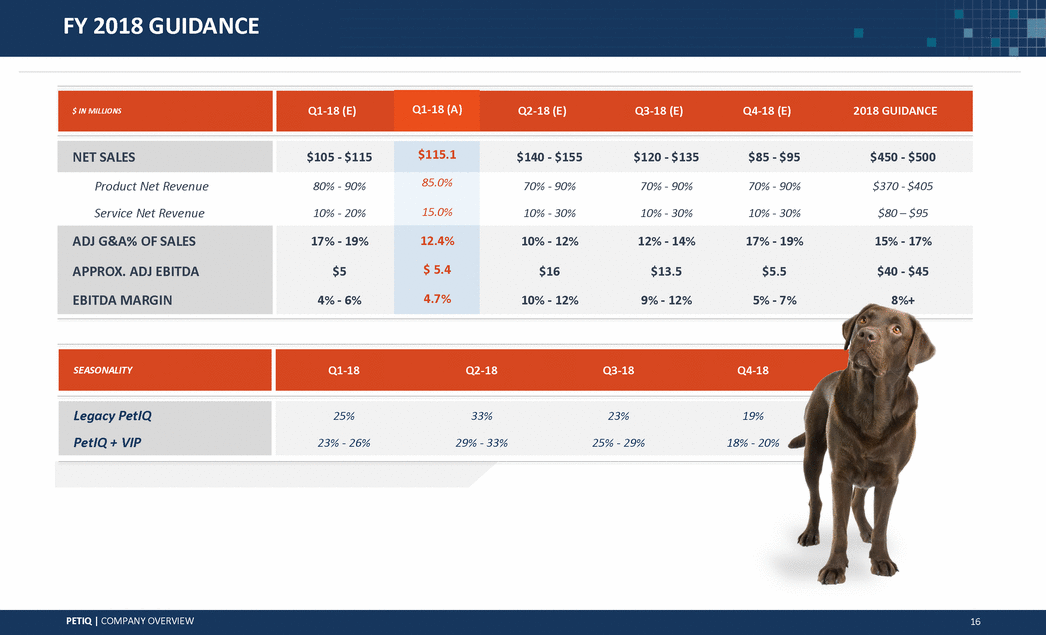
FY 2018 GUIDANCE PETIQ | COMPANY OVERVIEW 16 SEASONALITY Q1-18Q2-18Q3-18Q4-18 Legacy PetIQ PetIQ + VIP 25%33%23%19% 23% - 26%29% - 33%25% - 29%18% - 20% $ IN MILLIONS Q1-18 (E) Q1-18 (A) Q2-18 (E)Q3-18 (E)Q4-18 (E)2018 GUIDANCE NET SALES $105 - $115 $115.1 $140 - $155$120 - $135$85 - $95$450 - $500 Product Net Revenue Service Net Revenue 80% - 90% 10% - 20% 85.0% 15.0% 70% - 90%70% - 90%70% - 90%$370 - $405 10% - 30%10% - 30%10% - 30%$80 – $95 ADJ G&A% OF SALES APPROX. ADJ EBITDA EBITDA MARGIN 17% - 19% $5 4% - 6% 12.4% $ 5.4 4.7% 10% - 12%12% - 14%17% - 19%15% - 17% $16$13.5$5.5$40 - $45 10% - 12%9% - 12%5% - 7%8%+ |
|
|
FLEXIBLE BALANCE SHEET DEBT AND LIQUIDITY BALANCES AS OF MARCH 31ST, 2018 • • • Term Loan $75MM Revolving Credit Facility $43MM Outstanding ($50MM Facility Size) In conjunction with lending partners, plans to exercise ‘accordion’ feature within RLOC agreement, which extends facility size up to $75MM, an increase of $25MM. AS OF QUARTER END, COMPANY MAXIMIZED FACILITY USAGE TO PREPARE WORKING CAPITAL ACCOUNTS, SUCH AS INVENTORIES, FOR UPCOMING HIGH SELLING SEASONS. WORKING CAPITAL CHANGES GOING FORWARD • Working capital accounts, such as inventories and AR, expected to decrease more than 30% prior to year end. Capital Expenditures tied to 2019 wellness center launches are supported through cash generation from current year operations. • INCREASED FACILITY SIZE AND CASH FROM OPERATIONS WILL CREATE A MORE FLEXIBLE BALANCE SHEET FOR PETIQ. FLEXIBILTY WITHOUT NEEDS TO DILUTE SHAREHOLDER BASE. PETIQ | COMPANY OVERVIEW 17 |
|
|
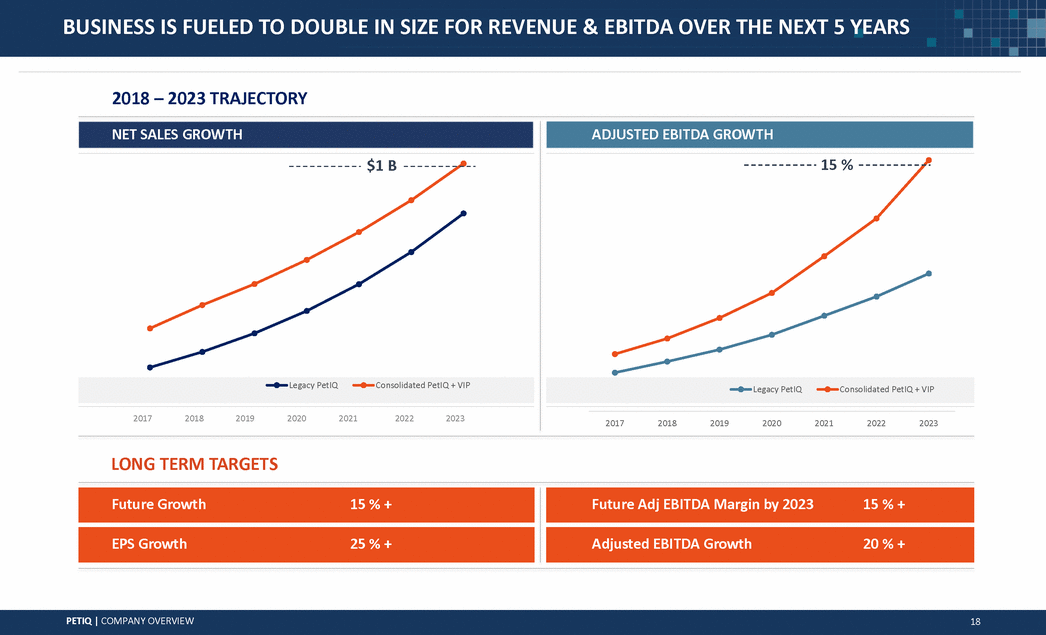
BUSINESS IS FUELED TO DOUBLE IN SIZE FOR REVENUE & EBITDA OVER THE NEXT 5 YEARS 2018 – 2023 TRAJECTORY NET SALES GROWTH ADJUSTED EBITDA GROWTH 15 % $1 B 2017 2018 2019 2020 2021 2022 2023 2017 2018 2019 2020 2021 2022 2023 LONG TERM TARGETS PETIQ | COMPANY OVERVIEW 18 Adjusted EBITDA Growth20 % + EPS Growth25 % + Future Adj EBITDA Margin by 202315 % + Future Growth15 % + Legacy PetIQConsolidated PetIQ + VIP Legacy PetIQConsolidated PetIQ + VIP |
|
|
[LOGO] |
|
|
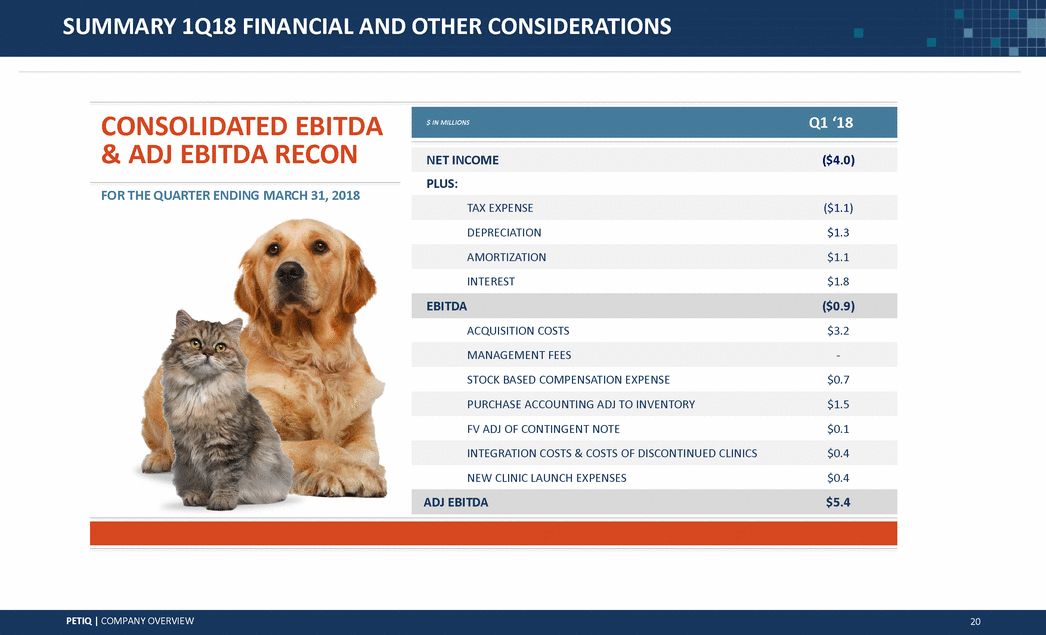
SUMMARY 1Q18 FINANCIAL AND OTHER CONSIDERATIONS CONSOLIDATED EBITDA & ADJ EBITDA RECON PLUS: FOR THE QUARTER ENDING MARCH 31, 2018 DEPRECIATION $1.3 INTEREST $1.8 ACQUISITION COSTS $3.2 STOCK BASED COMPENSATION EXPENSE $0.7 FV ADJ OF CONTINGENT NOTE $0.1 NEW CLINIC LAUNCH EXPENSES $0.4 PETIQ | COMPANY OVERVIEW 20 ADJ EBITDA$5.4 INTEGRATION COSTS & COSTS OF DISCONTINUED CLINICS$0.4 PURCHASE ACCOUNTING ADJ TO INVENTORY$1.5 MANAGEMENT FEES-EBITDA($0.9) AMORTIZATION$1.1 TAX EXPENSE($1.1) NET INCOME($4.0) $ IN MILLIONSQ1 ‘18 |