Attached files
| file | filename |
|---|---|
| 8-K - FORM 8-K - Hospitality Investors Trust, Inc. | tv496313_8k.htm |
Exhibit 99.1
American Realty Capital Hospitality Trust, Inc. HIT REIT Quarterly Investor Presentation June 11, 2018
Risk Factors Investing in our common stock involves a degree of risk . See the section entitled “Risk Factors” in the most recent Annual Report on Form 10 - K of Hospitality Investors Trust, Inc . (“HIT REIT,” the “Company” or “we”) for a discussion of the risks which should be considered in connection with the Company . Forward - Looking Statements This presentation may contain forward - looking statements . You can identify forward - looking statements by the use of forward looking terminology such as “believes,” “expects,” “may,” “will,” “would,” “could,” “should,” “seeks,” “intends,” “plans,” “projects,” “estimates,” “anticipates,” “predicts,” or “potential” or the negative of these words and phrases or similar words or phrases . Please review Risk Factors at the end of this presentation for a discussion of risks and uncertainties that could cause actual results to differ materially from our forward - looking statements. Risk Factors 2
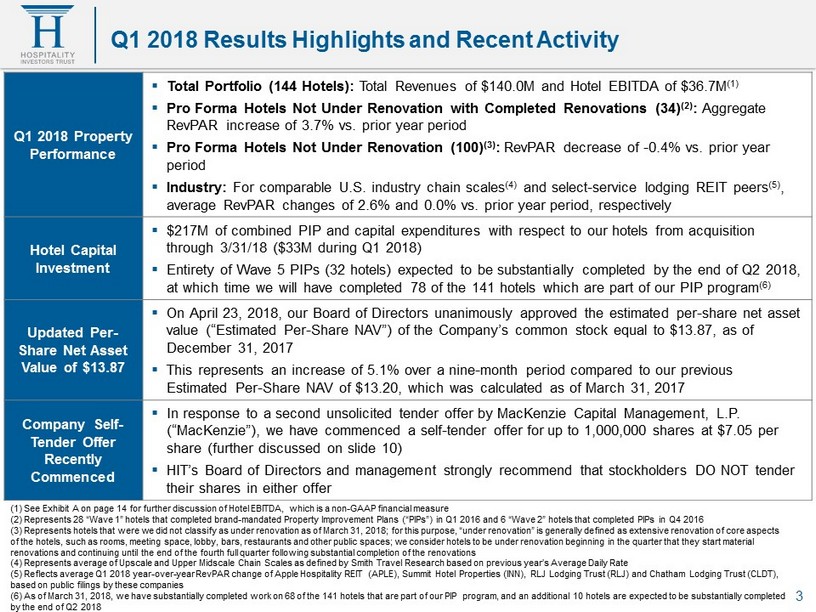
3 Q1 2018 Results Highlights and Recent Activity Q1 2018 Property Performance ▪ Total Portfolio (144 Hotels): Total Revenues of $140.0M and Hotel EBITDA of $36.7M (1) ▪ Pro Forma Hotels Not Under Renovation with Completed Renovations (34) (2) : Aggregate RevPAR increase of 3.7% vs. prior year period ▪ Pro Forma Hotels Not Under Renovation (100) (3) : RevPAR decrease of - 0.4% vs. prior year period ▪ Industry: For comparable U.S. industry chain scales (4) and select - service lodging REIT peers (5) , average RevPAR changes of 2.6% and 0.0% vs. prior year period, respectively Hotel Capital Investment ▪ $217M of combined PIP and capital expenditures with respect to our hotels from acquisition through 3/31/18 ($33M during Q1 2018) ▪ Entirety of Wave 5 PIPs (32 hotels) expected to be substantially completed by the end of Q2 2018, at which time we will have completed 78 of the 141 hotels which are part of our PIP program (6) Updated Per - Share Net Asset Value of $13.87 ▪ On April 23, 2018, our Board of Directors unanimously approved the estimated per - share net asset value (“Estimated Per - Share NAV”) of the Company’s common stock equal to $13.87, as of December 31, 2017 ▪ This represents an increase of 5.1% over a nine - month period compared to our previous Estimated Per - Share NAV of $13.20, which was calculated as of March 31, 2017 Company Self - Tender Offer Recently Commenced ▪ In response to a second unsolicited tender offer by MacKenzie Capital Management, L.P. (“ MacKenzie ”), we have commenced a self - tender offer for up to 1,000,000 shares at $7.05 per share (further discussed on slide 10) ▪ HIT’s Board of Directors and management strongly recommend that stockholders DO NOT tender their shares in either offer (1) See Exhibit A on page 14 for further discussion of Hotel EBITDA, which is a non - GAAP financial measure (2) Represents 28 “Wave 1” hotels that completed brand - mandated Property Improvement Plans (“PIPs”) in Q1 2016 and 6 “Wave 2” ho tels that completed PIPs in Q4 2016 (3) Represents hotels that were we did not classify as under renovation as of March 31, 2018; for this purpose, “under renova tio n” is generally defined as extensive renovation of core aspects of the hotels, such as rooms, meeting space, lobby, bars, restaurants and other public spaces; we consider hotels to be under re novation beginning in the quarter that they start material renovations and continuing until the end of the fourth full quarter following substantial completion of the renovations (4) Represents average of Upscale and Upper Midscale Chain Scales as defined by Smith Travel Research based on previous year’ s A verage Daily Rate (5) Reflects average Q1 2018 year - over - year RevPAR change of Apple Hospitality REIT (APLE), Summit Hotel Properties (INN), RLJ L odging Trust (RLJ) and Chatham Lodging Trust (CLDT), based on public filings by these companies (6) As of March 31, 2018, we have substantially completed work on 68 of the 141 hotels that are part of our PIP program, and an additional 10 hotels are expected to be substantially completed by the end of Q2 2018
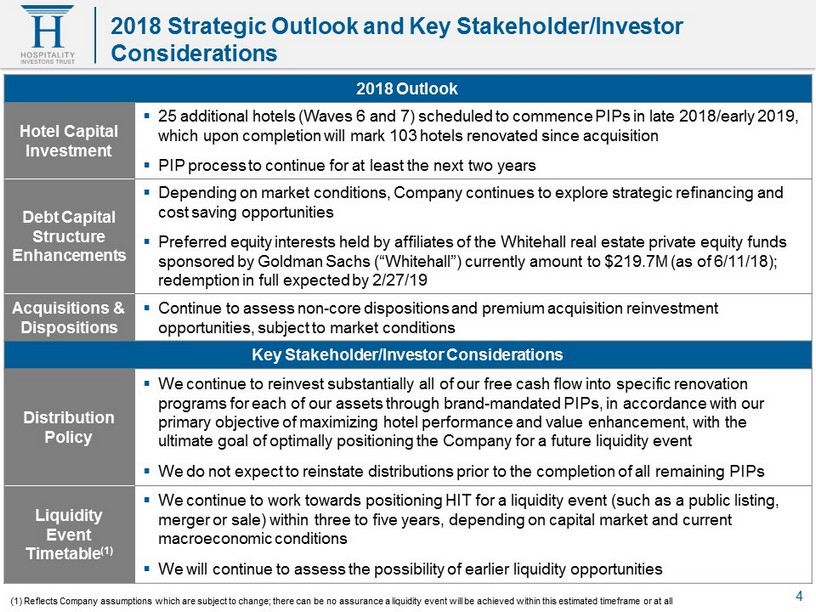
4 2018 Outlook Hotel Capital Investment ▪ 25 additional hotels (Waves 6 and 7) scheduled to commence PIPs in late 2018/early 2019, which upon completion will mark 103 hotels renovated since acquisition ▪ PIP process to continue for at least the next two years Debt Capital Structure Enhancements ▪ Depending on market conditions, Company continues to explore strategic refinancing and cost saving opportunities ▪ Preferred equity interests held by affiliates of the Whitehall real estate private equity funds sponsored by Goldman Sachs (“Whitehall”) currently amount to $219.7M (as of 6/11/18); redemption in full expected by 2/27/19 Acquisitions & Dispositions ▪ Continue to assess non - core dispositions and premium acquisition reinvestment opportunities, subject to market conditions Key Stakeholder/Investor Considerations Distribution Policy ▪ We continue to reinvest substantially all of our free cash flow into specific renovation programs for each of our assets through brand - mandated PIPs, in accordance with our primary objective of maximizing hotel performance and value enhancement, with the ultimate goal of optimally positioning the Company for a future liquidity event ▪ We do not expect to reinstate distributions prior to the completion of all remaining PIPs Liquidity Event Timetable (1) ▪ We continue to work towards positioning HIT for a liquidity event (such as a public listing, merger or sale) within three to five years, depending on capital market and current macroeconomic conditions ▪ We will continue to assess the possibility of earlier liquidity opportunities 2018 Strategic Outlook and Key Stakeholder/Investor Considerations (1) Reflects Company assumptions which are subject to change; there can be no assurance a liquidity event will be achieved wi thi n this estimated timeframe or at all
▪ We own and acquire premier select - service hotels that are: ▪ Affiliated with premium national brands such as Hilton, Marriott and Hyatt ▪ Operated by award - winning and experienced property management companies ▪ Located in strong U.S. markets with diverse demand generators ▪ Well maintained, with brand - mandated renovations expected to further drive hotel operating performance ▪ Positioned as market leaders with attractive rates, occupancies and cash flows ▪ Purchased at what we believe to be a discount to replacement cost ▪ Best in class capital providers signal institutional affirmation of our platform and strategy Hospitality Investors Trust Business Thesis: 5 Investment Strategy
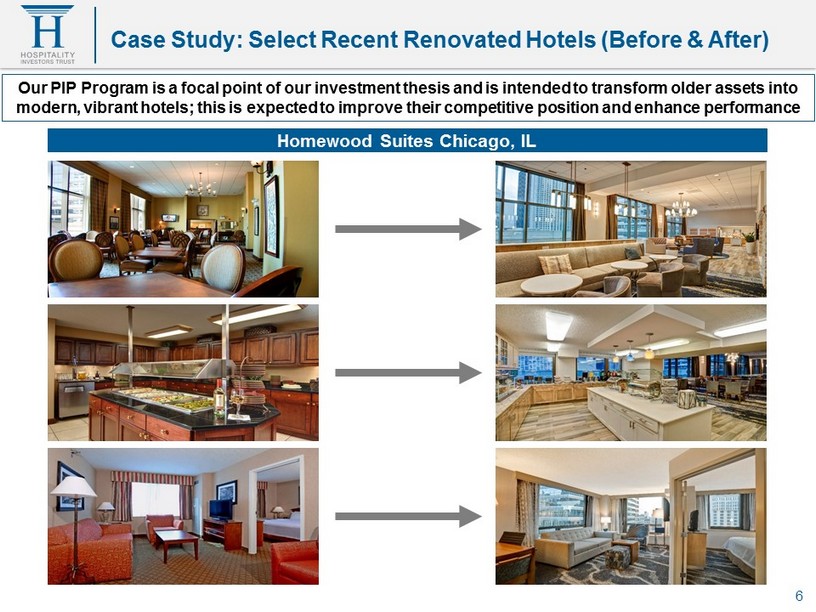
6 Case Study: Select Recent Renovated Hotels (Before & After) Homewood Suites Chicago, IL Our PIP Program is a focal point of our investment thesis and is intended to transform older assets into modern, vibrant hotels; this is expected to improve their competitive position and enhance performance

7 Case Study: Select Recent Renovated Hotels (Before & After) Hyatt Place Kansas City Overland Park, KS
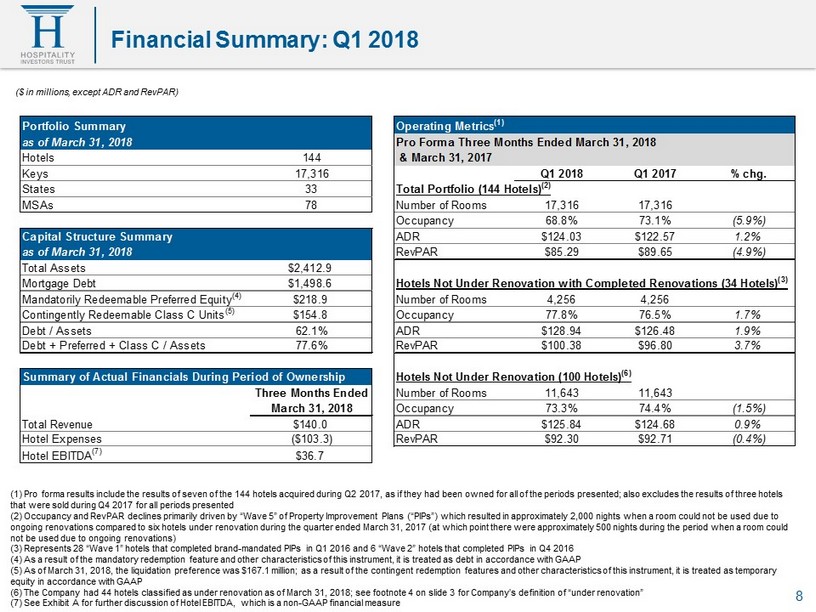
($ in millions, except ADR and RevPAR) (1) Pro forma results include the results of seven of the 144 hotels acquired during Q2 2017, as if they had been owned for a ll of the periods presented; also excludes the results of three hotels that were sold during Q4 2017 for all periods presented (2) Occupancy and RevPAR declines primarily driven by “Wave 5” of Property Improvement Plans (“PIPs”) which resulted in appro xim ately 2,000 nights when a room could not be used due to ongoing renovations compared to six hotels under renovation during the quarter ended March 31, 2017 (at which point there wer e a pproximately 500 nights during the period when a room could not be used due to ongoing renovations) (3) Represents 28 “Wave 1” hotels that completed brand - mandated PIPs in Q1 2016 and 6 “Wave 2” hotels that completed PIPs in Q4 2016 (4) As a result of the mandatory redemption feature and other characteristics of this instrument, it is treated as debt in ac cor dance with GAAP (5) As of March 31, 2018, the liquidation preference was $167.1 million; as a result of the contingent redemption features an d o ther characteristics of this instrument, it is treated as temporary equity in accordance with GAAP (6) The Company had 44 hotels classified as under renovation as of March 31, 2018; see footnote 4 on slide 3 for Company’s de fin ition of “under renovation” (7) See Exhibit A for further discussion of Hotel EBITDA, which is a non - GAAP financial measure 8 Financial Summary: Q1 2018 Portfolio Summary Operating Metrics (1) as of March 31, 2018 Pro Forma Three Months Ended March 31, 2018 Hotels 144 & March 31, 2017 Keys 17,316 Q1 2018 Q1 2017 % chg. States 33 Total Portfolio (144 Hotels) (2) MSAs 78 Number of Rooms 17,316 17,316 Occupancy 68.8% 73.1% (5.9%) Capital Structure Summary ADR $124.03 $122.57 1.2% as of March 31, 2018 RevPAR $85.29 $89.65 (4.9%) Total Assets $2,412.9 Mortgage Debt $1,498.6 Hotels Not Under Renovation with Completed Renovations (34 Hotels) (3) Mandatorily Redeemable Preferred Equity (4) $218.9 Number of Rooms 4,256 4,256 Contingently Redeemable Class C Units (5) $154.8 Occupancy 77.8% 76.5% 1.7% Debt / Assets 62.1% ADR $128.94 $126.48 1.9% Debt + Preferred + Class C / Assets 77.6% RevPAR $100.38 $96.80 3.7% Summary of Actual Financials During Period of Ownership Hotels Not Under Renovation (100 Hotels) (6) Three Months Ended Number of Rooms 11,643 11,643 March 31, 2018 Occupancy 73.3% 74.4% (1.5%) Total Revenue $140.0 ADR $125.84 $124.68 0.9% Hotel Expenses ($103.3) RevPAR $92.30 $92.71 (0.4%) Hotel EBITDA (7) $36.7
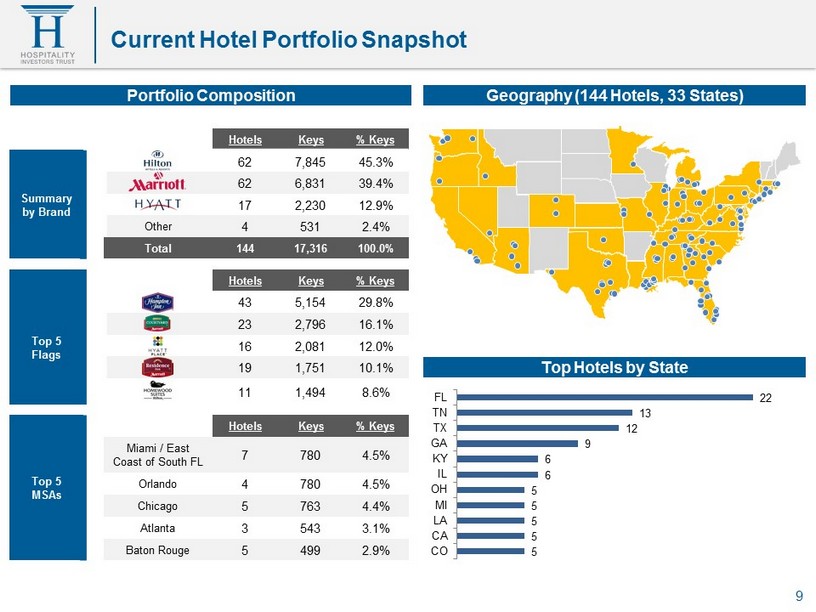
Hotels Keys % Keys Summary by Brand 62 7,845 45.3% 62 6,831 39.4% 17 2,230 12.9% Other 4 531 2.4% Total 144 17,316 100.0% Hotels Keys % Keys Top 5 Flags 43 5,154 29.8% 23 2,796 16.1% 16 2,081 12.0% 19 1,751 10.1% 11 1,494 8.6% Top 5 MSAs Hotels Keys % Keys Miami / East Coast of South FL 7 780 4.5% Orlando 4 780 4.5% Chicago 5 763 4.4% Atlanta 3 543 3.1% Baton Rouge 5 499 2.9% Portfolio Composition Geography (144 Hotels, 33 States) Top Hotels by State 9 Current Hotel Portfolio Snapshot 22 13 12 9 6 6 5 5 5 5 5 FL TN TX GA KY IL OH MI LA CA CO
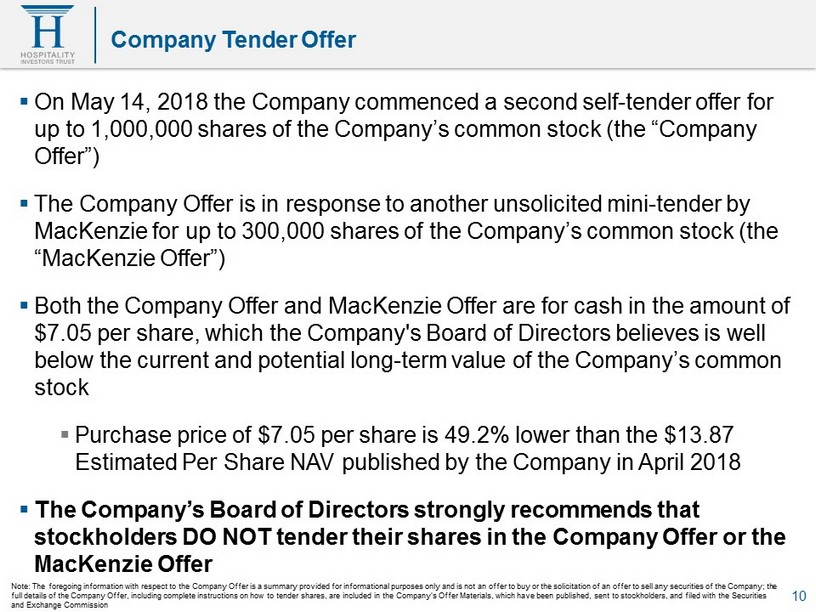
10 Company Tender Offer ▪ On May 14, 2018 the Company commenced a second self - tender offer for up to 1,000,000 shares of the Company’s common stock (the “Company Offer”) ▪ The Company Offer is in response to another unsolicited mini - tender by MacKenzie for up to 300,000 shares of the Company’s common stock (the “ MacKenzie Offer”) ▪ Both the Company Offer and MacKenzie Offer are for cash in the amount of $7.05 per share, which the Company's Board of Directors believes is well below the current and potential long - term value of the Company’s common stock ▪ Purchase price of $7.05 per share is 49.2% lower than the $13.87 Estimated Per Share NAV published by the Company in April 2018 ▪ The Company’s Board of Directors strongly recommends that stockholders DO NOT tender their shares in the Company Offer or the MacKenzie Offer Note: The foregoing information with respect to the Company Offer is a summary provided for informational purposes only and i s n ot an offer to buy or the solicitation of an offer to sell any securities of the Company; the full details of the Company Offer, including complete instructions on how to tender shares, are included in the Company’s Off er Materials, which have been published, sent to stockholders, and filed with the Securities and Exchange Commission
11 Conclusion ▪ In Q1 2018, we continued to see improved operating results and performance at recently renovated hotels, generating what we believe to be a strong return on capital ▪ PIP program will continue and is expected to improve the competitive position of our hotels, drive performance and ultimately maximize stockholder value ▪ We continue to monitor debt market conditions in order to strengthen our capital structure and achieve lower interest costs ▪ Capital recycling initiatives (acquisitions and dispositions) expected to further facilitate portfolio enhancement ▪ Board and Management continue to be committed to the Company’s stakeholders and maximizing stakeholder value
See ‘‘Risk Factors’’ beginning on page 8 of the Company’s 2017 Form 10 - K for a discussion of the risks that should be considered in connection with your investment in our common stock, including : • We have entered into agreements with Brookfield Strategic Real Estate Partners II Hospitality REIT II LLC (the “Brookfield Investor”), pursuant to which, among other things, the Brookfield Investor has purchased $160.0 million in units of a new class of limited partner interests in our operating partnership entitled “Class C Units” (the “Convertible Preferred Units”), and the Brookfield Investor has agreed to purchase additional Convertible Preferred Units in an aggregate amount of up to $240.0 million at subsequent closings (“Subsequent Closings”). We may require funds, which may not be available on favorable terms or at all, in addition to our operating cash flow, cash on hand and the proceeds that may be available from sales of Convertible Preferred Units at Subsequent Closings, which are subject to conditions, to meet our capital requirements. • The interests of the Brookfield Investor may conflict with our interests and the interests of our stockholders, and the Brookfield Investor has significant governance and other rights that could be used to control or influence our decisions or actions. • The prior approval rights of the Brookfield Investor will restrict our operational and financial flexibility and could prevent us from taking actions that we believe would be in the best interest of our business. • We no longer pay distributions and there can be no assurance we will resume paying distributions in the future. • We may not be able to make additional investments unless we are able to identify an additional source of capital on favorable terms and obtain prior approval from the Brookfield Investor. • We have a history of operating losses and there can be no assurance that we will ever achieve profitability. • We have terminated our advisory agreement with our former advisor, American Realty Capital Hospitality Advisors, LLC, and other agreements with its affiliates as part of our transition from external management to self - management. As part of this transition, our business may be disrupted and we may become exposed to risks to which we have not historically been exposed. 12 Risk Factors
13 Risk Factors • No public market currently exists, or may ever exist, for shares of our common stock and our shares are, and may continue to be, illiquid. • All of the properties we own are hotels, and we are subject to risks inherent in the hospitality industry. • Increases in interest rates could increase the amount of our debt payments. • We have incurred substantial indebtedness, which may limit our future operational and financial flexibility. • We depend on our operating partnership and its subsidiaries for cash flow and are effectively structurally subordinated in right of payment to their obligations, which include distribution and redemption obligations to holders of Convertible Preferred Units and the preferred equity interests issued by two of our subsidiaries that indirectly own 111 of our hotels. • The amount we would be required to pay holders of Convertible Preferred Units in a fundamental sale transaction may discourage a third party from acquiring us in a manner that might otherwise result in a premium price to our stockholders. • We may fail to realize the expected benefits of our acquisitions of hotels within the anticipated timeframe or at all and we may incur unexpected costs. • Increases in labor costs could adversely affect the profitability of our hotels. • Our operating results will be affected by economic and regulatory changes that have an adverse impact on the real estate market in general, and we may not be profitable or realize growth in the value of our real estate properties. • A prolonged economic slowdown, a lengthy or severe recession or declining real estate values could harm our investments. • Our real estate investments are relatively illiquid and subject to some restrictions on sale, and therefore we may not be able to dispose of properties at the time of our choosing or on favorable terms. • Our failure to continue to qualify to be treated as a real estate investment trust for U.S. federal income tax purposes could have a material adverse effect on us.
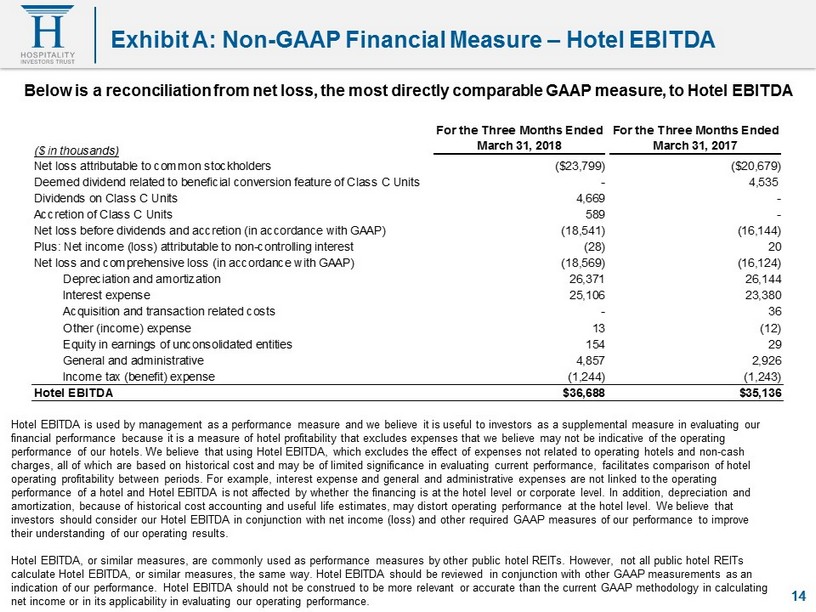
Below is a reconciliation from net loss, the most directly comparable GAAP measure, to Hotel EBITDA Hotel EBITDA is used by management as a performance measure and we believe it is useful to investors as a supplemental measur e i n evaluating our financial performance because it is a measure of hotel profitability that excludes expenses that we believe may not be indica tiv e of the operating performance of our hotels. We believe that using Hotel EBITDA, which excludes the effect of expenses not related to operating ho tels and non - cash charges, all of which are based on historical cost and may be of limited significance in evaluating current performance, faci lit ates comparison of hotel operating profitability between periods. For example, interest expense and general and administrative expenses are not linked to the operating performance of a hotel and Hotel EBITDA is not affected by whether the financing is at the hotel level or corporate level. In ad dition, depreciation and amortization, because of historical cost accounting and useful life estimates, may distort operating performance at the hotel le vel. We believe that investors should consider our Hotel EBITDA in conjunction with net income (loss) and other required GAAP measures of our perf orm ance to improve their understanding of our operating results. Hotel EBITDA, or similar measures, are commonly used as performance measures by other public hotel REITs. However, not all pu bli c hotel REITs calculate Hotel EBITDA, or similar measures, the same way. Hotel EBITDA should be reviewed in conjunction with other GAAP mea sur ements as an indication of our performance. Hotel EBITDA should not be construed to be more relevant or accurate than the current GAAP met hod ology in calculating net income or in its applicability in evaluating our operating performance. 14 Exhibit A: Non - GAAP Financial Measure – Hotel EBITDA 14 For the Three Months Ended For the Three Months Ended ($ in thousands) March 31, 2018 March 31, 2017 Net loss attributable to common stockholders ($23,799) ($20,679) Deemed dividend related to beneficial conversion feature of Class C Units - 4,535 Dividends on Class C Units 4,669 - Accretion of Class C Units 589 - Net loss before dividends and accretion (in accordance with GAAP) (18,541) (16,144) Plus: Net income (loss) attributable to non-controlling interest (28) 20 Net loss and comprehensive loss (in accordance with GAAP) (18,569) (16,124) Depreciation and amortization 26,371 26,144 Interest expense 25,106 23,380 Acquisition and transaction related costs - 36 Other (income) expense 13 (12) Equity in earnings of unconsolidated entities 154 29 General and administrative 4,857 2,926 Income tax (benefit) expense (1,244) (1,243) Hotel EBITDA $36,688 $35,136