Attached files
| file | filename |
|---|---|
| EX-32.1 - CERTIFICATION PURSUANT TO SECTION 906 OF THE SARBANES-OXLEY ACT OF 2002 - TRANSCAT INC | trns3429041-ex321.htm |
| EX-31.2 - CERTIFICATION OF CHIEF FINANCIAL OFFICER PURSUANT TO SECTION 302 - TRANSCAT INC | trns3429041-ex312.htm |
| EX-31.1 - CERTIFICATION OF CHIEF EXECUTIVE OFFICER PURSUANT TO SECTION 302 - TRANSCAT INC | trns3429041-ex311.htm |
| EX-23.1 - CONSENT OF FREED MAXICK CPAS, P.C. - TRANSCAT INC | trns3429041-ex231.htm |
| EX-21.1 - SUBSIDIARIES - TRANSCAT INC | trns3429041-ex211.htm |
| EX-10.19 - LEASE AGREEMENT BETWEEN GALLINA DEVELOPMENT CORPORATION AND TRANSCAT - TRANSCAT INC | trns3429041-ex1019.htm |
UNITED
STATES
SECURITIES AND EXCHANGE
COMMISSION
Washington, D.C. 20549
______________
FORM 10-K
| (Mark one) | ||
| [✓] | ANNUAL REPORT PURSUANT TO SECTION 13 OR 15(d) OF THE SECURITIES EXCHANGE ACT OF 1934 | |
|
For the fiscal year ended: March 31, 2018 | ||
|
or | ||
| [ ] | TRANSITION REPORT PURSUANT TO SECTION 13 OR 15(d) OF THE SECURITIES EXCHANGE ACT OF 1934 |
For the transition period from ___________ to ___________
Commission File Number: 000-03905
TRANSCAT, INC.
(Exact name of registrant as
specified in its charter)
| Ohio | 16-0874418 | ||
| (State or other jurisdiction of | (I.R.S. Employer | ||
| incorporation or organization) | Identification No.) |
35 Vantage Point Drive,
Rochester, New York 14624
(Address of principal executive offices) (Zip Code)
(585) 352-7777
(Registrant’s telephone
number, including area code)
Securities registered pursuant to Section 12(b) of the Act:
| Title of each class | Name of each exchange on which registered |
| Common Stock, $0.50 par value | The NASDAQ Global Market |
Securities registered
pursuant to Section 12(g) of the Act:
None
Indicate by check mark if the
registrant is a well-known seasoned issuer, as defined in Rule 405 of the
Securities Act.
Yes [ ] No [✓]
Indicate by check mark if the
registrant is not required to file reports pursuant to Section 13 or Section
15(d) of the Act.
Yes [ ] No [✓]
Indicate by check mark whether the registrant (1) has filed all reports required to be filed by Section 13 or 15(d) of the Securities Exchange Act of 1934 during the preceding 12 months (or for such shorter period that the registrant was required to file such reports), and (2) has been subject to such filing requirements for the past 90 days. Yes [✓] No [ ]
Indicate by check mark whether the registrant has submitted electronically and posted on its corporate Web site, if any, every Interactive Data File required to be submitted and posted pursuant to Rule 405 of Regulation S-T during the preceding 12 months (or for such shorter period that the registrant was required to submit and post such files). Yes [✓] No [ ]
Indicate by check mark if disclosure of delinquent filers pursuant to Item 405 of Regulation S-K is not contained herein, and will not be contained, to the best of registrant’s knowledge, in definitive proxy or information statements incorporated by reference in Part III of this Form 10-K or any amendment to this Form 10-K. [ ]
Indicate by check mark whether the registrant is a large accelerated filer, an accelerated filer, a non-accelerated filer, a smaller reporting company, or an emerging growth company. See the definitions of “large accelerated filer,” “accelerated filer,” “smaller reporting company” and “emerging growth company” in Rule 12b-2 of the Exchange Act.
| Large accelerated filer [ ] | Accelerated filer [✓] |
| Non-accelerated filer [ ] (Do not check if a smaller reporting company) | Smaller reporting company [ ] |
| Emerging growth company [ ] |
If an emerging growth company, indicate by check mark if the registrant has elected not to use the extended transition period for complying with any new or revised financial accounting standards provided pursuant to Section 13(a) of the Exchange Act. [ ]
Indicate by check mark whether the registrant is a shell company (as defined in Rule 12b-2 of the Act).
Yes [ ] No [✓]
The aggregate market value of the voting and non-voting common equity held by non-affiliates of the registrant on September 22, 2017 (the last business day of the registrant’s most recently completed second fiscal quarter) was approximately $91.0 million. The market value calculation was determined using the closing sale price of the registrant’s common stock on September 22, 2017, as reported on The NASDAQ Global Market.
The number of shares of common stock of the registrant outstanding as of June 6, 2018 was 7,197,513.
DOCUMENTS INCORPORATED BY REFERENCE
Portions of the registrant’s definitive proxy statement relating to the Annual Meeting of Shareholders to be held on September 12, 2018 have been incorporated by reference into Part III, Items 10, 11, 12, 13 and 14 of this report.
EXPLANATORY NOTE
The registrant was previously a “smaller reporting company” under applicable Securities and Exchange Commission rules and regulations. As of the September 22, 2017 determination date, the registrant met the definition of an “accelerated filer.” In accordance with Item 10(f)(2)(i) of Regulation S-K, the registrant is permitted to use the scaled disclosure requirements applicable to smaller reporting companies in this Annual Report on Form 10-K. The registrant will be transitioning to the disclosure requirements applicable to accelerated filers beginning with the registrant’s Quarterly Report on Form 10-Q for the quarterly period ending June 30, 2018.
FORWARD-LOOKING STATEMENTS
This report contains “forward-looking statements” within the meaning of the Private Securities Litigation Reform Act of 1995. Forward-looking statements relate to expectations, estimates, beliefs, assumptions and predictions of future events and are identified by words such as “anticipates,” “believes,” “estimates,” “expects,” “projects,” “intends,” “could,” “may,” and other similar words. Forward-looking statements are not statements of historical fact and thus are subject to risks, uncertainties and other factors that could cause actual results to differ materially from historical results or those expressed in such forward-looking statements. You should evaluate forward-looking statements in light of important risk factors and uncertainties that may affect our operating and financial results and our ability to achieve our financial objectives. These factors include, but are not limited to, our reliance on one vendor to supply a significant amount of inventory purchases, the risks related to current and future indebtedness, the relatively low trading volume of our common stock, risks related to our acquisition strategy and the integration of the businesses we acquire, the impact of economic conditions, including volatility in the oil and gas industry, the highly competitive nature of our two business segments, foreign currency rate fluctuations and cybersecurity risks. These risk factors and uncertainties are more fully described by us under the heading “Risk Factors” in Item IA. of Part I of this report. You should not place undue reliance on our forward-looking statements. Except as required by law, we undertake no obligation to update, correct or publicly announce any revisions to any of the forward-looking statements contained in this report, whether as a result of new information, future events or otherwise.
PART I
BUSINESS OVERVIEW
Transcat, Inc. (“Transcat”, the “Company”, “we” or “us”) is a leading provider of accredited calibration and laboratory instrument services and a value-added distributor of professional grade test, measurement and control instrumentation. We are focused on providing services and products to highly regulated industries, particularly the life science industry, which includes pharmaceutical, biotechnology, medical device and other FDA-regulated businesses. Additional industries served include FAA-regulated businesses, including aerospace and defense industrial manufacturing; energy and utilities, including oil and gas and alternative energy; and other industries that require accuracy in their processes, confirmation of the capabilities of their equipment, and for which the risk of failure is very costly.
We conduct our business through two operating segments: service (“Service”) and distribution (“Distribution”). See Note 7 to our Consolidated Financial Statements in this report for financial information for these segments. We concentrate on attracting new customers in each segment, retaining existing customers and cross-selling to customers to increase our total revenue. We serve approximately 25,000 customers through our Service and Distribution segments, with approximately 25% to 30% of those customers transacting with us through both of our business segments.
Through our Service segment, we offer calibration, repair, inspection, analytical qualifications, preventative maintenance, consulting and other related services, a majority of which are processed through our proprietary asset management system, CalTrak® (“CalTrak®”). Our Service model is flexible, and we cater to our customers’ needs by offering a variety of services and solutions including permanent and periodic on-site services, mobile calibration services, pickup and delivery and in-house services. As of the end of our fiscal year ended March 31, 2018 (“fiscal year 2018”), we operated twenty-two calibration service centers (“Calibration Service Centers”) strategically located across the United States, Puerto Rico, and Canada. We also serve our customers on-site at their facilities for daily, weekly or longer-term periods. In addition, we have several imbedded customer-site locations where we provide calibration services, and in some cases other related services, exclusively for the customer and where we reside and work every day. We also have a fleet of mobile calibration laboratories that can provide service at customer sites which may not have the space or utility capabilities we require to service their equipment.
All of our Calibration Service Centers have obtained ISO/IEC 17025:2005 scopes of accreditation. Our accreditations are the cornerstone of our quality program, which we believe is among the best in the industry. Our dedication to quality is highly valued by businesses that operate in the industries we serve, particularly those in life science and other FDA-regulated industries, and our accreditations provide our customers with confidence that they will receive a consistent and uniform service, regardless of which of our service centers completes the service.
Through our Distribution segment, we sell and rent national and proprietary brand instruments to customers globally. Through our website, in-house sales team and printed and digital marketing materials, we offer access to more than 125,000 test, measurement and control instruments, including products from approximately 500 leading manufacturers. Most instruments we sell and rent require calibration service to ensure that they maintain the most precise measurements. By having the capability to calibrate these instruments at the time of sale and at regular post-sale intervals, we can give customers a value-added service that most of our competitors are unable to provide. Calibrating before shipping means the customer can place their instruments into service immediately upon receipt, saving downtime. Other value-added options we offer through our Distribution segment include equipment kitting (which is especially valued in the alternative energy sector), equipment rentals and used equipment sales.
1
Our commitment to quality goes beyond the services and products we deliver. Our sales, customer service and support teams provide expert advice, application assistance and technical support to our customers. Since calibration is an intangible service, our customers rely on us to uphold high standards and provide integrity in our people and processes.
Our customers include leading manufacturers in the life science/pharmaceutical, energy, defense, aerospace and industrial process control sectors. We believe our customers do business with us because of our integrity and commitment to quality service, our broad range of product and service offerings and CalTrak®. In our fiscal year ended March 25, 2017 (“fiscal year 2017”) through fiscal year 2018, no customer or controlled group of customers accounted for 5% or more of our total revenue. The loss of any single customer would not have a material adverse effect on our business, cash flows, balance sheet, or results of operations.
Transcat was incorporated in Ohio in 1964. We are headquartered in Rochester, New York and employ more than 600 people, including approximately 150 in our corporate headquarters. Our executive offices are located at 35 Vantage Point Drive, Rochester, New York 14624. Our telephone number is 585-352-7777. Our website is www.transcat.com. We trade on The NASDAQ Global Market under the ticker symbol “TRNS”.
OUR STRATEGY
Our two operating segments are highly complementary in that their offerings are of value to customers within the same industries. Our strategy is to leverage the complementary nature of our operating segments in ways that add value for all customers who select Transcat as their source for test and measurement equipment and/or calibration and laboratory instrument services. We strive to differentiate ourselves within the markets we serve and build barriers to competitive entry by offering a broad range of products and services and by integrating our product and service offerings in a value-added manner to benefit our customers’ operations.
During fiscal year 2017, we made an important, strategic decision to commit capital and leadership investments to advance our “Operational Excellence” initiative. We expect this initiative to result in increased operational efficiency and further differentiation from our competitors as we invest in the information system and process improvements needed to improve our effectiveness and our customers’ experiences. During fiscal year 2018, we began to spend capital and make investments to improve our people, processes, and systems pursuant to our Operational Excellence initiative. Our Operational Excellence is a multi-year, ever-evolving initiative that we believe will deliver certain short-term benefits but is focused on the use of technology and process improvements to create an infrastructure to support our strategic goals over a longer timeframe.
Within the Service segment, our strategy is to drive double-digit revenue growth both through organic expansion and acquisitions. We expect to achieve mid-to-high single digit organic revenue growth in this segment. We have adopted an integrated sales model to drive sales across the enterprise and capitalize on the cross-selling opportunities between our two segments, especially leveraging our Distribution relationships to develop new Service relationships. We leverage these relationships with our unique value proposition which resonates strongly with customers who rely on accredited calibration services and/or laboratory instrument services to maintain the integrity of their processes and/or meet the demands of regulated business environments. Our focused customer base values our superior quality programs and requires precise measurement capability in their processes to minimize risk, waste and defects. We execute this strategy by leveraging our quality programs, metrology expertise, multiple locations, qualified technicians, breadth of capabilities, and on-site and depot service options. Together, this allows us to meet the most rigorous quality demands of our most highly regulated customers while simultaneously being nimble enough to meet their business needs.
We expect to continue to grow our Service business organically by taking market share from other third-party providers and original equipment manufacturers (“OEMs”), as well as by targeting the outsourcing of in-house calibration labs. We believe an important element in taking market share is our ability to expand into new technical capabilities that are in demand by our current and target customer base.
The other component to our Service growth strategy is acquisitions. There are three drivers of our acquisition strategy: geographic expansion, increased capabilities and infrastructure leverage. The majority of our acquisition opportunities have been in the $500 thousand to $5 million annual revenue range, and we are disciplined in our approach to selecting target companies. One focus of our Operational Excellence initiative is to strengthen our acquisition integration process, allowing us to capitalize on acquired sales and cost synergies at a faster pace.
2
Our Distribution segment strategy is to be the premier distributor of leading handheld test and measurement equipment. Through our vendor relationships we have access to more than 125,000 products, which we market to our existing and prospective customers both with and without value-added service options that are unique to Transcat. In addition to offering pre-shipment value-added services, we offer our customers the options of renting selected test and measurement equipment or buying used equipment, furthering our ability to answer all of our customers’ test and measurement equipment needs. We continuously evaluate our offerings and add new in-demand vendors and products. In recent years we have expanded the number of SKU’s that we stock and the number of SKU’s that are sold with pre-shipment calibrations and have increased our focus on digital marketing to capitalize on the ever-growing B2B ecommerce trend.
We see these various methods of meeting our Distribution customers’ needs as a way to differentiate ourselves and to diversify this segment’s customer base from its historically more narrow scope. This differentiation and diversification strategy has been deliberately instituted in recent years as a means to mitigate the effect of price-driven competition and to lessen the impact that any particular industry or market will have on the overall performance of this segment.
As part of our growth strategy, we completed one business acquisition during our fiscal year 2017:
| ● | On April 1, 2016, we acquired substantially all of the assets of Excalibur Engineering, Inc. (“Excalibur”). Headquartered in Irvine, California, Excalibur is a provider of calibration services, new and used test equipment sales, and product rentals. |
Our acquisition strategy primarily targets service businesses that expand our geographic reach, increase the depth and/or breadth of our service capabilities and expertise and leverage our infrastructure. The table below illustrates the strategical drivers for the acquisition executed during our fiscal year 2017:
| Geographic | Increased | Leveraged | |
| Expansion | Capabilities | Infrastructure | |
| Excalibur | ✓ | ✓ | ✓ |
3
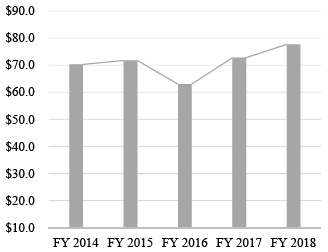
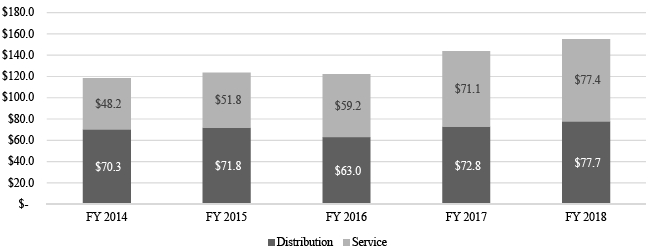
We believe our combined Service and Distribution segment offerings, experience, technical expertise and integrity create a unique and compelling value proposition for our customers, and we intend to continue to grow our business through organic revenue growth and business acquisitions. We consider the attributes of our Service segment which include higher gross margins and recurring revenue streams from customers in regulated industries to be more compelling and scalable than our legacy Distribution segment. For this reason, we expect our Service segment to be the primary source of revenue and earnings growth in future fiscal years. The charts below illustrate Service, Distribution and consolidated revenue over the past five years:
| Service Revenue Trend (in millions) | Distribution Sales Trend (in millions) | |
|
|
 |
| Consolidated Revenue (in millions) |
 |
SEGMENTS
Service Segment
Calibration. Calibration is the act of comparing a unit or instrument of unknown value to a standard of known value and reporting the result in some specifically defined form. After the calibration has been completed, a decision is made, based on rigorously defined parameters, regarding what, if anything, should be done to the unit to conform to the required standards or specifications. The decision may be to adjust, optimize or repair a unit; limit the use, range or rating of a unit; scrap the unit; or leave the unit as is. The purpose of calibration is to significantly reduce the risk of product or process failures caused by inaccurate measurements. In addition to being an element of quality control and risk management, calibration improves an operation’s productivity and efficiency to optimal levels by assuring accurate, reliable instruments and processes.
4
The need for calibration is often driven by regulation, and we specifically target industries and companies that are regulated by the FDA, FAA or other regulatory bodies and, as a result, require quality calibration and laboratory instrument services as a critical component of their business operations. As a result of the various levels of regulation within our target industries, our customers’ calibration and laboratory instrument service sourcing decisions are generally made based on the provider’s quality systems, accreditation, reliability, trust, customer service and documentation of services. To maintain our competitive position in this segment, we maintain internationally recognized third-party accredited quality systems, further detailed in the section entitled “Quality” below, and provide our customers with access to proprietary asset management software solutions, which offer tools to manage their internal calibration programs and provide them with visibility to their service records.
Through our Service segment, we perform recurring periodic calibrations (typically ranging from three-month to twenty-four month intervals) on new and used instruments. We perform over 500,000 calibrations annually and can address a significant majority of the items requested to be calibrated with our in-house capabilities. For customers’ calibration needs in less common and highly specialized disciplines, we subcontract some calibrations to third-party vendors that have unique or proprietary capabilities. While typically representing approximately 13% to 15% of our Service segment revenue, we believe the management of these vendors is highly valued by our customers, and doing so has enabled us to continue our pursuit of having the broadest calibration offerings in these targeted markets.
Laboratory Instrument Services. Our laboratory instrument services (“LIS”) include analytical qualification, validation, remediation and preventative maintenance services. Our analytical qualification and validation services provide a comprehensive and highly specialized service offering focused on life science-related industries. Analytical qualifications and validation services include validations to specifically documented protocols that are commonly used in highly-regulated life science industries including installation qualification (“IQ”), operational qualification (“OQ”), and performance qualification (“PQ”). Most of the demand for our qualification, validation and preventative maintenance services comes from companies and institutions engaged in pharmaceutical manufacturing and research and development.
Our goal is to deliver specialized technical services with a quality assurance approach, which maximizes document accuracy and on-time job delivery. These industries demand knowledgeable contract services, and Transcat meets these demands with current good manufacturing practice (“cGMP”) and good laboratory practice (“GLP”) compliant services. Companies within these innovative and cutting-edge life science industries need a reliable alternative to the OEMs and the “generalist” service providers who cannot meet their industry-specific needs. We believe our value proposition to the life science industries is unique as a result of offering a comprehensive suite of both traditional calibration and laboratory instrument and other analytical services.
Analytical qualifications and preventative maintenance services are typically based on service agreements for periodic service, and tend to generate recurring revenue. Some validation services are based on certain customer processes. While some validation services may not be repeated, we generally develop relationships with these customers that lead to demand for additional unique validation services. Remediation services are based on specific regulatory actions and are generally project-based and required by a customer for a finite period of time. Remediation revenue is not recurring by its nature.
Other Services. We provide other services to our customers such as inspection, repair and consulting services, which appeal to customers across all sectors in our customer base. These are generally value-added services and allow us to provide “one-stop shopping” for our customers.
Service Value Proposition. Our calibration services strategy encompasses multiple ways to manage a customer’s calibration and laboratory instrument service needs:
| 1) | We offer an “Integrated Calibration Service Solution” that provides a complete wrap-around service, which can be delivered in the following ways: |
| ● |
in-house services: services are performed at one of our twenty-two Calibration Service Centers (often accompanied by pick-up and delivery services); |
| ● |
periodic on-site services: Transcat technicians travel to a customer’s location and provide bench-top or in-line calibration or laboratory services on predetermined service cycles; |
| ● |
permanent on-site services: Transcat establishes and manages a calibration service program within a customer’s facility; and |
| ● |
mobile calibration services: services are completed on a customer’s property within one of our mobile calibration units. |
| 2) | For companies that maintain an internal calibration operation, we can provide: |
| ● |
calibration of primary standards; and |
| ● |
overflow capability, either on-site or at one of our Calibration Service Centers, during periods of high demand. |
5
Inclusive with all these services, we provide total program management including logistical, remediation and consultation services when needed.
We strive to provide the broadest accredited calibration offering to our targeted markets, which includes certification of our technicians pursuant to the American Society for Quality standards, complete calibration management encompassing the entire metrology function, and access to our complementary service and product offerings. We believe our calibration services are of the highest technical and quality levels, with broad ranges of accreditation.
Our LIS strategy is to identify and establish long-term relationships with life science research and development and manufacturing customers who require analytical qualifications, validation, remediation and/or preventative maintenance services. In most cases, these customers are life science companies, including pharmaceutical and biotechnology companies engaged in research and development and manufacturing, which are subject to extensive government regulation. The services we provide to these regulated customers are typically a critical component of the customer’s overall compliance program. Because many laboratory instrument service customers operate in regulated industries, these same customers typically also require accredited calibration services. This requirement allows a natural synergy between our laboratory instrument and calibration services. Our strategy includes cross-selling our services within our customer accounts to maximize our revenue opportunities with each customer.
Proprietary Asset Management Software. CalTrak® is our proprietary documentation and asset management software which is used to integrate and manage both the workflow of our Calibration Service Centers and our customers’ assets. With CalTrak®, we are able to provide our customers with timely and consistent calibration service while optimizing our own efficiencies. CalTrak® has been validated to U.S. federal regulations 21 CFR Part 820.75 and 21 CFR Part 11, as applicable. This validation is important to pharmaceutical and other FDA-regulated industries where federal regulations can be particularly stringent.
Additionally, CalTrak® Online provided our customers with web-based asset management capability and a safe and secure off-site archive of calibration and other service records that can be accessed 24 hours a day through our secure password-protected website.
Our newly developed cloud-based customer portal and asset management tool, C3®, replaced CalTrak® Online in our fiscal year 2018. C3® stands for Compliance, Control and Cost, and at Transcat we see these as the major areas of focus for our clients within the regulatory environment as it relates to instrument calibration. We specifically designed C3® to assist our customers in increasing efficiency, driving compliance to quality system and enhancing control of instrumentation, all while bringing their overall metrology costs down. Understanding the regulated environments that our clients operate within, we customized the platform to allow for single system of record utilization via capabilities that allow clients to track and manage instruments maintained internally in addition to instruments supported by Transcat. C3® is validated to 21 CFR Part 820.75 and 21 CFR Part 11 to meet stringent FDA requirements.
Through CalTrak®, CalTrak® Online and C3®, each customer calibration is tracked and automatically cross-referenced to the assets used to perform the calibration, providing traceability.
Service Marketing and Sales. Under our integrated sales model, we have both inside and outside sales teams that seek to acquire new customers in our targeted markets by leveraging our unique value proposition, including our broad geographic footprint and comprehensive suite of services. We target regulated, enterprise customers with multiple manufacturing operations throughout North America. We leverage our ability to manage the complete life cycle of instrumentation from purchase of calibrated equipment to long-term service and maintenance requirements. Connecting all the dots by using new and used product sales, rentals, and repair and calibration services is the goal of our marketing and sales initiatives. We also have a team of customer success managers focused on delivering ever-increasing value for our existing customers. We utilize print media, trade shows and web-based initiatives to market our services to customers and prospective customers with a strategic focus in the highly regulated industries including life science and other FDA-regulated industries, aerospace and defense, energy and utilities, and chemical manufacturing. We also target industrial manufacturing and other industries that appreciate the value of quality calibrations.
Service Competition. The calibration services industry is highly fragmented and is composed of companies ranging from internationally recognized and accredited OEM’s, to non-accredited sole proprietors as well as companies that perform their own calibrations in-house, resulting in a tremendous range of service levels and capabilities. A large percentage of calibration companies are small businesses that generally do not have a range of capabilities as broad as ours. There are also several companies with whom we compete that have national or regional operations.
6
We differentiate ourselves from our competitors by demonstrating our commitment to quality, having a wide range of capabilities that are tailored to the markets we serve, having a geographical footprint that spans North America and providing a comprehensive suite of services that spans many manufacturers and is not limited to certain product lines or brands. Our unique ability to bundle our products with our LIS and calibration services also provides a high level of differentiation from our competitors. As one of the only North American LIS and calibration service providers who also distributes product, our customers can seamlessly replace instruments that cannot be calibrated or are otherwise deemed to be at end of life. Our close knowledge of the products we distribute also allows our service staff to consult and advise customers on what products are best suited for their in-house calibration needs. We also believe that our proprietary software is a key differentiator from our competitors. CalTrak® Online and C3® are utilized by our customers in an integrated manner, providing a competitive barrier as customers realize synergies and efficiencies as a result of this integration.
In fiscal year 2018, we continued to expand our range of capabilities by making significant capital and staffing investments in reference-level radio frequency/microwave calibration capabilities, including adding a widely-respected Director of Metrology. This allowed us to increase business with our prestigious clients in the enterprise computer manufacturing and aerospace defense sectors. In addition, we grew our mobile calibration laboratory fleet and added the ability to carry inventory and sell products while onsite. This was done to strategically target onsite calibration and instrument sales to the wind energy sector. We believe this mobile approach combined with our high-quality significantly improves our differentiation in this space.
Competition for laboratory instrument services is composed of both small local and regional service providers and large multinational OEMs. We believe we are generally financially stronger, service a larger customer base and are typically able to offer a larger suite of services than many of the small local and regional competitors. The large OEMs may offer specialized services and brand-specific expertise which we do not offer, but they are generally focused on providing specialized services only for their proprietary brands and product lines, rather than servicing an array of brands and product lines as we do. We believe our competitive advantages in the laboratory instrument services market are our financial and technical resources, turnaround time, and flexibility to react quickly to customers’ needs. The breadth of our suite of laboratory instrument service, combined with our calibration service offerings, also differentiates us from our competitors by allowing us to be our customers’ one-source accredited services provider for their entire calibration and compliance programs.
Service Quality. The accreditation process is the only system currently in existence that validates measurement competence. To ensure that the quality and consistency of our calibrations are consistent with the global metrology network, designed to standardize measurements worldwide, we have sought and achieved international levels of quality and accreditation to provide uniformity across all locations with advanced levels of training for our technical staff. Our Calibration Service Centers are accredited to ISO/IEC 17025:2005 by ANSI-ASQ National Accreditation Board (“ANAB”) and other accrediting bodies. These accrediting bodies are signatories to the International Laboratory Accreditation Cooperation (“ILAC”), are proficient in the technical aspects of the chemistry and physics that underlie metrology, and provide an objective, third-party, internationally accepted evaluation of the quality, consistency, and competency of our calibration processes. Accreditation also requires that all measurement standards used for accredited measurements have a fully documented path, known as Metrological Traceability, through the National Institute of Standards and Technology or the National Research Council (the National Measurement Institutes for the United States and Canada, respectively), or to other national or international standards bodies, or to measurable conditions created in our Calibration Service Center, or accepted fundamental and/or natural physical constants, ratio type of calibration, or by comparison to consensus standards, all inclusive of measurement uncertainties.
The importance of this international oversight to our customers is the assurance that our service documentation will be accepted worldwide, removing one of the barriers to trade that they may experience if using a non-ILAC traceable calibration service provider. To provide the widest range of services to our customers in our target markets, our ISO/IEC 17025:2005 accreditations extend across many technical disciplines, including working-level and reference-level capabilities. We believe our scope of accreditation to ISO/IEC 17025:2005 to be the broadest for the industries we serve.
Acquired calibration labs might use other quality registration systems. We continually evaluate when to integrate acquired quality systems with the focus on minimizing business disruptions and disruptions to our customers while maintaining our focus on quality.
Our scopes of accreditation can be found at http://www.transcat.com/calibration-services/accreditation/calibration-lab-certificates.
Distribution Segment
Distribution Summary. We distribute professional grade test, measurement and control instrumentation throughout North America and internationally. Our customers use test and measurement instruments to ensure that their processes, and ultimately their end products, are within specification. Utilization of such diagnostic instrumentation also allows for continuous improvement processes to be in place, increasing the accuracies of their measurements. The industrial test and measurement instrumentation market, in those geographic areas where we predominately operate, has historically been serviced by broad-based national equipment distributors and niche or specialty-focused organizations such as Transcat. We offer value-added services such as calibration/certification of equipment purchases, equipment rentals, used equipment for sale, and equipment kitting. In recent years, online-based distributors have become more prevalent. To more effectively compete with these online-based distributors, we have continued to make improvements to our digital platform, including enhanced e-commerce capabilities.
7
We believe that a customer chooses a distributor based on a number of different criteria, including product availability, price, ease of doing business, timely delivery and accuracy of orders, consistent product quality, technical competence of the representative serving them and availability of value-added services. The decision to buy is generally made by plant engineers, quality managers, or their purchasing personnel, and products are typically obtained from one or more distributors as replacements, upgrades, or for expansion of manufacturing and research and development facilities. As a result, sales to Distribution customers are somewhat unpredictable and potentially non-recurring. Our online presence, including our website and e-newsletters; Master Catalog; supplemental mailings and other sales and marketing activities are designed to create demand and maintain a constant presence in front of our customers to ensure we receive the order when they are ready to purchase.
We provide our customers with value-added services, including technical support, to ensure our customers receive the right product for their application, and more comprehensive instrument suitability studies to customers in regulated industries who are concerned about the technical uncertainties that their testing or in-process instruments may bring to a process. We consider our biggest value-added service for our Distribution customers is the option to have calibration service performed on their new product purchases prior to shipment, allowing them to place newly acquired equipment directly into service upon receipt, saving downtime. We also offer online procurement, credit card payment options, same day shipment of in-stock items, kitted products, the option to rent, training programs and a variety of custom product offerings. Items are regularly added to and deleted from our product offerings on the basis of customer demand, recommendations of suppliers, sales volumes and other factors. Because of the breadth of our product and service offerings, we are often a “one-stop shop” for our customers who gain operational efficiency by dealing with just one distributor for most or all of their test and measurement instrumentation needs.
In fiscal year 2018, our Distribution segment performed well against our corporate strategy. We grew our core set of customers while focusing on strategic pricing initiatives that drove incremental gross profit. Our focus on higher margin channels such as used equipment and rentals will be a continual focus to bolster profitability in the Distribution segment. This effort is intended to offset competitive pressures in our legacy distribution business.
Distribution Marketing and Sales. We market, create demand and sell to our customers through multiple direct sales channels including our website, digital and print advertising, proactive outbound sales and an inbound call center. Our outbound and inbound sales teams are staffed with technically trained personnel who are available to help guide product selection. Our website serves as a sales channel for our products and services, and provides search capability, detailed product information, in-stock availability, selection guides, demo videos and downloadable product specification sheets. We have made investments in our website to implement the latest marketing technologies which allow us to provide an intuitive customer experience, with simple product comparison and quoting, ease at checkout and automated post-order follow-up. We also operate and maintain several industry-specific service websites, obtained through recent acquisitions.
We use a multichannel approach to reach our customers and prospective customers including our Master Catalog, periodic supplemental catalogs, website, e-newsletters, and other direct sales and marketing programs. Our digital marketing strategy includes ongoing investment in search engine optimization, application-specific digital content, pay-per-click search engine advertising, and product listings on online marketplaces such as Amazon and Google Shopping. We continue to invest in back-end technologies designed to provide a seamless customer experience across all our marketing channels. During fiscal year 2018, we proactively communicated with our customers and prospective customers through direct mail catalogs, email newsletters, vertical email drip campaigns, retargeting ads, educational webinars, and outbound sales calls. Some of the key factors that determine the marketing materials a customer may receive include relevancy of new product introductions, current promotions, purchase history, the customer’s market segment, and the contact’s job function.
As a result of strong relationships with our product vendors and our historical marketing program results, we have the opportunity to carry out co-branded marketing initiatives, aimed at our existing customers and our prospective customer base, for which we receive cooperative advertising support. These co-branded marketing initiatives typically feature specific vendors, new products or targeted product categories and take the form of direct mailers, web-based initiatives or outbound sales efforts.
Distribution Competition. The distribution market for industrial test and measurement instrumentation is fragmented and highly competitive. Our competitors range from large national distributors and manufacturers that sell directly to customers to small local distributors and online distributors. Key competitive factors typically include customer service and support, quality, lead time, inventory availability, brand recognition and price. To address our customers’ needs for technical support and product application assistance, we employ a staff of highly trained technical sales specialists. In order to maintain this competitive advantage, technical training is an integral part of developing our sales staff. To differentiate ourselves from competitors, we offer pre-shipment calibration or performance data reports which allow customers to receive our products and immediately place them into service, saving them downtime and money.
8
Online distributors, including Amazon for lower price-point products, have become prominent competitors for sales of handheld test and measurement equipment, competing primarily on price. While online competitors lack the value-added services we offer in our Distribution segment, they have been successful in capturing some market share in the worldwide market for test and measurement instruments. To stay ahead of growing competition from these online distributors and in keeping with the general trend of increased use of e-commerce, we continue to invest in our digital platform including a well-indexed website with improved design and functionality. In addition, we have diversified our offerings by expanding the brands and product lines that we offer and adding higher gross margin equipment rentals and used equipment sales, which we believe makes Transcat unique among our competitors.
Distribution Suppliers and Purchasing. We believe that effective purchasing is a key element to maintaining and enhancing our position as a provider of high quality test and measurement instruments. We frequently evaluate our purchase requirements and suppliers’ offerings to obtain products at the best possible cost. We obtain our products from approximately 500 suppliers of brand name and private-labeled equipment. In fiscal year 2018, our top 10 vendors accounted for approximately 63% of our aggregate Distribution business.
We plan our product mix and inventory stock to best serve the anticipated needs of our customers, whose individual purchases vary in size. We can usually ship our top selling products to our customers the same day they are ordered.
Distribution Vendor Rebates. We have agreements with certain product vendors that provide for rebates based on meeting a specified cumulative level of purchases and/or incremental distribution sales. These rebates are recorded as a reduction of cost of distribution sales. Purchase rebates are calculated and recorded quarterly based upon our volume of purchases with specific vendors during the quarter. Point of sale rebate programs that are based on year-over-year sales performance on a calendar year basis are recorded as earned, on a quarterly basis, based upon the estimated level of annual achievement. Point of sale rebate programs that are based on year-over-year sales performance on a quarterly basis are recorded as earned in the respective quarter.
Distribution Operations. Our Distribution operations primarily take place at our 37,250 square-foot facility in Rochester, New York and a 12,600 square-foot facility in Portland, Oregon. With the growth of the distribution business over the past few years we are investing in the expansion of our Rochester warehouse by adding approximately 7,000 square feet of additional warehouse space. The Rochester location also serves as our corporate headquarters, houses our customer service, sales and administrative functions, and is a Calibration Service Center. The Portland location also is a Calibration Service Center. In fiscal year 2018, we shipped approximately 35,000 product orders, in the aggregate, from both locations. We also have two smaller warehouse facilities. Our Wisconsin warehouse fulfills orders for certain large industrial scales and our Irvine, California warehouse fulfills orders for stock used and rental equipment. The Irvine, California location was added in fiscal year 2017 with the Excalibur acquisition.
Distribution Backlog. Distribution orders include orders for instruments that we routinely stock in our inventory, customized products, and other products ordered less frequently, which we do not stock. Pending product shipments are primarily backorders, but also include products that are requested to be calibrated in one of our Calibration Service Centers prior to shipment, orders required by the customer to be shipped complete or at a future date, and other orders awaiting final credit or management review prior to shipment. Our total backlog was $3.0 million and $3.6 million as of March 31, 2018 and March 25, 2017, respectively.
CUSTOMER SERVICE AND SUPPORT
Key elements of our customer service approach are our field business development sales team, outbound sales team, account management team, inbound sales and customer service organization. To ensure the quality of service provided, we monitor our customer service through customer surveys, call monitoring and daily statistical reports.
Customers may place orders via:
| ● |
Mail to Transcat, Inc., 35 Vantage Point Drive, Rochester, NY 14624; |
| ● |
Fax at 1-800-395-0543; |
| ● |
Telephone at 1-800-828-1470; |
| ● |
Email at sales@transcat.com; or |
| ● |
Online at transcat.com |
9
INFORMATION REGARDING EXPORT SALES
In fiscal years 2016 through 2018, approximately 10% of our total revenue resulted from sales to customers outside the United States. Of those export sales in fiscal year 2018, approximately 14% were denominated in U.S. dollars and the remaining 86% were in Canadian dollars. Our revenue is subject to the customary risks of operating in an international environment, including the potential imposition of trade or foreign exchange restrictions, tariff and other tax increases, fluctuations in exchange rates and unstable political situations, any one or more of which could have a material adverse effect on our business, cash flows, balance sheet or results of operations. See “Foreign Currency” in Item 7A. of Part II and Note 7 to our Consolidated Financial Statements in this report for further details.
INFORMATION SYSTEMS
We utilize a turnkey enterprise software solution from Infor, Inc. (“Infor”) called Application Plus to manage our business and operations segments. This software includes a suite of fully integrated modules to manage our business functions, including customer service, warehouse management, inventory management, financial management, customer relations management and business intelligence. This solution is a fully mature business package and has been subject to more than 20 years of refinement. We utilize customer relationship management (“CRM”) software offered by SalesForce.com, Inc., which is strategically partnered with Infor, allowing us to fully integrate the CRM software with our Infor enterprise software.
We also utilize CalTrak®, our proprietary document and asset management system, to manage documentation, workflow and customers’ assets within and amongst most of our Calibration Service Centers. In addition to functioning as an internal documentation, workflow, and asset management system, CalTrak®, through CalTrak® Online and C3®, provides customers with web-based calibration cycle management service and access to documentation relating to services completed by Transcat. Certain recent acquisitions utilize either third-party or their own proprietary calibration management systems. We continually evaluate when to integrate these acquired systems with a focus on obtaining operational synergies while imposing minimal disruption to customers.
INTELLECTUAL PROPERTY
We have federally registered trademarks for Transcat®, CalTrak® and C3®, which we consider to be of material importance to our business. The registrations for these trademarks are in good standing with the U.S. Patent & Trademark Office. Our CalTrak® trademark is also registered in Canada for one class with the Canada Intellectual Property Office. Our trademark registrations must be renewed at various times, and we intend to renew our trademarks, as necessary, for the foreseeable future.
We have filed an application with the U.S. Patent & Trademark Office to trademark in one class the brand name “Procision” in the United States. The U.S. Patent & Trademark Office is currently examining the application.
In addition, we own www.transcat.com and www.transcat.ca. As with phone numbers, we do not have, and cannot acquire any property rights to an Internet address. The regulation of domain names in the United States and in other countries is also subject to change. Regulatory bodies could establish additional top-level domains, appoint additional domain name registrars or modify the requirements for holding domain names. As a result, we might not be able to maintain our domain names or obtain comparable domain names, which could harm our business.
SEASONALITY
Our business has certain historical seasonal factors. Historically, our fiscal third and fourth quarters have been stronger than our fiscal first and second quarters due to the operating cycles of our industrial sector customers.
FISCAL YEAR
We operate on a 52/53 week fiscal year, ending the last Saturday in March. In a 52-week fiscal year, each of the four quarters is a 13-week period. In a 53-week fiscal year, the last quarter is a 14-week period. Fiscal year 2018 consisted of 53 weeks while fiscal year 2017 consisted of 52 weeks. Fiscal year 2019 will have 52 weeks.
ENVIRONMENTAL MATTERS
We believe that we are in compliance with federal, state, and local provisions relating to the protection of the environment, and that continued compliance will not have any material effect on our capital expenditures, earnings, or competitive position.
EMPLOYEES
At the end of fiscal year 2018, we had 606 employees, including 35 part-time employees, compared with 585 employees, including 27 part-time employees, at the end of fiscal year 2017.
10
MANAGEMENT TEAM
The following table presents certain information regarding our management team, including our executive officers and certain key employees as of March 31, 2018:
| Name | Age | Position | ||
| Lee D. Rudow | 53 | President and Chief Executive Officer | ||
| Michael J. Tschiderer | 58 | Vice President of Finance and Chief Financial Officer | ||
| Robert A. Flack | 48 | Vice President of Service Sales and Operations | ||
| Jennifer J. Nelson | 47 | Vice President of Human Resources | ||
| Michael W. West | 47 | Vice President of Inside Sales and Marketing | ||
| Benjamin P. Hawley | 61 | Vice President of Operational Excellence | ||
| Scott D. Deverell | 52 | Corporate Controller and Principal Accounting Officer |
AVAILABLE INFORMATION
We are subject to the informational requirements of the Securities Exchange Act of 1934, as amended, and, therefore, we file periodic reports, proxy statements and other information with the United States Securities and Exchange Commission (“SEC”). Such reports may be read and copied at the Public Reference Room of the SEC at 100 F Street NE, Washington, D.C. 20549. Information on the operation of the Public Reference Room may be obtained by calling the SEC at (800) SEC-0330. Additionally, the SEC maintains a website (sec.gov) that contains reports, proxy statements and other information for registrants that file electronically.
We maintain a website at transcat.com. We make available, free of charge, in the Investor Relations section of our website, documents we file with or furnish to the SEC, including our Annual Reports on Form 10-K, Quarterly Reports on Form 10-Q, Current Reports on Form 8-K and any amendments to those reports. We make this information available as soon as reasonably practicable after we electronically file such materials with, or furnish such information to, the SEC. The other information found on our website is not part of this or any other report we file with, or furnish to, the SEC.
We also post on our website our board of directors’ committee charters (audit committee, compensation committee and corporate governance and nominating committee) and Code of Ethics. Copies of such documents are available in print at no charge to any shareholder who makes a request. Such requests should be made to our corporate secretary at our corporate headquarters, 35 Vantage Point Drive, Rochester, New York 14624.
11
You should consider carefully the following risks and all other information included in this report. The risks and uncertainties described below and elsewhere in this report are not the only ones facing our business. If any of the following risks were to actually occur, our business, financial condition or results of operations would likely suffer. In that case, the trading price of our common stock could fall and you could lose all or part of your investment.
We depend on manufacturers to supply inventory to our Distribution segment and rely on one vendor to supply a significant amount of our inventory purchases. If our vendor fails to provide desired products to us, increases prices, or fails to timely deliver products, our revenue and gross profit could suffer. A significant amount of our inventory purchases are made from one vendor, Fluke. Our reliance on this vendor leaves us vulnerable to having an inadequate supply of required products, price increases, late deliveries, and poor product quality. Like other distributors in our industry, we occasionally experience supplier shortages and are unable to purchase our desired volume of products. If we are unable to enter into and maintain satisfactory distribution arrangements with leading manufacturers, if we are unable to maintain an adequate supply of products, or if manufacturers do not regularly invest in, introduce to us, and/or make new products available to us for distribution, our Distribution segment sales could suffer considerably. Finally, we cannot provide any assurance that particular products, or product lines, will be available to us, or available in quantities sufficient to meet customer demand. This is of particular significance to our Distribution segment business because the products we sell are often only available from one source. Any limits to product access could materially and adversely affect our Distribution segment business.
Volatility in the oil and gas industry has, in the past, had and could continue to have a negative impact on our operating results. A portion of our products and services customer base is directly or indirectly related to the oil and gas industry. As a result, demand for some of our products is dependent on the level of expenditures by the oil and gas industry. In addition to the more significant impact on our Distribution segment, an extended downturn in the oil and gas industry or continued volatility in oil and gas prices could impact customers’ demand for some of our services (generally excluding life sciences, our largest industry customer sector), which could have a material adverse effect on our financial condition, results of operations and cash flows.
Our future success may be affected by our current and future indebtedness. Under our credit agreement, as of March 31, 2018, we owed $22.9 million to our secured creditor, a commercial bank, including $14.1 million we borrowed on October 30, 2017 via a $15.0 million term loan to fund acquisitions and provide us additional working capital. We may borrow additional funds in the future to support our growth and working capital needs. We are required to meet financial tests on a quarterly basis and comply with other covenants customary in secured financings. Although we believe that we will continue to comply with such covenants, if we do not remain in compliance with such covenants, our lender may demand immediate repayment of amounts outstanding. Changes in interest rates may have a significant effect on our payment obligations and operating results. Furthermore, we are dependent on credit from manufacturers of our products to fund our inventory purchases. If our debt burden increases to high levels, such manufacturers may restrict our credit. Our cash requirements will depend on numerous factors, including the rate of growth of our revenues, the timing and levels of products purchased, payment terms, and credit limits from manufacturers, the timing and level of our accounts receivable collections and our ability to manage our business profitably. Our ability to satisfy our existing obligations, whether or not under our secured credit facility, will depend upon our future operating performance, which may be impacted by prevailing economic conditions and financial, business, and other factors described in this report, many of which are beyond our control.
The relatively low trading volume of our common stock may limit your ability to sell your shares. Although our shares of common stock are listed on The NASDAQ Global Market, we have historically experienced a relatively low trading volume of approximately 10,000 shares a day. If our low trading volume continues in the future, holders of our shares may have difficulty selling shares of our common stock in the manner or at a price that they desire.
If significant existing shareholders sell large numbers of shares of our common stock, our stock price could decline. The market price of our common stock could decline if a large number of our shares are sold in the public market by our existing shareholders or as a result of the perception that such sales could occur. Due to the relatively low trading volume of our common stock, the sale of a large number of shares of our common stock may significantly depress the price of our common stock.
We expect that our quarterly results of operations will fluctuate. Such fluctuation could cause our stock price to decline. A large portion of our expenses for our Service segment, including expenses for facilities, equipment and personnel are relatively fixed. Accordingly, if revenues decline or do not grow as we anticipate, we may not be able to correspondingly reduce our operating expenses in any particular quarter. Our quarterly revenues and operating results have fluctuated in the past and are likely to do so in the future. Historically, our fiscal third and fourth quarters have been stronger than our fiscal first and second quarters due to industrial operating cycles. Fluctuations in industrial demand for products we sell and services we provide could cause our revenues and operating results to fluctuate. If our operating results in some quarters fail to meet the expectations of stock market analysts and investors, our stock price may decline.
12
Our stock price may be volatile. The stock market, from time to time, has experienced significant price and volume fluctuations that are both related and unrelated to the operating performance of companies. Our stock may be affected by market volatility and by our own performance. The following factors, among others, may have a significant effect on the market price of our common stock:
| ● |
Developments in our relationships with current or future manufacturers of products we distribute; |
| ● |
Announcements by us or our competitors of significant acquisitions, strategic partnerships, joint ventures or capital commitments; |
| ● |
Litigation or governmental proceedings or announcements involving us or our industry; |
| ● |
Economic and other external factors, such as disasters or other crises; |
| ● |
Sales of our common stock or other securities in the open market; |
| ● |
Repurchases of our common stock on the open market or in privately-negotiated transactions; |
| ● |
Period-to-period fluctuations in our operating results; and |
| ● |
Our ability to satisfy our debt obligations. |
Our business acquisitions or future business acquisition efforts, which are important to our growth, may not be successful, which may limit our growth or adversely affect our results of operations and financial condition. Business acquisitions have been an important part of our growth to date. As part of our business strategy, we may make additional acquisitions of companies that could complement or expand our business, augment our market coverage, provide us with important relationships or otherwise offer us growth opportunities. If we identify an appropriate acquisition candidate, we may not be able to successfully negotiate terms or finance the acquisition. If we fail to successfully acquire businesses, our growth and results of operations could be adversely affected.
We may not successfully integrate business acquisitions. We completed one acquisition during fiscal year 2017. If we fail to accurately assess and successfully integrate any recent or future business acquisitions, we may not achieve the anticipated benefits, which could result in lower revenues, unanticipated operating expenses, reduced profitability and dilution of our book value per share. Successful integration involves many challenges, including:
| ● |
The difficulty of integrating acquired operations and personnel with our existing operations; |
| ● |
The difficulty of developing and marketing new products and services; |
| ● |
The diversion of our management’s attention as a result of evaluating, negotiating and integrating acquisitions; |
| ● |
Our exposure to unforeseen liabilities of acquired companies; and |
| ● |
The loss of key employees of an acquired operation. |
In addition, an acquisition could adversely impact cash flows and/or operating results, and dilute shareholder interests, for many reasons, including:
| ● |
Charges to our income to reflect the impairment of acquired intangible assets, including goodwill; |
| ● |
Interest costs and debt service requirements for any debt incurred in connection with an acquisition or new business venture; and |
| ● |
Any issuance of securities in connection with an acquisition or new business venture that dilutes or lessens the rights of our current shareholders. |
If the integration of any or all of our acquisitions or future acquisitions is not successful, it could have a material adverse impact on our operating results and stock price.
Any impairment of goodwill or intangible assets could negatively impact our results of operations. Our goodwill and intangible assets are subject to an impairment test on an annual basis and are also tested whenever events and circumstances indicate that goodwill and/or intangible assets may be impaired. Any excess goodwill and/or indefinite-lived intangible assets value resulting from the impairment test must be written off in the period of determination. Intangible assets (other than goodwill and indefinite-lived intangible assets) are generally amortized over the useful life of such assets. In addition, from time to time, we may acquire or make an investment in a business that will require us to record goodwill based on the purchase price and the value of the acquired tangible and intangible assets. We may subsequently experience unforeseen issues with the businesses we acquire, which may adversely affect the anticipated returns of the business or value of the intangible assets and trigger an evaluation of the recoverability of the recorded goodwill and intangible assets for such business. Future determinations of significant write-offs of goodwill or intangible assets because of an impairment test or any accelerated amortization of other intangible assets could have a material negative impact on our results of operations and financial condition. We have completed our annual impairment analysis for goodwill and indefinite-lived intangible assets, in accordance with the applicable accounting guidance, and have concluded that we do not have any impairment of goodwill or intangible assets as of March 31, 2018.
The financing of any future acquisitions we might make may result in shareholder dilution and/or could increase our leverage and our risk of defaulting on our bank debt. Our business strategy includes expansion into new markets and enhancement of our position in existing markets, including via acquisitions. In order to successfully complete targeted acquisitions, we may issue additional equity securities that could dilute your stock ownership. We may also incur additional debt if we acquire another company, which could increase our leverage and our risk of default under our existing credit facility.
13
Adverse changes in general economic conditions or uncertainty about future economic conditions could adversely affect us. We are subject to the risks arising from adverse changes in general economic market conditions. Uncertainty about future economic conditions could negatively affect our current and prospective customers causing them to delay the purchase of necessary services or test and measurement instruments. Poor economic conditions could harm our business, financial condition, operating results and cash flow.
The U.S. Congress and Trump administration may make substantial changes to fiscal, tax, regulation and other federal policies that may adversely affect our business. In 2017, U.S. Congress and the Trump administration made substantial changes to U.S. fiscal and tax policies, which included comprehensive corporate and individual tax reform. These changes, in the aggregate, were favorable for the Company. In addition, the Trump administration has called for significant changes to U.S. trade, healthcare, immigration, foreign, and government regulatory policy. To the extent the U.S. Congress or Trump administration implements changes to U.S. policy, those changes may impact, among other things, the U.S. and global economy, international trade and relations, unemployment, immigration, corporate taxes, healthcare, the U.S. regulatory environment, inflation and other areas. Although we cannot predict the impact, if any, of these changes to our business, they could adversely affect our business. Until we know what policy changes are made and how those changes impact our business and the business of our competitors over the long term, we will not know if, overall, we will benefit from them or be negatively affected by them.
Tax legislation initiatives could adversely affect our net earnings and tax liabilities. We are subject to the tax laws and regulations of the United States federal, state and local governments, as well as foreign jurisdictions. From time to time, various legislative initiatives may be enacted that could adversely affect our tax positions. Tax laws and regulations are extremely complex and subject to varying interpretations. On December 22, 2017, President Trump enacted tax legislation commonly referred to as the Tax Cuts and Jobs Act (the “Tax Act”). The Tax Act makes broad and complex changes to the U.S. tax code, including, but not limited to reducing the Federal corporate income tax rate from 35% to 21%. Notwithstanding the positive impacts of the Tax Act, guidance is still forthcoming, and no assurance can be made that future guidance will not adversely affect our business, financial condition, or operating results. Although we believe that our tax positions are sound and consistent with applicable laws, regulations and existing precedent, there can be no assurance that our tax positions will not be challenged by relevant tax authorities or that we would be successful in any such challenge.
The industries in which we compete are highly competitive, and we may not be able to compete successfully. Within our Service segment, we provide calibration services and compete in an industry that is highly fragmented and is composed of companies ranging from internationally recognized and accredited corporations to non-accredited sole proprietors, resulting in a tremendous range of service levels and capabilities. Also, within our Service segment, we provide compliance services and compete in an industry that is composed of both small local and regional service providers and large multi-national companies who are also OEMs. Within our Service segment, some of our larger competitors may have broader service capabilities and may have greater name recognition than us. Some manufacturers of the products we sell may also offer calibration and compliance services for their products.
Within our Distribution segment, we compete with numerous companies, including several major manufacturers and distributors. Most of our products are available from several sources and our customers tend to have relationships with several distributors. Competitors in the product distribution industry could also obtain exclusive rights to market particular products, which we would then be unable to market. Manufacturers could also increase their efforts to sell directly to end-users and bypass distributors like us. Industry consolidation among distributors, the unavailability of products, whether due to our inability to gain access to products or interruptions in supply from manufacturers, or the emergence of new competitors could also increase competition and adversely affect our business or results of operations.
In each of the industries in which we compete, some of our competitors have greater financial and other resources than we do, which could allow them to compete more successfully. In the future, we may be unable to compete successfully and competitive pressures may reduce our sales.
Our Service segment has a concentration of customers in the life science and other FDA-regulated and industrial manufacturing industries. A number of our Service segment customers operate in the pharmaceutical and other FDA-regulated or industrial manufacturing industries. This concentration of our customer base affects our overall risk profile, since a significant portion of our customers would be similarly affected by changes in economic, political, regulatory, and other industry conditions. We anticipate that our Service segment will continue to grow and comprise a greater percentage of our total revenue, which could increase our exposure to fluctuations in the life science and other FDA-regulated or industrial manufacturing industries. An abrupt or unforeseen change in conditions in these industries could adversely affect customer demand for our services, which could have a material adverse effect on our financial results.
14
Competition in our Distribution segment is changing with an increase in web-based distributors. We may not be able to compete successfully. We face substantial and increased competition throughout the world, especially in our Distribution segment. The competition is changing, with web-based distributors becoming more prevalent and increasing their market share. Some of our competitors are much larger than us. Changes in the competitive landscape pose new challenges that could adversely affect our ability to compete. Entry or expansion of other vendors into this market may establish competitors that have larger customer bases and substantially greater financial and other resources with which to pursue marketing and distribution of products. Their current customer base and relationships, as well as their relationships and ability to negotiate with manufacturers, may also provide them with a competitive advantage. If we are unable to effectively compete with our current and future competitors, our ability to sell products could be harmed and could result in a negative impact on our Distribution segment. Any erosion of our competitive position could have a material adverse effect on our business, results of operations, and financial condition.
Cybersecurity incidents could adversely affect our business by causing a disruption to our operations, a compromise or corruption of our confidential information and/or damage to our business relationships, all of which could negatively impact our business, results of operations or financial condition. We rely extensively on information technology (“IT”) systems for orders and the storage, processing and transmission of our electronic, business-related, information assets used in or necessary to conduct business. The data we store and process may include customer payment information, personal information concerning our employees, confidential financial information and other types of sensitive business-related information. Numerous and evolving cybersecurity threats pose potential risks to the security of our IT systems, networks and services, as well as the confidentiality, availability and integrity of our data. Global cybersecurity threats can range from uncoordinated individual attempts to gain unauthorized access to our IT systems to sophisticated and targeted measures known as advanced persistent threats. The techniques used in these attacks change frequently and may be difficult to detect for periods of time and we may face difficulties in anticipating and implementing adequate preventative measures. While we employ comprehensive measures to prevent, detect, address and mitigate these threats (including access controls, data encryption, vulnerability assessments, management training, continuous monitoring of our IT networks and systems and maintenance of backup and protective systems), cybersecurity incidents, depending on their nature and scope, could potentially result in the misappropriation, destruction, corruption or unavailability of critical data or proprietary information and the disruption of business operations. The potential consequences of a material cybersecurity incident include reputational damage, compromised employee, customer, or third-party information, litigation with third parties, regulatory actions, and increased cybersecurity protection and remediation costs, which in turn could adversely affect our business and results of operations. In addition, the laws and regulations governing security of data on IT systems and otherwise held by companies is evolving and adding layers of complexity in the form of new requirements and increasing costs of attempting to protect IT systems and data and complying with new cybersecurity regulations.
Our enterprise resource planning system is aging and we may experience issues from any implementation of a new enterprise resource planning system. We have an enterprise resource planning system (“ERP” or “Application Plus”) to assist with the collection, storage, management and interpretation of data from our business activities to support future growth and to integrate significant processes. Although we use current versions of software and have support agreements in place, due to the age of our ERP, we anticipate that a new ERP will be required to be implemented in the future. ERP implementations are complex and time-consuming and involve substantial expenditures on system software and implementation activities, as well as changes in business processes. Our ERP system is critical to our ability to accurately maintain books and records, record transactions, provide important information to our management and prepare our consolidated financial statements. ERP implementations also require the transformation of business and financial processes in order to reap the benefits of the ERP system; any such transformation involves risks inherent in the conversion to a new computer system, including loss of information and potential disruption to our normal operations. Any disruptions, delays or deficiencies in the design and implementation of a new ERP system could adversely affect our ability to process orders, provide services and customer support, send invoices and track payments, fulfill contractual obligations or otherwise operate our business. Additionally, if the ERP system does not operate as intended, the effectiveness of our internal control over financial reporting could be adversely affected or our ability to assess it adequately could be delayed.
We rely on our CalTrak®, Application Plus (our ERP) and other management information systems for inventory management, distribution, workflow, accounting and other functions. If our CalTrak®, Application Plus or other management information systems fail to adequately perform these functions, experience an interruption in their operation or a security breach, our business and results of operations could be adversely affected. The efficient operation of our business depends on our management information systems. We rely on our CalTrak®, Application Plus and other management information systems to effectively manage accounting and financial functions, customer service, warehouse management, order entry, order fulfillment, inventory replenishment, documentation, asset management, and workflow. Our management information systems are vulnerable to damage or interruption from computer viruses or hackers, natural or man-made disasters, vandalism, terrorist attacks, power loss, or other computer systems, internet, telecommunications or data network failures. Any such interruptions to our management information systems could disrupt our business and could result in decreased revenues, increased overhead costs, excess inventory and product shortages, causing our business and results of operations to suffer. In addition, our management information systems are vulnerable to security breaches. Our security measures or those of our third-party service providers may fail to detect or prevent such security breaches. Security breaches could result in the unauthorized publication of our confidential business or proprietary information, the unauthorized release of customer, vendor, or employee data and payment information, the violation of privacy or other laws, and the exposure to litigation, any of which could harm our business and results of operations.
15
If we fail to adapt our technology to meet customer needs and preferences, the demand for our products and services may diminish. Our future success will depend on our ability to develop services and solutions that keep pace with technological change, evolving industry standards and changing customer preferences in the markets we serve. We cannot be sure that we will be successful in adapting existing or developing new technology or services in a timely or cost-effective manner or that the solutions we do develop will be successful in the marketplace. Our failure to keep pace with changes in technology, industry standards and customer preferences in the markets we serve could diminish our ability to retain and attract customers and our competitive position, which could adversely impact our business and results of operations.
We face risks associated with foreign currency rate fluctuations. We currently transact a portion of our business in foreign currencies, namely the Canadian dollar. During fiscal years 2018 and 2017, less than 10% of our total revenues were denominated in Canadian dollars. Conducting business in currencies other than U.S. dollars subjects us to fluctuations in currency exchange rates that could have a negative impact on our reported operating results. Fluctuations in the value of the U.S. dollar relative to the Canadian dollar impacts our revenues, cost of revenues and operating margins and result in foreign currency transaction gains and losses. During fiscal years 2018 and 2017, the value of the U.S. dollar relative to one Canadian dollar ranged from 1.21 to 1.37 and from 1.25 to 1.36, respectively.
We continually utilize short-term foreign exchange forward contracts to reduce the risk that our earnings would be adversely affected by changes in currency exchange rates. However, this strategy does not eliminate our exposure. If there is a significant or prolonged downturn in the Canadian dollar, it could have an adverse impact on our business and financial condition.
If we fail to attract qualified personnel, we may not be able to achieve our stated corporate objectives. Our ability to manage our anticipated growth, if realized, effectively depends on our ability to attract and retain highly qualified executive officers and technical personnel. If we fail to attract and retain qualified individuals, we will not be able to achieve our stated corporate objectives.
Our revenue depends on retaining capable sales personnel and highly skilled service technicians as well as maintaining existing relationships with key customers, key vendors and manufacturers of the products that we distribute. Our future operating results depend on our ability to maintain satisfactory relationships with qualified sales personnel and skilled service technicians as well as key customers, vendors and manufacturers who appreciate the value of our services. Qualified sales personnel and skilled service technicians are in high demand and are subject to competing offers. We believe there is, and will continue to be, competition for qualified personnel in our industry, and there is no assurance that we will be able to attract or retain the personnel necessary for the development of our business. If we fail to maintain our existing relationships with such personnel, customers, vendors and manufacturers or fail to acquire relationships with such key persons in the future, our business and results of operations may be adversely affected.
Our future success is substantially dependent upon our senior management. Our future success is substantially dependent upon the efforts and abilities of members of our existing senior management. Competition for senior management is intense, and we may not be successful in attracting and retaining key personnel, the inability of which could have an adverse effect on our business and results of operations.
Changes in accounting standards, legal requirements and the NASDAQ Global Market listing standards, or our ability to comply with any existing requirements or standards, could adversely affect our operating results. Extensive reforms relating to public company financial reporting, corporate governance and ethics, The NASDAQ Global Market listing standards and oversight of the accounting profession have been implemented over the past several years and continue to evolve. Compliance with these rules, regulations and standards that have resulted from such reforms has increased our accounting and legal costs and has required significant management time and attention. In the event that additional rules, regulations or standards are implemented or any of the existing rules, regulations or standards to which we are subject undergoes additional material modification, we could be forced to spend significant financial and management resources to ensure our continued compliance, which could have an adverse effect on our results of operations. In addition, although we believe we are in full compliance with all such existing rules, regulations and standards, should we be or become unable to comply with any of such rules, regulations and standards, as they presently exist or as they may exist in the future, our results of operations could be adversely affected and the market price of our common stock could decline.
16
Our inability to adequately enforce and protect our intellectual property or defend against assertions of infringement could prevent or restrict our ability to compete.
We rely on intellectual property in order to maintain a competitive advantage. Our inability to defend against the unauthorized use of these assets could have an adverse effect on our results of operations and financial condition. Litigation may be necessary to protect our intellectual property rights or defend against claims of infringement. This litigation could result in significant costs and divert our management’s focus away from operations.
ITEM 1B. UNRESOLVED STAFF COMMENTS
None.
The following table presents our leased and owned properties as of March 31, 2018:
| Approximate Square | ||||
| Property | Location | Footage | ||
| Corporate Headquarters, Calibration Service Center and Distribution Center | Rochester, NY | 37,300 | ||
| Calibration Service Center | Los Angeles, CA | 12,000 | ||
| Calibration Service Center | Boston, MA | 4,000 | ||
| Calibration Service Center | Toronto, ON | 14,200 | ||
| Calibration Service Center | Charlotte, NC | 4,900 | ||
| Calibration Service Center | Cherry Hill, NJ | 10,800 | ||
| Calibration Service Center | Dayton, OH | 10,500 | ||
| Calibration Service Center | Denver, CO | 19,400 | ||
| Calibration Service Center | Houston, TX | 10,300 | ||
| Calibration Service Center and Used Equipment Distribution Center | Irvine, CA | 11,100 | ||
| Calibration Service Center and Headquarters for Canadian Operations | Montreal, QC | 27,500 | ||
| Calibration Service Center | Nashville, TN | 6,000 | ||
| Calibration Service Center | Ottawa, ON | 4,000 | ||
| Calibration Service Center | Phoenix, AZ | 4,200 | ||
| Calibration Service Center and Distribution Center | Portland, OR | 12,600 | ||
| Calibration Service Center | San Juan, PR | 1,600 | ||
| Calibration Service Center | St. Louis, MO | 4,400 | ||
| United Scale & Engineering: | ||||
| Calibration Service Center | Green Bay, WI | 3,300 | ||
| Calibration Service Center and Warehouse | Madison, WI | 6,000 | ||
| Calibration Service Center and Warehouse | Milwaukee WI | 16,000 | ||
| Calibration Service Center | Ft. Wayne, IN | 3,600 | ||
| Calibration Service Center | San Diego, CA | 5,500 | ||
| Spectrum Technologies Inc. (“STI”): | ||||
| Unaccredited Service Center and Warehouse | Paxinos, PA | 14,500 | ||
| STI Satellite Service Office | Bakersfield, CA | 1,200 | ||
| STI Satellite Service Office | Toronto, ON | 900 | ||
| STI Satellite Service Office | Birmingham, AL | 500 | ||
| STI Satellite Service Office | Melrose, FL | 200 | ||
| STI Satellite Service Office | Mt. Airy, NC | 200 | ||
| STI Satellite Service Office | LaCrosse, WI | 300 | ||
| STI Satellite Service Office | Omaha, NE | 800 | ||
| Mobile Service Unit and Offices | Pittsburgh, PA | 6,300 | ||
| Warehouse (1) | Lincoln, MT | 5,400 |
| (1) |
|
Property owned by the Company |
We believe that our properties are in good condition, are well maintained and are generally suitable and adequate to carry on our business in its current form.
17
None.
ITEM 4. MINE SAFETY DISCLOSURES
Not applicable.
PART II
ITEM 5. MARKET FOR REGISTRANT’S COMMON EQUITY, RELATED STOCKHOLDER MATTERS AND ISSUER PURCHASES OF EQUITY SECURITIES
Our common stock is traded on The NASDAQ Global Market under the symbol “TRNS”. As of June 6, 2018, we had approximately 440 shareholders of record.
PRICE RANGE OF COMMON STOCK
The following table presents, on a per share basis, for the periods indicated, the high and low reported sales prices of our common stock as reported on The NASDAQ Global Market for each quarterly period in fiscal years 2018 and 2017:
| First | Second | Third | Fourth | |||||||||
| Quarter | Quarter | Quarter | Quarter | |||||||||
| Fiscal Year 2018: | ||||||||||||
| High | $ | 12.85 | $ | 13.85 | $ | 15.15 | $ | 16.49 | ||||
| Low | $ | 11.60 | $ | 11.95 | $ | 12.00 | $ | 13.05 | ||||
| Fiscal Year 2017: | ||||||||||||
| High | $ | 11.85 | $ | 11.05 | $ | 11.00 | $ | 14.05 | ||||
| Low | $ | 9.38 | $ | 8.26 | $ | 10.00 | $ | 10.30 | ||||
DIVIDENDS
Our credit agreement, as amended, limits our ability to pay cash dividends to $3.0 million in any fiscal year. We have not declared any cash dividends since our inception and have no current plans to pay any dividends in the foreseeable future.
ISSUER PURCHASES OF EQUITY SECURITIES
| (a) | (b) | (c) | (d) | ||||||||
| Total Number of | Maximum Number (or | ||||||||||
| Total | Weighted | Shares Purchased as | Approximate Dollar Value) | ||||||||
| Number of | Average | Part of Publicly | of Shares that May Yet Be | ||||||||
| Shares | Price Paid | Announced Plans or | Purchased Under the Plans | ||||||||
| Period | Purchased | per Share | Programs (1) | or Programs (1) | |||||||
| 12/24/2017-1/23/2018 | 1,180 | (2) | $ | 14.25 | (2) | - | - | ||||
| 1/24/2018-2/23/2018 | - | - | - | - | |||||||
| 2/24/2018-3/31/2018 | - | - | - | - | |||||||
| Total | 1,180 | $ | 14.25 | - | - | ||||||
| (1) |
We have a Share Repurchase Plan (the “Plan”), announced on October 31, 2011, which allows us to repurchase shares of our common stock from certain of our executive officers, directors and key employees, subject to certain conditions and limitations. The purchase price is determined by the weighted average closing price per share of our common stock on The NASDAQ Global Market over the twenty (20) trading days following our acceptance of the repurchase request and may not be more than 15% higher than the closing price on the last day of the twenty (20) trading day period. We may purchase shares of our common stock pursuant to the Plan on a continuous basis, but we may not expend more than $1.0 million in any fiscal year to repurchase the shares. Our board of directors may terminate the Plan at any time. No shares were repurchased under the Plan during fiscal year 2018. |
| (2) | Shares repurchased from a former employee of the Company in accordance with the Transcat, Inc. 2003 Incentive Plan, as Amended and Restated, and in connection with the exercise of options in which the exercise price was paid through the tender of common stock that the employee otherwise owned. |
18
ITEM 6. SELECTED FINANCIAL DATA
The following table provides selected financial data for fiscal year 2018 and the previous four fiscal years (in thousands, except per share data). Certain reclassifications of financial information for prior fiscal years have been made to conform to the presentation for the current fiscal year.
| For the Fiscal Years Ended | |||||||||||||||
| March 31, | March 25, | March 26, | March 28, | March 29, | |||||||||||
| 2018 | 2017 | 2016 | 2015 | 2014 | |||||||||||
| Statements of Income Data: | |||||||||||||||
| Total Revenue | $ | 155,141 | $ | 143,898 | $ | 122,166 | $ | 123,624 | $ | 118,508 | |||||
| Total Cost of Revenue | 117,700 | 108,928 | 93,047 | 94,537 | 88,718 | ||||||||||
| Gross Profit | 37,441 | 34,970 | 29,119 | 29,087 | 29,790 | ||||||||||
| Operating Expenses | 28,415 | 27,036 | 22,817 | 22,319 | 23,085 | ||||||||||
| Operating Income | 9,026 | 7,934 | 6,302 | 6,768 | 6,705 | ||||||||||
| Interest and Other Expense, net | 1,078 | 770 | 295 | 345 | 259 | ||||||||||
| Income Before Income Taxes | 7,948 | 7,164 | 6,007 | 6,423 | 6,446 | ||||||||||
| Provision for Income Taxes | 2,026 | 2,642 | 1,883 | 2,397 | 2,462 | ||||||||||
| Net Income | $ | 5,922 | $ | 4,522 | $ | 4,124 | $ | 4,026 | $ | 3,984 | |||||
| Share Data: | |||||||||||||||
| Basic Earnings Per Share | $ | 0.83 | $ | 0.65 | $ | 0.60 | $ | 0.59 | $ | 0.56 | |||||
| Basic Average Shares Outstanding | 7,124 | 6,994 | 6,887 | 6,798 | 7,080 | ||||||||||
| Diluted Earnings Per Share | $ | 0.81 | $ | 0.64 | $ | 0.58 | $ | 0.57 | $ | 0.54 | |||||
| Diluted Average Shares Outstanding | 7,303 | 7,111 | 7,121 | 7,059 | 7,357 | ||||||||||
| Closing Price Per Share | $ | 15.65 | $ | 12.52 | $ | 10.14 | $ | 9.59 | $ | 9.28 | |||||
| As of or for the Fiscal Years Ended | |||||||||||||||
| March 31, | March 25, | March 26, | March 28, | March 29, | |||||||||||
| 2018 | 2017 | 2016 | 2015 | 2014 | |||||||||||
| Balance Sheets and Working Capital Data: | |||||||||||||||
| Inventory, net | $ | 12,651 | $ | 10,278 | $ | 6,520 | $ | 6,750 | $ | 6,181 | |||||
| Property and Equipment, net | 17,091 | 15,568 | 12,313 | 9,397 | 7,089 | ||||||||||
| Goodwill and Intangible Assets, net | 38,245 | 40,039 | 37,323 | 24,477 | 20,035 | ||||||||||
| Total Assets | 96,822 | 92,097 | 76,707 | 62,149 | 53,874 | ||||||||||
| Depreciation and Amortization | 5,991 | 6,184 | 3,946 | 3,090 | 2,945 | ||||||||||
| Capital Expenditures | 5,882 | 5,250 | 4,101 | 3,500 | 1,961 | ||||||||||
| Debt | 22,850 | 27,312 | 19,073 | 12,168 | 7,593 | ||||||||||
| Shareholders' Equity | 51,348 | 43,401 | 38,911 | 34,318 | 30,083 | ||||||||||
ITEM 7. MANAGEMENT’S DISCUSSION AND ANALYSIS OF FINANCIAL CONDITION AND RESULTS OF OPERATIONS
OVERVIEW
Operational Overview. We are a leading provider of accredited calibration, repair, inspection and laboratory instrument services and a value-added distributor of professional grade handheld test, measurement and control instrumentation.
19
We operate our business through two reportable business segments, Service and Distribution, which offer a comprehensive range of services and products to the same customer base.
Our strength in our Service segment is based upon our wide range of disciplines, our investment in quality systems and our ability to provide accredited calibrations to customers in highly-regulated targeted market segments. Our services range from the calibration and repair of a single unit to managing a customer’s entire calibration program. We believe our Service segment offers an opportunity for long-term growth and the potential for continuing revenue from established customers with regular calibration cycles and recurring laboratory instrument service requirements.
Our Service segment has shown consistent revenue growth over the past several years, ending fiscal year 2018 with its 36th consecutive quarter of year-over-year growth. This segment has benefited from both organic growth as well as the addition of acquired customers over those 36 quarters. In addition to acquiring customer bases, the business acquisitions that we made have been heavily focused on expanding our service capabilities, increasing our geographic reach and leveraging our Calibration Service Centers and other infrastructure to create operational synergies. Our organic Service revenue growth was 8.9% for fiscal year 2018 compared to fiscal year 2017. However, the Service segment gross margin declined by 110 basis points. This year-over-year decline was primarily due to Service segment technician productivity challenges earlier in fiscal year 2018. Our Service segment ended fiscal year 2018 with a strong new business pipeline and a substantial backlog of work-in-process, supporting the anticipated continued trend of revenue growth in this segment.
In our Distribution segment, we sell and offer for rent, professional grade handheld test and measurement instruments. Because we specialize in professional grade handheld test and measurement instruments, as opposed to a wide array of industrial products, our sales and customer service personnel can provide value-added technical assistance to our customers to aid them in determining what product best meets their particular application requirements. With the acquisition of Excalibur Engineering, Inc. (“Excalibur”) in April 2016, we now have expertise in the procurement and sale of used equipment, furthering our ability to add value for our customers. Excalibur also brought us a higher-end electronic test and measurement equipment rental business to augment our organically grown test and measurement equipment rental business. Through our website and sales teams, customers can place orders for test and measurement instruments and can elect to have their purchased instruments certified by our Calibration Service Centers before shipment as well as on regular post-purchase intervals. Pre-shipment certification allows our customers to place newly purchased instruments into service immediately upon receipt. This year-over-year increase in sales reflects higher demand from industrial customers, including those sold through our independent representative network and increased rental revenues.
Sales in our Distribution segment are generally not consumable items but are instruments purchased as replacements, upgrades or for expansion of manufacturing or research and development facilities. As such, this segment can be heavily impacted by changes in the economic environment. As customers increase or decrease capital and discretionary spending, our Distribution sales will typically be directly impacted. In fiscal year 2018, Distribution sales growth reflected higher demand from industrial customers, especially those sold through our independent sales representative network, increased rental business and web-based sales. In fiscal year 2017, our Distribution segment showed improved performance over the prior year as we implemented initiatives to expand and diversify our offerings in this segment. The initiatives implemented in fiscal year 2017 include adding new in-demand vendors and product lines, expanding the number of SKU’s that we offer with and without pre-shipment calibration and offering equipment rental and used equipment options. Management believes this diversification strategy will mitigate the impact that any particular industry or sector will have on the overall performance of this segment as well as help to further differentiate us from our competitors going forward.
Financial Overview. In evaluating our results for fiscal year 2018, investors should consider that Transcat operates on a 52/53 week fiscal year, ending the last Saturday in March. In a 52-week fiscal year, each of the four quarters is a 13-week period. In a 53-week fiscal year, the last quarter is a 14-week period. Fiscal year 2018 consisted of 53 weeks while fiscal year 2017 consisted of 52 weeks.
Total revenue for fiscal year 2018 was $155.1 million. This represented an increase of $11.2 million or 7.8% versus the total revenue of $143.9 million for fiscal year 2017. The growth achieved in both of our segments was all organic.
Service revenue increased 8.9% to $77.4 million in fiscal year 2018. Service revenue now accounts for 49.9% of our total revenue. Of our Service revenue in fiscal year 2018, 83.8% was generated by our Calibration Service Centers while 14.5% was generated through subcontracted third-party vendors, compared with 84.4% and 13.8%, respectively, in fiscal year 2017. The remainder of our Service revenue in each period was derived from freight charges.
Distribution sales increased 6.7% to $77.7 million in fiscal year 2018. Distribution sales account for 50.1% of our total revenue. Sales to domestic customers comprised 91.2% of total Distribution sales in fiscal year 2018, while 6.6% were to Canadian customers and 2.2% were to customers in other international markets.
20
Total gross profit increased $2.5 million or 7.1% during fiscal year 2018 versus fiscal year 2017. Total gross margin was 24.1%, a 20 basis point reduction compared with gross margin of 24.3% in fiscal year 2017. Service gross margin was 25.7% in fiscal year 2018 compared with 26.8% in fiscal year 2017. Distribution gross margin was 22.5% in fiscal year 2018 compared with 21.9% in fiscal year 2017.
Operating expenses were $28.4 million, or 18.3% of total revenue, in fiscal year 2018 compared with $27.0 million, or 18.8% of total revenue, in fiscal year 2017. Operating income was $9.0 million in fiscal year 2018 compared with $7.9 million in fiscal year 2017.
Net income for fiscal year 2018 was $5.9 million, a $1.4 million improvement over fiscal year 2017. Diluted earnings per share improved $0.17 in fiscal year 2018 compared with fiscal year 2017, to $0.81 per diluted share.
CRITICAL ACCOUNTING POLICIES AND ESTIMATES
Use of Estimates. The preparation of our Consolidated Financial Statements in accordance with accounting principles generally accepted in the United States (“U.S. GAAP”) requires that we make estimates and assumptions that affect the reported amounts of assets and liabilities, and the disclosure of contingent assets and liabilities at the date of the financial statements and the reported amounts of revenues and expenses during the reporting period. Significant estimates and assumptions are used for, but not limited to, allowance for doubtful accounts and returns, inventory reserves, estimated levels of achievement for performance-based restricted stock units, fair value of stock options, depreciable lives of fixed assets, estimated lives of major catalogs and intangible assets, and the valuation of assets acquired and liabilities assumed in business acquisitions. Future events and their effects cannot be predicted with certainty; accordingly, our accounting estimates require the exercise of judgment. The accounting estimates used in the preparation of our Consolidated Financial Statements will change as new events occur, as more experience is acquired, as additional information is obtained, and as our operating environment changes. Our estimates are evaluated on an ongoing basis and are drawn from historical experience and other assumptions that we believe to be reasonable under the circumstances. Actual results could differ from those estimates. Such changes and refinements in estimation methodologies are reflected in reported results of operations in the period in which the changes are made and, if material, their effects are disclosed in the Notes to our Consolidated Financial Statements.
The following items in our Consolidated Financial Statements require significant estimation or judgment.
Accounts Receivable. Accounts receivable represent amounts due from customers in the ordinary course of business. These amounts are recorded net of the allowance for doubtful accounts and returns in the Consolidated Balance Sheets. The allowance for doubtful accounts is based upon the expected collectability of accounts receivable. We apply a specific formula to our accounts receivable aging, which may be adjusted on a specific account basis where the formula may not appropriately reserve for loss exposure. After all attempts to collect a receivable have failed, the receivable is written-off against the allowance for doubtful accounts. The returns reserve is calculated based upon the historical rate of returns applied to revenues over a specific timeframe. The returns reserve will increase or decrease as a result of changes in the level of revenues and/or the historical rate of returns. Management believes that the allowances are appropriate to cover anticipated losses under current conditions. However, unexpected changes or deterioration in economic conditions could materially change these expectations.
Inventory. Inventory consists of products purchased for resale and is valued at the lower of cost or net realizable value. Costs are determined using the average cost method of inventory valuation. Inventory is reduced by a reserve for items not saleable at or above cost by applying a specific loss factor, based on historical experience, to specific categories of our inventory. Inventory is at risk of obsolescence if economic conditions change. Relevant economic conditions include changing consumer demand, customer preferences or increasing competition. We believe these risks are largely mitigated because our inventory typically turns several times per year. We evaluate the adequacy of the reserve on a quarterly basis.
Business Acquisitions. We apply the acquisition method of accounting for business acquisitions. Under the acquisition method, the underlying tangible and intangible assets acquired and liabilities assumed are recorded based on their respective assigned fair values at the date of acquisition. We use a valuation hierarchy to determine the fair values used. Purchase price allocations are subject to revision within the measurement period, not to exceed one year from the date of acquisition. Administration costs to acquire a business may include, but are not limited to, fees for accounting, legal and valuation services and are recorded as incurred in our Consolidated Statement of Income.
Goodwill and Intangible Assets. Goodwill represents the excess of the purchase price over the values assigned to the underlying net assets of an acquired business and is not amortized. As of March 31, 2018, we had $32.7 million of recorded goodwill.
21
Intangible assets, namely customer base and covenants not to compete, represent an allocation of purchase price to identifiable intangible assets of an acquired business. These intangible assets are amortized over their estimated useful lives. We estimate the fair value of our reporting units using the fair market value measurement requirement.
We test goodwill for impairment on an annual basis or immediately if conditions indicate that such impairment could exist. We have the option to perform a qualitative assessment to determine if it is more likely than not that the fair value of a segment has declined below its carrying value. This assessment considers various financial, macroeconomic, industry and segment specific qualitative factors.
Intangible assets are evaluated for impairment when events or changes in business circumstances indicate that the carrying amount of the assets may not be fully recoverable. Based on the results of our reviews, we have determined that no impairment was indicated as of March 31, 2018 and March 25, 2017.
Income Taxes. We base our deferred income taxes, accrued income taxes and provision for income taxes upon income, statutory tax rates, the legal structure of our Company, interpretation of tax laws and tax planning opportunities available to us in the various jurisdictions in which we operate. We file income tax returns in the U.S. federal jurisdiction, various states and Canada. We are regularly audited by federal, state and foreign tax authorities, but a number of years may elapse before an uncertain tax position, for which we have unrecognized tax benefits, is audited and finally resolved. From time to time, these audits result in assessments of additional tax. We maintain reserves for such assessments.
We apply a more-likely-than-not threshold to the recognition and derecognition of uncertain tax positions. Accordingly, we recognize the amount of tax benefit that has a greater than 50% likelihood of being ultimately realized upon settlement. Future changes in judgments and estimates related to the expected ultimate resolution of uncertain tax positions will affect income in the quarter of such change. While it is often difficult to predict the final outcome or the timing of resolution of any particular uncertain tax position, we believe that our unrecognized tax benefits reflect the most likely outcome.
Stock-Based Compensation. We measure the cost of services received in exchange for all equity awards granted, including stock options and restricted stock units, based on the fair market value of the award as of the grant date. We record compensation cost related to unvested equity awards by recognizing, on a straight-line basis, the unamortized grant date fair value over the remaining service period of each award. The Financial Accounting Standards Board (“FASB”) issued ASU 2016-09 to simplify certain aspects of the accounting for share-based payment transactions to employees. We elected to early adopt this ASU in the fourth quarter of fiscal year 2017. Upon adoption, excess tax benefits for share-based award activity are reflected in the statement of income as a component of the provision for income taxes. Excess tax benefits are realized benefits from tax deductions for exercised awards in excess of the deferred tax asset attributable to stock-based compensation costs for such awards. We did not capitalize any stock-based compensation costs as part of an asset. We estimate forfeiture rates based on our historical experience.
We grant performance-based restricted stock units as a primary component of executive compensation. The units generally vest following the third fiscal year from the date of grant and some of these grants are subject to certain cumulative diluted earnings per share growth targets over the eligible period. Compensation cost ultimately recognized for these performance-based restricted stock units will equal the grant-date fair market value of the unit that coincides with the actual outcome of the performance conditions. On an interim basis, we record compensation cost based on the expected level of achievement of the performance conditions.
Stock options vest either immediately or over a period of up to four years using a straight-line basis, and expire either five years or ten years from the date of grant. The expense relating to options is recognized on a straight-line basis over the requisite service period for the entire award.
See Note 6 to our Consolidated Financial Statements for further disclosure regarding our stock-based compensation.
Post-retirement Health Care Plans. The Company has a defined benefit post-retirement health care plan which provides long-term care insurance benefits, medical and dental insurance benefits and medical premium reimbursement benefits to eligible retired corporate officers and their eligible spouses.
For accounting purposes, the defined benefit post-retirement health care plan requires assumptions to estimate the projected and accumulated benefit obligations, including the following variables: discount rate; certain employee-related factors, such as retirement age and mortality; and health care cost trend rates. These and other assumptions affect the annual expense and obligations recognized for the underlying plans. Our assumptions reflect our historical experiences and management's best judgment regarding future expectations.
22
Increasing the assumed health care cost trend rate by one percentage point would increase the accumulated post-retirement benefit obligation and the annual net periodic post-retirement benefit cost by $0.1 million. A one percentage point decrease in the healthcare cost trend would decrease the accumulated post-retirement benefit obligation and the annual net periodic post-retirement benefit cost by $0.1 million.
Recently Issued Accounting Pronouncements. In the normal course of business, management evaluates all new accounting pronouncements issued by the FASB to determine the potential impact they may have on our consolidated financial statements. For a discussion of the newly issued accounting pronouncements see “Recently Issued Accounting Pronouncements” under Note 1 to the Consolidated Financial Statements included in Item 8 of Part II of this report.
RESULTS OF OPERATIONS
The following table sets forth, for fiscal years 2018 and 2017, the components of our Consolidated Statements of Income.
| FY 2018 | FY 2017 | |||||
| As a Percentage of Total Revenue: | ||||||
| Service Revenue | 49.9 | % | 49.4 | % | ||
| Distribution Sales | 50.1 | % | 50.6 | % | ||
| Total Revenue | 100.0 | % | 100.0 | % | ||
| Gross Profit Percentage: | ||||||
| Service Gross Profit | 25.7 | % | 26.8 | % | ||
| Distribution Gross Profit | 22.5 | % | 21.9 | % | ||
| Total Gross Profit | 24.1 | % | 24.3 | % | ||
| Selling, Marketing and Warehouse Expenses | 10.7 | % | 11.5 | % | ||
| General and Administrative Expenses | 7.6 | % | 7.3 | % | ||
| Total Operating Expenses | 18.3 | % | 18.8 | % | ||
| Operating Income | 5.8 | % | 5.5 | % | ||
| Interest and Other Expense, net | 0.7 | % | 0.5 | % | ||
| Income Before Income Taxes | 5.1 | % | 5.0 | % | ||
| Provision for Income Taxes | 1.3 | % | 1.9 | % | ||
| Net Income | 3.8 | % | 3.1 | % | ||
FISCAL YEAR ENDED MARCH 31, 2018 COMPARED TO FISCAL YEAR ENDED MARCH 25, 2017 (dollars in thousands):
Revenue:
| For the Years Ended | |||||||||||||
| March 31, | March 25, | Change | |||||||||||
| 2018 | 2017 | $ | % | ||||||||||
| Revenue: | |||||||||||||
| Service | $ | 77,445 | $ | 71,103 | $ | 6,342 | 8.9 | % | |||||
| Distribution | 77,696 | 72,795 | 4,901 | 6.7 | % | ||||||||
| Total | $ | 155,141 | $ | 143,898 | $ | 11,243 | 7.8 | % | |||||
Total revenue increased $11.2 million, or 7.8%, from fiscal year 2017 to fiscal year 2018.
Service revenue, which accounted for 49.9% and 49.4% of our total revenue in fiscal years 2018 and 2017, respectively, increased $6.3 million, or 8.9% from fiscal year 2017 to fiscal year 2018. This year-over-year increase was all organic as we took market share, particularly in the life science sector, and experienced growth in general industrial manufacturing sector which includes both the defense and aerospace markets and raised prices where appropriate. When normalizing for the extra days from fiscal year 2018’s 53 weeks, the Company estimates that its full year revenue growth was approximately 6%.
23
Our fiscal years 2018 and 2017 Service revenue growth in relation to prior fiscal year quarter comparisons, was as follows:
| FY 2018 | FY 2017 | ||||||||||||||||
| Q4 | Q3 | Q2 | Q1 | Q4 | Q3 | Q2 | Q1 | ||||||||||
| Service Revenue Growth | 12.4% | 7.5% | 7.6% | 7.6% | 11.2% | 25.4% | 19.4% | 26.9% | |||||||||
Within any year, while we add new customers, we also have customers from the prior year whose service orders may not repeat for any number of factors. Among those factors are variations in the timing of periodic calibrations and other services, customer capital expenditures and customer outsourcing decisions. Because the timing of Service segment orders can vary on a quarter-to-quarter basis, we believe a trailing twelve-month trend provides a better indication of the progress of this segment. The growth in fiscal year 2018 versus fiscal year 2017 was all organic growth, while the growth in fiscal year 2017 versus fiscal year 2016 reflected both organic growth and acquisitions. The following table presents the trailing twelve-month Service segment revenue for each quarter in fiscal years 2018 and 2017 as well as the trailing twelve-month revenue growth as a comparison to that of the prior fiscal year period:
| FY 2018 | FY 2017 | |||||||||||||||
| Q4 | Q3 | Q2 | Q1 | Q4 | Q3 | Q2 | Q1 | |||||||||
| Trailing Twelve-Month: | ||||||||||||||||
| Service Revenue | $77,445 | $75,016 | $73,702 | $72,410 | $71,103 | $69,132 | $65,599 | $62,842 | ||||||||
| Service Revenue Growth | 8.9% | 8.5% | 12.4% | 15.2% | 20.1% | 23.2% | 19.7% | 18.1% | ||||||||
Our strategy has been to focus our investments in the core electrical, temperature, pressure, physical/dimensional and radio frequency/microwave calibration disciplines. We expect to subcontract approximately 13% to 15% of our Service revenue to third-party vendors for calibration beyond our chosen scope of capabilities. We continually evaluate our outsourcing needs and make capital investments, as deemed necessary, to add more in-house capabilities and reduce the need for third-party vendors. Capability expansion through business acquisitions is another way that we seek to reduce the need for outsourcing. The following table presents the source of our Service revenue and the percentage of Service revenue derived from each source for each quarter during fiscal years 2018 and 2017:
| FY 2018 | FY 2017 | ||||||||||||||||
| Q4 | Q3 | Q2 | Q1 | Q4 | Q3 | Q2 | Q1 | ||||||||||
| Percent of Service Revenue: | |||||||||||||||||
| In-House | 84.2% | 83.9% | 83.6% | 83.5% | 85.1% | 84.3% | 83.6% | 84.3% | |||||||||
| Outsourced | 14.2% | 14.4% | 14.7% | 14.7% | 13.0% | 13.9% | 14.6% | 13.8% | |||||||||
| Freight Billed to Customers | 1.6% | 1.7% | 1.7% | 1.8% | 1.9% | 1.8% | 1.8% | 1.9% | |||||||||
| 100.0% | 100.0% | 100.0% | 100.0% | 100.0% | 100.0% | 100.0% | 100.0% | ||||||||||
Our Distribution sales accounted for 50.1% and 50.6% of our total revenue in fiscal years 2018 and 2017, respectively. Distribution sales increased $4.9 million, or 6.7% compared to fiscal year 2017. This year-over-year increase in sales reflects higher demand from industrial customers, including those sold through our independent representative network and increased rental revenues. The growth in fiscal year 2018 versus fiscal year 2017 was all organic growth, while the growth in fiscal year 2017 versus fiscal year 2016 reflected both organic growth and acquisitions. Our fiscal years 2018 and 2017 Distribution sales (decline) growth in relation to prior fiscal year quarter comparisons were as follows:
| FY 2018 | FY 2017 | |||||||||||||||
| Q4 | Q3 | Q2 | Q1 | Q4 | Q3 | Q2 | Q1 | |||||||||
| Distribution Sales Growth (Decline) | 8.3% | 6.7% | 0.9% | 11.4% | 23.7% | 25.4% | 14.7% | (1.0%) | ||||||||
Distribution sales orders include orders for instruments that we routinely stock in our inventory, customized products, and other products ordered less frequently, which we do not stock. Pending product shipments are primarily backorders, but also include products that are requested to be calibrated in our service centers prior to shipment, orders required by the customer to be shipped complete or at a future date, and other orders awaiting final credit or management review prior to shipment. Our total pending product shipments decreased $0.7 million, or 18.1%, at the end of fiscal year 2018 compared to the end of fiscal year 2017. Backorders at the end of fiscal year 2018 were $2.1 million, down from $2.7 million at the end of fiscal year 2017. The year-over-year decreases in pending product shipments and backorders can be attributed to the significant increase in fourth quarter distribution sales compared to the prior year. The following table presents the percentage of total pending product shipments that were backorders at the end of each quarter in fiscal years 2018 and 2017 and our historical trend of total pending product shipments:
| FY 2018 | FY 2017 | |||||||||||||||
| Q4 | Q3 | Q2 | Q1 | Q4 | Q3 | Q2 | Q1 | |||||||||
| Total Pending Product Shipments % of Pending Product | $2,965 | $3,929 | $3,940 | $3,513 | $3,622 | $3,989 | $3,530 | $3,469 | ||||||||
| Shipments that were Backorders | 71.3% | 71.4% | 74.2% | 69.6% | 73.5% | 66.18% | 74.9% | 69.8% | ||||||||
24
| Gross Profit: | ||||||||||
| For the Years Ended | ||||||||||
| March 31, | March 25, | Change | ||||||||
| 2018 | 2017 | $ | % | |||||||
| Gross Profit: | ||||||||||
| Service | $ | 19,922 | $ | 19,039 | $ | 883 | 4.6% | |||
| Distribution | 17,519 | 15,931 | 1,588 | 10.0% | ||||||
| Total | $ | 37,441 | $ | 34,970 | $ | 2,471 | 7.1% | |||
Total gross profit in fiscal year 2018 was $37.4 million, an increase of $2.5 million or 7.1% from fiscal year 2017. As a percentage of total revenue, total gross margin was 24.1% in fiscal year 2018, a 20 basis point reduction compared to 24.3% during fiscal year 2017.
Service gross profit increased $0.9 million, or 4.6%, from fiscal year 2017 to fiscal year 2018. Our annual and quarterly Service segment gross margins are a function of several factors. Our organic Service revenue growth provides some incremental gross margin growth by leveraging certain fixed costs of this segment. The mix of services provided to customers may also affect gross margins in any given period. Annual Service gross margin decreased by 110 basis points from fiscal year 2017 to fiscal year 2018. This year-over-year decline was primarily due to technician productivity challenges earlier in fiscal year 2018 and the mix of services provided. The following table presents the quarterly historical trend of our Service gross margin as a percent of Service revenue:
| FY 2018 | FY 2017 | ||||||||||||||||
| Q4 | Q3 | Q2 | Q1 | Q4 | Q3 | Q2 | Q1 | ||||||||||
| Service Gross Margin | 28.5% | 25.0% | 23.7% | 25.1% | 30.0% | 24.7% | 24.4% | 27.5% | |||||||||
Our Distribution gross margin includes net sales less the direct cost of inventory sold and the direct costs of equipment rental revenues, primarily depreciation expense for the fixed assets in our rental equipment pool, as well as the impact of rebates and cooperative advertising income we receive from vendors, freight billed to customers, freight expenses and direct shipping costs. In general, our Distribution gross margin can vary based upon the mix of products sold, price discounting, and the timing of periodic vendor rebates offered and cooperative advertising programs from suppliers.
The following table reflects the quarterly historical trend of our Distribution gross margin as a percent of Distribution sales:
| FY 2018 | FY 2017 | ||||||||||||||||
| Q4 | Q3 | Q2 | Q1 | Q4 | Q3 | Q2 | Q1 | ||||||||||
| Total Distribution Gross Margin | 22.6% | 23.0% | 21.7% | 22.8% | 20.7% | 22.6% | 22.2% | 22.0% | |||||||||
Annual Distribution segment gross margin improved 60 basis points in fiscal year 2018 compared to fiscal year 2017. This year-over-year improvement in gross margin was driven by increased sales in our higher-margin equipment rental business and an improved customer mix, which for us means a higher percentage of total sales to end user customers and reduction in sales to wholesale or intermediary reseller type customers. It also reflects the increase in rental revenues which have higher gross margins.
Operating Expenses:
| For the Years Ended | |||||||||||
| March 31, | March 25, | Change | |||||||||
| 2018 | 2017 | $ | % | ||||||||
| Operating Expenses: | |||||||||||
| Selling, Marketing and Warehouse | $ | 16,564 | $ | 16,554 | $ | 10 | 0.1% | ||||
| General and Administrative | 11,851 | 10,482 | 1,369 | 13.1% | |||||||
| Total | $ | 28,415 | $ | 27,036 | $ | 1,379 | 5.1% | ||||
Operating expenses increased $1.4 million, or 5.1%, from fiscal year 2017 to fiscal year 2018. As a percentage of total revenue, operating expenses decreased from 18.8% in fiscal year 2017 to 18.3% in fiscal year 2018. Selling, marketing and warehouse expenses were flat year-over-year as increased selling and marketing expenses were offset by reduced acquisition related amortization expense. The year-over-year increase in General and Administrative expenses was primarily due to our continued investment in technology infrastructure improvements and Operational Excellence initiatives.
25
Provision for Income Taxes:
| For the Years Ended | |||||||||||||
| March 31, | March 25, | Change | |||||||||||
| 2018 | 2017 | $ | % | ||||||||||
| Provision for Income Taxes | $ | 2,026 | $ | 2,642 | $ | (616 | ) | (23.3 | %) | ||||
Our effective tax rates for fiscal years 2018 and 2017 were 25.5% and 36.9%, respectively. The year-over-year decrease largely reflects the enactment of the Tax Act which was signed into law on December 22, 2017. The Tax Act required us to reduce our U.S. net deferred tax liabilities. The Tax Act also required us to use a blended U.S. federal tax rate of the old rates and the new rates because we are a fiscal year taxpayer and, as a result, we will phase in the lower corporate income tax rate. We expect our future effective tax rate of U.S. Federal, state and Canadian income taxes to be approximately 25.0% to 27.0%.
Net Income:
| For the Years Ended | Change | |||||||||||
| March 31, | March 25, | |||||||||||
| 2018 | 2017 | $ | % | |||||||||
| Net Income | $ | 5,922 | $ | 4,522 | $ | 1,400 | 31.0 | % | ||||
Net income for fiscal year 2018 showed a 31.0% improvement when compared to fiscal year 2017. As a percentage of revenue, net income was 3.8% in fiscal year 2018, up from 3.1% in fiscal year 2017. This year-over-year change reflects higher operating income, as a percentage of revenue and a lower provision for income taxes offset by higher interest and other expense.
Adjusted EBITDA:
In addition to reporting net income, a U.S. GAAP (“GAAP”) measure, we present Adjusted EBITDA (earnings before interest, income taxes, depreciation and amortization, and non-cash stock compensation expense), which is a non-GAAP measure. Our management believes Adjusted EBITDA is an important measure of our operating performance because it allows management, investors and others to evaluate and compare the performance of our core operations from period to period by removing the impact of the capital structure (interest), tangible and intangible asset base (depreciation and amortization), taxes, and stock-based compensation expense, which is not always commensurate with the reporting period in which it is included. As such, our management uses Adjusted EBITDA as a measure of performance when evaluating our business segments and as a basis for planning and forecasting. Adjusted EBITDA is also commonly used by rating agencies, lenders and other parties to evaluate our credit worthiness.
Adjusted EBITDA is not a measure of financial performance under GAAP and is not calculated through the application of GAAP. As such, it should not be considered as a substitute or alternative for the GAAP measure of net income and, therefore, should not be used in isolation of, but in conjunction with, the GAAP measure. Adjusted EBITDA, as presented, may produce results that vary from the GAAP measure and may not be comparable to a similarly defined non-GAAP measure used by other companies.
| For the Years Ended | ||||||||
| March 31, | March 25, | |||||||
| 2018 | 2017 | |||||||
| Net Income | $ | 5,922 | $ | 4,522 | ||||
| + Interest Expense | 1,018 | 719 | ||||||
| + Other Expense / (Income) | 60 | 51 | ||||||
| + Tax Provision | 2,026 | 2,642 | ||||||
| Operating Income | $ | 9,026 | $ | 7,934 | ||||
| + Depreciation & Amortization | 5,991 | 6,184 | ||||||
| + Other (Expense) / Income | (60 | ) | (51 | ) | ||||
| + Noncash Stock Compensation | 1,411 | 453 | ||||||
| Adjusted EBITDA | $ | 16,368 | $ | 14,520 | ||||
26
During fiscal year 2018, Adjusted EBITDA was $16.4 million, an increase of $1.8 million or 12.7% compared to fiscal year 2017. As a percentage of revenue, Adjusted EBITDA was 10.6% during fiscal year 2018, a 50 basis point increase versus fiscal year 2017. The difference between the increase in Adjusted EBITDA and increase in net income during fiscal year 2018 is primarily driven by increased non-cash stock compensation expense and the impact of the Tax Act on our tax provision.
LIQUIDITY AND CAPITAL RESOURCES
On October 30, 2017, the Company entered into an Amended and Restated Credit Agreement (the “2017 Agreement”), which amended and restated our prior credit facility agreement. The 2017 Agreement extended the term of the Company’s $30.0 million revolving credit facility (the “Revolving Credit Facility”) to October 29, 2021. As of March 31, 2018, $30.0 million was available under the Revolving Credit Facility, of which $8.7 million was outstanding and included in long-term debt on the Consolidated Balance Sheet. The 2017 Agreement also increased the amount of the Company’s outstanding term loan to $15.0 million (the “2017 Term Loan”), replacing the previous term loan. The excess funds of the 2017 Term Loan over the previous term loan were used to repay amounts outstanding under the Revolving Credit Facility. As of March 31, 2018, $14.1 million was outstanding on the 2017 Term Loan, of which $2.1 million was included in current liabilities on the Consolidated Balance Sheet with the remainder included in long-term debt. The 2017 Term Loan requires principal repayments of $0.2 million per month plus interest through September 2022 with a $4.3 million repayment required on October 29, 2022. Under the 2017 Agreement, borrowings that may be used for business acquisitions are limited to $20.0 million per fiscal year. During fiscal year 2018, no borrowings were used for business acquisitions.
Previously, on March 31, 2016, the Company entered into Amendment 3 (“Amendment 3”) to the prior credit agreement. Under Amendment 3, borrowings that could be used for business acquisitions were limited to $15.0 million in fiscal years 2018 and 2019. Amendment 3 also provided the Company with a $10.0 million term loan. The term loan required principal repayments of $0.1 million per month plus interest. Total annual repayment amounts of $1.4 million were required in fiscal years 2017 through 2021 with a $3.0 million repayment required in fiscal year 2022. Amendment 3 also increased the allowable leverage ratio to a maximum of 3.0 from 2.75. As described above, in the third quarter of fiscal year 2018, we entered into the 2017 Agreement that amended and restated the prior credit agreement, including Amendment 3.
The 2017 Agreement has certain covenants with which we must comply, including a fixed charge ratio covenant and a leverage ratio covenant. The allowable leverage ratio under the 2017 Agreement remains at a maximum multiple of 3.0 of total debt outstanding compared to earnings before income taxes, depreciation and amortization, and non-cash stock-based compensation expense for the preceding four consecutive fiscal quarters. We were in compliance with all loan covenants and requirements during fiscal year 2018. Our leverage ratio, as defined in the 2017 Agreement, was 1.40 at March 31, 2018, compared with 1.88 at March 25, 2017.
Interest on the 2017 Agreement and 2017 Term Loan continues to accrue, at our election, at either the variable one-month London Interbank Offered Rate (“LIBOR”) or a fixed rate for a designated period at the LIBOR corresponding to such period, in each case, plus a margin. Commitment fees accrue based on the average daily amount of unused credit available under the 2017 Agreement. Interest rate margins and commitment fees are determined on a quarterly basis based upon our calculated leverage ratio, as defined in the 2017 Agreement.
Cash Flows: The following table is a summary of our Consolidated Statements of Cash Flows (dollars in thousands):
| For the Fiscal Years Ended | ||||||||
| March 31, | March 25, | |||||||
| 2018 | 2017 | |||||||
| Cash Provided by (Used in): | ||||||||
| Operating Activities | $ | 9,874 | $ | 7,544 | ||||
| Investing Activities | (5,871 | ) | (12,168 | ) | ||||
| Financing Activities | (3,980 | ) | 4,768 | |||||
Operating Activities: Net cash provided by operating activities was $9.9 million during fiscal year 2018 compared to $7.5 million during fiscal year 2017 primarily due to changes in net working capital (defined as current assets less current liabilities). The significant changes in net working capital were:
| ● | Cash: Cash decreased $0.3 million during fiscal year 2018. The decrease was primarily due to the timing of payments towards our long-term debt. |
27
| ● |
Receivables: Accounts receivable increased by a net amount of $3.0 million during fiscal year 2018. Accounts receivable increased by a net amount of $5.0 million during fiscal year 2017, inclusive of $0.9 million of accounts receivable acquired as part of the assets acquired during a business acquisition within the period. Excluding acquired accounts receivable, the year-over-year change would be an increase of $4.1 million which reflects the increases in Company revenues plus the timing of collections. The following table illustrates our days sales outstanding as of March 31, 2018 and March 25, 2017: |
| March 31, | March 25, | |||||
| 2018 | 2017 | |||||
| Net Sales, for the last two fiscal months | $ | 31,938 | $ | 28,684 | ||
| Accounts Receivable, net | $ | 24,684 | $ | 22,049 | ||
| Days Sales Outstanding | 46 | 46 | ||||
| ● |
Inventory: Our inventory strategy includes making appropriate large quantity, high dollar purchases with key manufacturers for various reasons, including maximizing on-hand availability of key products, expanding the number of SKU’s stocked in anticipation of customer demand, reducing backorders for products with long lead times and optimizing vendor purchase and sales volume discounts. As a result, inventory levels may vary from quarter-to-quarter based on the timing of these large orders in relation to our quarter end. Our inventory balance increased $2.4 million during fiscal year 2018. Our inventory balance increased $3.8 million during fiscal year 2017 inclusive of $0.4 million in inventory acquired as part of the Excalibur acquisition. The year-over-year change represents the timing of strategic purchases in fiscal year 2018 and the addition of $0.4 million of Excalibur’s used equipment business inventory. |
| ● |
Accounts Payable: Changes in accounts payable may or may not correlate with changes in inventory balances at any given quarter end due to the timing of vendor payments for inventory, as well as the timing of payments for outsourced Service vendors and capital expenditures. Accounts payable increased by $1.9 million during fiscal year 2018 and $3.1 million during fiscal year 2017, largely due to the timing of inventory and other payments in the respective period. The increase in fiscal year 2017 is also inclusive of the addition of $0.4 million in accounts payable acquired as part of the Excalibur acquisition completed during the period. |
| ● |
Accrued Compensation and Other Liabilities: Accrued compensation and other liabilities include, among other things, amounts paid to employees for non-equity performance-based compensation. At the end of any particular period, the amounts accrued for such compensation may vary due to many factors including, but not limited to, changes in expected performance levels, the performance measurement period, and the timing of payments to employees. During fiscal year 2018, accrued compensation and other liabilities decreased by $0.7 million due to the timing of certain accrual payments. During fiscal year 2017, accrued compensation and other liabilities decreased by $1.8 million, inclusive of $2.2 million in net payments of previously accrued contingent consideration and holdback payments related to business acquisitions. |
| ● |
Income Taxes Payable: In any given period, net working capital may be affected by the timing and amount of income tax payments. During fiscal year 2018, income taxes payable decreased by $0.8 million whereas in fiscal year 2017, income taxes payable increased by $0.8 million. The year-over-year difference is due to timing of income tax payments. |
Investing Activities: During fiscal year 2018, we invested $5.9 million in capital expenditures, including $2.2 million spent for expanded Service segment capabilities, including for our mobile calibration truck fleet and radio-frequency asset capabilities, and $1.8 million spent for rental assets. In fiscal year 2017, we invested $5.3 million in capital expenditures, primarily for additional Service segment capabilities and rental assets.
During fiscal year 2018, we had no business acquisitions. During fiscal year 2017, we used $7.0 million for a business acquisition.
Financing Activities: During fiscal year 2018, we received $7.1 million from the proceeds of the 2017 Term Loan and $0.9 million in cash was generated from the issuance of common stock. In addition, we used $9.9 million to repay our Revolving Credit Facility, we used $1.7 million in cash for repayment of our term loan and $0.4 million to repurchase shares of our common stock. During fiscal year 2017, we received $10.0 million in proceeds from a term loan (used primarily for the Excalibur acquisition), and used approximately $0.5 million in cash for repayment of our Revolving Credit Facility, $1.3 million in cash for repayment of our term loan and $3.0 million for the payment of contingent consideration and other holdback amounts related to previous business acquisitions. In addition, approximately $1.0 million in cash was used to redeem stock options granted to nonemployee directors, as provided for in our 2003 Incentive Plan, as Amended and Restated, and $0.6 million in cash was generated from the issuance of common stock.
28
Commencing in fiscal year 2018, we revised our non-employee director performance-based compensation program such that any compensation earned under that program will be paid in Company stock awards, rather than in cash. The achievement criteria and the payment parameters (target payment of $20,000 per non-employee director with a maximum payment of $30,000), have not changed.
On December 20, 2017, we filed a universal shelf registration statement on Form S-3 with the SEC. Under the shelf registration statement, we may from time to time in one or more future offerings, issue various types of securities up to an aggregate amount of $50 million. We have no immediate plans to use this registration statement. The SEC declared the shelf registration statement effective on January 5, 2018.
Contractual Obligations and Commercial Commitments: The table below contains aggregated information about future payments related to contractual obligations and commercial commitments such as debt and lease agreements as of March 31, 2018 (in millions):
| Payments Due By Period | ||||||||||||||||
| Less Than | 1-3 | 3-5 | More Than | |||||||||||||
| 1 Year | Years | Years | 5 Years | Total | ||||||||||||
| Revolving Line of Credit (1) | $ | - | $ | - | $ | 8.7 | $ | - | $ | 8.7 | ||||||
| Term Loan | 2.1 | 6.4 | 5.6 | - | 14.1 | |||||||||||
| Operating Leases | 2.1 | 2.4 | 1.2 | 2.6 | 8.3 | |||||||||||
| Total Contractual Cash Obligations | $ | 4.2 | $ | 8.8 | $ | 15.5 | $ | 2.6 | $ | 31.1 | ||||||
| (1) |
Due to the uncertainty of forecasting expected variable rate interest payments, this amount excludes the interest portion of our debt obligation. |
OUTLOOK
We are pleased with the results we delivered for fiscal year 2018. We continue to expect mid to high single-digit organic growth in our Service segment and believe we will continue to take market share, particularly within the life science space. Our pipeline of acquisition opportunities is strong, and continues to be an important element of our long-term growth strategy. We are building our business for the long term with investments in Operational Excellence and technology, both of which are designed to expand margins incrementally over time. We believe that our value proposition continues to be strong and unique.
We think we have a strong leadership team in place, are confident in our direction, and believe we have positioned Transcat to be successful for our shareholders.
Transcat expects its income tax rate to range between 25.0% and 27.0% in fiscal 2019. This rate includes Federal, various state, and Canadian income taxes.
We are making a concentrated effort over the next couple of years to upgrade our systems and software and to drive technology as a competitive advantage. Over time, we expect these investments to drive improved productivity and efficiency. We believe that we are well positioned to capitalize on future growth opportunities.
The Company anticipates total capital expenditures to be approximately $7.0 million to $7.5 million in fiscal 2019, with the majority of the incremental capital expenditures in excess of fiscal 2018 spend levels planned for IT infrastructure investments to drive Operational Excellence and for growth-oriented opportunities within both our operating segments. Maintenance/existing asset replacements are expected to be consistent with fiscal 2018 at approximately $1.0 million to $1.5 million.
Looking further ahead, we believe our capital and leadership investments have positioned us well to meet our goal of achieving $175 million to $200 million in revenue over the next two to three years.
29
ITEM 7A. QUANTITATIVE AND QUALITATIVE DISCLOSURES ABOUT MARKET RISK INTEREST RATES
Our exposure to changes in interest rates results from our borrowing activities. In the event interest rates were to move by 1%, our yearly interest expense would increase or decrease by approximately $0.2 million assuming our average borrowing levels remained constant. As of March 31, 2018, $30.0 million was available under our Revolving Credit Facility, of which $8.7 million was outstanding and included in long-term debt on the Consolidated Balance Sheets. As described above under “Liquidity and Capital Resources”, we also have a $15.0 million (original principal) term loan. The term loan is considered a LIBOR loan. As of March 31, 2018, $14.1 million was outstanding on the term loan and was included in long-term debt and current portion of long-term debt on the Consolidated Balance Sheets. The term loan requires principal repayments of $0.2 million per month plus interest.
At our option, we borrow from our Revolving Credit Facility and term loan at the variable one-month LIBOR or at a fixed rate for a designated period at the LIBOR corresponding to such period, in each case, plus a margin. Our interest rate margin is determined on a quarterly basis based upon our calculated leverage ratio. As of March 31, 2018, the one-month LIBOR was 1.9%. Our interest rate for fiscal year 2018 ranged from 3.0% to 3.6%. On March 31, 2018, we had no hedging arrangements in place to limit our exposure to upward movements in interest rates.
FOREIGN CURRENCY
Approximately 90% of our total revenues for fiscal years 2018 and 2017 were denominated in U.S. dollars, with the remainder denominated in Canadian dollars. A 10% change in the value of the Canadian dollar to the U.S. dollar would impact our revenue by less than 1%. We monitor the relationship between the U.S. and Canadian currencies on a monthly basis and adjust sales prices for products and services sold in Canadian dollars as we believe to be appropriate.
We continually utilize short-term foreign exchange forward contracts to reduce the risk that future earnings would be adversely affected by changes in currency exchange rates. We do not apply hedge accounting and therefore the net change in the fair value of the contracts, which totaled a net loss of less than $0.1 million and a net gain of less than $0.1 million in fiscal years 2018 and 2017, respectively, was recognized as a component of other expense in the Consolidated Statements of Income. The change in the fair value of the contracts is offset by the change in fair value on the underlying receivables denominated in Canadian dollars being hedged. On March 31, 2018, we had a foreign exchange contract, which matured in April 2018, outstanding in the notional amount of $5.1 million. The foreign exchange contract was renewed in April 2018 and continues to be in place. We do not use hedging arrangements for speculative purposes.
30
ITEM 8. FINANCIAL STATEMENTS AND SUPPLEMENTARY DATA
31
Management’s Annual Report on Internal Control Over Financial Reporting
Management of Transcat, Inc. (the “Company”) is responsible for establishing and maintaining an adequate system of internal control over financial reporting. This system is designed to provide reasonable assurance regarding the reliability of financial reporting and the preparation of financial statements for external purposes in accordance with U.S. generally accepted accounting principles.
The Company’s internal control over financial reporting includes those policies and procedures that (i) pertain to the maintenance of records that, in reasonable detail, accurately and fairly reflect the transactions and dispositions of the assets of the Company; (ii) provide reasonable assurance that transactions are recorded as necessary to permit preparation of financial statements in accordance with generally accepted accounting principles, and that receipts and expenditures of the Company are being made only in accordance with authorizations of management and directors of the Company; and (iii) provide reasonable assurance regarding prevention or timely detection of unauthorized acquisition, use, or disposition of the Company’s assets that could have a material effect on the financial statements.
Because of its inherent limitations, a system of internal control over financial reporting can provide only reasonable assurance and may not prevent or detect misstatements. Further, because of changes in conditions, effectiveness of internal controls over financial reporting may vary over time.
Management conducted an evaluation of the effectiveness of the system of internal control over financial reporting based on the framework in Internal Control – Integrated Framework (2013) issued by the Committee of Sponsoring Organizations (COSO) of the Treadway Commission. Based on that evaluation, management concluded that the Company’s internal control over financial reporting was effective as of March 31, 2018.
The effectiveness of the Company’s internal control over financial reporting has been audited by Freed Maxick CPAs, P.C. an independent registered public accounting firm, as stated in their report which is included herein.
32
REPORT OF INDEPENDENT REGISTERED PUBLIC ACCOUNTING FIRM
Board of Directors and Shareholders
Transcat, Inc.
Rochester, New York
Opinions on the Financial Statements and Internal Control Over Financial Reporting
We have audited the accompanying consolidated balance sheets of Transcat, Inc. and subsidiaries (the Company) as of March 31, 2018 and March 25, 2017, and the related consolidated statements of income, comprehensive income, changes in shareholders' equity, and cash flows for each of the years ended March 31, 2018 and March 25, 2017, and the related notes (collectively, the financial statements). We also have audited the Company’s internal control over financial reporting as of March 31, 2018, based on criteria established in Internal Control — Integrated Framework issued by the Committee of Sponsoring Organizations of the Treadway Commission in 2013.
In our opinion, the financial statements referred to above present fairly, in all material respects, the financial position of the Company as of March 31, 2018 and March 25, 2017, and the results of its operations and its cash flows for each of the years ended March 31, 2018 and March 25, 2017, in conformity with accounting principles generally accepted in the United States of America. Also in our opinion, the Company maintained, in all material respects, effective internal control over financial reporting as of March 31, 2018, based on criteria established in Internal Control — Integrated Framework issued by the Committee of Sponsoring Organizations of the Treadway Commission in 2013.
Basis for Opinions
The Company's management is responsible for these financial statements, for maintaining effective internal control over financial reporting, and for its assessment of the effectiveness of internal control over financial reporting, included in the accompanying Annual Report on Internal Control Over Financial Reporting. Our responsibility is to express an opinion on the Company's financial statements and an opinion on the company's internal control over financial reporting based on our audits. We are a public accounting firm registered with the Public Company Accounting Oversight Board (United States) (PCAOB) and are required to be independent with respect to the Company in accordance with U.S. federal securities laws and the applicable rules and regulations of the Securities and Exchange Commission and the PCAOB.
We conducted our audits in accordance with the standards of the PCAOB. Those standards require that we plan and perform the audits to obtain reasonable assurance about whether the financial statements are free of material misstatement, whether due to error or fraud, and whether effective internal control over financial reporting was maintained in all material respects.
Our audits of the financial statements included performing procedures to assess the risks of material misstatement of the financial statements, whether due to error or fraud, and performing procedures that respond to those risks. Such procedures included examining, on a test basis, evidence regarding the amounts and disclosures in the financial statements. Our audits also included evaluating the accounting principles used and significant estimates made by management, as well as evaluating the overall presentation of the financial statements. Our audit of internal control over financial reporting included obtaining an understanding of internal control over financial reporting, assessing the risk that a material weakness exists, and testing and evaluating the design and operating effectiveness of internal control based on the assessed risk. Our audits also included performing such other procedures as we considered necessary in the circumstances. We believe that our audits provide a reasonable basis for our opinions.
Definition and Limitations of Internal Control Over Financial Reporting
A company's internal control over financial reporting is a process designed to provide reasonable assurance regarding the reliability of financial reporting and the preparation of financial statements for external purposes in accordance with generally accepted accounting principles. A company's internal control over financial reporting includes those policies and procedures that (1) pertain to the maintenance of records that, in reasonable detail, accurately and fairly reflect the transactions and dispositions of the assets of the company; (2) provide reasonable assurance that transactions are recorded as necessary to permit preparation of financial statements in accordance with generally accepted accounting principles, and that receipts and expenditures of the company are being made only in accordance with authorizations of management and directors of the company; and (3) provide reasonable assurance regarding prevention or timely detection of unauthorized acquisition, use or disposition of the company's assets that could have a material effect on the financial statements.
Because of its inherent limitations, internal control over financial reporting may not prevent or detect misstatements. Also, projections of any evaluation of effectiveness to future periods are subject to the risk that controls may become inadequate because of changes in conditions, or that the degree of compliance with the policies or procedures may deteriorate.
We have served as the Company's auditor since 2012.
/s/ Freed Maxick CPAs, P.C.
Rochester, New York
June 8, 2018
33
TRANSCAT, INC.
CONSOLIDATED STATEMENTS OF INCOME
(In Thousands, Except Per Share Amounts)
| For the Fiscal Years Ended | ||||||
| March 31, | March 25, | |||||
| 2018 | 2017 | |||||
| Service Revenue | $ | 77,445 | $ | 71,103 | ||
| Distribution Sales | 77,696 | 72,795 | ||||
| Total Revenue | 155,141 | 143,898 | ||||
| Cost of Services Sold | 57,523 | 52,064 | ||||
| Cost of Distribution Sales | 60,177 | 56,864 | ||||
| Total Cost of Revenue | 117,700 | 108,928 | ||||
| Gross Profit | 37,441 | 34,970 | ||||
| Selling, Marketing and Warehouse Expenses | 16,564 | 16,554 | ||||
| General and Administrative Expenses | 11,851 | 10,482 | ||||
| Total Operating Expenses | 28,415 | 27,036 | ||||
| Operating Income | 9,026 | 7,934 | ||||
| Interest and Other Expenses, net | 1,078 | 770 | ||||
| Income Before Provision for Income Taxes | 7,948 | 7,164 | ||||
| Provision for Income Taxes | 2,026 | 2,642 | ||||
| Net Income | $ | 5,922 | $ | 4,522 | ||
| Basic Earnings Per Share | $ | 0.83 | $ | 0.65 | ||
| Average Shares Outstanding | 7,124 | 6,994 | ||||
| Diluted Earnings Per Share | $ | 0.81 | $ | 0.64 | ||
| Average Shares Outstanding | 7,303 | 7,111 | ||||
See accompanying notes to consolidated financial statements.
34
TRANSCAT, INC.
CONSOLIDATED STATEMENTS OF COMPREHENSIVE INCOME
(In Thousands)
| For the Fiscal Years Ended | ||||||||
| March 31, | March 25, | |||||||
| 2018 | 2017 | |||||||
| Net Income | $ | 5,922 | $ | 4,522 | ||||
| Other Comprehensive Income (Loss): | ||||||||
| Currency Translation Adjustment | 156 | (41 | ) | |||||
| Other, net of tax effects of $(25) and $10 for the years ended March 31, 2018 and March 25, 2017, respectively. | (23 | ) | (15 | ) | ||||
| Total Other Comprehensive Income (Loss) | 133 | (56 | ) | |||||
| Comprehensive Income | $ | 6,055 | $ | 4,466 | ||||
See accompanying notes to consolidated financial statements.
35
TRANSCAT, INC.
CONSOLIDATED BALANCE SHEETS
(In Thousands, Except Share and Per Share Amounts)
| March 31, | March 25, | |||||||
| 2018 | 2017 | |||||||
| ASSETS | ||||||||
| Current Assets: | ||||||||
| Cash | $ | 577 | $ | 842 | ||||
| Accounts Receivable, less allowance for doubtful accounts of $296 and $210 as of March 31, 2018 and March 25, 2017, respectively | 24,684 | 22,049 | ||||||
| Other Receivables | 1,361 | 1,227 | ||||||
| Inventory, net | 12,651 | 10,278 | ||||||
| Prepaid Expenses and Other Current Assets | 1,240 | 1,193 | ||||||
| Total Current Assets | 40,513 | 35,589 | ||||||
| Property and Equipment, net | 17,091 | 15,568 | ||||||
| Goodwill | 32,740 | 32,520 | ||||||
| Intangible Assets, net | 5,505 | 7,519 | ||||||
| Other Assets | 973 | 901 | ||||||
| Total Assets | $ | 96,822 | $ | 92,097 | ||||
| LIABILITIES AND SHAREHOLDERS' EQUITY | ||||||||
| Current Liabilities: | ||||||||
| Accounts Payable | $ | 13,535 | $ | 11,615 | ||||
| Accrued Compensation and Other Liabilities | 5,240 | 5,907 | ||||||
| Income Taxes Payable | 232 | 805 | ||||||
| Current Portion of Long-Term Debt | 2,143 | 1,429 | ||||||
| Total Current Liabilities | 21,150 | 19,756 | ||||||
| Long-Term Debt | 20,707 | 25,883 | ||||||
| Deferred Tax Liabilities, net | 1,709 | 1,134 | ||||||
| Other Liabilities | 1,908 | 1,923 | ||||||
| Total Liabilities | 45,474 | 48,696 | ||||||
| Shareholders' Equity: | ||||||||
| Common Stock, par value $0.50 per share, 30,000,000 shares authorized; 7,155,050 and 7,043,754 shares issued and outstanding as of March 31, 2018 and March 25, 2017, respectively | 3,578 | 3,522 | ||||||
| Capital in Excess of Par Value | 14,965 | 12,996 | ||||||
| Accumulated Other Comprehensive Loss | (281 | ) | (414 | ) | ||||
| Retained Earnings | 33,086 | 27,297 | ||||||
| Total Shareholders' Equity | 51,348 | 43,401 | ||||||
| Total Liabilities and Shareholders' Equity | $ | 96,822 | $ | 92,097 | ||||
See accompanying notes to consolidated financial statements.
36
TRANSCAT, INC.
CONSOLIDATED STATEMENTS OF CASH FLOWS
(In Thousands)
| For the Fiscal Years Ended | ||||||||
| March 31, | March 25, | |||||||
| 2018 | 2017 | |||||||
| Cash Flows from Operating Activities: | ||||||||
| Net Income | $ | 5,922 | $ | 4,522 | ||||
| Adjustments to Reconcile Net Income to Net Cash | ||||||||
| Provided by Operating Activities: | ||||||||
| Loss (Gain) on Disposal of Property and Equipment | 133 | (4 | ) | |||||
| Deferred Income Taxes | 765 | 63 | ||||||
| Depreciation and Amortization | 5,991 | 6,184 | ||||||
| Provision for Accounts Receivable and Inventory Reserves | 92 | 376 | ||||||
| Stock-Based Compensation Expense | 1,411 | 453 | ||||||
| Changes in Assets and Liabilities, net of acquisitions: | ||||||||
| Accounts Receivable and Other Receivables | (2,952 | ) | (4,728 | ) | ||||
| Inventory | (1,674 | ) | (3,425 | ) | ||||
| Prepaid Expenses and Other Assets | (259 | ) | (224 | ) | ||||
| Accounts Payable | 1,920 | 3,107 | ||||||
| Accrued Compensation and Other Liabilities | (686 | ) | 405 | |||||
| Income Taxes Payable | (789 | ) | 815 | |||||
| Net Cash Provided by Operating Activities | 9,874 | 7,544 | ||||||
| Cash Flows from Investing Activities: | ||||||||
| Purchase of Property and Equipment | (5,882 | ) | (5,250 | ) | ||||
| Proceeds from Sale of Property and Equipment | 11 | 59 | ||||||
| Business Acquisitions, net of cash acquired | - | (6,977 | ) | |||||
| Net Cash Used in Investing Activities | (5,871 | ) | (12,168 | ) | ||||
| Cash Flows from Financing Activities: | ||||||||
| Repayment of Revolving Credit Facility, net | (9,878 | ) | (452 | ) | ||||
| Proceeds from Term Loan | 7,143 | 10,000 | ||||||
| Repayments of Term Loan | (1,726 | ) | (1,310 | ) | ||||
| Payment of Contingent Consideration and Holdbacks Related to Business Acquisitions | - | (3,041 | ) | |||||
| Issuance of Common Stock | 931 | 635 | ||||||
| Repurchase of Common Stock | (360 | ) | (98 | ) | ||||
| Stock Option Redemption | (90 | ) | (966 | ) | ||||
| Net Cash (Used In) Provided by Financing Activities | (3,980 | ) | 4,768 | |||||
| Effect of Exchange Rate Changes on Cash | (288 | ) | 57 | |||||
| Net (Decrease) Increase in Cash | (265 | ) | 201 | |||||
| Cash at Beginning of Fiscal Year | 842 | 641 | ||||||
| Cash at End of Fiscal Year | $ | 577 | $ | 842 | ||||
| Supplemental Disclosures of Cash Flow Activity: | ||||||||
| Cash paid during the fiscal year for: | ||||||||
| Interest | $ | 1,015 | $ | 686 | ||||
| Income Taxes, net | $ | 2,068 | $ | 1,835 | ||||
| Supplemental Disclosure of Non-Cash Investing and Financing Activities: | ||||||||
| Contingent Consideration Related to Business Acquisition | $ | - | $ | - | ||||
| Holdback Amounts Related to Business Acquisitions | $ | - | $ | 735 | ||||
See accompanying notes to consolidated financial statements.
37
TRANSCAT, INC.
CONSOLIDATED STATEMENTS OF CHANGES IN SHAREHOLDERS’ EQUITY
(In Thousands, Except Per Share Amounts)
| Capital | |||||||||||||||||||||||
| Common Stock | In | Accumulated | |||||||||||||||||||||
| Issued | Excess | Other | |||||||||||||||||||||
| $0.50 Par Value | of Par | Comprehensive | Retained | ||||||||||||||||||||
| Shares | Amount | Value | Loss | Earnings | Total | ||||||||||||||||||
| Balance as of March 26, 2016 | 6,924 | $ | 3,462 | $ | 12,993 | $ | (358 | ) | $ | 22,814 | $ | 38,911 | |||||||||||
| Issuance of Common Stock | 80 | 40 | 595 | - | - | 635 | |||||||||||||||||
| Repurchase of Common Stock | (10 | ) | (5 | ) | (54 | ) | - | (39 | ) | (98 | ) | ||||||||||||
| Stock-Based Compensation | 50 | 25 | 428 | - | - | 453 | |||||||||||||||||
| Redemption of Stock Options | - | - | (966 | ) | - | - | (966 | ) | |||||||||||||||
| Other Comprehensive Loss | - | - | - | (56 | ) | - | (56 | ) | |||||||||||||||
| Net Income | - | - | - | - | 4,522 | 4,522 | |||||||||||||||||
| Balance as of March 25, 2017 | 7,044 | $ | 3,522 | $ | 12,996 | $ | (414 | ) | $ | 27,297 | $ | 43,401 | |||||||||||
| Issuance of Common Stock | 114 | 57 | 874 | - | - | 931 | |||||||||||||||||
| Repurchase of Common Stock | (28 | ) | (14 | ) | (213 | ) | - | (133 | ) | (360 | ) | ||||||||||||
| Stock-Based Compensation | 25 | 13 | 1,398 | - | - | 1,411 | |||||||||||||||||
| Redemption of Stock Options | - | - | (90 | ) | - | - | (90 | ) | |||||||||||||||
| Other Comprehensive Loss | - | - | - | 133 | - | 133 | |||||||||||||||||
| Net Income | - | - | - | - | 5,922 | 5,922 | |||||||||||||||||
| Balance as of March 31, 2018 | 7,155 | $ | 3,578 | $ | 14,965 | $ | (281 | ) | $ | 33,086 | $ | 51,348 | |||||||||||
See accompanying notes to consolidated financial statements.
38
TRANSCAT, INC.
NOTES TO CONSOLIDATED FINANCIAL STATEMENTS
(In Thousands, Except Per Share and Per Unit Amounts)
NOTE 1 – GENERAL
Description of Business: Transcat, Inc. (“Transcat” or the “Company”) is a leading provider of accredited calibration and laboratory instrument services and a value-added distributor of professional grade handheld test, measurement and control instrumentation. The Company is focused on providing services and products to highly regulated industries, particularly the life science industry, which includes pharmaceutical, biotechnology, medical device and other FDA-regulated businesses. Additional industries served include industrial manufacturing; energy and utilities, including oil and gas and alternative energy; FAA-regulated businesses, including aerospace and defense; and other industries that require accuracy in their processes, confirmation of the capabilities of their equipment, and for which the risk of failure is very costly.
Principles of Consolidation: The consolidated financial statements of Transcat include the accounts of Transcat and the Company’s wholly-owned subsidiaries, Transcat Canada Inc., United Scale & Engineering Corporation, WTT Real Estate Acquisition, LLC and Anmar Metrology, Inc. All intercompany balances and transactions have been eliminated in consolidation.
Use of Estimates: The preparation of Transcat’s Consolidated Financial Statements in accordance with accounting principles generally accepted in the United States (“GAAP”) requires that the Company make estimates and assumptions that affect the reported amounts of assets and liabilities, and the disclosure of contingent assets and liabilities at the date of the financial statements, and the reported amounts of revenues and expenses during the reporting period. Significant estimates and assumptions are used for, but not limited to, allowance for doubtful accounts and returns, inventory reserves, estimated levels of achievement for performance-based restricted stock units, fair value of stock options, depreciable lives of fixed assets, estimated lives of major catalogs and intangible assets, and the valuation of assets acquired and liabilities assumed in business acquisitions. Future events and their effects cannot be predicted with certainty; accordingly, accounting estimates require the exercise of judgment. The accounting estimates used in the preparation of the Consolidated Financial Statements will change as new events occur, as more experience is acquired, as additional information is obtained and as the operating environment changes. Actual results could differ from those estimates. Such changes and refinements in estimation methodologies are reflected in reported results of operations in the period in which the changes are made and, if material, their effects are disclosed in the Notes to the Consolidated Financial Statements.
Fiscal Year: Transcat operates on a 52/53 week fiscal year, ending the last Saturday in March. In a 52-week fiscal year, each of the four quarters is a 13-week period. In a 53-week fiscal year, the last quarter is a 14-week period. The fiscal year ended March 31, 2018 (“fiscal year 2018”) consisted of 53 weeks while the fiscal year ended March 25, 2017 (“fiscal year 2017”) consisted of 52 weeks.
Accounts Receivable: Accounts receivable represent amounts due from customers in the ordinary course of business. These amounts are recorded net of the allowance for doubtful accounts and returns in the Consolidated Balance Sheets. The allowance for doubtful accounts is based upon the expected collectability of accounts receivable. Transcat applies a specific formula to its accounts receivable aging, which may be adjusted on a specific account basis where the formula may not appropriately reserve for loss exposure. After all attempts to collect a receivable have failed, the receivable is written-off against the allowance for doubtful accounts. The returns reserve is calculated based upon the historical rate of returns applied to revenues over a specific timeframe. The returns reserve will increase or decrease as a result of changes in the level of revenue and/or the historical rate of returns.
Inventory: Inventory consists of products purchased for resale and is valued at the lower of cost or net realizable value. Costs are determined using the average cost method of inventory valuation. Inventory is reduced by a reserve for items not saleable at or above cost by applying a specific loss factor, based on historical experience, to specific categories of inventory. The Company evaluates the adequacy of the reserve on a quarterly basis. At March 31, 2018 and March 25, 2017, the Company had reserves for inventory losses totaling $0.4 million and $0.6 million, respectively.
Property and Equipment, Depreciation and Amortization: Property and equipment are stated at cost. Depreciation and amortization are computed primarily under the straight-line method over the following estimated useful lives:
| Years | ||
| Machinery, Equipment and Software | 2 – 15 | |
| Rental Equipment | 5 – 8 | |
| Furniture and Fixtures | 3 – 10 | |
| Leasehold Improvements | 2 – 10 | |
| Buildings | 39 |
39
Property and equipment determined to have no value are written off at their then remaining net book value. Transcat capitalizes certain costs incurred in the procurement and development of computer software used for internal purposes. Leasehold improvements are amortized under the straight-line method over the estimated useful life or the lease term, whichever is shorter. Maintenance and repairs are expensed as incurred. See Note 2 for further information on property and equipment.
Business Acquisitions: The Company applies the acquisition method of accounting for business acquisitions. Under the acquisition method, the purchase price of an acquisition is assigned to the underlying tangible and intangible assets acquired and liabilities assumed based on their respective fair values at the date of acquisition. The Company uses a valuation hierarchy, as further described under Fair Value of Financial Instruments below, and typically utilizes independent third-party valuation specialists to determine the fair values used in this allocation. Purchase price allocations are subject to revision within the measurement period, not to exceed one year from the date of acquisition. Costs to acquire a business may include, but are not limited to, fees for accounting, legal and valuation services, and are expensed as incurred in the Consolidated Statements of Income.
Goodwill and Intangible Assets: Goodwill represents the excess of the purchase price over the fair values of the underlying net assets of an acquired business. Intangible assets, namely customer base and covenants not to compete, represent an allocation of purchase price to identifiable intangible assets of an acquired business. The Company estimates the fair value of its reporting units using the fair market value measurement requirement.
The Company tests goodwill for impairment on an annual basis, or immediately if conditions indicate that such impairment could exist. Other intangible assets are evaluated for impairment when events or changes in business circumstances indicate that the carrying amount of the assets may not be fully recoverable. The Company determined that no impairment was indicated as of March 31, 2018 and March 25, 2017. A summary of changes in the Company’s goodwill and intangible assets is as follows:
| Goodwill | Intangible Assets | ||||||||||||||||||||||
| Distribution | Service | Total | Distribution | Service | Total | ||||||||||||||||||
| Net Book Value as of March 26, 2016 | $ | 8,031 | $ | 21,081 | $ | 29,112 | $ | 124 | $ | 8,087 | $ | 8,211 | |||||||||||
| Additions (see Note 9) | 1,728 | 1,733 | 3,461 | 1,045 | 1,045 | 2,090 | |||||||||||||||||
| Amortization | - | - | - | (413 | ) | (2,362 | ) | (2,775 | ) | ||||||||||||||
| Currency Translation Adjustment | - | (53 | ) | (53 | ) | - | (7 | ) | (7 | ) | |||||||||||||
| Net Book Value as of March 25, 2017 | $ | 9,759 | $ | 22,761 | $ | 32,520 | $ | 756 | $ | 6,763 | $ | 7,519 | |||||||||||
| Additions (see Note 9) | - | - | - | - | - | - | |||||||||||||||||
| Amortization | - | - | - | (269 | ) | (1,803 | ) | (2,072 | ) | ||||||||||||||
| Currency Translation Adjustment | - | 220 | 220 | - | 58 | 58 | |||||||||||||||||
| Net Book Value as of March 31, 2018 | $ | 9,759 | $ | 22,981 | $ | 32,740 | $ | 487 | $ | 5,018 | $ | 5,505 | |||||||||||
The intangible assets are being amortized on an accelerated basis over their estimated useful lives of up to 10 years. Amortization expense relating to intangible assets is expected to be $1.6 million in fiscal year 2019, $1.2 million in fiscal year 2020, $0.9 million in fiscal year 2021, $0.6 million in fiscal year 2022 and $0.5 million in fiscal year 2023.
Catalog Costs: Transcat capitalizes the cost of each Master Catalog mailed and amortizes the cost over the respective catalog’s estimated productive life. The Company reviews response results from catalog mailings on a continuous basis, and if warranted, modifies the period over which costs are recognized. The Company amortizes the cost of each Master Catalog over an eighteen-month period and amortizes the cost of each catalog supplement over a three-month period. Total unamortized catalog costs, included as a component of prepaid expenses and other current assets on the Consolidated Balance Sheets, were $0.1 million as of March 31, 2018 and March 25, 2017.
Deferred Taxes: Transcat accounts for certain income and expense items differently for financial reporting purposes than for income tax reporting purposes. Deferred taxes are provided in recognition of these temporary differences. If necessary, a valuation allowance on net deferred tax assets is provided for items for which it is more likely than not that the benefit of such items will not be realized based on an assessment of both positive and negative evidence. See Note 4 for further discussion on income taxes.
40
Fair Value of Financial Instruments: Transcat has determined the fair value of debt and other financial instruments using a valuation hierarchy. The hierarchy, which prioritizes the inputs used in measuring fair value, consists of three levels. Level 1 uses observable inputs such as quoted prices in active markets; Level 2 uses inputs other than quoted prices in active markets that are either directly or indirectly observable; and Level 3, which is defined as unobservable inputs in which little or no market data exists, requires the Company to develop its own assumptions. The carrying amount of debt on the Consolidated Balance Sheets approximates fair value due to variable interest rate pricing, and the carrying amounts for cash, accounts receivable and accounts payable approximate fair value due to their short-term nature. Investment assets, which fund the Company’s non-qualified deferred compensation plan, consist of mutual funds and are valued based on Level 1 inputs. At each of March 31, 2018 and March 25, 2017, investment assets totaled $0.7 million and are included as a component of other assets (non-current) on the Consolidated Balance Sheets.
Stock-Based Compensation: The Company measures the cost of services received in exchange for all equity awards granted, including stock options and restricted stock units, based on the fair market value of the award as of the grant date. The Company records compensation cost related to unvested equity awards by recognizing, on a straight-line basis, the unamortized grant date fair value over the remaining service period of each award. The Financial Accounting Standards Board (“FASB”) issued ASU 2016-09 to simplify certain aspects of the accounting for share-based payment transactions to employees. The Company elected to early adopt this ASU in the fourth quarter of fiscal year 2017. Upon adoption, excess tax benefits for share-based award activity are reflected in the statement of income as a component of the provision for income taxes. Excess tax benefits are realized benefits from tax deductions for exercised awards in excess of the deferred tax asset attributable to stock-based compensation costs for such awards. The Company did not capitalize any stock-based compensation costs as part of an asset. The Company estimates forfeiture rates based on its historical experience. During fiscal years 2018 and 2017, the Company recorded non-cash stock-based compensation cost in the amount of $1.4 million and $0.5 million, respectively, in the Consolidated Statements of Income.
Revenue Recognition: Distribution sales are recorded when an order’s title and risk of loss transfers to the customer. The Company recognizes the majority of its Service revenue based upon when the calibration or other activity is performed and then shipped and/or delivered to the customer. Some Service revenue is generated from managing customers’ calibration programs in which the Company recognizes revenue in equal amounts at fixed intervals. The Company generally invoices its customers for freight, shipping, and handling charges. Provisions for customer returns are provided for in the period the related revenue is recorded based upon historical data.
Vendor Rebates: Vendor rebates are generally based on specified cumulative levels of purchases and/or incremental distribution sales and are recorded as a reduction of cost of distribution sales. Purchase rebates are calculated and recorded quarterly based upon the volume of purchases with specific vendors during the quarter. Point of sale rebate programs that are based on year-over-year sales performance on a calendar year basis are recorded as earned, on a quarterly basis, based upon the expected level of annual achievement. Point of sale rebate programs that are based on year-over-year sales performance on a quarterly basis are recorded as earned in the respective quarter. The Company recorded vendor rebates of $1.4 million and $1.5 million in fiscal years 2018 and 2017, respectively as a reduction of cost of distribution sales.
Cooperative Advertising Income: Transcat records cash consideration received from vendors for advertising as a reduction of cost of distribution sales. The Company recorded consideration in the amount of $1.7 million in each of the fiscal years 2018 and 2017.
Advertising Costs: Advertising costs, other than catalog costs, are expensed as they are incurred and are included in Selling, Marketing and Warehouse Expenses in the Consolidated Statements of Income. Advertising costs were approximately $0.8 million and $1.2 million in fiscal years 2018 and 2017, respectively.
Shipping and Handling Costs: Freight expense and direct shipping costs are included in the cost of revenue. These costs totaled approximately $2.5 million and $2.2 million in fiscal years 2018 and 2017, respectively. Direct handling costs, the majority of which represent direct compensation of employees who pick, pack, and prepare merchandise for shipment to customers, are reflected in selling, marketing and warehouse expenses. Direct handling costs were $0.9 million in each of the fiscal years 2018 and 2017.
Foreign Currency Translation and Transactions: The accounts of Transcat Canada Inc. are maintained in the local currency and have been translated to U.S. dollars. Accordingly, the amounts representing assets and liabilities have been translated at the period-end rates of exchange, and related revenue and expense accounts have been translated at an average rate of exchange during the period. Gains and losses arising from translation of Transcat Canada Inc.’s financial statements into U.S. dollars are recorded directly to the accumulated other comprehensive income (loss) component of shareholders’ equity.
41
Transcat records foreign currency gains and losses on business transactions denominated in foreign currency. The net foreign currency loss was less than $0.1 million in each of the fiscal years 2018 and 2017. The Company continually utilizes short-term foreign exchange forward contracts to reduce the risk that its earnings would be adversely affected by changes in currency exchange rates. The Company does not apply hedge accounting and therefore the net change in the fair value of the contracts, which totaled a net loss of less than $0.1 million in fiscal year 2018 and a net gain of less than $0.1 million in 2017, was recognized as a component of other expense in the Consolidated Statements of Income. The change in the fair value of the contracts is offset by the change in fair value on the underlying accounts receivables denominated in Canadian dollars being hedged. On March 31, 2018, the Company had a foreign exchange contract, which matured in April 2018, outstanding in the notional amount of $5.1 million. This contract was subsequently renewed and remains in place. The Company does not use hedging arrangements for speculative purposes.
Other Comprehensive Income: Comprehensive income is composed of currency translation adjustments, unrecognized prior service costs, net of tax, and unrealized gains or losses on other assets, net of tax. At March 31, 2018, accumulated other comprehensive income consisted of cumulative currency translation losses of $0.1 million, unrecognized prior service costs, net of tax, of $0.2 million and an unrealized gain on other assets, net of tax, of less than $0.1 million. At March 25, 2017, accumulated other comprehensive income consisted of cumulative currency translation losses of $0.3 million, unrecognized prior service costs, net of tax, of $0.1 million and an unrealized gain on other assets, net of tax, of less than $0.1 million.
Earnings per Share: Basic earnings per share of common stock are computed based on the weighted average number of shares of common stock outstanding during the period. Diluted earnings per share of common stock reflect the assumed conversion of stock options and unvested restricted stock units using the treasury stock method in periods in which they have a dilutive effect. In computing the per share effect of assumed conversion, proceeds received from the exercise of options and unvested restricted stock units and the related tax benefits are considered to have been used to purchase shares of common stock at the average market prices during the period, and the resulting net additional shares of common stock are included in the calculation of average shares of common stock outstanding.
For fiscal years 2018 and 2017, the net additional common stock equivalents had a $0.02 and $0.01 per share effect on the calculation of dilutive earnings per share, respectively. The average shares outstanding used to compute basic and diluted earnings per share are as follows:
| For the Years Ended | ||||
| March 31, | March 25, | |||
| 2018 | 2017 | |||
| Average Shares Outstanding – Basic | 7,124 | 6,994 | ||
| Effect of Dilutive Common Stock Equivalents | 179 | 117 | ||
| Average Shares Outstanding – Diluted | 7,303 | 7,111 | ||
| Anti-dilutive Common Stock Equivalents | - | - | ||
Shareholders’ Equity: During each of fiscal years 2018 and 2017, the Company repurchased and subsequently retired less than 0.1 million shares of its common stock. Under letter agreements approved by the Board of Directors, the Company redeemed certain stock options that were previously issued pursuant to the shareholder approved Transcat, Inc. 2003 Incentive Plan, as Amended and Restated (the “2003 Plan”) for $0.1 million in fiscal year 2018 and $1.0 million in fiscal year 2017.
Recently Issued Accounting Pronouncements:
Revenue Recognition
In May 2014, the FASB issued Accounting Standards Update ("ASU") No. 2014-09, Revenue from Contracts with Customers, which establishes principles to report useful information to financial statements users about the nature, timing and uncertainty of revenue from contracts with customers. ASU No. 2014-09 along with various related amendments comprise Accounting Standards Codification (“ASC”) Topic 606, Revenue from Contracts with Customers, and provide guidance that is applicable to all contracts with customers regardless of industry-specific or transaction-specific fact patterns. The new standard and its related updates are effective for the Company on April 1, 2018. On the effective date, the Company will apply the new guidance using the modified retrospective approach to each prior reporting period presented. The cumulative effect adjustment upon adoption of the ASU in the first quarter of fiscal 2019 is expected to be immaterial.
Overall, the new standard will not have a material impact on the results of the Company's operations or consolidated statements of financial position, but will change the presentation and timing of certain revenue transactions. The Company's evaluation of the new standards included a review of certain vendor arrangements to determine whether the Company acts as principal or agent in such arrangements. The Company does not expect material changes in gross versus net presentation as a result of the adoption of the new standard. There are enhanced disclosure requirements under this standard.
42
Leases
In February 2016, the FASB issued ASU No. 2016-02, Leases (ASC Topic 842), which requires lessees to recognize substantially all leases on-balance sheet and disclose key information about leasing arrangements. The new standard establishes a right of use ("ROU") model that requires a lessee to recognize a ROU asset and lease liability on the balance sheet for all leases with a term longer than 12 months. Leases will be classified as finance or operating, with classification affecting the pattern and classification of expense recognition in the income statement.
The new standard is effective for annual and interim periods beginning after December 15, 2018. ASU 2016-02 requires entities to adopt a modified retrospective transition method for leases existing at, or entered into after, the beginning of the earliest comparative period presented in the consolidated financial statements.
The Company continues to evaluate the impact that adopting ASU 2016-02 will have on its financial statements, but the most significant impact will be to increase assets and liabilities on the consolidated balance sheet by the present value of the Company’s leasing obligations, which are primarily related to facility and vehicle leases, as well as additional disclosures required.
Retirement Plan
In March 2017, the FASB issued ASU 2017-07 to Topic 715, Compensation—Retirement Benefits. This ASU provides new guidance as part of FASB’s effort to improve employers’ financial reporting for defined benefit plans. This new guidance changes where on the income statement employers that sponsor defined benefit pension and/or other postretirement benefit plans present the net periodic benefit cost. Under the new guidance, employers will present the service cost component of the net periodic benefit cost in the same income statement line item(s) as other employee compensation costs arising from services rendered during the period. In addition, only the service cost component will be eligible for capitalization in assets. Employers will present the other components separately from the line item(s) that includes the service cost and outside of any subtotal of operating income, if one is presented. Employers will have to disclose the line(s) used to present the other components of net periodic benefit cost, if the components are not presented separately in the income statement. This ASU is effective for fiscal years beginning after December 15, 2017, and interim periods within those years with early adoption permitted. For fiscal years 2018 and 2017, the net periodic benefit cost was approximately $0.1 million. The Company does not expect adoption of this ASU to have a material impact on its Consolidated Financial Statements.
Goodwill
In January 2017, the FASB issued ASU 2017-04, Simplifying the Test for Goodwill Impairment (Topic 350). This ASU simplifies the accounting for goodwill impairment for all entities by requiring impairment charges to be based on the first step in today’s two-step impairment test under ASC 350. Under the new guidance, if the carrying amount of a reporting unit’s goodwill exceeds its fair value, an entity will record an impairment charge based on that difference. The impairment charge will be limited to the amount of goodwill allocated to that reporting unit. This ASU simplifies today’s requirement to calculate a goodwill impairment charge using a separately calculated implied fair value. This ASU is effective for annual and interim reporting periods beginning after December 15, 2019. Early adoption is permitted beginning January 1, 2017. The Company does not expect adoption of this ASU to have a material impact on its Consolidated Financial Statements.
Comprehensive Income
In February 2018, the FASB issued ASU No. 2018-02, Income Statement - Reporting Comprehensive Income (Topic 220): Reclassification of Certain Tax Effects from Accumulated Other Comprehensive Income. This ASU allows for stranded tax effects in accumulated other comprehensive income resulting from H.R. 1, originally known as the “Tax Cuts and Jobs Act,” to be reclassified to retained earnings. The new standard is effective for all entities for fiscal years beginning after December 15, 2018. Early adoption is permitted. The Company is currently evaluating the impact of adopting the new standard and does not expect the new standard to have a material impact on the Company’s financial position or results of operations.
Reclassification of Amounts: Certain reclassifications of financial information for prior fiscal years have been made to conform to the presentation for the current fiscal year.
43
NOTE 2 – PROPERTY AND EQUIPMENT
Property and equipment consists of:
| March 31, | March 25, | |||||||
| 2018 | 2017 | |||||||
| Machinery, Equipment and Software | $ | 36,460 | $ | 32,733 | ||||
| Rental Equipment | 5,709 | 4,461 | ||||||
| Furniture and Fixtures | 2,473 | 2,405 | ||||||
| Leasehold Improvements | 2,597 | 2,491 | ||||||
| Buildings and Land | 500 | 500 | ||||||
| Total Property and Equipment | 47,739 | 42,590 | ||||||
| Less: Accumulated Depreciation and Amortization | (30,648 | ) | (27,022 | ) | ||||
| Total Property and Equipment, net | $ | 17,091 | $ | 15,568 | ||||
Total depreciation and amortization expense relating to property and equipment amounted to $3.8 million and $3.3 million in fiscal years 2018 and 2017, respectively.
NOTE 3 – LONG-TERM DEBT
Description: On October 30, 2017, the Company entered into an Amended and Restated Credit Agreement (the “2017 Agreement”), which amended and restated our prior credit facility agreement. The 2017 Agreement extended the term of the Company’s $30.0 million revolving credit facility (the “Revolving Credit Facility”) to October 29, 2021. As of March 31, 2018, $30.0 million was available under the Revolving Credit Facility, of which $8.7 million was outstanding and included in long-term debt on the Consolidated Balance Sheet. The 2017 Agreement also increased the amount of the Company’s outstanding term loan to $15.0 million (the “2017 Term Loan”), replacing the previous term loan. The excess funds of the 2017 Term Loan over the previous term loan were used to repay amounts outstanding under the Revolving Credit Facility. As of March 31, 2018, $14.1 million was outstanding on the 2017 Term Loan, of which $2.1 million was included in current liabilities on the Consolidated Balance Sheet with the remainder included in long-term debt. The 2017 Term Loan requires principal repayments of $0.2 million per month plus interest through September 2022 with a $4.3 million repayment required on October 29, 2022. Under the 2017 Agreement, borrowings that may be used for business acquisitions are limited to $20.0 million per fiscal year. During the first nine months of fiscal year 2018, no borrowings were used for business acquisitions.
Previously, on March 31, 2016, the Company entered into Amendment 3 (“Amendment 3”) to the prior credit agreement. Under Amendment 3, borrowings that could be used for business acquisitions were limited to $15.0 million in fiscal years 2018 and 2019. Amendment 3 also provided the Company with a $10.0 million term loan. The term loan required principal repayments of $0.1 million per month plus interest. Total annual repayment amounts of $1.4 million were required in fiscal years 2017 through 2021 with a $3.0 million repayment required in fiscal year 2022. Amendment 3 also increased the allowable leverage ratio to a maximum of 3.0 from 2.75. As described above, in the third quarter of fiscal year 2018, we entered into the 2017 Agreement that amended and restated the prior credit agreement, including Amendment 3. The allowable leverage ratio under the 2017 Agreement remains at a maximum multiple of 3.0 of total debt outstanding compared to earnings before income taxes, depreciation and amortization, and non-cash stock-based compensation expense for the preceding four consecutive fiscal quarters.
Interest and Other Costs: Interest on the Revolving Credit Facility and term loan accrues, at Transcat’s election, at either the variable one-month London Interbank Offered Rate (“LIBOR”) or a fixed rate for a designated period at the LIBOR corresponding to such period, in each case, plus a margin. Commitment fees accrue based on the average daily amount of unused credit available on the Revolving Credit Facility. Interest rate margins and commitment fees are determined on a quarterly basis based upon the Company’s calculated leverage ratio, as defined in the 2017 Agreement. The one-month LIBOR as of March 31, 2018 was 1.9%. The Company’s interest rate for fiscal year 2018 ranged from 3.0% to 3.6%.
Covenants: The Credit Agreement has certain covenants with which the Company has to comply, including a fixed charge coverage ratio covenant and a leverage ratio covenant. The Company was in compliance with all loan covenants and requirements during fiscal years 2018 and 2017.
Other Terms: The Company has pledged all of its U.S. tangible and intangible personal property, the equity interests of its U.S.-based subsidiaries, and a majority of the common stock of Transcat Canada Inc. as collateral security for the loans made under the Revolving Credit Facility.
NOTE 4 – INCOME TAXES
On December 22, 2017, the Tax Cuts and Jobs Act (H.R. 1), the tax reform bill (the "Tax Act"), was signed into law. The Tax Act includes numerous changes to existing tax law, including a permanent reduction in the federal corporate income tax rate from 35% to 21%. Since the Company is a fiscal year taxpayer, the lower corporate income tax rate will be phased in and the U.S. federal tax rate recorded is a blended rate of the old rates and the new rates for fiscal year 2018.
The Company has concluded that the Tax Act will cause the Company’s U.S. deferred tax assets and liabilities to be revalued. Deferred income taxes result from temporary differences between the tax basis of assets and liabilities and their reported basis in the financial statements that will result in taxable or deductible amounts in future years. Deferred tax assets and liabilities are measured using enacted tax rates expected to apply to taxable income in years in which those temporary differences are expected to be recovered or settled. As changes in tax laws or rates are enacted, deferred tax assets and liabilities are revalued and any change is adjusted through the provision for income tax expense in the reporting period of the enactment.
44
In addition, the Tax Act provides for a one-time “deemed repatriation” of accumulated foreign earnings. The Company has estimated the additional provision for income tax expense on the repatriation to be less than $0.1 million. The Company will pay any amounts owed over eight years.
On December 22, 2017, the SEC staff issued Staff Accounting Bulletin No. 118 to address the application of U.S. GAAP in situations when a registrant does not have the necessary information available, prepared, or analyzed (including computations) in reasonable detail to complete the accounting for certain income tax effects of the Tax Act. The Company has recognized the provisional tax impacts related to the revaluation of the deferred tax assets and liabilities and other applicable provisions of the Tax Act and included these amounts in its consolidated financial statements for the year ended March 31, 2018. As of March 31, 2018, the Company has completed the majority of the accounting for the tax effects of the Tax Act. If revisions are needed as new information becomes available, the final determination of the deemed revaluation of our deferred tax assets and liabilities or other applicable provisions of the Tax Act will be completed as additional information becomes available, but no later than one year from the enactment of the Tax Act.
Transcat’s income before income taxes on the Consolidated Statements of Income is as follows:
| FY 2018 | FY 2017 | |||||
| United States | $ | 6,995 | $ | 6,770 | ||
| Foreign | 953 | 394 | ||||
| Total | $ | 7,948 | $ | 7,164 | ||
The provision for income taxes for fiscal years 2018 and 2017 is as follows:
| FY 2018 | FY 2017 | |||||||
| Current Tax Provision: | ||||||||
| Federal | $ | 952 | $ | 1,945 | ||||
| State | 201 | 344 | ||||||
| Foreign | 340 | 279 | ||||||
| 1,493 | 2,568 | |||||||
| Deferred Tax (Benefit) Provision: | ||||||||
| Federal | $ | 487 | $ | 194 | ||||
| State | 156 | 26 | ||||||
| Foreign | (110 | ) | (146 | ) | ||||
| 533 | 74 | |||||||
| Provision for Income Taxes | $ | 2,026 | $ | 2,642 | ||||
A reconciliation of the income tax provision computed by applying the statutory U.S. federal income tax rate and the income tax provision reflected in the Consolidated Statements of Income is as follows:
| FY 2018 | FY 2017 | |||||||
| Federal Income Tax at Statutory Rate | $ | 2,448 | $ | 2,436 | ||||
| State Income Taxes, net of federal benefit | 295 | 284 | ||||||
| Federal, State and Foreign Research & Development Credits | (107 | ) | 118 | |||||
| Impact of Tax Act | (535 | ) | - | |||||
| Other, net | (75 | ) | (196 | ) | ||||
| Total | $ | 2,026 | $ | 2,642 | ||||
45
The components of net deferred tax assets (liabilities) are as follows:
| March 31, | March 25, | |||||||
| 2018 | 2017 | |||||||
| Deferred Tax Assets: | ||||||||
| Accrued Liabilities | $ | 247 | $ | 338 | ||||
| Performance-Based Stock Award Grants | 337 | 337 | ||||||
| Inventory Reserves | 82 | 213 | ||||||
| Non-Qualified Deferred Compensation Plan | 172 | 273 | ||||||
| Post-Retirement Health Care Plans | 294 | 425 | ||||||
| Stock-Based Compensation | 199 | 717 | ||||||
| Capitalized Inventory Costs | 122 | 140 | ||||||
| Net Operating Loss Carryforward | - | 12 | ||||||
| Other | 233 | 277 | ||||||
| Total Deferred Tax Assets | $ | 1,686 | $ | 2,732 | ||||
| Deferred Tax Liabilities: | ||||||||
| Goodwill and Intangible Assets | $ | (1,085 | ) | $ | (1,486 | ) | ||
| Depreciation | (2,264 | ) | (2,335 | ) | ||||
| Other | (46 | ) | (45 | ) | ||||
| Total Deferred Tax Liabilities | (3,395 | ) | (3,866 | ) | ||||
| Net Deferred Tax Liabilities | $ | (1,709 | ) | $ | (1,134 | ) | ||
Deferred U.S. income taxes have not been recorded for basis differences related to the investments in the Company’s foreign subsidiary. The Company considers undistributed earnings, if any, as permanently reinvested in the subsidiary. The determination of a deferred tax liability on unremitted earnings would not be practicable because such liability, if any, would depend on circumstances existing if and when remittance occurs.
The Company files income tax returns in the U.S. federal jurisdiction, various states and Canada. The Company is no longer subject to examination by U.S. federal income tax authorities for fiscal years 2014 and prior, by state tax authorities for fiscal years 2012 and prior, and by Canadian tax authorities for fiscal years 2010 and prior. There are no tax years currently under examination by U.S. federal, state or Canadian tax authorities.
During fiscal years 2018 and 2017, there were no uncertain tax positions. No interest or penalties related to uncertain tax positions were recognized in fiscal years 2018 and 2017 or were accrued at March 31, 2018 and March 25, 2017.
The Company’s effective tax rate for fiscal years 2018 and 2017 was 25.5% and 31.3%, respectively. Its tax rate is affected by recurring items, such as tax rates in foreign jurisdictions and the relative amounts of income the Company earns in those jurisdictions, which the Company expects to be fairly consistent in the near term. It is also affected by discrete items that may occur in any given year but are not consistent from year to year.
The Company expects to receive certain federal, state and Canadian tax credits in future years. As such, it expects its effective tax rate in fiscal year 2019 to be between 25.0% and 27.0%.
NOTE 5 – EMPLOYEE BENEFIT PLANS
Defined Contribution Plan. All of Transcat’s U.S. based employees are eligible to participate in a defined contribution plan, the Long-Term Savings and Deferred Profit Sharing Plan (the “Plan”), provided they meet certain qualifications. Currently, the Company matches 50% of the first 6% of pay that eligible employees contribute to the Plan.
In the long-term savings portion of the Plan (the “401K Plan”), plan participants are entitled to a distribution of their vested account balance upon termination of employment or retirement. Plan participants are fully vested in their contributions while Company contributions are fully vested after three years of service. The Company’s matching contributions to the 401K Plan were $0.7 million in each of fiscal years 2018 and 2017, respectively.
In the deferred profit sharing portion of the Plan, Company contributions are made at the discretion of the board of directors. The Company made no profit sharing contributions in fiscal years 2018 and 2017.
Employee Stock Purchase Plan. The Company has an Employee Stock Purchase Plan (the “ESPP”) that allows for eligible employees as defined in the ESPP to purchase common shares of the Company through payroll deductions at a price that is 85% of the closing market price on the second last business day of each calendar month (the “Investment Date”). 650,000 shares can be purchased under the ESPP. The difference between the closing market price on the Investment Date and the price paid by employees is recorded as a General and Administrative expense in the accompanying Consolidated Statements of Income. The expense related to the ESPP was less than $0.1 million in each of fiscal years 2018 and 2017.
46
Non-Qualified Deferred Compensation Plan. The Company has available a non-qualified deferred compensation plan (the “NQDC Plan”) for directors and officers. Participants are fully vested in their contributions. At its discretion, the Company may elect to match employee contributions, subject to legal limitations in conjunction with the 401K Plan, which fully vest after three years of service. During fiscal years 2018 and 2017, the Company did not match any employee contributions. Participant accounts are adjusted to reflect performance, whether positive or negative, of selected investment options chosen by each participant during the deferral period. In the event of bankruptcy, the assets of the NQDC Plan are available to satisfy the claims of the Company’s general creditors. The liability for compensation deferred under the NQDC Plan was $0.7 million as of March 31, 2018 and March 25, 2017 and is included as a component of other liabilities (non-current) on the Consolidated Balance Sheets.
Post-retirement Health Care Plans. The Company has a defined benefit post-retirement health care plan which provides long-term care insurance benefits, medical and dental insurance benefits and medical premium reimbursement benefits to eligible retired corporate officers and their eligible spouses (the “Officer Plan”).
The change in the postretirement benefit obligation is as follows:
| FY 2018 | FY 2017 | |||||||
| Post-retirement benefit obligation, at beginning of fiscal year | $ | 1,105 | $ | 1,006 | ||||
| Service cost | 34 | 30 | ||||||
| Interest cost | 44 | 38 | ||||||
| Benefits paid | (72 | ) | (79 | ) | ||||
| Actuarial loss | 42 | 110 | ||||||
| Post-retirement benefit obligation, at end of fiscal year | 1,153 | 1,105 | ||||||
| Fair value of plan assets, at end of fiscal year | - | - | ||||||
| Funded status, at end of fiscal year | $ | (1,153 | ) | $ | (1,105 | ) | ||
| Accumulated post-retirement benefit obligation, at end of fiscal year | $ | 1,153 | $ | 1,105 | ||||
The accumulated postretirement benefit obligation is included as a component of other liabilities (non-current) in the Consolidated Balance Sheets. The components of net periodic postretirement benefit cost and other amounts recognized in other comprehensive income are as follows:
| FY 2018 | FY 2017 | |||||||
| Net periodic postretirement benefit cost: | ||||||||
| Service cost | $ | 34 | $ | 30 | ||||
| Interest cost | 44 | 38 | ||||||
| Amortization of prior service cost | 1 | 25 | ||||||
| 79 | 93 | |||||||
| Benefit obligations recognized in other comprehensive income: | ||||||||
| Amortization of prior service cost | (1 | ) | (25 | ) | ||||
| Net gain (loss) | 4 | 95 | ||||||
| 3 | 70 | |||||||
| Total recognized in net periodic benefit cost and other comprehensive income | $ | 82 | $ | 163 | ||||
| Amount recognized in accumulated other comprehensive income, at end of fiscal year: | ||||||||
| Unrecognized prior service cost | $ | 235 | $ | 233 | ||||
The prior service cost is amortized over the average remaining life expectancy of active participants in the Officer Plan. The estimated prior service cost that will be amortized from accumulated other comprehensive income into net periodic postretirement benefit cost during fiscal year 2019 is less than $0.1 million.
47
The postretirement benefit obligation was computed by an independent third-party actuary. Assumptions used to determine the postretirement benefit obligation and the net periodic postretirement benefit cost were as follows:
| March 31, | March 25, | |||||
| 2018 | 2017 | |||||
| Weighted average discount rate | 4.0 | % | 4.1 | % | ||
| Medical care cost trend rate: | ||||||
| Trend rate assumed for next year | 8.0 | % | 8.0 | % | ||
| Ultimate trend rate | 6.0 | % | 6.0 | % | ||
| Year that rate reaches ultimate trend rate | 2024 | 2023 | ||||
| Dental care cost trend rate: | ||||||
| Trend rate assumed for next year and remaining at that level thereafter | 5.0 | % | 5.0 | % | ||
Benefit payments are funded by the Company as needed. Payments toward the cost of a retiree’s medical and dental coverage are initially determined as a percentage of a base coverage plan in the year of retirement and are limited to increase at a rate of no more than 50% of the annual increase in medical and dental costs, as defined in the plan document. The following benefit payments, which reflect expected future service, as appropriate, are expected to be paid as follows:
| Fiscal | |||
| Year | Amount | ||
| 2019 | $ | 102 | |
| 2020 | 103 | ||
| 2021 | 108 | ||
| 2022 | 112 | ||
| 2023 | 80 | ||
| Thereafter | 648 | ||
Increasing the assumed health care cost trend rate by one percentage point would increase the accumulated postretirement benefit obligation and the annual net periodic postretirement benefit cost by $0.1 million. A one percentage point decrease in the healthcare cost trend would decrease the accumulated postretirement benefit obligation and the annual net periodic postretirement benefit cost by $0.1 million.
NOTE 6 – STOCK-BASED COMPENSATION
The 2003 Plan provides for, among other awards, grants of restricted stock units and stock options to directors, officers and key employees at the fair market value at the date of grant. At March 31, 2018, 1.1 million restricted stock units or stock options were available for future grant under the 2003 Plan.
Restricted Stock: The Company grants performance-based restricted stock units as a primary component of executive compensation. The units generally vest following the third fiscal year from the date of grant subject to certain cumulative diluted earnings per share growth targets over the eligible period. Compensation cost ultimately recognized for performance-based restricted stock units will equal the grant date fair market value of the unit that coincides with the actual outcome of the performance conditions. On an interim basis, the Company records compensation cost based on the estimated level of achievement of the performance conditions.
The following table summarizes the performance-based restricted stock units vested and shares issued during fiscal years 2017 and 2018:
| Grant | |||||||||||||
| Total | Date | Number | |||||||||||
| Number | Fair | Target | of | Date | |||||||||
| Date | Measurement | of Units | Value | Level | Shares | Shares | |||||||
| Granted | Period | Granted | Per Unit | Achieved | Issued | Issued | |||||||
| April 2013 | April 2013 - March 2016 | 99 | $ | 6.17 | 50% | 50 | May 2016 | ||||||
| April 2014 | April 2014 - March 2017 | 51 | $ | 9.28 | 50% | 25 | May 2017 | ||||||
48
The following table summarizes the non-vested performance-based restricted stock units outstanding as of March 31, 2018:
| Total | Grant Date | Estimated | |||||||
| Number | Fair | Level of | |||||||
| Date | Measurement | of Units | Value | Achievement at | |||||
| Granted | Period | Granted | Per Unit | March 31, 2018 | |||||
| April 2015 | April 2015 - March 2018 | 63 | $ | 9.59 | 50% of target level | ||||
| April 2016 | April 2016 - March 2019 | 84 | $ | 10.13 | 125% of target level | ||||
| April 2017 | April 2017 – March 2020 | 77 | $ | 12.90 | 100% of target level | ||||
| June 2017 | July 2017 – June 2020 | 3 | $ | 12.00 | Time Vested | ||||
Total expense relating to performance-based restricted stock units, based on grant date fair value and the achievement criteria, was $0.8 million and $0.3 million in fiscal years 2018 and 2017, respectively. Unearned compensation totaled $1.1 million as of March 31, 2018.
Stock Options: Options vest either immediately or over a period of up to four years using a straight-line basis, and expire either five years or ten years from the date of grant. The expense relating to options is recognized on a straight-line basis over the requisite service period for the entire award.
During fiscal year 2018, the Company’s Board of Directors granted stock awards of 165,000 shares of common stock under the 2003 Plan to the Company’s executive management team. These awards were immediately vested. During fiscal year 2017, no stock options were awarded. The expense related to these stock awards was $0.4 million and $0.1 million during fiscal year 2018 and 2017, respectively.
The following table summarizes the Company’s options for fiscal years 2018 and 2017:
| Weighted | Weighted | ||||||||||
| Average | Average | ||||||||||
| Number | Exercise | Remaining | Aggregate | ||||||||
| of | Price Per | Contractual | Intrinsic | ||||||||
| Shares | Share | Term (in Years) | Value | ||||||||
| Outstanding as of March 26, 2016 | 494 | $ | 7.03 | ||||||||
| Exercised | (59 | ) | 7.00 | ||||||||
| Forfeited | (5 | ) | 8.95 | ||||||||
| Redeemed | (188 | ) | 6.40 | ||||||||
| Outstanding as of March 25, 2017 | 242 | 7.48 | |||||||||
| Granted | 165 | 12.00 | |||||||||
| Exercised | (97 | ) | 7.24 | ||||||||
| Forfeited | (17 | ) | 7.65 | ||||||||
| Redeemed | (20 | ) | 7.72 | ||||||||
| Outstanding as of March 31, 2018 | 272 | 10.27 | 5 | $ | 1,464 | ||||||
| Exercisable as of March 31, 2018 | 272 | $ | 10.27 | 5 | $ | 1,464 | |||||
The aggregate intrinsic value in the table above represents the total pre-tax intrinsic value (the difference between the Company’s closing stock price on the last trading day of fiscal year 2018 and the exercise price, multiplied by the number of in-the-money stock options) that would have been received by the option holders had all holders exercised their options on March 31, 2018. The amount of aggregate intrinsic value will change based on the fair market value of the Company’s stock.
Total expense relating to stock options was $0.4 million during fiscal year 2018 and $0.1 million during fiscal year 2017. There was no unrecognized compensation cost related to non-vested stock options as of March 31, 2018. The aggregate intrinsic value of stock options exercised in fiscal years 2018 and 2017 was $0.8 million and $0.3 million, respectively. Cash received from the exercise of options in fiscal years 2018 and 2017 was $0.7 million and $0.4 million, respectively.
49
NOTE 7 – SEGMENT AND GEOGRAPHIC DATA
Transcat has two reportable segments: Distribution and Service. The accounting policies of the reportable segments are the same as those described above in Note 1 to the Consolidated Financial Statements. The Company has no inter-segment sales. The following table presents segment and geographic data for fiscal years 2018 and 2017:
| FY 2018 | FY 2017 | |||||
| Revenue: | ||||||
| Service | $ | 77,445 | $ | 71,103 | ||
| Distribution | 77,696 | 72,795 | ||||
| Total | 155,141 | 143,898 | ||||
| Gross Profit: | ||||||
| Service | 19,922 | 19,039 | ||||
| Distribution | 17,519 | 15,931 | ||||
| Total | 37,441 | 34,970 | ||||
| Operating Expenses: | ||||||
| Service (1) | 14,764 | 14,270 | ||||
| Distribution (1) | 13,651 | 12,766 | ||||
| Total | 28,415 | 27,036 | ||||
| Operating Income: | ||||||
| Service | 5,158 | 4,769 | ||||
| Distribution | 3,868 | 3,165 | ||||
| Total | 9,026 | 7,934 | ||||
| Unallocated Amounts: | ||||||
| Interest and Other Expense, net | 1,078 | 770 | ||||
| Provision for Income Taxes | 2,026 | 2,642 | ||||
| Total | 3,104 | 3,412 | ||||
| Net Income | $ | 5,922 | $ | 4,522 | ||
| Total Assets: | ||||||
| Service | $ | 53,032 | $ | 51,756 | ||
| Distribution | 40,652 | 36,812 | ||||
| Unallocated | 3,138 | 3,529 | ||||
| Total | $ | 96,822 | $ | 92,097 | ||
| Depreciation and Amortization (2): | ||||||
| Service | $ | 4,397 | $ | 4,660 | ||
| Distribution | 1,594 | 1,524 | ||||
| Total | $ | 5,991 | $ | 6,184 | ||
| Capital Expenditures: | ||||||
| Service | $ | 3,772 | $ | 2,662 | ||
| Distribution | 2,110 | 2,588 | ||||
| Total | $ | 5,882 | $ | 5,250 | ||
| Geographic Data: | ||||||
| Revenues to Unaffiliated Customers (3): | ||||||
| United States (4) | $ | 139,456 | $ | 129,732 | ||
| Canada | 13,757 | 12,432 | ||||
| Other International | 1,928 | 1,734 | ||||
| Total | $ | 155,141 | $ | 143,898 | ||
| Property and Equipment: | ||||||
| United States (4) | $ | 15,967 | $ | 14,550 | ||
| Canada | 1,124 | 1,018 | ||||
| Total | $ | 17,091 | $ | 15,568 | ||
50
| (1) |
Operating expense allocations between segments are based on actual amounts, a percentage of revenues, headcount, and management’s estimates. | |
| (2) |
Including amortization of catalog costs and intangible assets. | |
| (3) |
Revenues are attributed to the countries based on the destination of a product shipment or the location where service is rendered. | |
| (4) |
United States includes Puerto Rico. |
NOTE 8 – COMMITMENTS
Leases: Transcat leases facilities, equipment, and vehicles under various non-cancelable operating leases. Total rental expense was approximately $3.1 million and $3.0 million in fiscal years 2018 and 2017, respectively. The minimum future annual rental payments under the non-cancelable leases at March 31, 2018 are as follows (in millions):
| Fiscal Year | |||
| 2019 | $ | 2.1 | |
| 2020 | 1.4 | ||
| 2021 | 1.0 | ||
| 2022 | 0.7 | ||
| 2023 | 0.5 | ||
| Thereafter | 2.6 | ||
| Total minimum lease payments | $ | 8.3 |
Effective April 2018, the Company has term loan payments due at a monthly amount of $0.2 million plus interest. These amounts are not reflected in the table above.
NOTE 9 – BUSINESS ACQUISITIONS
There were no acquisitions during fiscal year 2018. During fiscal year 2017, Transcat completed the following business acquisition:
| ● |
On April 1, 2016, acquired substantially all of the assets of Excalibur Engineering, Inc. (“Excalibur”). Headquartered in Irvine, California, Excalibur is a provider of calibration services, new and used test equipment, and product rentals. |
The acquisition was accounted for using the acquisition method of accounting. Goodwill, calculated as the excess of the purchase price paid over the fair value of the underlying net assets of the businesses acquired, generally represents expected future economic benefits arising from the reputation of an acquired business, the assembled workforce, expected synergies and other assets acquired that could not be individually identified and separately recognized. Intangible assets, namely customer bases and covenants not to compete, represent an allocation of a portion of the purchase price to identifiable intangible assets of the acquired businesses. Intangible assets are being amortized for financial reporting purposes on an accelerated basis over an estimated useful life of up to 10 years.
The total purchase price paid for the business acquired in fiscal year 2017 was approximately $7.6 million, net of less than $0.1 million cash acquired. The following is a summary of the purchase price allocation, in the aggregate, to the fair value, based on Level 3 inputs, of assets and liabilities acquired during each period presented:
| FY 2017 | |||||
| Goodwill | $ | 3,455 | |||
| Intangible Assets – Customer Base | 1,990 | ||||
| Intangible Assets – Covenants Not to Compete | 100 | ||||
| Deferred Tax Liability | - | ||||
| 5,545 | |||||
| Plus: | Current Assets | 973 | |||
| Non-Current Assets | 1,652 | ||||
| Less: | Current Liabilities | (606 | ) | ||
| Non-Current Liabilities | - | ||||
| Total Purchase Price | $ | 7,564 | |||
The business acquisition completed during fiscal year 2017 included holdback provisions for contingent consideration and other holdback amounts, as defined by the purchase agreement. The Company accrues contingent consideration, if any, based on its estimated fair value at the date of acquisition, in addition to other amounts relating to the holdback provisions. Contingent consideration of $0.3 million and other holdback amounts of $2.7 million were paid during fiscal year 2017. As of March 31, 2018 and March 25, 2017, no contingent consideration or other holdback amounts were unpaid and included on the Consolidated Balance Sheets.
51
No acquisition costs were incurred in fiscal year 2018. During fiscal year 2017, acquisition costs of $0.1 million were incurred and recorded as general and administrative expenses in the Consolidated Statement of Income.
The results of the acquired business are included in Transcat’s consolidated operating results as of the date the business was acquired. The following unaudited pro forma information presents the Company’s results of operations as if the acquisition had occurred at the beginning of the respective fiscal year. The pro forma results do not purport to represent what the Company’s results of operations actually would have been if the transaction had occurred at the beginning of the period presented or what the Company’s operating results will be in future periods.
| March 25, | ||
| 2017 | ||
| Total Revenue | $ | 144,048 |
| Net Income | 4,525 | |
| Basic Earnings Per Share | 0.65 | |
| Diluted Earnings Per Share | 0.64 | |
NOTE 10 – QUARTERLY DATA (Unaudited)
The following table presents a summary of certain unaudited quarterly financial data for fiscal years 2018 and 2017:
| Basic | Diluted | ||||||||||||||
| Total | Gross | Net | Earnings | Earnings | |||||||||||
| Revenues | Profit | Income | Per Share (a) | Per Share (a) | |||||||||||
| FY 2018: | |||||||||||||||
| Fourth Quarter | $ | 42,452 | $ | 10,895 | $ | 2,454 | $ | 0.34 | $ | 0.33 | |||||
| Third Quarter | 40,483 | 9,701 | 1,831 | 0.26 | 0.25 | ||||||||||
| Second Quarter | 35,927 | 8,154 | 781 | 0.11 | 0.11 | ||||||||||
| First Quarter | 36,279 | 8,691 | 856 | 0.12 | 0.12 | ||||||||||
| FY 2017: | |||||||||||||||
| Fourth Quarter | $ | 38,453 | $ | 9,782 | $ | 1,429 | $ | 0.20 | $ | 0.20 | |||||
| Third Quarter | 37,813 | 8,915 | 1,271 | 0.18 | 0.18 | ||||||||||
| Second Quarter | 34,485 | 8,027 | 916 | 0.13 | 0.13 | ||||||||||
| First Quarter | 33,147 | 8,246 | 906 | 0.13 | 0.13 | ||||||||||
| (a) |
Earnings per share calculations for each quarter include the weighted average effect of stock issuances and common stock equivalents for the quarter; therefore the sum of quarterly earnings per share amounts may not equal full-year earnings per share amounts, which reflect the weighted average effect on an annual basis. Diluted earnings per share calculations for each quarter include the effect of stock options and non-vested restricted stock units, when dilutive to the quarter. In addition, basic earnings per share and diluted earnings per share may not add due to rounding. |
ITEM 9. CHANGES IN AND DISAGREEMENTS WITH ACCOUNTANTS ON ACCOUNTING AND FINANCIAL DISCLOSURE
None.
ITEM 9A. CONTROLS AND PROCEDURES
(a) Conclusion Regarding the Effectiveness of Disclosure Controls and Procedures. Our principal executive officer and our principal financial officer evaluated our disclosure controls and procedures (as defined in the Securities Exchange Act of 1934, as amended, (“Exchange Act”) Rules 13a-15(e) and 15d-15(e)) as of the end of the period covered by this report. Disclosure controls and procedures are designed to ensure that information required to be disclosed in our reports filed under the Exchange Act is recorded, processed, summarized and reported within the time periods specified in the Securities and Exchange Commission’s rules and forms and that such information is accumulated and communicated to our principal executive officer and principal financial officer to allow timely decisions regarding required disclosure. Based on this evaluation, our principal executive officer and our principal financial officer concluded that our disclosure controls and procedures were effective as of such date.
52
(b) Management’s Annual Report on Internal Control over Financial Reporting. Our management is responsible for establishing and maintaining adequate internal control over financial reporting. Our internal control system was designed to provide reasonable assurance regarding the reliability of financial reporting and the preparation of financial statements for external purposes in accordance with generally accepted accounting principles in the United States of America. In designing and evaluating our internal control system, we recognize that any controls and procedures, no matter how well designed and operated, can provide only reasonable, not absolute, assurance of achieving the desired control objectives and that the effectiveness of any system has inherent limitations including, but not limited to, the possibility of human error and the circumvention or overriding of controls and procedures. Management, including the principal executive officer and the principal financial officer, is required to apply judgment in evaluating the cost-benefit relationship of possible controls and procedures. Because of the inherent limitations in a cost-effective control system, misstatements due to error or fraud may occur and not be detected in a timely manner.
An evaluation was performed under the supervision and with the participation of our management, including our principal executive officer and our principal financial officer, of the effectiveness of the design and operation of our procedures and internal control over financial reporting using the framework and criteria described in the Internal Control-Integrated Framework (2013) issued by the Committee of Sponsoring Organizations of the Treadway Commission. Based on this evaluation, our management, including our principal executive officer and our principal financial officer, concluded that our internal control over financial reporting was effective in providing reasonable assurance regarding the reliability of financial reporting and the preparation of our financial statements for external purposes in accordance with generally accepted accounting principles as of March 31, 2018.
This annual report includes an attestation report of our independent registered public accounting firm, Freed Maxick CPAs, P.C., regarding internal control over financial reporting.
(c) Changes in Internal Control over Financial Reporting. There has been no change in our internal control over financial reporting that occurred during the last fiscal quarter covered by this annual report (our fourth fiscal quarter) that has materially affected, or is reasonably likely to materially affect, our internal control over financial reporting.
Not applicable.
PART III
ITEM 10. DIRECTORS, EXECUTIVE OFFICERS AND CORPORATE GOVERNANCE
The information required by this Item 10 is incorporated herein by reference from our proxy statement for our 2018 Annual Meeting of Shareholders under the headings “Proposal One: Election of Directors,” “Corporate Governance,” “Executive Officers and Senior Management” and “Section 16(a) Beneficial Ownership Reporting Compliance,” which proxy statement will be filed pursuant to Regulation 14A within 120 days after the March 31, 2018 fiscal year end.
ITEM 11. EXECUTIVE COMPENSATION
The information required by this Item 11 is incorporated herein by reference from our proxy statement for our 2018 Annual Meeting of Shareholders under the headings “Executive Compensation” and “Director Compensation,” which proxy statement will be filed pursuant to Regulation 14A within 120 days after the March 31, 2018 fiscal year end.
ITEM 12. SECURITY OWNERSHIP OF CERTAIN BENEFICIAL OWNERS AND MANAGEMENT AND RELATED STOCKHOLDER MATTERS
With the exception of the information presented in the table below, the information required by this Item 12 is incorporated herein by reference from our proxy statement for our 2018 Annual Meeting of Shareholders under the headings “Security Ownership of Certain Beneficial Owners” and “Security Ownership of Management,” which proxy statement will be filed pursuant to Regulation 14A within 120 days after the March 31, 2018 fiscal year end.
53
Securities Authorized for Issuance Under Equity Compensation Plans as of March 31, 2018:
Equity Compensation Plan Information
(In Thousands, Except Per Share Amounts)
|
Number of securities | |||||||||
| Number of securities | remaining available | ||||||||
| to be issued | Weighted average | for future issuance under | |||||||
| upon exercise of | exercise price of | equity compensation plans | |||||||
| outstanding options, | outstanding options, | (excluding securities | |||||||
| Plan category | warrants and rights | warrants and rights | reflected in column (a)) | ||||||
| (a) | (b) | (c) | |||||||
| Equity compensation plans approved by security holders | 272 | (1) | $ | 10.27 | (2) | 1,108 | |||
| Equity compensation plans not approved by security holders | - | - | - | ||||||
| Total | 272 | $ | 10.27 | 1,108 | |||||
| (1) |
Includes performance-based restricted stock units granted to officers and key employees pursuant to our 2003 Incentive Plan. See Note 6 to our Consolidated Financial Statements in Item 8 of Part II. | |
| (2) |
Does not include restricted stock units. |
ITEM 13. CERTAIN RELATIONSHIPS AND RELATED TRANSACTIONS, AND DIRECTOR INDEPENDENCE
The information required by this Item 13 is incorporated herein by reference from our proxy statement for our 2018 Annual Meeting of Shareholders under the headings “Corporate Governance” and “Certain Relationships and Related Transactions,” which proxy statement will be filed pursuant to Regulation 14A within 120 days after the March 31, 2018 fiscal year end.
ITEM 14. PRINCIPAL ACCOUNTANT FEES AND SERVICES
The information required by this Item 14 is incorporated herein by reference from our proxy statement for our 2018 Annual Meeting of Shareholders under the heading “Proposal 3: Ratification of Selection of our Independent Registered Public Accounting Firm,” which proxy statement will be filed pursuant to Regulation 14A within 120 days after the March 31, 2018 fiscal year end.
PART IV
ITEM 15. EXHIBITS, FINANCIAL STATEMENT SCHEDULES
(a) See Index to Financial Statements included in Item 8 of Part II of this report.
(b) Exhibits.
Index to Exhibits
54
| (10) | Material contracts | |
| #10.1 | ||
| #10.2 | ||
| #10.3 | ||
| #10.4 | ||
| #10.5 | ||
| #10.6 | ||
| #10.7 | ||
| #10.8 | ||
| #10.9 | ||
| #10.10 | ||
|
| ||
| 10.11 | ||
|
| ||
| 10.12 | ||
|
| ||
| 10.13 | ||
|
| ||
| 10.14 | ||
55
| 10.15 | ||
| 10.16 | ||
| 10.17 | ||
| 10.18 | ||
| *10.19 | Lease Agreement between Gallina Development Corporation and Transcat, Inc. dated November 28, 2017. | |
| #10.20 | ||
| 10.21 | ||
| 10.22 | ||
| #10.23 | ||
| 10.24 | ||
| (11) |
Statement re computation of per share earnings | |
|
Computation can be determined from the Consolidated Statements of Income and Comprehensive Income included in this Form 10-K under Part II, Item 8. | ||
| (21) |
Subsidiaries of the registrant | |
| *21.1 | Subsidiaries | |
| (23) |
Consents of experts and counsel | |
| *23.1 | Consent of Freed Maxick CPAs, P.C. | |
| (31) |
Rule 13a-14(a)/15d-14(a) Certifications | |
| *31.1 | Certification of Chief Executive Officer Pursuant to Section 302 of the Sarbanes-Oxley Act of 2002 | |
| *31.2 | Certification of Chief Financial Officer Pursuant to Section 302 of the Sarbanes-Oxley Act of 2002 | |
| (32) |
Section 1350 Certifications | |
| *32.1 | Certification Pursuant to Section 906 of the Sarbanes-Oxley Act of 2002 | |
56
| (101) | Interactive Data File | ||
| * | 101.INS XBRL Instance Document | ||
| * | 101.SCH XBRL Taxonomy Extension Schema Document | ||
| * | 101.CAL XBRL Taxonomy Extension Calculation Linkbase Document | ||
| * | 101.DEF XBRL Taxonomy Extension Definition Linkbase Document | ||
| * | 101.LAB XBRL Taxonomy Extension Label Linkbase Document | ||
| * | 101.PRE XBRL Taxonomy Extension Presentation Linkbase Document | ||
| * | Exhibit filed with this report. | ||
| # | Management contract or compensatory plan or arrangement. | ||
57
Pursuant to the requirements of Section 13 or 15(d) of the Securities Exchange Act of 1934, the registrant has duly caused this report to be signed on its behalf by the undersigned thereunto duly authorized.
| TRANSCAT, INC. | ||||
| Date: June 8, 2018 | /s/ Lee D. Rudow | |||
| By: | Lee D. Rudow | |||
| President and Chief Executive Officer | ||||
Pursuant to the requirements of the Securities Exchange Act of 1934, this report has been signed below by the following persons on behalf of the registrant and in the capacities and on the dates indicated.
| Date | Signature | Title | ||
| June 8, 2018 | /s/ Lee D. Rudow | Director, President and Chief Executive Officer | ||
| Lee D. Rudow | (Principal Executive Officer) | |||
| June 8, 2018 | /s/ Michael J Tschiderer | Vice President of Finance and | ||
| Michael J. Tschiderer | Chief Financial Officer | |||
| (Principal Financial Officer) | ||||
| June 8, 2018 | /s/ Scott D. Deverell | Controller and Principal Accounting Officer | ||
| Scott D. Deverell | (Principal Accounting Officer) | |||
| June 8, 2018 | /s/ Charles P. Hadeed | Chairman of the Board of Directors | ||
| Charles P. Hadeed | ||||
| June 8, 2018 | /s/ Richard J. Harrison | Director | ||
| Richard J. Harrison | ||||
| June 8, 2018 | /s/ Gary J. Haseley | Director | ||
| Gary J. Haseley | ||||
| June 8, 2018 | /s/ Paul D. Moore | Director | ||
| Paul D. Moore | ||||
| June 8, 2018 | /s/ Angela J. Panzarella | Director | ||
| Angela J. Panzarella | ||||
| June 8, 2018 | /s/ Alan H. Resnick | Director | ||
| Alan H. Resnick | ||||
| June 8, 2018 | /s/ Carl E. Sassano | Director | ||
| Carl E. Sassano | ||||
| June 8, 2018 | /s/ John T. Smith | Director | ||
| John T. Smith | ||||
58