Attached files
| file | filename |
|---|---|
| EX-99.3 - EXHIBIT 99.3 - THOR INDUSTRIES INC | a51818478ex99_3.htm |
| EX-99.1 - EXHIBIT 99.1 - THOR INDUSTRIES INC | a51818478ex99_1.htm |
| 8-K - THOR INDUSTRIES, INC. 8-K - THOR INDUSTRIES INC | a51818478.htm |
Exhibit 99.2

INVESTOR PRESENTATIONJUNE 6, 2018
Forward Looking Statements This presentation includes certain statements that are “forward looking” statements within the meaning of the U.S. Private Securities Litigation Reform Act of 1995, Section 27A of the Securities Act of 1933, as amended, and Section 21E of the Securities Exchange Act of 1934, as amended. These forward looking statements are made based on management’s current expectations and beliefs regarding future and anticipated developments and their effects upon Thor, and inherently involve uncertainties and risks. These forward looking statements are not a guarantee of future performance. We cannot assure you that actual results will not differ from our expectations. Factors which could cause materially different results include, among others, raw material and commodity price fluctuations, raw material, commodity or chassis supply restrictions, the level of warranty claims incurred, legislative, regulatory and tax law and/or policy developments including their potential impact on our dealers and their retail customers or on our suppliers, the costs of compliance with governmental regulation, legal and compliance issues including those that may arise in conjunction with recent transactions, lower consumer confidence and the level of discretionary consumer spending, interest rate fluctuations, the potential impact of interest rate fluctuations on the general economy and specifically on our dealers and consumers, restrictive lending practices, management changes, the success of new and existing products and services, consumer preferences, the pace of obtaining and producing at new production facilities, the pace of acquisitions and the successful closing and financial impact thereof, the potential loss of existing customers of acquisitions, the integration of new acquisitions, our ability to retain key management personnel of acquired companies, a shortage of necessary personnel for production, the loss or reduction of sales to key dealers, the availability of delivery personnel, asset impairment charges, cost structure changes, competition, the impact of potential losses under repurchase agreements, the potential impact of the strength of the U.S. dollar on international demand, general economic, market and political conditions, changes to investment and capital allocation strategies or other facets of our strategic plan, and the other risks and uncertainties discussed more fully in ITEM 1A of our Annual Report on Form 10-K for the year ended July 31, 2017 and Part II, Item 1A of our quarterly report on Form 10-Q for the period ended April 30, 2018. We disclaim any obligation or undertaking to disseminate any updates or revisions to any forward looking statements contained in this presentation or to reflect any change in our expectations after the date hereof or any change in events, conditions or circumstances on which any statement is based, except as required by law.

Joint Venture Thor Operating Entities

Table of Contents Overview & Current Industry Conditions 5Third Quarter 2018 Update 16Appendix: Financial & Market Data 23

Overview & Current Industry Conditions 5 5

Thor – Strong Investment Appeal Solid growth company throughout its 37-year history – 27.9% compounded annual five-year EPS growth* Balance of organic growth and accretive acquisitions Market leader in a growing industry – Recreational Vehicle (RV) shipments grew 17.2% in calendar 2017 to a record level of 504,599 units, and a five-year CAGR of 12.0%** History of returning cash to shareholders via dividends and stock buybacks – more than $1 billion returned to shareholders over Thor’s history Strong financial position – increased profitability and healthy balance sheet 5-year CAGR: +15.5% * Based on Diluted EPS from continuing operations ** Source: RVIA, RV Shipments, YTD December 2017 *** In addition to regular quarterly dividends, Thor paid special dividends of $1.50 in FY13 and $1.00 in FY14. The declaration of future dividends and the establishment of the per share amounts, record dates and payment dates for any such future dividends are subject to compliance with the credit facility and determination of the Board, and are dependent upon future earnings, cash flows and other factors. +34.0% 5-year CAGR: +27.9% 5-year CAGR: +22.4% +21.5%

34% Of RVs sold in 2016 were to first-time buyers – 8 in 10 of those new buyers were under age 65 ** 12% CAGR in new RV unit shipmentssince 2012 * Solid Economic Fundamentals Support Continued RV Industry Growth High consumer confidence driven by favorable employment and wage trendsContinued gains in household wealth Historically low interest rate environmentWide credit availability for both wholesale and retailBenefits from tax reform, partially offset by increases in fuel prices and interest ratesFavorable macro environment supports strong industry performance: Continued Favorable Macro Environment * Source: RVIA, RV Shipments, YTD December 2017** Source: RVIA, RV Industry Power Breakfast Presentation, May 2017

Consumer Trends Support Continued RV Industry Growth * Source: RVIA, RV Industry Power Breakfast Presentation, May 2017** Source: RVIA, RV Shipments, YTD December 2017 THE OPPORTUNITY: If an additional 1% of potential first-time buyers interested in new RVs enter the RV lifestyle, that represents the potential for an additional 166,000 units in an industry that recorded 504,599 units** in calendar 2017. Consumers identified as “Active Family Adventurers”, “Adult Adventurers” or “Nature Lovers” = Most likely groups to own or rent an RV in the future * Potential first-time buyers who were interested in NEW RVs * Potential first-time buyers who have investigated purchase or visited an RV showroom or dealership *

Trends Driving Growth Demographics Total number of camping households in the U.S. is estimated at more than 77 million households*+6 million new households have started camping since 2014 – this is an increase of 2.6 million new camper households in 2017* As campers age, they begin to camp more using RVs; about 7-in-10 RVers are Millennials or Gen Xers*Millennials, alone, now make up 37% of RVers* New campers are now more diverse than the overall U.S. population*Half of the newest campers were from non-white groups in 2017*RV camping viewed as an attractive way to spend time with families and friendsThe massive influx of younger, more diverse campers is building the momentum for camping becoming an established part of the North American lifestyle* MORE POTENTIAL RV BUYERS **POPULATION: DRIVERS:+159% 2X SINCE 1970 * Source: KOA 2018 North American Camping Report ** Source: RVIA, RV Industry Power Breakfast Presentation, May 2017

Trends Driving Growth Lifestyle Outdoor RecreationOutdoor Recreation Industry, a major contributor to the overall economy, is growing at a faster rate than overall GDP*Trend toward a more active and healthier lifestyle Growing use of RVs with youth sports leagues and tournaments Camping** The number of campers who camp three times or more each year has increased by 64% since 2014In 2017, 61% of campers stayed in a tentOpportunity to convert tent campers into RV campersAccess to technology while camping is helping to eliminate barriers to camping Wide variety of uses Tailgating at spectator sports, from college and professional football to auto racing and youth sports, continues to grow Lifestyle events, such as equestrian events, pet and craft shows, are also growing demand for RVs Flexibility of using RVs makes them ideal for shorter vacations/weekend getaways * Source: According to the Bureau of Economic Analysis** Source: KOA 2018 North American Camping Report

Trends Driving Growth Affordability, Flexibility & Convenience Benefits of RV TravelRV vacations offer greater savings over those taken using a personal car or airline, staying in a hotel or rental home, and eating in restaurants, regardless of duration, distance, or region of the country visited*On average, RV vacations are 27%-62% less expensive on a per day basis compared to other vacation options**Added bonus: RVs offer the opportunity for frequent and unplanned getaways to spend quality time outdoors with family and friends in favorite destinations The ability to go where you want, when you want, with few restrictions or limitations is precisely what attracts many to the RV marketRVs offer a comfortable bed, a kitchen, and a restroom Wide variety of RV price points and amenities creates affordable RV options for a wide range of budgetsWhile fuel prices remain unpredictable from year-to-year, 81% of RV owners say fuel prices will not affect their travel plans*** *** Source: RVIA 2016 Industry Profile*** Source: CBRE Hotels Advisory Group Study*** Source: RVIA May 31, 2018 Press Release - RV Usage Expected to Soar This Summer According to Go RVing's Annual Survey of RV Owners

Health of the RV Channel Dealer Inventory Levels:Overall dealer inventory levels generally appropriate for seasonal consumer demand, although levels elevated as of April 30, 2018 in certain locations due to:dealers' desire to carry more product going into spring selling seasonunfavorable early spring weatheradded Thor plant capacity expedited deliveries of backlog ordersAverage age of RV inventory on dealer lots remains lowUsed inventory levels remain low, supporting trade-in values and demand for new RVsWholesale Financing:Credit broadly availableNormal seasonal credit line utilizationLenders remain disciplined with curtailments motivating dealers to focus on turning inventoryRetail Financing:Credit broadly availableLenders remain disciplined on down payments and termsMinimal sub-prime exposure; loan delinquency rates among the lowest of consumer loans tracked by the American Bankers Association

Opportunities for Continued GrowthProduct Innovations & Manufacturing Continuous investments in new products, features and floorplansShort product development cycle enables us to introduce new models every year, reinforcing the consumer trade-in cycleOrganic growth through continued investment in new facilities, production lines and equipmentInvested $115 million during fiscal 2017 on property, plant and equipment; approximately $160 million investment expected in fiscal 2018Geographic expansion Recent new and expanded campuses added over the last two years Future campus expansions underway in Ohio and Idaho Growth Levers

Opportunities for Continued GrowthFurther Market Penetration Expanded Thor marketing effortsMarketing to younger families and more diverse consumer segmentsGo Your Own Way™ campaign launched September 2017RVIA's Go RVingTM campaign continues to reach new consumers through:"AWAY" advertising campaigns and microsite, which features testimonial-themed videos Print ads in multiple publications offering value-added-components to complement the traditional Go RVing ad placementSocial media efforts, promoting Facebook, Instagram, Twitter, Pinterest and Snapchat posts Growth Levers

Opportunities for Continued GrowthInvesting in Adjacent RV Categories Formed joint venture (TH2), in Q3 FY18, dedicated to providing a variety of products and services focused on enhancing the enjoyment, safety, connectivity and convenience of RV ownership and useObjective to provide innovation solutions to our ever-widening consumer base to not only capture their interest, but to retain them as life-long customers Platform includes existing successful products such as: CosmosRoadtrippers (www.roadtrippers.com)Mighway (www.mighway.com)CamperMate (www.campermate.co.nz)TH2's functionality will provide numerous revenue streams, including subscriptions, advertisements and commissions Growth Levers

Third Quarter 2018 Update

Third Quarter Key Messages Strategic Execution Outlook Consumer Demand All-time record 3rd quarter revenues and earnings Strong sales growth in both segments – Towables (+12.8%) and Motorized (+8.8%)Execution of our strategic planCapacity expansions normalized backlog and provide ability to realize benefits associated with more stable production Through March 2018, U.S. RV retail registrations increased by more than 8%* versus 2017Demand driven by continued solid growth of our more affordably-priced travel trailers and motorhomes with innovative and unique floorplans and featuresHealthy, normalized consolidated RV backlog of $2.0 billion Continued strength in the RV industry is supported by:Favorable demographic trends and an expanding RV buying baseHigh consumer confidence and positive macro economics RVIA forecast for calendar year 2018 of 539,900 units estimates total industry wholesale shipment growth of approximately 7%**Raw material, commodity-based component costs and other input cost increases, including labor and warranty, will continue to be managed through a combination of strategic actionsWholesale and retail growth rates anticipated to become closer to parity by calendar year end * Source: Statistical Surveys, Inc.** Source: Recreation Vehicle Industry Association (RVIA) - Calendar year 2018 represents most recent RVIA estimate as of Spring RV Roadsigns, published in March 2018

Third Quarter 2018Continued Growth Results in Record 3rd Quarter Results All-time record 3rd quarter sales and net income Gross profit up, as the benefit from strong sales growth was partially offset by increased costs, primarily associated with warranty expenses, as well as slightly higher labor and material costsThird quarter diluted EPS of $2.53, up 19.9%, reflecting record sales and the benefits of a lower year-over-year effective tax rate New consumers continuing to embrace the benefits of RVing +11.7% +19.9% +20.2% +8.6% +7.8%

Third Quarter 2018Towable Segment Sales of travel trailers increased by 13.9% and fifth wheels by 11.1%Market share down through March 2018, with U.S. Towable share decreasing from 48.1% to 46.5%, and Canadian Towable share down from 57.3% to 54.3%*Backlog represents a return to more normalized, healthier levels – decrease reflects favorable impact of capacity additions * Source: Statistical Surveys, Inc. YTD March 31, 2018 vs. YTD March 31, 2017 - Note: Data reported by Stat Surveys is subject to adjustment and is continuously updated +12.8% +9.9% (16.6)% +8.7%

Third Quarter 2018Motorized Segment Sales of Class A increased by 12.5% and Class C by 6.6%U.S. Class A and C market share through March 2018 decreased from 43.2% to 42.5%*Canadian Class A and C market share increased from 57.1% to 63.7% through March 2018*Backlog represents a return to more normalized, healthier levels – decrease reflects favorable impact of capacity additions * Source: Statistical Surveys, Inc. YTD March 31, 2018 vs. YTD March 31, 2017 - Note: Data reported by Stat Surveys is subject to adjustment and is continuously updated (12.2)% +4.2% +8.8% +6.1%

Third Quarter Key StatsAs of or for nine months ended April 30 Balance sheet remains very healthyDuring the first nine months of fiscal 2018, we invested over $100.0 million on various capital projects that support our existing business, while working capital increased $172.7 million to support our seasonal needsReduced the outstanding balance under our credit facility, paying down $65.0 million during the first nine months of FY18 -- subsequent to April 30, 2018, paid an additional $60.0 million, leaving $20.0 million outstandingDuring 3Q of 2018, made a $46.9 million investment in a newly created joint venture named TH2; investment in TH2 was funded by cash on hand at the closing in early March 2018 Balance Sheet & Capital Expenditures * Source: For the Fiscal Years Ended July 31

Historical Key StatsAs of or for the fiscal years ended July 31 Income Statement Balance Sheet & Cash Flow 5-year CAGR: +22.4% 5-year CAGR: +27.5% 5-year CAGR: +27.4% 5-year CAGR: 27.9% 5-year CAGR: +28.7%

Appendix: Financial & Market Data

Thor's RV Product Range Towable Segment Motorized Segment * Note: Retail prices noted above are general ranges. Class Afully enclosed, bus-style motorhome; retail price $80,000 - $700,000 Class Cliving area built on van or pickup chassis;retail price $80,000 - $250,000 Class Bvan motorhomes;retail price $150,000 - $250,000 Specialty Trailersincludes camping trailers, truck campers and horse trailers with living quarters;retail price $12,000 - $110,000 Travel Trailershitch to the bumper of the tow vehicle;retail price $12,000 - $150,000 Fifth Wheelshitch to a specially mounted hitch in the bed of a pickup truck;retail price $20,000 - $185,000

Seasonal Shipment Patterns * Source: Statistical Surveys, Inc., U.S. and Canada** Source: Recreation Vehicle Industry Association

RV Wholesale Market Trends (Units 000s) Historical Data: Recreation Vehicle Industry Association (RVIA) (e) Calendar year 2018 represents most recent RVIA estimate as of Spring RV Roadsigns, published in March 2018 5-year: CAGR: +12.0% YTD Shipments (units) April 2018 April 2017 Unit Change % Change 184,528 163,161 21,367 +13.1%

RV Wholesale Market Towable Trends (Units 000s) Historical Data: Recreation Vehicle Industry Association (RVIA) (e) Calendar year 2018 represents most recent RVIA estimate as of Spring RV Roadsigns, published in March 2018 5-year CAGR: +11.4% YTD Shipments (units) April 2018 April 2017 Unit Change % Change 161,004 141,714 19,290 +13.6%

RV Wholesale Market Motorized Trends (Units 000s) Historical Data: Recreation Vehicle Industry Association (RVIA) (e) Calendar year 2018 represents most recent RVIA estimate as of Spring RV Roadsigns, published in March 2018 5-year CAGR: +17.3% YTD Shipments (units) April 2018 April 2017 Unit Change % Change 23,524 21,447 2,077 +9.7%

Consumer Confidence vs. RV Retail Registrations * Source: Statistical Surveys, Inc., U.S. and Canada** Source: The Conference Board, Consumer Confidence Survey ®
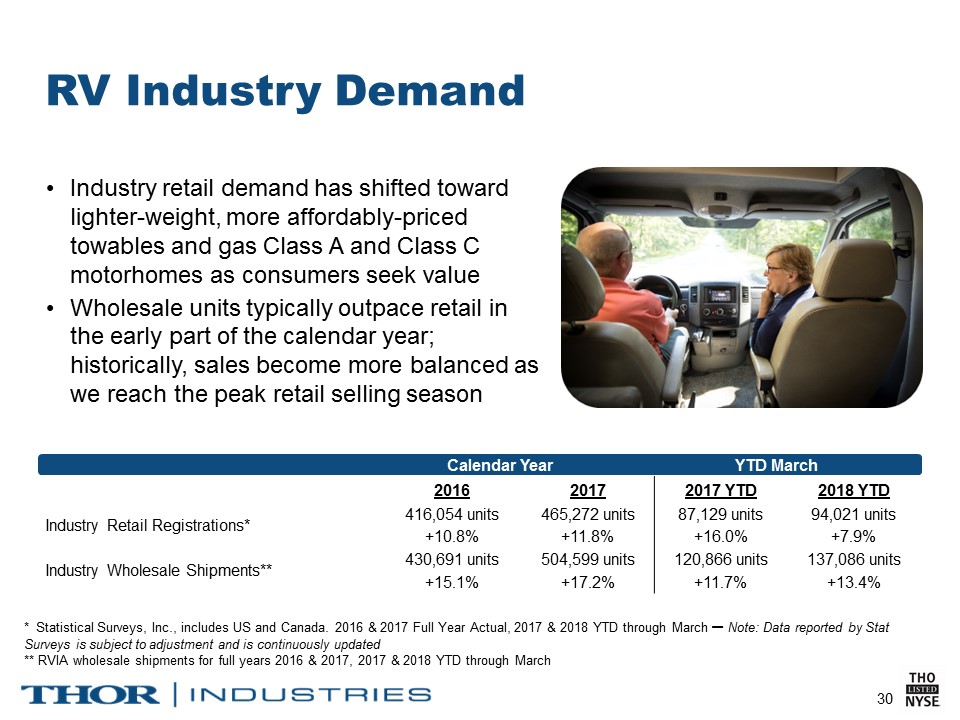
RV Industry Demand * Statistical Surveys, Inc., includes US and Canada. 2016 & 2017 Full Year Actual, 2017 & 2018 YTD through March – Note: Data reported by Stat Surveys is subject to adjustment and is continuously updated** RVIA wholesale shipments for full years 2016 & 2017, 2017 & 2018 YTD through March Industry retail demand has shifted toward lighter-weight, more affordably-priced towables and gas Class A and Class C motorhomes as consumers seek valueWholesale units typically outpace retail in the early part of the calendar year; historically, sales become more balanced as we reach the peak retail selling season Calendar Year YTD March 2016 2017 2017 YTD 2018 YTD Industry Retail Registrations* 416,054 units 465,272 units 87,129 units 94,021 units +10.8% +11.8% +16.0% +7.9% Industry Wholesale Shipments** 430,691 units 504,599 units 120,866 units 137,086 units +15.1% +17.2% +11.7% +13.4%
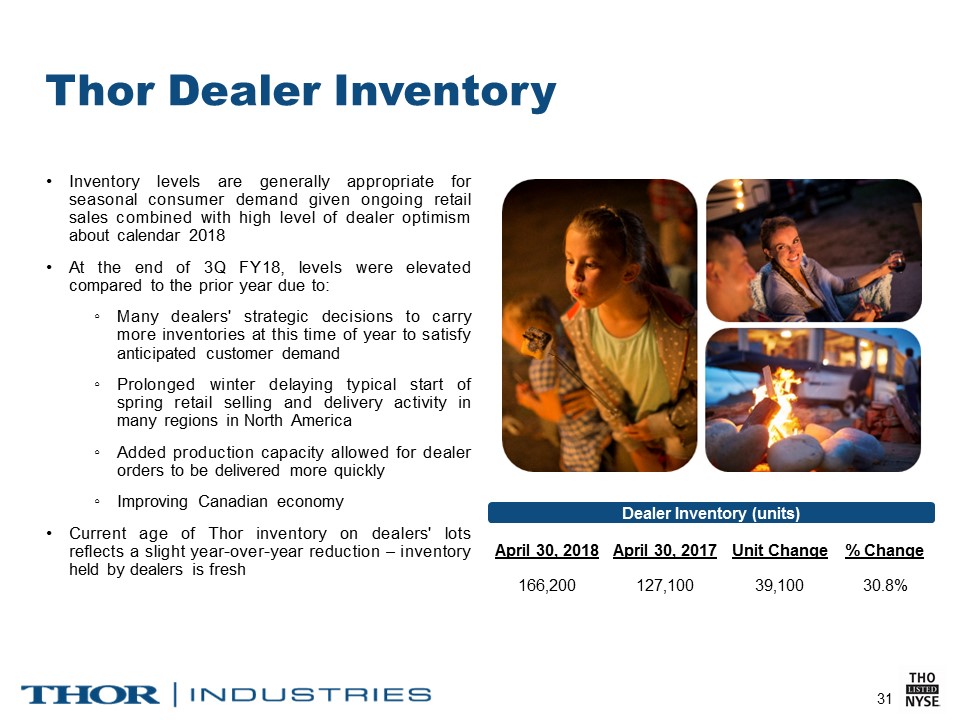
Thor Dealer Inventory Inventory levels are generally appropriate for seasonal consumer demand given ongoing retail sales combined with high level of dealer optimism about calendar 2018At the end of 3Q FY18, levels were elevated compared to the prior year due to:Many dealers' strategic decisions to carry more inventories at this time of year to satisfy anticipated customer demandProlonged winter delaying typical start of spring retail selling and delivery activity in many regions in North AmericaAdded production capacity allowed for dealer orders to be delivered more quicklyImproving Canadian economyCurrent age of Thor inventory on dealers' lots reflects a slight year-over-year reduction – inventory held by dealers is fresh Dealer Inventory (units) April 30, 2018 April 30, 2017 Unit Change % Change 166,200 127,100 39,100 30.8%

YTD 3/31/18 Y/E 12/31/17 Y/E 12/31/16 Y/E 12/31/15 Total Share % Total Share % Total Share % Total Share % THOR* 43,340 46.1 % 223,214 48.0 % 196,947 47.3 % 178,520 47.6 % Forest River** 31,448 33.4 % 158,626 34.1 % 145,482 35.0 % 132,923 35.4 % Grand Design 4,983 5.3 % 18,280 3.9 % 11,818 2.8 % 7,000 1.9 % Winnebago 3,008 3.2 % 14,907 3.2 % 13,127 3.2 % 12,143 3.2 % Gulfstream 1,036 1.1 % 5,585 1.2 % 5,148 1.2 % 4,806 1.3 % REV Group 848 0.9 % 3,998 0.9 % 3,540 0.9 % 3,382 0.9 % Subtotal 84,663 90.0 % 424,610 91.3 % 376,062 90.4 % 338,774 90.3 % All Others 9,358 10.0 % 40,662 8.7 % 39,992 9.6 % 36,646 9.7 % Grand Total 94,021 100.0 % 465,272 100.0 % 416,054 100.0 % 375,420 100.0 % RV Industry Retail Market Share Source: Statistical Surveys, Inc., U.S. and Canada* Thor adjusted to include historical results of Jayco, Livin’ Lite, Bison Coach, K-Z, Inc., Cruiser RV, and DRV Luxury Suites for all periods presented ** Forest River includes Palomino, Coachmen, Prime Time, Shasta and Dynamax

Thor RV Retail Market Share Trend(Units) * Source: Statistical Surveys Inc., U.S. and Canada, calendar years 2014-17, 2018 YTD through March. Historical results adjusted to include results of Jayco, Livin’ Lite, Bison Coach, K-Z, Inc., Cruiser RV and DRV Luxury Suites for all periods presented. Note: Towable market share includes Travel Trailers, Fifth Wheels, Camping Trailers and Park Models.
