Attached files
| file | filename |
|---|---|
| EX-99.1 - EXHIBIT 99.1 - ABM INDUSTRIES INC /DE/ | tv495971_ex99-1.htm |
| 8-K - FORM 8-K - ABM INDUSTRIES INC /DE/ | tv495971_8k.htm |
Exhibit 99.2
SECOND QUARTER 2018 JUNE 7, 2018
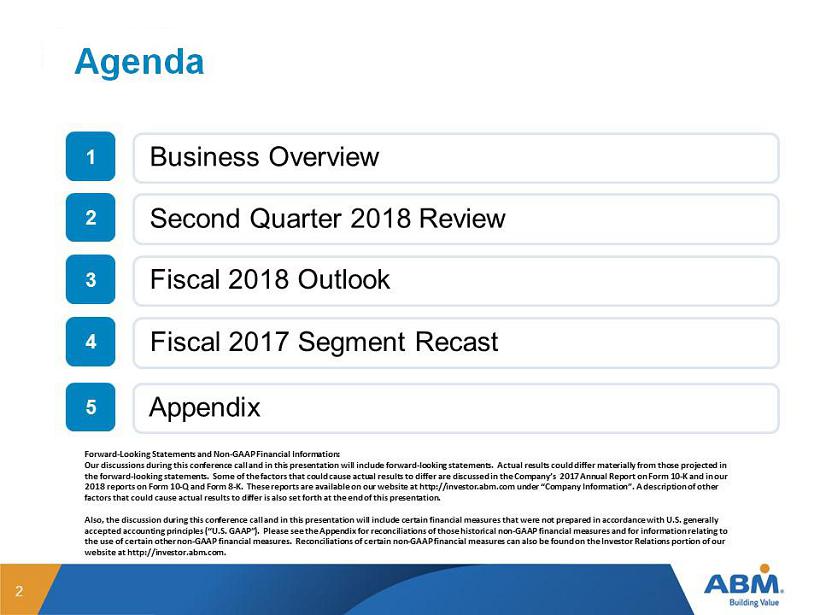
1 2 3 4 5 2 Business Overview Second Quarter 2018 Review Fiscal 2018 Outlook Forward - Looking Statements and Non - GAAP Financial Information: Our discussions during this conference call and in this presentation will include forward - looking statements. Actual results co uld differ materially from those projected in the forward - looking statements. Some of the factors that could cause actual results to differ are discussed in the Company’s 2 017 Annual Report on Form 10 - K and in our 2018 reports on Form 10 - Q and Form 8 - K. These reports are available on our website at http://investor.abm.com under “Company In formation”. A description of other factors that could cause actual results to differ is also set forth at the end of this presentation. Also, the discussion during this conference call and in this presentation will include certain financial measures that were n ot prepared in accordance with U.S. generally accepted accounting principles (“U.S. GAAP”). Please see the Appendix for reconciliations of those historical non - GAAP financia l measures and for information relating to the use of certain other non - GAAP financial measures. Reconciliations of certain non - GAAP financial measures can also be found on the Investor Relations portion of our website at http://investor.abm.com. Fiscal 2017 Segment Recast Appendix

Business Overview JUNE 7, 2018

PURPOSE To take care of the people, spaces and places that are important to you VISION To be the clear choice in the industries we serve through engaged people MISSION To make a difference, every person, every day ABM

5 Services We Perform HVAC, Central Plants, Lighting and Controls EV Charging Stations 24/7/365 Facility Operation Energy Audits & Optimization Infrastructure Upgrades Energy Solutions Building Cleaning & Maintenance Green Cleaning and Recycling Services Hard Surface Floor & Carpet Care Clean Room and GMP Cleaning Staffing and Specialty Services Janitorial On and Off - Street Parking Management Shuttle and Transportation Services Valet Parking and Special Event Services Parking & Transportation Repairs, Replacements and Upgrades Predictive and Preventative Maintenance Low to High - Voltage Testing Electrical Engineering and Commissioning Chiller Services Mechanical Systems Operations Electrical & Mechanical Aviation Services Aircraft Interior & Exterior Cleaning Cargo Services Terminal Cleaning Wheelchair Assistance Ambassador Services Queue/Lobby Management Landscape and Grounds Maintenance Golf Course Maintenance and Renovations Athletic and Sports Field Maintenance Irrigation Maintenance & Management Exterior Pest & Fertility Management Landscape & Turf Mail, Logistics & Print Room Furniture Movement Supplier Management Reception & Switchboard/Help Desk Audio Visual Building Technical Administration

6 Strategically Focused on Industries Where We Can Win Business & Industry Aviation Education Healthcare Technology & Manufacturing Business & Industry Technical Solutions Shared Services, Support Functions
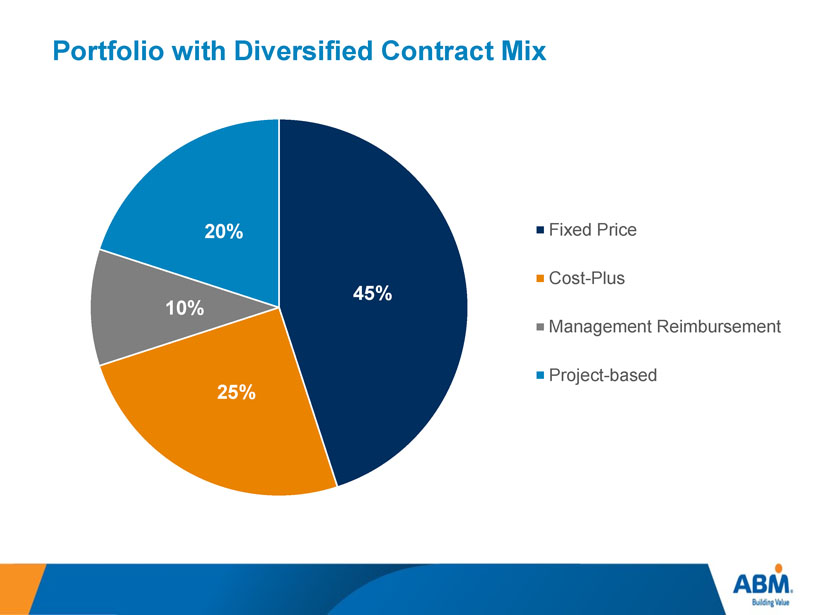
Portfolio with Diversified Contract Mix 71 45% 25% 10% 20% Fixed Price Cost-Plus Management Reimbursement Project-based

Recent Results JUNE 7, 2018

$1,310.5 $1,580.8 2017 2018 Q2 FY18 Revenue Second Quarter 2018 Review 9 • Q2 FY18 revenue increase of 20.6% • Q2 FY18 organic growth of 4.5%

$31.6 $25.4 2017 2018 Q2 FY18 Income from Continuing Operations $27.8 $31.2 2017 2018 Q2 FY18 Adj. Income from Continuing Operations Second Quarter 2018 Review 10 $0.38 per share $0.47 per share $0.49 per share $0.56 per share 1 Results reflect increased amortization and share dilution related to the Company’s GCA acquisition o n September 1, 2017 2 Results for Fiscal 2017 include an impairment recovery related to the Company’s previous Government Services business 1,2 1
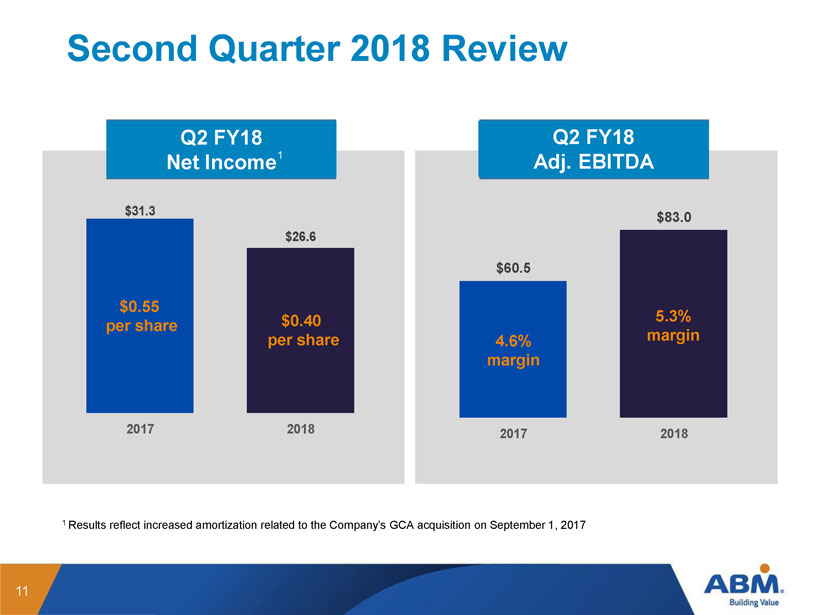
$31.3 $26.6 2017 2018 Q1 FY18 Net Income $60.5 $83.0 2017 2018 Q1 FY18 Adj. EBITDA Q1 FY18 Net (Loss) Q2 FY18 Net Income Second Quarter 2018 Review 11 5 .3% margin 4.6% margin 1 Results reflect increased amortization related to the Company’s GCA acquisition o n September 1, 2017 $0.55 per share $0.40 per share 1 Q2 FY18 Adj. EBITDA
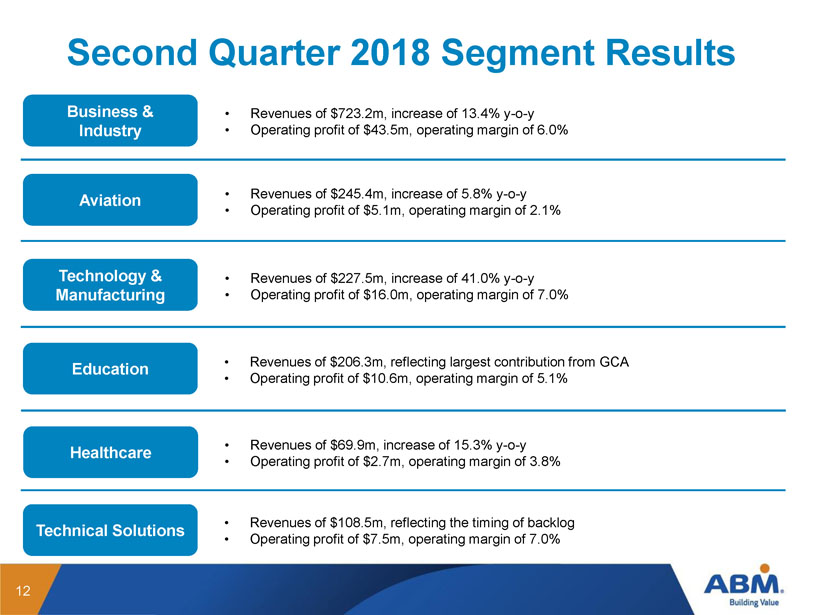
Second Quarter 2018 Segment Results 12 Business & Industry • Revenues of $723.2m, increase of 13.4% y - o - y • Operating profit of $43.5m, operating margin of 6.0% Aviation • Revenues of $245.4m, increase of 5.8% y - o - y • Operating profit of $5.1m, operating margin of 2.1 % Technology & Manufacturing • Revenues of $227.5m, increase of 41.0% y - o - y • Operating profit of $ 16.0 m, operating margin of 7 .0 % Education • Revenues of $206.3m, reflecting largest contribution from GCA • Operating profit of $10 .6 m, operating margin of 5.1% Healthcare • Revenues of $69.9m, increase of 15.3% y - o - y • Operating profit of $2 .7 m, operating margin of 3.8% Technical Solutions • Revenues of $108.5m, reflecting the timing of backlog • Operating profit of $7 .5 m, operating margin of 7.0%
Fiscal 2018 Guidance Outlook JUNE 7, 2018

Fiscal 2018 Outlook 14 Metric Amount Income from continuing operations per diluted share ¹ $1.73 - $1.83 Adjusted Income from continuing operations per diluted share ¹ $1.85 - $1.95 Depreciation $50m - $60m Amortization ² $60m - $70m Interest Expense $55m - $58m Capital Expenditures $55m - $65m Adjusted EBITDA Margin 5.1% to 5.3% Tax Rate (excluding WOTC & other discrete tax items) 28% - 30% Synergies $15m - $17m 1 With the exception of the 2018 Work Opportunity Tax Credits and ASU 2016 - 09, this guidance does not include any potential benefi ts associated with certain other discrete tax items and other unrecognized tax benefits. ² Amortization increasing significantly in FY18 due to the acquisition of GCA Services Group with an anticipated EPS impact of app roximately $0.40. 2018 Working Days Quarter Q1 Q2 Q3 Q4 Days 66 63 66 66 Δ y - o - y 0 0 0 0

Fiscal 2018 Outlook 15 Segment FY18 Operating Profit Margin % Business & Industry low 5% Aviation approximately 3% Education low 5% Healthcare Low 4% Technology & Manufacturing low 7% Technical Solutions high 8% ($ in millions) 1 Operating profit includes acquisition - related amortization stemming from GCA. ¹

Segment Structure FY17 Historical JUNE 7, 2018

Fiscal 2018 – New Segment Structure SEGMENT DESCRIPTIONS B&I B&I, our largest segment, encompasses janitorial, facilities engineering, and parking services for commercial real estate properties, and sports and entertainment venues. Aviation Aviation includes services supporting airlines and airports ranging from parking and janitorial to passenger assistance, catering, air cabin maintenance, and transportation. Education Education provides custodial, landscaping and grounds, facilities engineering, and parking services for public school districts, private schools, colleges, and universities. T&M T&M combines our Industrial & Manufacturing (“I&M”) business, which was previously included in our B&I segment, with our High Tech industry group. Services include janitorial, facilities engineering, and parking services for clients in these industries. Technical Solutions Technical Solutions provides specialized mechanical and electrical services. These services can also be leveraged for cross - selling across all of our industry groups, both domestically and internationally. Healthcare Services in the healthcare industry group include janitorial, environmental services, facilities management, clinical engineering, food & nutrition, laundry & linen, parking & guest services, and patient transportation at traditional hospitals and non - acute facilities. 71

New Segment Structure – FY17 Historical 18 ¹ Results for the fourth quarter of fiscal 2017 reflect revenue of $ 169 . 7 million and operating profit of $ 3 . 4 million related to the September 1 , 2017 acquisition of GCA Services Group (“GCA”) . Revenues of $ 169 . 7 million are reflected in the Education, Technology & Manufacturing, Healthcare, Business & Industry and Aviation segments in the amounts of $ 94 . 9 million, $ 39 . 6 million, $ 5 . 0 million, $ 27 . 4 million and $ 2 . 8 million, respectively . Operating profit of $ 3 . 4 million related to the acquisition of GCA is reflected in the Education, Technology & Manufacturing, Healthcare, Business & Industry, Aviation and Corporate segments in the amounts of $ 3 . 4 million, $ 2 . 8 million, $ 0 . 4 million, $ 1 . 0 million, ( $ 0 . 2 ) million and ( $ 4 . 0 ) million, respectively . * Amounts are rounded to millions from the underlying whole - dollar amounts . Thus, certain amounts may not foot, crossfoot , or recalculate based on reported numbers due to rounding .

Appendix JUNE 7, 2018

Forward - Looking Statements This presentation contains both historical and forward - looking statements regarding ABM Industries Incorporated (“ABM”) and its subsidiaries (collectively referred to as “ABM,” “we,” “us,” “our,” or the “Company”) . We make forward - looking statements related to future expectations, estimates, and projections that are uncertain and often contain words such as “anticipate,” “believe,” “could,” “estimate,” “expect,” “forecast,” “intend,” “likely,” “may,” “outlook,” “plan,” “predict,” “should,” “target,” or other similar words or phrases . These statements are not guarantees of future performance and are subject to known and unknown risks, uncertainties, and assumptions that are difficult to predict . Particular risks and uncertainties that could cause our actual results to be materially different from those expressed in our forward - looking statements include : ( 1 ) we may not realize the growth opportunities and cost synergies that are anticipated from the acquisition of GCA Services Group (“GCA”) ; ( 2 ) we have incurred a substantial amount of debt to complete the acquisition of GCA . To service our debt we will require a significant amount of cash . Our ability to generate cash depends on many factors beyond our control . We also depend on the profitability of our subsidiaries to satisfy our cash needs . If we cannot generate the required cash, we may not be able to make the necessary payments required to service our indebtedness or we may be required to suspend certain discretionary payments, including our dividend ; ( 3 ) changes to our businesses, operating structure, financial reporting structure, or personnel relating to the implementation of our 2020 Vision strategic transformation initiative, including our move to our Enterprise Services Center, may not have the desired effects on our financial condition and results of operations ; ( 4 ) our success depends on our ability to gain profitable business despite competitive pressures and to preserve long - term client relationships ; ( 5 ) our business success depends on our ability to attract and retain qualified personnel and senior management ; ( 6 ) our use of subcontractors or joint venture partners to perform work under customer contracts exposes us to liability and financial risk ; ( 7 ) our international business involves risks different from those we face in the United States that could have an effect on our results of operations and financial condition ; ( 8 ) unfavorable developments in our class and representative actions and other lawsuits alleging various claims could cause us to incur substantial liabilities ; ( 9 ) we insure our insurable risks through a combination of insurance and self - insurance and we retain a substantial portion of the risk associated with expected losses under these programs, which exposes us to volatility associated with those risks, including the possibility that changes in estimates of ultimate insurance losses could result in a material charge against our earnings ; ( 10 ) our risk management and safety programs may not have the intended effect of reducing our liability for personal injury or property loss ; ( 11 ) impairment of goodwill and long - lived assets could have a material adverse effect on our financial condition and results of operations ; ( 12 ) changes in general economic conditions, including changes in energy prices, government regulations, or changing consumer preferences, could reduce the demand for facility services and, as a result, reduce our earnings and adversely affect our financial condition ; ( 13 ) our income tax provision and income tax liabilities could be adversely affected by the jurisdictional mix of earnings, changes in valuations of deferred tax assets and liabilities, and changes in tax treaties, laws, and regulations, including the U . S . Tax Cuts and Jobs Act of 2017 , which effected significant changes to the U . S . corporate income tax system ; ( 14 ) we could be subject to cyber - security risks, information technology interruptions, and business continuity risks ; ( 15 ) a significant number of our employees are covered by collective bargaining agreements that could expose us to potential liabilities in relationship to our participation in multiemployer pension plans, requirements to make contributions to other benefit plans, and the potential for strikes, work slowdowns or similar activities, and union - organizing drives ; ( 16 ) if we fail to maintain proper and effective internal control over financial reporting in the future, our ability to produce accurate and timely financial statements could be negatively impacted, which could harm our operating results and investors’ perceptions of our company and, as a result, the value of our common stock ; ( 17 ) our business may be negatively impacted by adverse weather conditions ; ( 18 ) catastrophic events, disasters, and terrorist attacks could disrupt our services ; and ( 19 ) actions of activist investors could disrupt our business . The list of factors above is illustrative and by no means exhaustive . Additional information regarding these and other risks and uncertainties we face is contained in our Annual Report on Form 10 - K for the year ended October 31 , 2017 and in other reports we file from time to time with the Securities and Exchange Commission (including all amendments to those reports) . We urge readers to consider these risks and uncertainties in evaluating our forward - looking statements . We caution readers not to place undue reliance upon any such forward - looking statements, which speak only as of the date made . We undertake no obligation to publicly update any forward - looking statements, whether as a result of new information, future events, or otherwise, except as required by law . 20

Use of Non - GAAP Financial Information To supplement ABM’s consolidated financial information, the Company has presented income from continuing operations and income from continuing operations per diluted share as adjusted for items impacting comparability, for the Second quarter of fiscal years 2018 and 2017 . These adjustments have been made with the intent of providing financial measures that give management and investors a better understanding of the underlying operational results and trends as well as ABM’s operational performance . In addition, the Company has presented earnings before income from discontinued operations, net of taxes, interest, taxes, depreciation and amortization and excluding items impacting comparability (adjusted EBITDA) for the Second quarter of fiscal years 2018 and 2017 . Adjusted EBITDA is among the indicators management uses as a basis for planning and forecasting future periods . The presentation of these non - GAAP financial measures is not meant to be considered in isolation or as a substitute for financial statements prepared in accordance with accounting principles generally accepted in the United States of America . (See accompanying financial tables for supplemental financial data and corresponding reconciliations to certain GAAP financial measures . ) 21

Unaudited Reconciliation of Non - GAAP Financial Measures 22 (a) The Company adjusts income from continuing operations to exclude the impact of certain items that are unusual, non - recurring, or otherwise do not reflect management's views of the underlying operational results and trends of the Company . (b) Represents the net adjustments to our self - insurance reserve for general liability, workers’ compensation, automobile and medical and dental insurance claims related to prior period accident years . Management believes these prior period reserve changes do not illustrate the performance of the Company’s normal ongoing operations given the current year's insurance expense is estimated by management in conjunction with the Company's outside actuary to take into consideration past history and current costs and regulatory trends . Once the Company develops its best estimate of insurance expense premiums for the year, the Company fully allocates such costs out to the business leaders to hold them accountable for the current year costs within operations . However, since these prior period reserve changes relate to claims that could date back many years, current management has limited ability to influence the ultimate development of the prior year changes . Accordingly, including the prior period reserve changes in the Company's current operational results would not depict how the business is run as the Company holds its management accountable for the current year’s operational performance . The Company believes the exclusion of the self - insurance adjustment from income from continuing operations is useful to investors by enabling them to better assess our operating performance in the context of current year profitability . For the three months ended April 30 2018 , our self - insurance general liability, workers’ compensation and automobile insurance claims related to prior period accident years was increased by $ 2 . 0 million and was offset by $ 2 . 8 million decrease in self - insurance medical and dental insurance reserves . (c) FY 17 represents reimbursement of previously expensed legal and other costs incurred in connection with an internal investigation into a foreign entity affiliated with a former joint venture partner . (d) The QTD and YTD FY 18 period represents restructuring costs related to the GCA acquisition in September 2017 ; The QTD and YTD FY 17 amount presents costs for the Company's 2020 Vision Transformation Initiative, net of the reversal of certain share - based compensation costs . (e) The Company's tax impact is calculated using the federal and state statutory rate of 29 . 8 % for QTD FY 18 , 29 . 8 % for YTD FY 18 , 41 . 5 % for QTD FY 17 , and 41 . 5 % YTD FY 17 , respectively . The tax impact of the impairment recovery and loss on sale related to the Company’s Government Services business was calculated using a 39 . 0 % tax rate for all periods presented . We calculate tax from the underlying whole - dollar amounts, as a result, certain amounts may not recalculate based on reported numbers due to rounding . (f) FY 18 YTD includes a tax benefit of $ 21 . 7 M related to the enactment of the Tax Act . (in millions)

Unaudited Reconciliation of Non - GAAP Financial Measures 23 (g) Adjusted EBITDA does not include interest income for certain long term energy contracts, in which case a gross up of both interest income and interest expense is being recorded . (in millions, except per share amounts)

2018 Guidance 24

SECOND QUARTER 2018 JUNE 7, 2018