Attached files
| file | filename |
|---|---|
| 8-K - 8-K - SMARTFINANCIAL INC. | form8k.htm |
Exhibit 99.1

Stephens Inc. Investor PresentationJune 5, 2018

2 Important Information Forward Looking StatementsThis presentation contains forward-looking statements. SmartFinancial cautions you that a number of important factors could cause actual results to differ materially from those currently anticipated in any forward-looking statement. Such factors include, but are not limited to: the expected revenue synergies and cost savings from the proposed merger with Tennessee Bancshares, Inc. (the “Tennessee Bancshares merger”) or the recently completed merger with Capstone Bancshares, Inc. (the “Capstone merger”) may not be fully realized or may take longer than anticipated to be realized; the disruption from either the Tennessee Bancshares merger or the Capstone merger with customers, suppliers or employees or other business partners’ relationships; the risk of successful integration of our business with that of Tennessee Bancshares or Capstone; the amount of costs, fees, expenses, and charges related to Tennessee Bancshares merger; risks of expansion into new geographic or product markets, like the proposed expansion into the Nashville, TN MSA associated with the proposed Tennessee Bancshares merger; changes in management’s plans for the future, prevailing economic and political conditions, particularly in our market area; credit risk associated with our lending activities; changes in interest rates, loan demand, real estate values and competition; changes in accounting principles, policies, and guidelines; changes in any applicable law, rule, regulation or practice with respect to tax or legal issues; and other economic, competitive, governmental, regulatory and technological factors affecting our operations, pricing, products and services and other factors that may be described in our annual report on Form 10-K and quarterly reports on Form 10-Q as filed with the Securities and Exchange Commission from time to time.The forward-looking statements are made as of the date of this presentation, and, except as may be required by applicable law or regulation, SmartFinancial assumes no obligation to update the forward-looking statements or to update the reasons why actual results could differ from those projected in the forward-looking statements.Non-GAAP MeasuresStatements included in this presentation include non-GAAP financial measures and should be read along with the accompanying tables, which provide a reconciliation of non-GAAP financial measures to GAAP financial measures. SmartFinancial management uses several non-GAAP financial measures, including: (i) net operating earnings available to common shareholders; (ii) operating efficiency ratio; (iii) tangible common equity, and (iv) net interest income –ex purchase accounting. adjustments in its analysis of the company's performance. Net operating earnings available to common shareholders excludes the following from net income available to common shareholders: securities gains and losses, merger and conversion costs, OREO gain and losses, the effect of the December, 2017 tax law change, and the income tax effect of adjustments. The operating efficiency ratio excludes securities gains and losses, merger and conversion costs, and adjustment for OREO gains and losses from the efficiency ratio. Adjusted allowance for loan losses adds net acquisition accounting fair value discounts to the allowance for loan losses. Tangible common equity excludes total preferred stock, preferred stock paid in capital, goodwill, and other intangible assets. Net interest income –ex purchase accounting adjustments adds the taxable equivalent adjustment for tax free yielding assets and removes loan purchase accounting adjustments that are above the contractual loan interest amount. Management believes that non-GAAP financial measures provide additional useful information that allows readers to evaluate the ongoing performance of the company and provide meaningful comparisons to its peers. Non-GAAP financial measures should not be considered as an alternative to any measure of performance or financial condition as promulgated under GAAP, and investors should consider SmartFinancial's performance and financial condition as reported under GAAP and all other relevant information when assessing the performance or financial condition of the company. Non-GAAP financial measures have limitations as analytical tools, and investors should not consider them in isolation or as a substitute for analysis of the results or financial condition as reported under GAAP.

Investor PresentationSTRATEGIC PROFILE

The SmartFinancial Story SmartBank was founded in 2007 as a de novo bank in East Tennessee and has grown to an approximate $2.0 billion-asset franchise through prudent organic growth and a thoughtful series of mergers (pro forma for the May 1, 2018 acquisition of Tennessee Bancshares and its subsidiary, Southern Community Bank)The core franchise in East TN has been expanded into additional attractive markets in AL, FL, and the Nashville metroThe corporate headquarters for holding company SmartFinancial, Inc. is based in Knoxville, TNThe company’s stock is traded on the NASDAQ Capital Market under the symbol “SMBK” and is included in several indexes, including the Russell 2000 SmartBank (legacy)GulfSouth Private BankCornerstone Community BankCleveland, TN BranchCapstone BankSouthern Community Bank
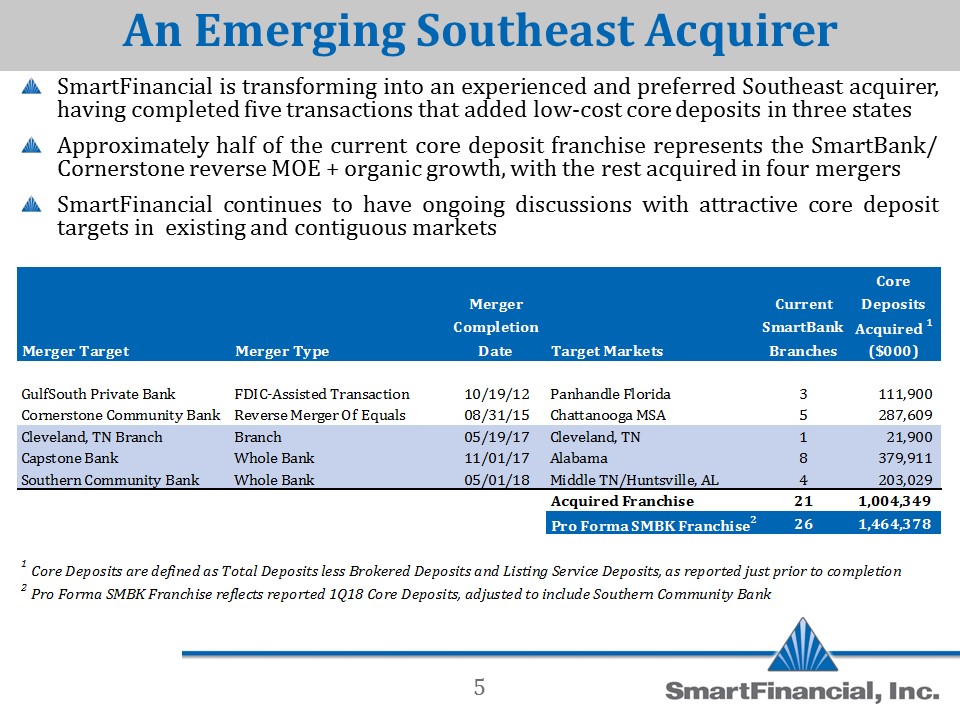
An Emerging Southeast Acquirer SmartFinancial is transforming into an experienced and preferred Southeast acquirer, having completed five transactions that added low-cost core deposits in three statesApproximately half of the current core deposit franchise represents the SmartBank/ Cornerstone reverse MOE + organic growth, with the rest acquired in four mergersSmartFinancial continues to have ongoing discussions with attractive core deposit targets in existing and contiguous markets

Disciplined Acquisition Strategy SmartFinancial has communicated a disciplined set of merger criteria as it has pursued opportunities, including:No more than 3 years of initial TBV-per-share dilutionMeaningful EPS accretion in the first full year of operations (dependent on relative size of the target)Conservative loan marksAdditive to franchise valueThe table below shows the initial projected impacts of the two whole bank transactions completed within the last 12 monthsThe earnback periods and EPS accretion were projected prior to federal tax reform, and should be more favorable to SMBK shareholders under the lower corporate tax rateSmartFinancial is committed to balancing organic growth with thoughtful acquisitions and will not make acquisitions that do not make sense for its shareholders just for the sake of growth 6

Our Business Strategy Create a valuable southeastern banking franchise through organic growth in strong markets, coupled with an acquisition model positioning our company as a partner of choice for banks in our regionContinually improve earnings and efficiency metrics as we build out our model with scaleExecute a disciplined growth strategy that never loses focus on a strong asset quality cultureCreate the premier franchise in our markets by driving quality core deposit growthInsist on a consistent culture and environment where top performers want to work 7

Attractive Returns For Investors SmartFinancial began trading on September 1, 2015 following the reverse MOE with Cornerstone and has outperformed the broader market since that timeSMBK price change through June 1, 2018 = 58.4%S&P 500 Index price change over the same period = 42.9%Three analysts cover our stock with a mean price target of $26.33 as of June 1, 2018 (implied upside = 8%) 8

Valuation Metrics 9 The mean EPS Estimate for analysts that cover our stock projects that SmartFinancial will achieve a 1%+ ROAA run rate in 2018The table below shows our trading multiples as of the most recent close, as well as the implied multiples based on our mean Price Target
Investor Presentation1Q18 FINANCIAL HIGHLIGHTS

First Quarter 2018 Highlights Record high Net Income of $3.4 million for the quarter, up 108% from a year earlierROAA of 80 basis points for the quarter (a new record) and Net Operating ROAA of 91 basis pointsOrganic loan growth of $51 million since year-end 2017, representing a more than 15% annualized trendTransaction Accounts now greater than 37% of Total DepositsThe Efficiency Ratio decreased to 72.7%, a new record and down by more than 3 percentage points from a year earlierNet Interest Margin (fully taxable equivalent) of 4.38%, up 31 basis points from a year earlierNonperforming Assets were just 26 basis points of Total Assets

Key Income Ratios

Summary Income Statement EPS up more than 55% year over yearEarnings Before Income Taxes up more than 68% year over yearNet Interest Income up more than 71% primarily due to higher average earning asset balances and higher earning asset yieldsIncreases in Noninterest Expense primarily driven by the Capstone acquisition, including salaries from the increased headcount for three full months as well as merger and conversion expenses

Net Interest Margin (fully taxable equivalent) decreased quarter to quarter primarily due to lower purchase accounting adjustments on acquired loansCompared to a year ago, Earning Asset Yields are up 51 basis points; the Average Cost of Interest-bearing Liabilities are up 22 basis pointsExcluding the effect of purchase accounting adjustments, the FTE Net Interest Margin increased 25 basis points quarter to quarter Net Interest Income

Noninterest Income 1Q18 Noninterest Income increased primarily due to higher service charges on deposit accountsQuarterly recurring Noninterest Income has trended higher over the last four quarters from approximately $0.95 million in 1Q17 to $1.64 million in 1Q18

Noninterest Expense Efficiency Ratio dropped to 72.7%, the lowest of any quarter since the Cornerstone merger in 2015Salary increases are primarily due to three months of Alabama associates vs. two in the fourth quarter of 2017Data processing slightly elevated due to operating two core systems for half of the quarter

Balance Sheet Assets increased primarily due to organic loan growthCash & Cash Equivalents drawn down to fund loansSecurities held fairly flat to allocate funds to loansDeposit composition shifted to DDAs as a result of conversion reclassifications and organic growthFHLB & Other Borrowings includes $10 million in holding company line of credit, with the remaining balance in short term FHLB borrowings

Loan & Deposit Composition 1Q18
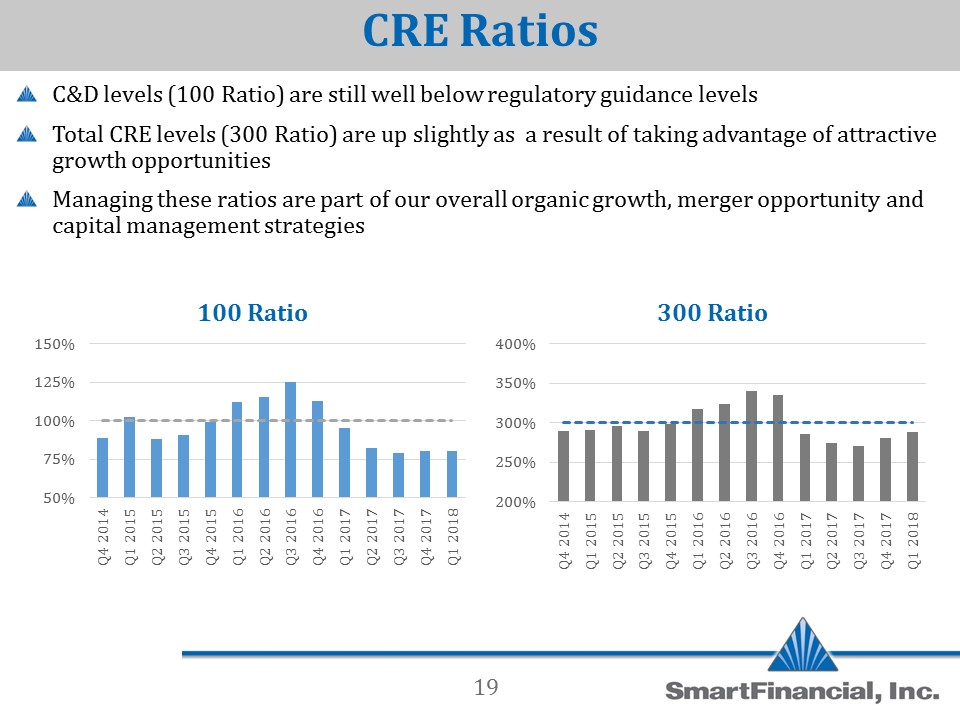
C&D levels (100 Ratio) are still well below regulatory guidance levelsTotal CRE levels (300 Ratio) are up slightly as a result of taking advantage of attractive growth opportunitiesManaging these ratios are part of our overall organic growth, merger opportunity and capital management strategies CRE Ratios

Asset Quality Excellent asset quality, with Nonperforming Assets at just 0.26% of Total AssetsPurchase accounting discounts on acquired loans are more than 2.5x the current Allowance For Loan LossesAcquisitions are marked conservatively for potential losses

Billy Carroll President & CEO865.868.0613Billy.Carroll@SmartBank.com Miller Welborn SmartFinancial, Inc.5401 Kingston Pike, Suite 600Knoxville, TN 37919 Chairman423.385.3067Miller.Welborn@SmartBank.com Investor Contacts