Attached files
| file | filename |
|---|---|
| EX-99.1 - EXHIBIT 99.1 - Jounce Therapeutics, Inc. | jnce06042018exhibit991.htm |
| 8-K - 8-K - Jounce Therapeutics, Inc. | jnce060420188-k.htm |

ICONIC: Biologic and clinical activity of first in class ICOS agonist antibody JTX-2011 +/- nivolumab (nivo) in patients with advanced cancers Timothy A. Yap1, Howard A. Burris2, Shivaani Kummar3, Gerald S. Falchook4, Russell K. Pachynski5, Patricia LoRusso6, Scott S. Tykodi7, Geoffrey T. Gibney8, Justin F. Gainor9, Osama E. Rahma10, Tanguy Y. Seiwert11, Funda Meric-Bernstam1, Mariela A. Blum Murphy1, Jennifer K. Litton1, Ellen Hooper12, Heather A. Hirsch12, David Y. Lee12, Christopher J. Harvey12, Myles Clancy12, Ty McClure12 and Margaret K. Callahan13 1The University of Texas MD Anderson Cancer Center, Houston, TX; 2Sarah Cannon Research Institute, Nashville, TN; 3Stanford University School of Medicine, Stanford, CA; 4Sarah Cannon Research Institute at HealthONE, Denver, CO; 5Washington University School of Medicine in St. Louis, St. Louis, MO; 6Yale Cancer Center, New Haven, CT; 7University of Washington and Fred Hutchinson Cancer Research Center, Seattle, WA; 8Georgetown Lombardi Comprehensive Cancer Center; 9Massachusetts General Hospital, Boston, MA; 10Dana Farber Cancer Institute, Boston, MA; 11University of Chicago, Chicago, IL; 12Jounce Therapeutics, Cambridge, MA; 13Memorial Sloan Kettering Cancer Center, New York, NY Timothy A. Yap MD, PhD NCT02904226 1
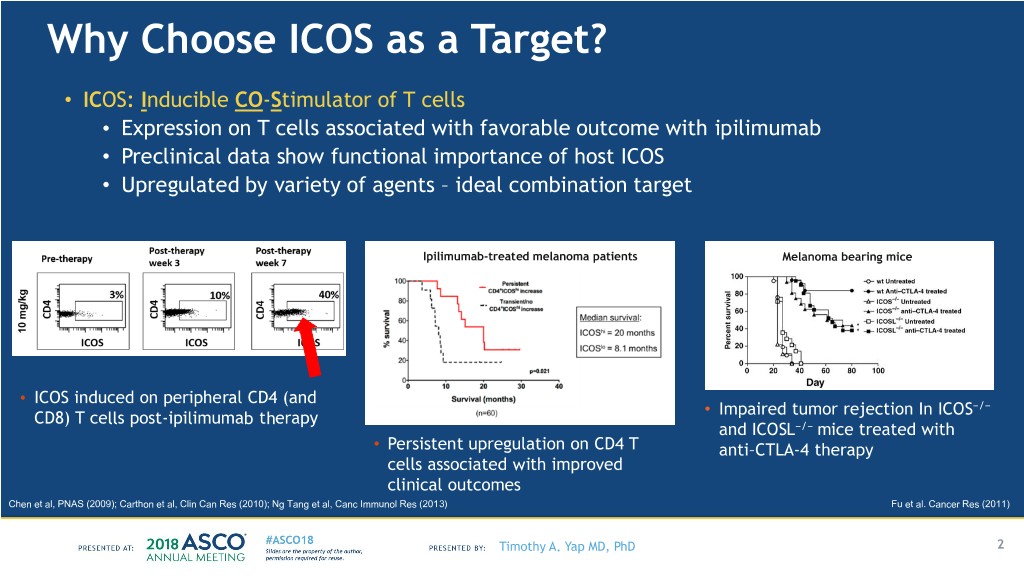
Why Choose ICOS as a Target? • ICOS: Inducible CO-Stimulator of T cells • Expression on T cells associated with favorable outcome with ipilimumab • Preclinical data show functional importance of host ICOS • Upregulated by variety of agents – ideal combination target Ipilimumab-treated melanoma patients Melanoma bearing mice • ICOS induced on peripheral CD4 (and • Impaired tumor rejection In ICOS−/− CD8) T cells post-ipilimumab therapy and ICOSL−/− mice treated with • Persistent upregulation on CD4 T anti–CTLA-4 therapy cells associated with improved clinical outcomes Chen et al, PNAS (2009); Carthon et al, Clin Can Res (2010); Ng Tang et al, Canc Immunol Res (2013) Fu et al. Cancer Res (2011) Timothy A. Yap MD, PhD 2

JTX-2011: Preclinical Rationale for ICOS Agonist IgG1 Antibody Shifting the balance of T cells towards antitumor activity APC NK JTX-2011 cell 1st signal ICOS ICOS TCR TCR ICOS ↑↑IFN-γ ↑ IFN-γ X T regulatory cell “Non-Primed” “Primed” T effector cell T effector cell Activation and Selective reduction of proliferation of intratumoral T effector cells T regulatory cells • Monotherapy efficacy in mouse tumors with high % ICOS expressing immune cells • Enhanced efficacy in combination with PD-1 and CTLA-4 inhibitors • Period of sustained target engagement required for preclinical antitumor efficacy • Tumor-centric pharmacology with no reduction in peripheral immune cell subsets in mice Timothy A. Yap MD, PhD 3
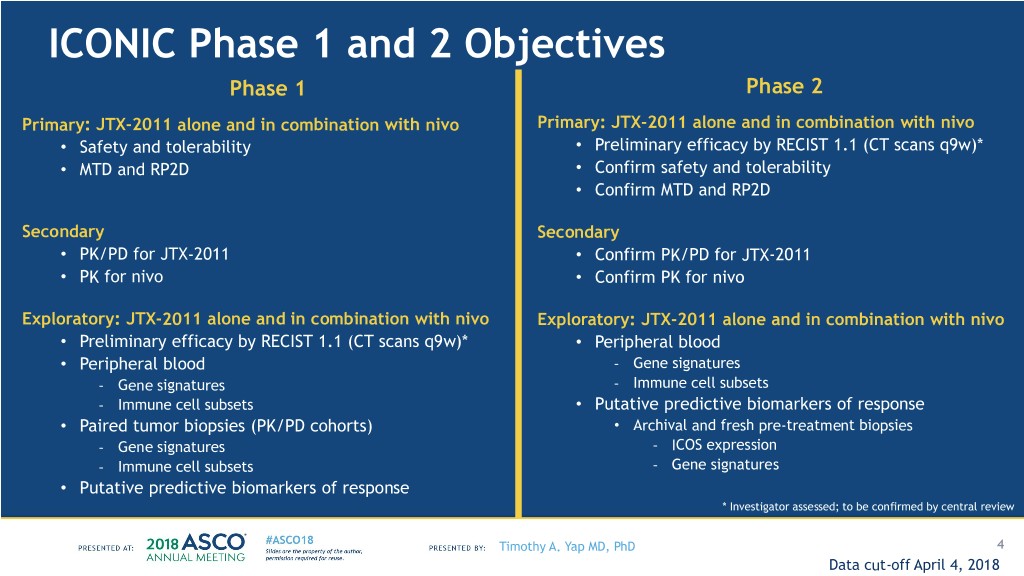
ICONIC Phase 1 and 2 Objectives Phase 1 Phase 2 Primary: JTX-2011 alone and in combination with nivo Primary: JTX-2011 alone and in combination with nivo • Safety and tolerability • Preliminary efficacy by RECIST 1.1 (CT scans q9w)* • MTD and RP2D • Confirm safety and tolerability • Confirm MTD and RP2D Secondary Secondary • PK/PD for JTX-2011 • Confirm PK/PD for JTX-2011 • PK for nivo • Confirm PK for nivo Exploratory: JTX-2011 alone and in combination with nivo Exploratory: JTX-2011 alone and in combination with nivo • Preliminary efficacy by RECIST 1.1 (CT scans q9w)* • Peripheral blood • Peripheral blood - Gene signatures - Gene signatures - Immune cell subsets - Immune cell subsets • Putative predictive biomarkers of response • Paired tumor biopsies (PK/PD cohorts) • Archival and fresh pre-treatment biopsies - Gene signatures - ICOS expression - Immune cell subsets - Gene signatures • Putative predictive biomarkers of response * Investigator assessed; to be confirmed by central review Timothy A. Yap MD, PhD 4 Data cut-off April 4, 2018
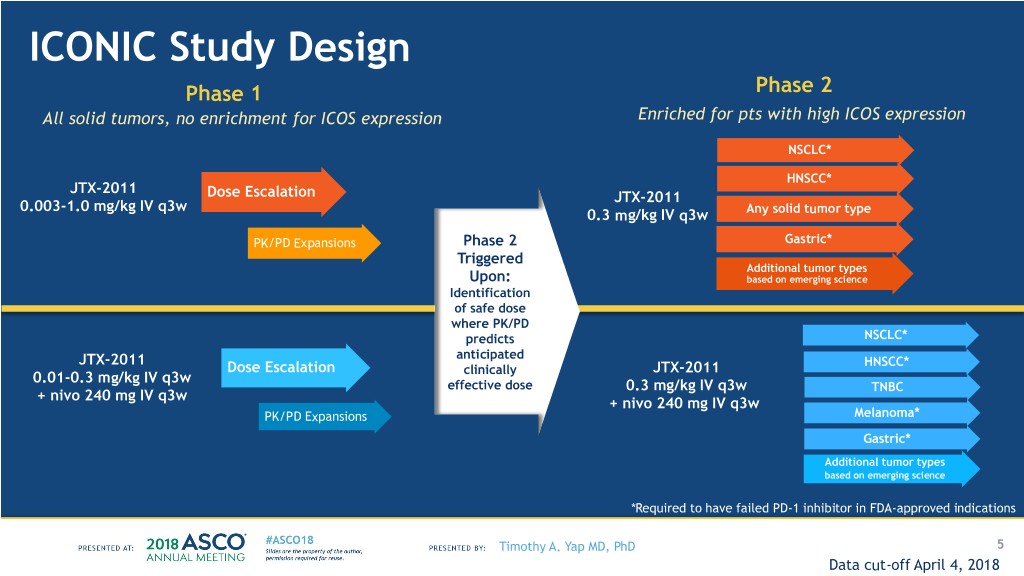
ICONIC Study Design Phase 1 Phase 2 All solid tumors, no enrichment for ICOS expression Enriched for pts with high ICOS expression NSCLC* HNSCC* JTX-2011 Dose Escalation JTX-2011 0.003-1.0 mg/kg IV q3w 0.3 mg/kg IV q3w Any solid tumor type PK/PD Expansions Phase 2 Gastric* Triggered Additional tumor types Upon: based on emerging science Identification of safe dose where PK/PD predicts NSCLC* anticipated JTX-2011 HNSCC* Dose Escalation clinically JTX-2011 0.01-0.3 mg/kg IV q3w effective dose 0.3 mg/kg IV q3w TNBC + nivo 240 mg IV q3w + nivo 240 mg IV q3w PK/PD Expansions Melanoma* Gastric* Additional tumor types based on emerging science *Required to have failed PD-1 inhibitor in FDA-approved indications Timothy A. Yap MD, PhD 5 Data cut-off April 4, 2018

ICONIC Patient Demographics JTX-2011 JTX-2011 + nivo Parameter Phase 1 Phase 2 Phase 1 Phase 2 n 40 29 31 87 Median age, yrs (Range) 63 (24, 78) 67 (31, 81) 56 (29, 80) 62 (37, 85) ECOG 0/1, n (%)/n (%) 8 (20%) / 32 (80%) 2 (7%) / 27 (93%) 8 (26%) / 22 (71%)* 25 (29%) / 60 (71%)* Tumor types 8-TNBC,4-Colon,3- 8-Gastric, 5-NSCLC, 5-TNBC,4-Colon, 29-Gastric, Melanoma,3-Oropharynx, 4-HNSCC, 12-Other 3-Gastric,2-Sarcoma, 23-HNSCC, 19-TNBC, 2-Sarcoma,2-Prostate, Solid Tumors (TNBC, 2-Endometrial,2-Breast, 13-NSCLC, 2-Renal,2-Endometrial, Ovarian, Pancreatic, other, 2-Rectal,2- 2-Melanoma, 2-Unknown Origin, 12-Other Neuroendocrine, Cervix,2-Esophageal 1-Endometrial Solid Tumors Rectal, Melanoma, (squam), 7- Other Solid Endometrial, Bladder, Tumors Unknown, Sublingual) ≥3 Prior therapy for 32 (80%) 21 (72%) 23 (74%) 46 (54%)# metastatic disease, n (%) Safety population: all subjects who received at least one dose of JTX-2011; *ECOG status not available on all subjects; #Prior therapy data not available on all subjects Timothy A. Yap MD, PhD 6 Data cut-off April 4, 2018

ICONIC Phase 2 Characteristics Tumor type HNSCC NSCLC TNBC Gastric Other Solid Tumors JTX-2011 JTX-2011 JTX-2011 JTX-2011 JTX-2011 JTX-2011 JTX-2011 JTX-2011 JTX-2011 + nivo + nivo + nivo + nivo + nivo n* 4 23 5 13 19 8 29 12 3 Prior therapy for n=4 n=22 n=5 n=12 n=19 n=8 n=29 n=11 n=3 metastatic disease, n#(%) ≤1 0 2 (9%) 0 1 (8%) 3 (16%) 2 (25%) 6 (21%) 0 0 2 0 7 (32%) 2 (40%) 3 (25%) 5 (26%) 1 (13%) 11 (38%) 2 (18%) 1 (33%) 3 1 (25%) 7 (32%) 3 (60%) 3 (25%) 3 (16%) 5 (63%) 4 (14%) 3 (27%) 0 ≥4 3 (75%) 6 (27%) 0 5 (42%) 8 (42%) 0 8 (28%) 6 (55%) 2 (67%) Prior IO, n# (%) 4 (100%) 22 (100%) 5 (100%) 12 (100%) 1 (5%) 1 (13%) 6 (21%) 7 (64%) 3 (100%) Prior IO Refractory, n (%) 2 (50%) 12 (55%) 2 (40%) 1 (8%) 1 (5%) 0 1 (3%) 2 (18%) 1 (33%) Brain mets, n* (%) 1 (25%) 2 (9%) 0 3 (23%) 3 (16%) 0 2 (7%) 0 1 (33%) Liver mets, n* (%) 1 (25%) 5 (22%) 1 (20%) 4 (31%) 10 (53%) 6 (75%) 18 (62%) 6 (50%) 1 (33%) *Safety population: all subjects who received at least one dose of JTX-2011 #Patients for whom prior therapy information is available Timothy A. Yap MD, PhD 7 Data cut-off April 4, 2018

JTX-2011 is Well Tolerated Alone and Combined with nivo JTX-2011 JTX-2011 + nivo Phase 1: all doses (n=40) n (%) Phase 2 (n=29) n (%) Phase 1 all doses (n=31) n (%) Phase 2 (n=87) n (%) Related AEs* All TEAEs Grade 3/4 All TEAEs Grade 3/4 All TEAEs Grade 3/4 All TEAEs Grade 3/4 Any related TEAE 23 (58) 7 (18) 19 (66) 3 (10) 22 (71) 3 (10) 63 (72) 8 (9) Fatigue 3 (8) 0 6 (21) 0 5 (16) 1 (3) 17 (20) 0 Nausea 5 (13) 0 1 (3) 0 8 (26) 0 16 (18) 0 Infusion related 3 (8) 0 4 (14) 1 (3) 9 (29) 0 12 (14) 0 reaction Decreased appetite 4 (10) 0 2 (7) 0 2 (7) 0 11 (13) 0 Chills 4 (10) 0 0 0 1 (3) 0 8 (9) 0 Pyrexia 4 (10) 0 0 0 0 0 8 (9) 0 Diarrhea 4 (10) 3 (8) 0 0 2 (7) 0 5 (6) 0 Pruritus 4 (10) 0 1 (3) 0 1 (3) 0 4 (5) 0 Vomiting 1 (3) 0 0 0 2 (7) 0 6 (7) 0 AST increased 2 (5) 1 (3) 1 (3) 1 (3) 1 (3) 0 2 (2) 1 (1) Anemia 3 (8) 3 (8) 2 (7) 0 0 0 1 (1) 0 Hypophosphatemia 0 0 0 0 0 0 2 (2) 2 (2) Hypoxia 0 0 0 0 0 0 2 (2) 2 (2) • DLTs on mechanism at 1.0 mg/kg JTX-2011 alone (Grade 3 AST/ALT, Grade 3 pleural effusion) • 2 possibly related Grade 5 AEs with JTX-2011 + nivo: increased bilirubin, encephalopathy *all related TEAEs experienced by ≥ 5% of pts or Gr 3/4 events experienced by > 1 pt listed in order of decreasing frequency of Total related AEs Timothy A. Yap MD, PhD 8 Data cut-off April 4, 2018

JTX-2011 Pharmacokinetics and Pharmacodynamics Phase 1 Phase 2 • RP2D 0.3 mg/kg mono and combo based on: • RP2D 0.3 mg/kg mono and combo confirmed: • Safety • Sustained Target Engagement beyond Cycle 1 • Sustained Target Engagement in • No significant change in IFN-gamma after first peripheral blood through Cycle 1 dose with JTX-2011 or JTX-2011 + nivo • Dose dependent increase in IFN-gamma with • No significant impact on peripheral immune cell JTX-2011 at 1-6 hours after first dose subsets for JTX-2011 or JTX-2011 + nivo • No significant impact on peripheral immune • No impact of nivo on JTX-2011 PK cell subsets for JTX-2011 or JTX-2011 + nivo • Nivo PK: Cmin (mean) • No impact of nivo on JTX-2011 PK • C1D15 = 18.3 mcg/mL • C1D22/C2D1 = 14.6 mcg/mL • C5D1 = 30.1 mcg/mL Timothy A. Yap MD, PhD 9 Data cut-off April 4, 2018

JTX-2011 Monotherapy: Clinical Activity Phase 1 (n=40*) Phase 2 (n=27*) • Durable SD • Ongoing RECIST PR in 1/8 gastric 140 • Endometrial 7+ mths, CRPC 6+ mths • Gastric 8.5+ mths 120 • Disease Control Rate = 25% (10) • Disease Control Rate = 19% (5) 100 • 75% discontinuation ≤ C3, 15% in C1 • 78% discontinuation ≤ C3, 19% in C1 80 80 60 60 40 40 20 20 0 0 -20 -20 -40 -40 Change from baseline (%) baseline from Change -60 -60 -80 (%) baseline from Change -80 -100 -100 0 3 6 9 12 15 18 21 24 27 30 33 36 39 42 45 48 0 3 6 9 12 15 18 21 24 27 30 33 36 39 42 45 48 Weeks Since Treatment Initiation Weeks Since Treatment Initiation Ongoing PD-1 inhibitor naive Off-treatment PD-1 inhibitor failure *Evaluable= Dosed and ≥ 1 scan or discontinued treatment, Disease Control Rate= confirmed PR + SD ≥ 9 wks Timothy A. Yap MD, PhD 10 Data cut-off April 4, 2018

JTX-2011 + nivo: Clinical Activity Phase 1 (n=31*) Phase 2 (n=75*) • Ongoing RECIST PR in 1/4 gastric • Ongoing RECIST PRs and/or SD • Gastric 11+ mths (JTX-2011 0.1 mg/kg) • Gastric, TNBC, NSCLC • Disease Control Rate = 29% (9) • Disease Control Rate = 32% (24) • 58% discontinuation ≤ C3, 10% in C1 100 100 • 69% discontinuation ≤ C3, 17% in C1 80 80 60 60 40 40 20 20 0 0 -20 -20 Change from baseline (%) baseline from Change -40 -40 Change from baseline (%) baseline from Change -60 -60 -80 -80 0 3 6 9 12 15 18 21 24 27 30 33 36 39 0 3 6 9 12 15 18 21 24 27 30 Weeks Since Treatment Initiation Weeks Since Treatment Initiation Ongoing PD-1 inhibitor naive Off-treatment PD-1 inhibitor failure *Evaluable= Dosed and ≥ 1 scan or discontinued treatment, Disease Control Rate= confirmed PR + SD ≥ 9 wks Timothy A. Yap MD, PhD 11 Data cut-off April 4, 2018

JTX-2011 + nivo: Ongoing Disease Control in Gastric, TNBC and NSCLC 80 Gastric cancer 80 TNBC n= 28 Tumor reductions= 29% (8) n= 17 Tumor reductions= 12% 60 ORR= 4% (1) 60 (2) 40 DCR= 36% (10) 40 ORR= 6% (1) 20 20 DCR= 18% (3) 0 0 -20 -20 -40 -40 Change frombaseline (%) Change frombaseline (%) -60 -60 54% D/C ≤ C3, 14% in C1 82% D/C ≤ C3, 35% in C1 -80 -80 0 3 6 9 12 15 18 21 24 27 30 0 3 6 9 12 15 18 21 24 27 30 Weeks Since Treatment Initiation Weeks Since Treatment Initiation 80 NSCLC 80 HNSCC Tumor reductions= 33% (4) Tumor reduction= 6% (1) 60 60 n= 12 ORR= 0 n= 16 ORR= 0 40 DCR= 58% (7) 40 DCR= 13% (2) 20 20 0 0 -20 -20 -40 -40 Change frombaseline (%) Change frombaseline (%) -60 -60 67% D/C ≤ C3, 0 in C1 88% D/C ≤ C3,19% in C1 -80 -80 0 3 6 9 12 15 18 21 24 27 30 0 3 6 9 12 15 18 21 24 27 30 Weeks Since Treatment Initiation Weeks Since Treatment Initiation Ongoing PD-1 inhibitor naive Off-treatment PD-1 inhibitor failure n= Dosed and ≥ 1 scan or discontinued treatment; Disease Control Rate= confirmed PR + SD ≥ 9 wks; D/C= discontinued Timothy A. Yap MD, PhD 12 Data cut-off April 4, 2018

ICOS Expression in ICONIC Patient Tumor Samples All evaluable matched archival and • Preliminary data suggests relationship between fresh tumor biopsies n (%) archival and fresh pre-Tx biopsy ICOS scores may vary: (Phase 1 and Phase 2) • May reflect the inducible nature of ICOS # matched pairs archival and fresh 58 • May reflect differences in ICOS expression between # of samples that do not change 33 (57%) primary tumor, nodal, and visceral metastases # of archival ICOS low to fresh ICOS high 16 (28%) # of archival ICOS high to fresh ICOS low 9 (15%) Preliminary efficacy All evaluable subjects with fresh measure tumor biopsies • Preliminary analysis of evaluable fresh pre-treatment All ICOS High ICOS Low biopsies: n 67 45 22 • Rates of disease control and tumor reductions appear Response (n) 1 1 0 higher in patients with high ICOS score Disease control (n) 14 11 3 Tumor reductions (n) 9 7 2 Timothy A. Yap MD, PhD 13 Data cut-off April 4, 2018
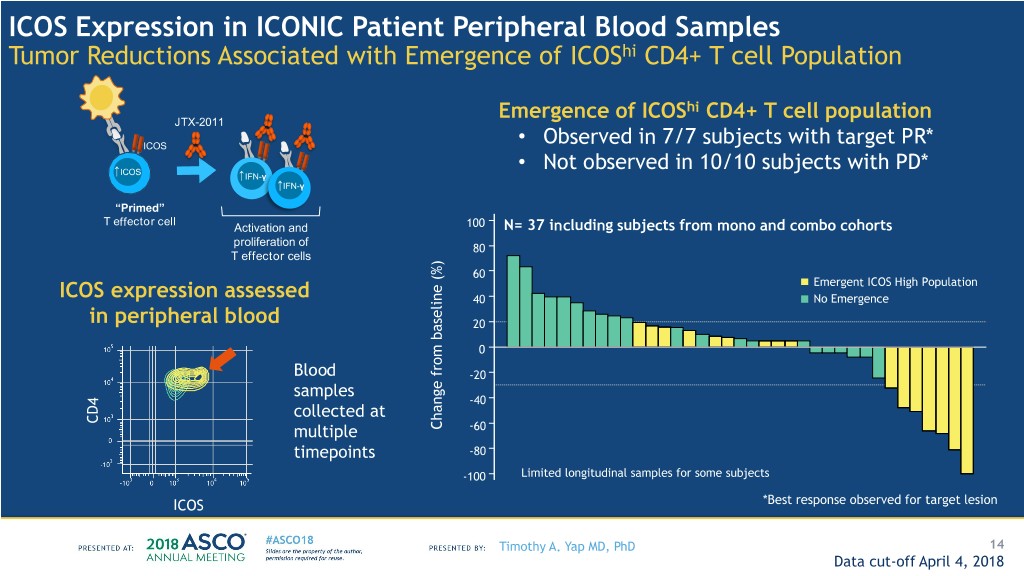
ICOS Expression in ICONIC Patient Peripheral Blood Samples Tumor Reductions Associated with Emergence of ICOShi CD4+ T cell Population Emergence of ICOShi CD4+ T cell population JTX-2011 ICOS • Observed in 7/7 subjects with target PR* ICOS • Not observed in 10/10 subjects with PD* ↑IFN-γ ↑IFN-γ “Primed” T effector cell Activation and 100 N= 37 including subjects from mono and combo cohorts proliferation of 80 T effector cells 60 Emergent ICOS High Population ICOS expression assessed 40 No Emergence in peripheral blood 20 0 Blood -20 samples -40 collected at CD4 multiple (%) baseline from Change -60 timepoints -80 -100 Limited longitudinal samples for some subjects ICOS *Best response observed for target lesion Timothy A. Yap MD, PhD 14 Data cut-off April 4, 2018
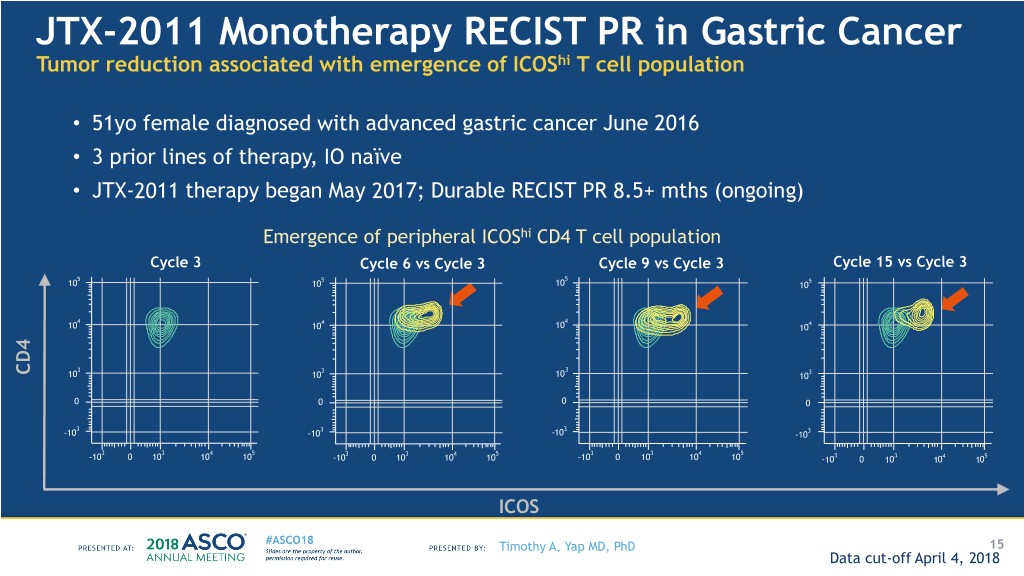
JTX-2011 Monotherapy RECIST PR in Gastric Cancer Tumor reduction associated with emergence of ICOShi T cell population • 51yo female diagnosed with advanced gastric cancer June 2016 • 3 prior lines of therapy, IO naïve • JTX-2011 therapy began May 2017; Durable RECIST PR 8.5+ mths (ongoing) Emergence of peripheral ICOShi CD4 T cell population Cycle 3 Cycle 6 vs Cycle 3 Cycle 9 vs Cycle 3 Cycle 15 vs Cycle 3 5 5 5 10 10 10 105 4 4 4 10 10 10 104 3 3 3 CD4 10 10 10 103 0 0 0 0 3 3 3 -10 -10 -10 -103 3 3 4 5 3 3 4 5 3 3 4 5 -10 0 10 10 10 -10 0 10 10 10 -10 0 10 10 10 -103 0 103 104 105 ICOS Timothy A. Yap MD, PhD 15 Data cut-off April 4, 2018

JTX-2011+ nivo RECIST PR in Gastric Cancer hi Tumor reduction associated with emergence of ICOS T cell population Baseline (12.6cm) 5/18/2017 • 43yo female diagnosed with MSS gastric adenocarcinoma in Dec 2013 • 6 prior lines of therapy, IO naive • JTX-2011 therapy (0.1mg/kg) + nivo (240mg q3w) began May 2017; Durable RECIST PR 11+ mths (ongoing) • ICOS target saturation sustained over 21-day dosing cycle Emergence of peripheral ICOShi CD4+ T cell population On-treatment (4.1cm) Cycle 7 Cycle 9 vs Cycle 7 Cycle 10 vs Cycle 7 Cycle 12 vs Cycle 7 4/2/2018 (15 cycles) 5 5 5 105 10 10 10 4 4 4 104 10 10 10 3 3 3 103 10 10 10 CD4 0 0 0 0 3 3 3 -103 -10 -10 -10 3 3 4 5 3 3 4 5 2 3 4 5 -103 0 103 104 105 -10 0 10 10 10 -10 0 10 10 10 10 10 10 10 ICOS Timothy A. Yap MD, PhD 16 Data cut-off April 4, 2018

Conclusions • Safety and tolerability demonstrated in heavily pre-treated patients - JTX-2011 0.3 mg/kg well tolerated as monotherapy and with nivo 240 mg q3w • RECIST partial responses and stable disease in advanced cancers - Gastric cancer- mono and combo PRs - TNBC- combo PR - NSCLC- combo stable disease and tumor reductions in PD-1 inhibitor failures • Potential on-mechanism ICOS biomarker identified - Emergence of ICOShi CD4 T-cell population, which appears to associate with antitumor activity • Ongoing clinical trial includes a planned combination with ipilimumab Timothy A. Yap MD, PhD 17 Data cut-off April 4, 2018
The ICONIC investigators would like to thank: All patients and their families The clinical study teams and participating centers Jounce Therapeutics Timothy A. Yap MD, PhD 18
