Attached files
| file | filename |
|---|---|
| EX-99.4 - EX-99.4 - IMMUNOMEDICS INC | a18-14808_1ex99d4.htm |
| EX-99.2 - EX-99.2 - IMMUNOMEDICS INC | a18-14808_1ex99d2.htm |
| EX-99.1 - EX-99.1 - IMMUNOMEDICS INC | a18-14808_1ex99d1.htm |
| 8-K - 8-K - IMMUNOMEDICS INC | a18-14808_18k.htm |
Forward-Looking Statements 2 This presentation, in addition to historical information, contains certain forward-looking statements made pursuant to the Private Securities Litigation Reform Act of 1995. Such statements may involve significant risks and uncertainties, and actual results could differ materially from those expressed or implied herein. Factors that could cause such differences include, but are not limited to, new product development (including clinical trials outcome and regulatory requirements/actions); competitive risks to marketed products; forecasts of future operating results; availability of required financing and other sources of funds on acceptable terms, if at all; as well as those discussed in the Company's filings with the Securities and Exchange Commission.
Agenda 3 7:30 pm – 7:40 pm Welcome and Opening Remarks Michael Pehl, President and Chief Executive Officer 7:40 pm – 7:55 pm Sacituzumab Govitecan in Advanced Urothelial Cancer Scott Tagawa, M.D., MS, Richard A. Stratton Associate Professor in Hematology & Oncology, Associate Professor of Clinical Medicine & Urology at Weill Cornell Medicine, and Associate Attending Physician at NewYork-Presbyterian – Weill Cornell Medical Center 7:55 pm – 8:15 pm Sacituzumab Govitecan – Phase 1/2 Results in HR+/HER2- Metastatic Breast Cancer Hope S. Rugo, M.D., FACP, Professor of Medicine; and Director, Breast Oncology and Clinical Trials Education, University of California San Francisco Helen Diller Family Comprehensive Cancer Center 8:15 pm – 8:30 pm Sacituzumab Govitecan Development Plan Robert Iannone, M.D., M.S.C.E., Head of Research & Development and Chief Medical Officer 8:30 pm – 8:35 pm Concluding Remarks Michael Pehl, President and Chief Executive Officer 8:35 pm Q&A Session
Our Company Vision for Value Creation 4 Immunomedics is deeply committed to become the leading antibody-drug conjugate (ADC) company worldwide delivering breakthrough therapies to treat complex cancers and transform patient outcomes

First-in-class ADC Platform 5 Linker for SN-38 SN-38 Payload SN-38 more potent than parent compound, irinotecan In xenograft models, ADC delivers up to 136-fold more SN-38 than irinotecan Linker for SN-38 Hydrolysable linker for payload release High drug-to-antibody ratio (7.5:1) Suite of Humanized Antibodies for Creating ADCs hRS7, used in sacituzumab govitecan, targets Trop-2 for solid cancers Labetuzumab, used in IMMU-130, targets CEACAM5 for colorectal cancer IMMU-114, used in IMMU-140, targets HLA-DR for solid and liquid cancers
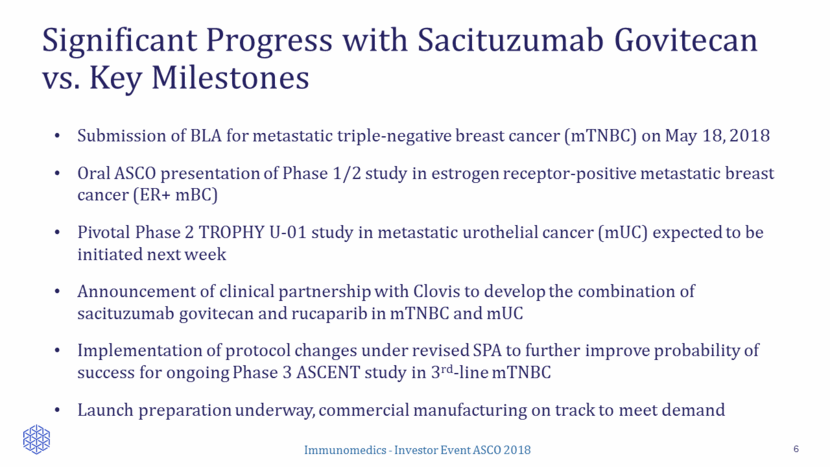
Significant Progress with Sacituzumab Govitecan vs. Key Milestones 6 Submission of BLA for metastatic triple-negative breast cancer (mTNBC) on May 18, 2018 Oral ASCO presentation of Phase 1/2 study in estrogen receptor-positive metastatic breast cancer (ER+ mBC) Pivotal Phase 2 TROPHY U-01 study in metastatic urothelial cancer (mUC) expected to be initiated next week Announcement of clinical partnership with Clovis to develop the combination of sacituzumab govitecan and rucaparib in mTNBC and mUC Implementation of protocol changes under revised SPA to further improve probability of success for ongoing Phase 3 ASCENT study in 3rd-line mTNBC Launch preparation underway, commercial manufacturing on track to meet demand
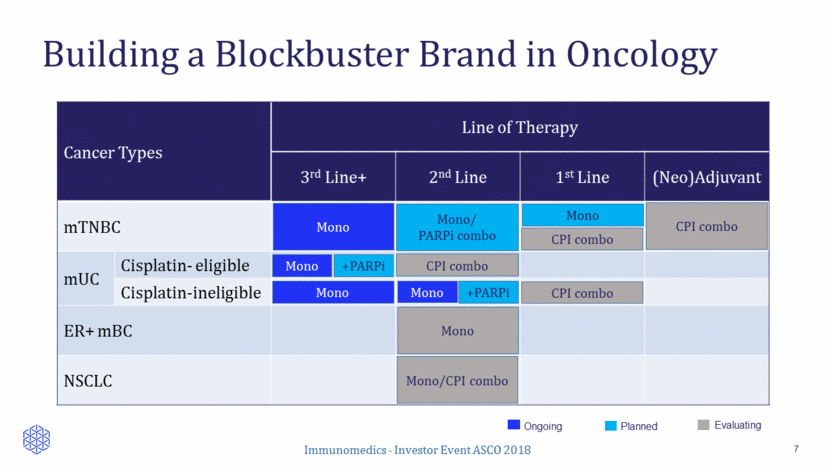
Building a Blockbuster Brand in Oncology 7 Cancer Types Line of Therapy 3rd Line+ 2nd Line 1st Line (Neo)Adjuvant mTNBC mUC Cisplatin- eligible Cisplatin-ineligible ER+ mBC NSCLC Mono Mono CPI combo Mono/ PARPi combo Mono +PARPi Mono +PARPi Planned Ongoing Evaluating CPI combo CPI combo Mono/CPI combo Mono CPI combo Mono
Sacituzumab Govitecan in Advanced Urothelial Cancer Scott Tagawa, M.D., MS Richard A. Stratton Associate Professor in Hematology & Oncology, Associate Professor of Clinical Medicine & Urology at Weill Cornell Medicine, and Associate Attending Physician at NewYork-Presbyterian – Weill Cornell Medical Center
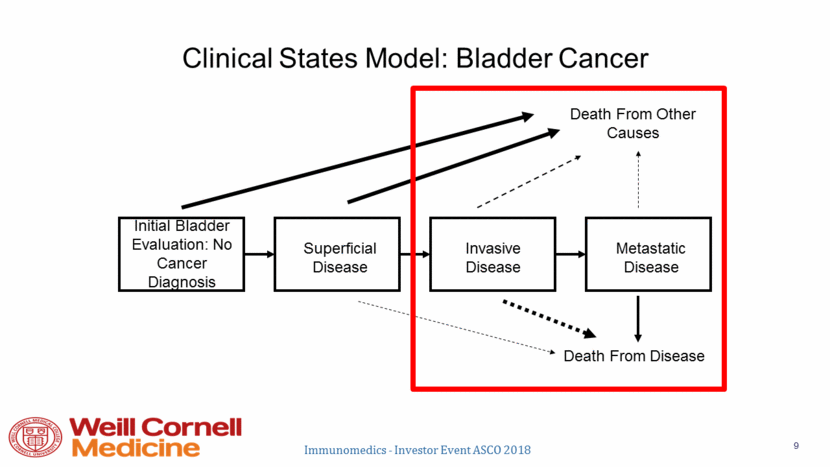
Initial Bladder Evaluation: No Cancer Diagnosis Superficial Disease Invasive Disease Metastatic Disease Death From Other Causes Death From Disease Clinical States Model: Bladder Cancer Immunomedics - Investor Event ASCO 2018 9
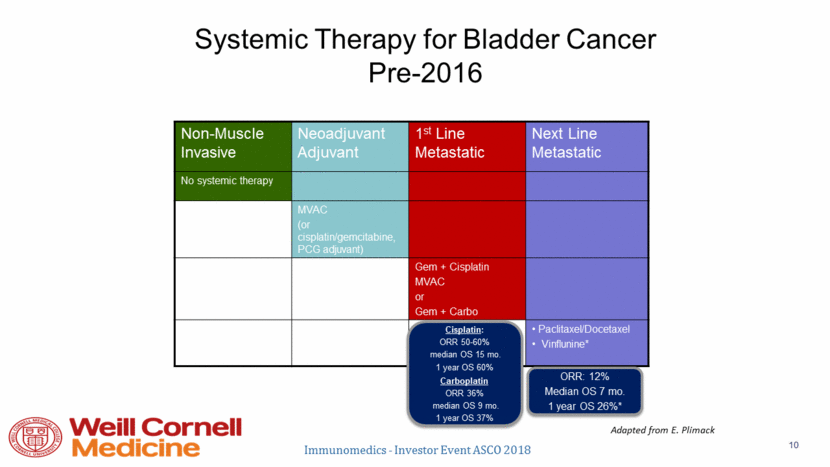
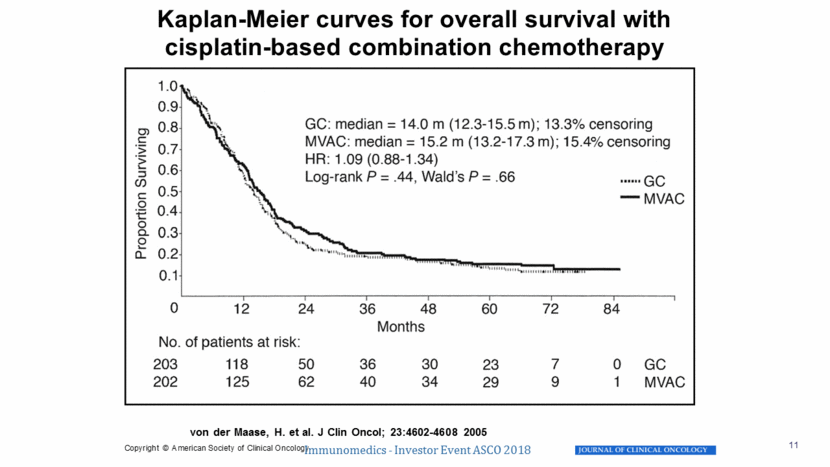
Systemic Therapy for Bladder Cancer Pre-2016 Non-Muscle Invasive Neoadjuvant Adjuvant 1st Line Metastatic Next Line Metastatic No systemic therapy MVAC (or cisplatin/gemcitabine, PCG adjuvant) Gem + Cisplatin MVAC or Gem + Carbo Paclitaxel/Docetaxel Vinflunine* Cisplatin: ORR 50-60% median OS 15 mo. 1 year OS 60% Carboplatin ORR 36% median OS 9 mo. 1 year OS 37% ORR: 12% Median OS 7 mo. 1 year OS 26%* Adapted from E. Plimack Immunomedics - Investor Event ASCO 2018 10
von der Maase, H. et al. J Clin Oncol; 23:4602-4608 2005 Kaplan-Meier curves for overall survival with cisplatin-based combination chemotherapy Immunomedics - Investor Event ASCO 2018 11 Copyright © American Society of Clinical Oncology
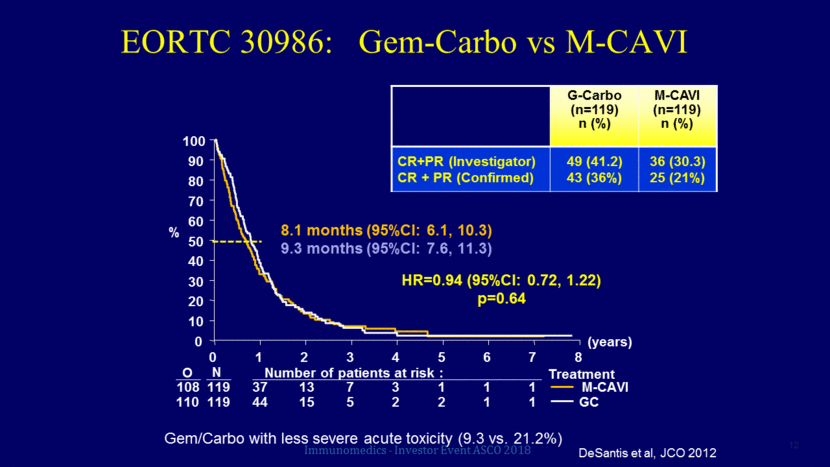
EORTC 30986: Gem-Carbo vs M-CAVI (years) 0 1 2 3 4 5 6 7 8 0 10 20 30 40 50 60 70 80 90 100 O N Number of patients at risk : Treatment 108 119 37 13 7 3 1 1 1 110 119 44 15 5 2 2 1 1 M-CAVI GC % HR=0.94 (95%CI: 0.72, 1.22) p=0.64 8.1 months (95%CI: 6.1, 10.3) 9.3 months (95%CI: 7.6, 11.3) G-Carbo (n=119) n (%) M-CAVI (n=119) n (%) CR+PR (Investigator) CR + PR (Confirmed) 49 (41.2) 43 (36%) 36 (30.3) 25 (21%) Gem/Carbo with less severe acute toxicity (9.3 vs. 21.2%) DeSantis et al, JCO 2012 Immunomedics - Investor Event ASCO 2018 12
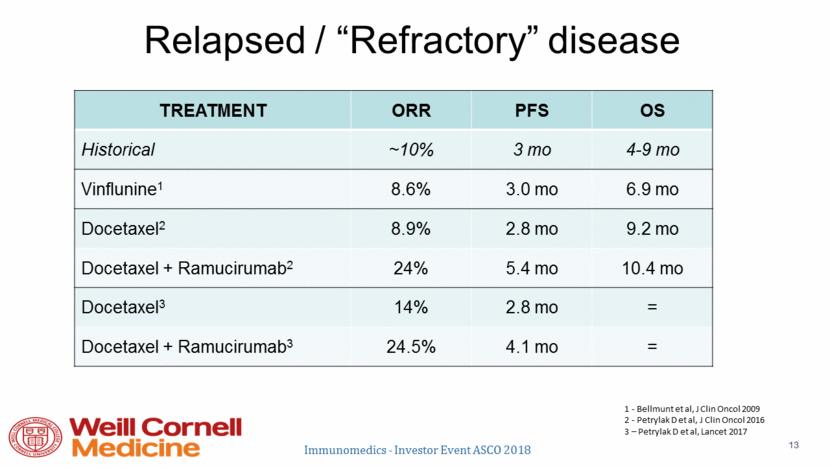
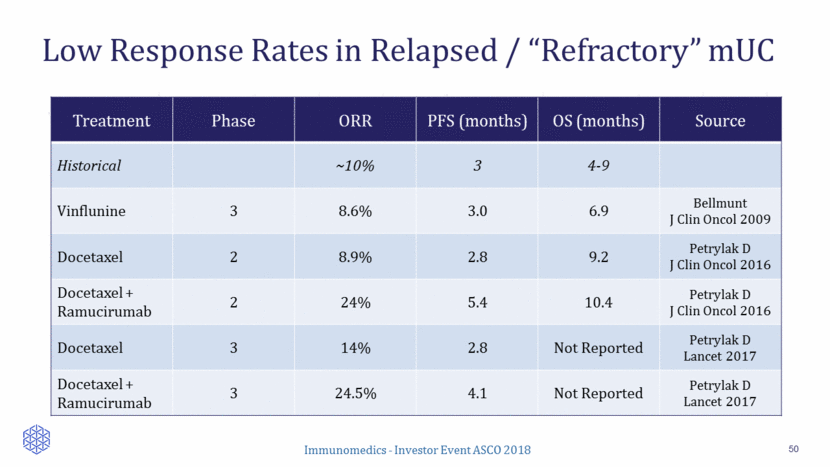
Relapsed / “Refractory” disease 1 - Bellmunt et al, J Clin Oncol 2009 2 - Petrylak D et al, J Clin Oncol 2016 3 – Petrylak D et al, Lancet 2017 TREATMENT ORR PFS OS Historical ~10% 3 mo 4-9 mo Vinflunine1 8.6% 3.0 mo 6.9 mo Docetaxel2 8.9% 2.8 mo 9.2 mo Docetaxel + Ramucirumab2 24% 5.4 mo 10.4 mo Docetaxel3 14% 2.8 mo = Docetaxel + Ramucirumab3 24.5% 4.1 mo = Immunomedics - Investor Event ASCO 2018 13
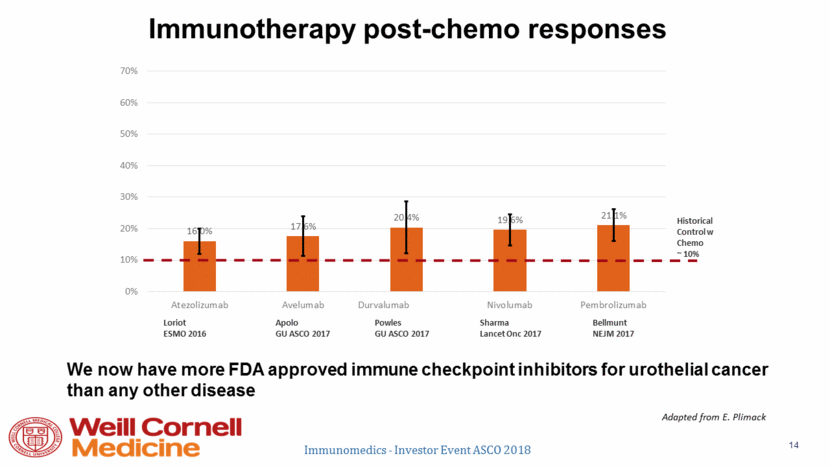
Immunotherapy post-chemo responses Historical Control w Chemo ~ 10% Apolo GU ASCO 2017 Powles GU ASCO 2017 Sharma Lancet Onc 2017 Bellmunt NEJM 2017 Loriot ESMO 2016 Adapted from E. Plimack We now have more FDA approved immune checkpoint inhibitors for urothelial cancer than any other disease Immunomedics - Investor Event ASCO 2018 14 16.0% 17.6% 20.4% 19.6% 21.1% 0% 10% 20% 30% 40% 50% 60% 70% Atezolizumab Avelumab Durvalumab ENRICHED Nivolumab Pembrolizumab
Short-term landscape Dual immune checkpoint inhibitor 1st line advanced? Cis/carbo + gem + PD(L)1 1st line advanced? Platinum chemo will remain peri-operative standard Docetaxel/ramucirumab? Gemcitabine/cisplatin + bevacizumab? Enfortumab vedotin? Erdafitinib? Regardless: Essentially all current/projected therapies only benefit a subset; unmet need remains Immunomedics - Investor Event ASCO 2018 15
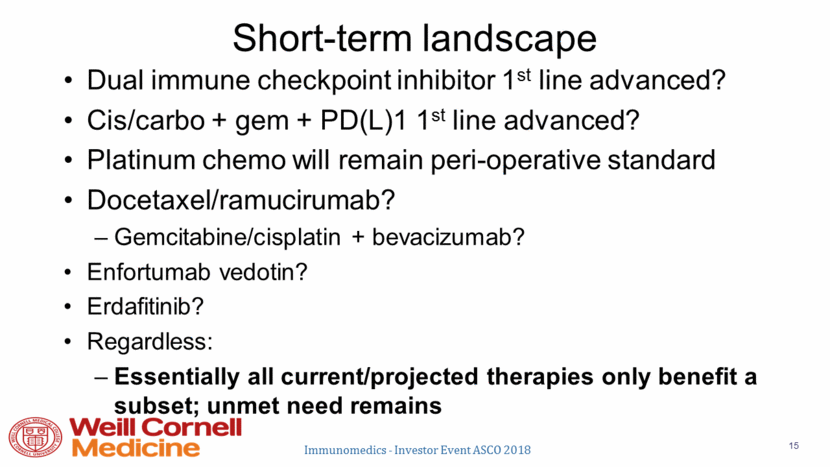
Single-Arm, Open-Label Study Design 16 Evaluations Response evaluation by Investigators according to RECIST v1.1 Other evaluations: safety, immunogenicity to sacituzumab govitecan, PK, Trop-2 expression in available tumor specimens by IHC staining Sacituzumab govitecan 10 mg/kg IV, days 1 and 8 every 21 days Continue treatment until progression or unacceptable toxicity Stage 4 (metastatic) urothelial cancer Key Eligibility Criteria Adults, >18 years of age Measurable disease by CT or MRI Progressed during or after >1 prior therapies ECOG: 0-1
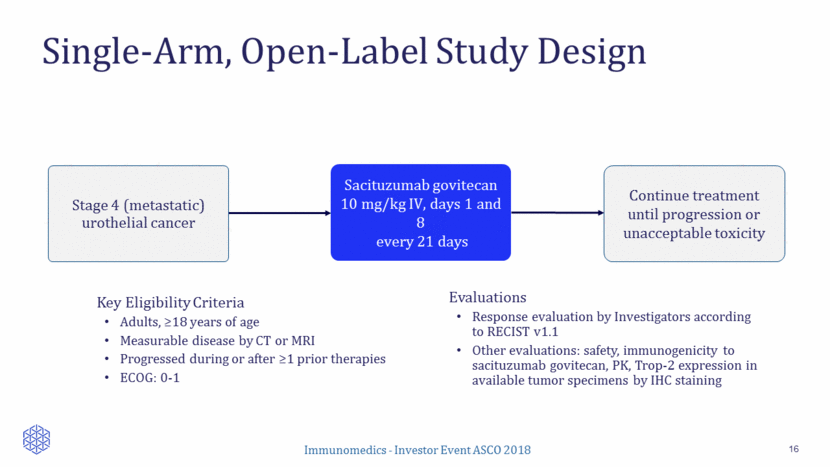
Demography & Baseline Characteristics (N=41) 17 Age, median (range ) 68 years (50 to 91) Gender M/F 38/3 ECOG (0/1) 9/32 Prior lines, median (range) 3 (1 to 6) 1 8 (20%) 2 8 (20% 3 15 (37%) > 4 10 (24%) Platinum combinations 38 (93%) Immune checkpoint inhibitors (I-O’s) 14 (34%) Metastatic Sites Liver 13 (32%) Bone 11 (27%) Any visceral disease 29 (71%) Presented at ESMO 2017 Congress
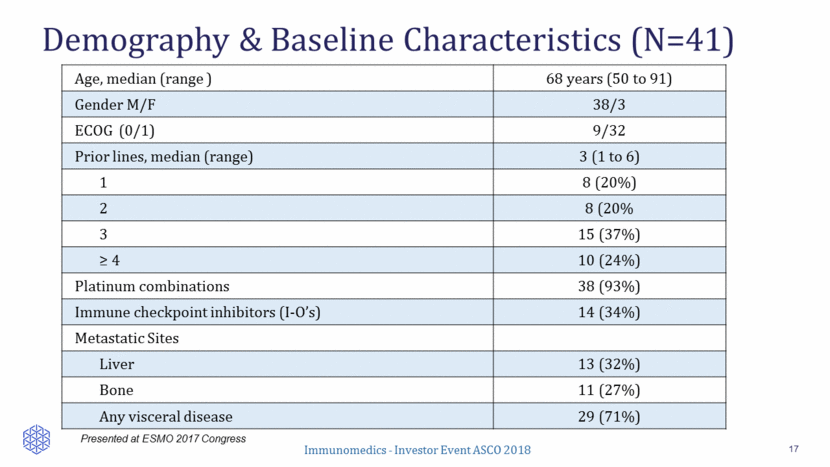
Best Response By RECIST 1.1 18 Response Assessments ORR: 34% (14/41) 2 CR (confirmed) 12 PR (confirmed) 13 Stable Disease (1 pt >30% and 3 pts >20% shrinkage) 9 Progression 5 inevaluable for response (withdrew early with no CT assessment; included as non-responders) Percent Reduction in Baseline Target Lesions 72% (26/36) of patients with at least one CT response assessment had reduction of target lesions (sum of diameters) Presented at ESMO 2017 Congress -100 -80 -60 -40 -20 0 20 40 60 B e s t R e s p o n s e B e s t % c h a n g e i n T L f r o m b a s e l i n e l l l l l l l l l l l l l S D P D l Complete response Partial response Stable disease Progression Prior checkpoint inhibitor Tx
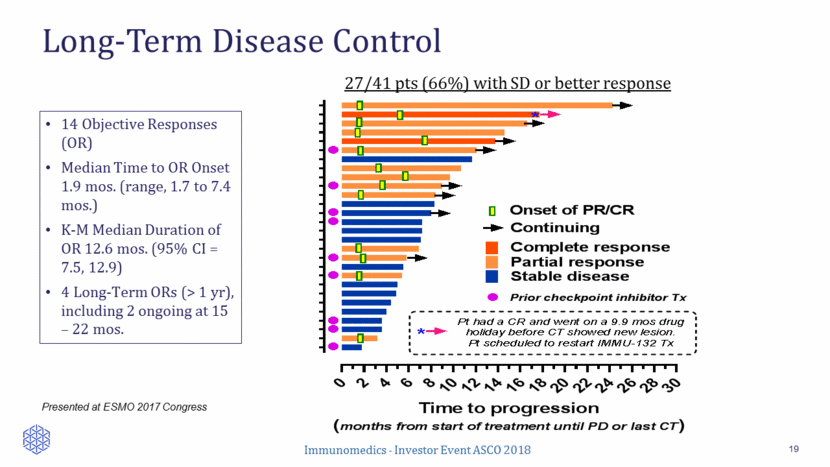
Long-Term Disease Control 19 Presented at ESMO 2017 Congress 27/41 pts (66%) with SD or better response 14 Objective Responses (OR) Median Time to OR Onset 1.9 mos. (range, 1.7 to 7.4 mos.) K-M Median Duration of OR 12.6 mos. (95% CI = 7.5, 12.9) 4 Long-Term ORs (> 1 yr), including 2 ongoing at 15 – 22 mos. 0 2 4 6 8 1 0 1 2 1 4 1 6 1 8 2 0 2 2 2 4 2 6 2 8 3 0 Time to progression ( months from start of treatment until PD or last CT ) l Complete response Partial response Stable disease Prior checkpoint inhibitor Tx l l l l l l l l l * * Continuing Pt had a CR and went on a 9.9 mos drug holiday before CT showed new lesion. Pt scheduled to restart IMMU-132 Tx Onset of PR/CR
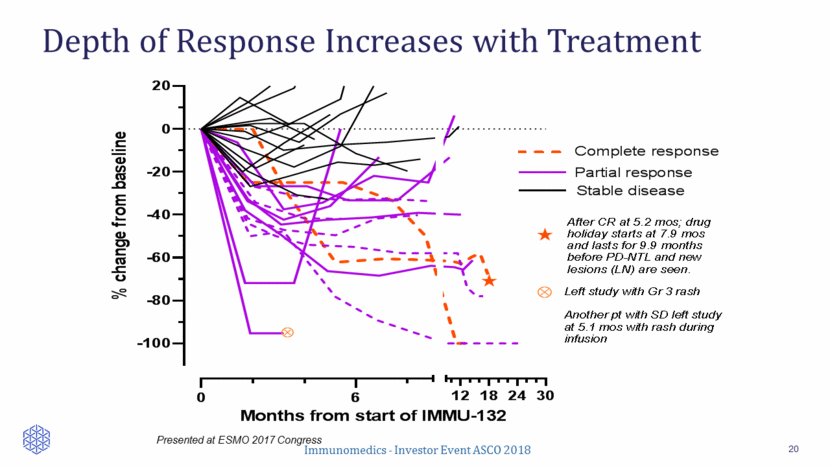
Depth of Response Increases with Treatment 20 Presented at ESMO 2017 Congress 0 6 -100 -80 -60 -40 -20 0 20 12 18 24 30 Months from start of IMMU-132 Ä Ä Left study with Gr 3 rash Another pt with SD left study at 5.1 mos with rash during infusion % c h a n g e f r o m b a s e l i n e After CR at 5.2 mos; drug holiday starts at 7.9 mos and lasts for 9.9 months before PD-NTL and new lesions (LN) are seen. « « Complete response Partial response Stable disease
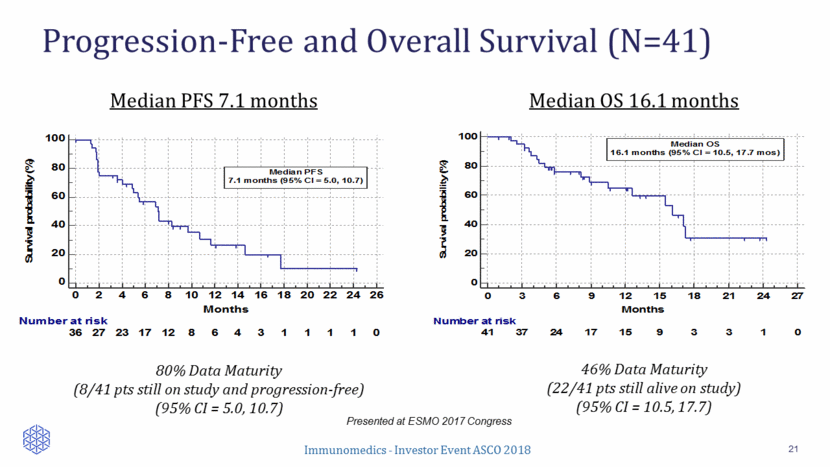
Progression-Free and Overall Survival (N=41) 21 Presented at ESMO 2017 Congress 46% Data Maturity (22/41 pts still alive on study) (95% CI = 10.5, 17.7) Median PFS 7.1 months Median OS 16.1 months 80% Data Maturity (8/41 pts still on study and progression-free) (95% CI = 5.0, 10.7) 0 20 40 60 80 100 0 2 4 6 8 10 12 14 16 18 20 22 24 26 Months Survival probability (%) Number at risk 36 27 23 17 12 8 6 4 3 1 1 1 1 0 Median PFS 7.1 months (95% CI = 5.0, 10.7) 0 20 40 60 80 100 0 3 6 9 12 15 18 21 24 27 Months Survival probability (%) Number at risk 41 37 24 17 15 9 3 3 1 0 Median OS 16.1 months (95% CI = 10.5, 17.7 mos)
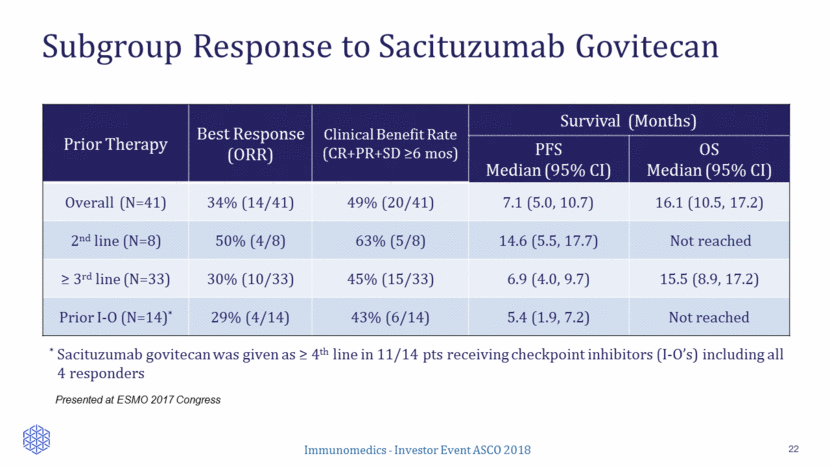
Subgroup Response to Sacituzumab Govitecan 22 Presented at ESMO 2017 Congress Prior Therapy Best Response (ORR) Clinical Benefit Rate (CR+PR+SD >6 mos) Survival (Months) PFS Median (95% CI) OS Median (95% CI) Overall (N=41) 34% (14/41) 49% (20/41) 7.1 (5.0, 10.7) 16.1 (10.5, 17.2) 2nd line (N=8) 50% (4/8) 63% (5/8) 14.6 (5.5, 17.7) Not reached > 3rd line (N=33) 30% (10/33) 45% (15/33) 6.9 (4.0, 9.7) 15.5 (8.9, 17.2) Prior I-O (N=14)* 29% (4/14) 43% (6/14) 5.4 (1.9, 7.2) Not reached * Sacituzumab govitecan was given as > 4th line in 11/14 pts receiving checkpoint inhibitors (I-O’s) including all 4 responders
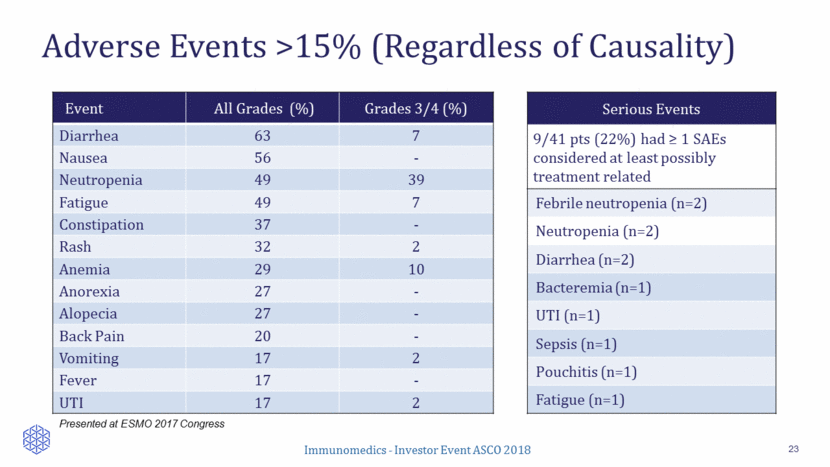
Event All Grades (%) Grades 3/4 (%) Diarrhea 63 7 Nausea 56 - Neutropenia 49 39 Fatigue 49 7 Constipation 37 - Rash 32 2 Anemia 29 10 Anorexia 27 - Alopecia 27 - Back Pain 20 - Vomiting 17 2 Fever 17 - UTI 17 2 Adverse Events >15% (Regardless of Causality) 23 Presented at ESMO 2017 Congress Serious Events 9/41 pts (22%) had > 1 SAEs considered at least possibly treatment related Febrile neutropenia (n=2) Neutropenia (n=2) Diarrhea (n=2) Bacteremia (n=1) UTI (n=1) Sepsis (n=1) Pouchitis (n=1) Fatigue (n=1)
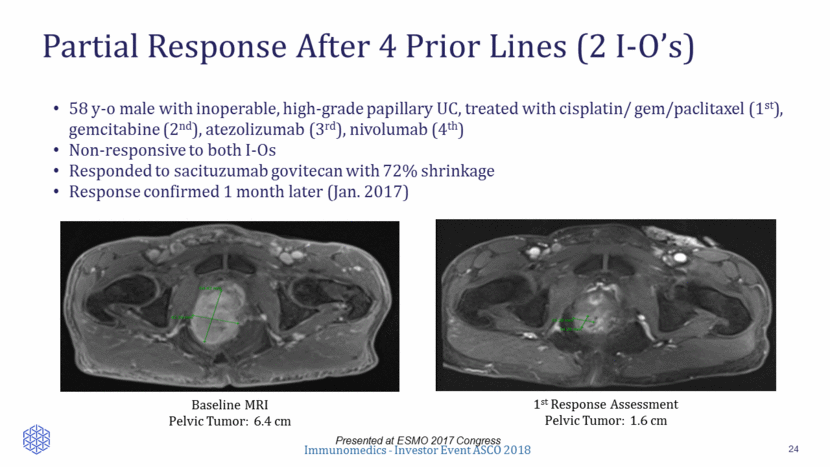
Partial Response After 4 Prior Lines (2 I-O’s) 24 Presented at ESMO 2017 Congress 58 y-o male with inoperable, high-grade papillary UC, treated with cisplatin/ gem/paclitaxel (1st), gemcitabine (2nd), atezolizumab (3rd), nivolumab (4th) Non-responsive to both I-Os Responded to sacituzumab govitecan with 72% shrinkage Response confirmed 1 month later (Jan. 2017) Baseline MRI Pelvic Tumor: 6.4 cm 1st Response Assessment Pelvic Tumor: 1.6 cm
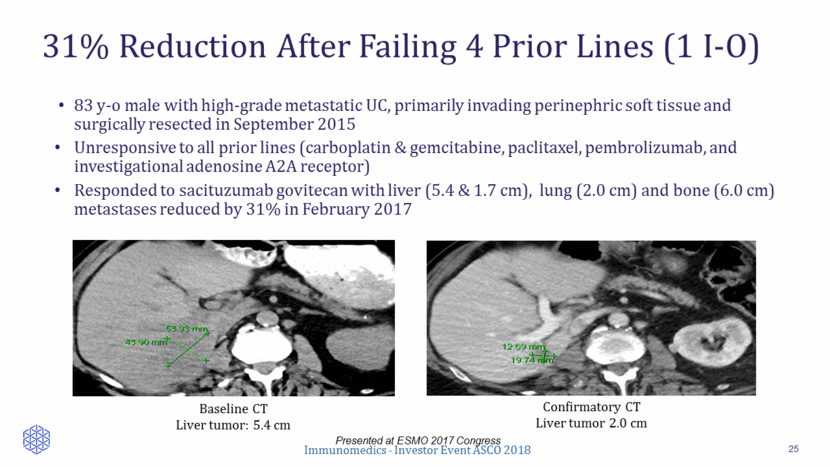
31% Reduction After Failing 4 Prior Lines (1 I-O) 25 Presented at ESMO 2017 Congress 83 y-o male with high-grade metastatic UC, primarily invading perinephric soft tissue and surgically resected in September 2015 Unresponsive to all prior lines (carboplatin & gemcitabine, paclitaxel, pembrolizumab, and investigational adenosine A2A receptor) Responded to sacituzumab govitecan with liver (5.4 & 1.7 cm), lung (2.0 cm) and bone (6.0 cm) metastases reduced by 31% in February 2017 Baseline CT Liver tumor: 5.4 cm Confirmatory CT Liver tumor 2.0 cm
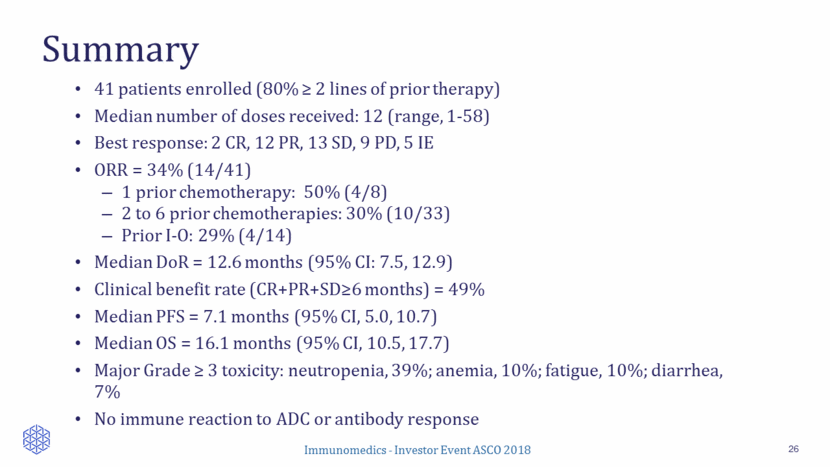
Summary 26 41 patients enrolled (80% > 2 lines of prior therapy) Median number of doses received: 12 (range, 1-58) Best response: 2 CR, 12 PR, 13 SD, 9 PD, 5 IE ORR = 34% (14/41) 1 prior chemotherapy: 50% (4/8) 2 to 6 prior chemotherapies: 30% (10/33) Prior I-O: 29% (4/14) Median DoR = 12.6 months (95% CI: 7.5, 12.9) Clinical benefit rate (CR+PR+SD>6 months) = 49% Median PFS = 7.1 months (95% CI, 5.0, 10.7) Median OS = 16.1 months (95% CI, 10.5, 17.7) Major Grade > 3 toxicity: neutropenia, 39%; anemia, 10%; fatigue, 10%; diarrhea, 7% No immune reaction to ADC or antibody response
Sacituzumab Govitecan – Phase 1/2 Results in HR+/HER2– Metastatic Breast Cancer Hope S. Rugo, M.D., FACP Professor of Medicine; and Director, Breast Oncology and Clinical Trials Education, University of California San Francisco Helen Diller Family Comprehensive Cancer Center
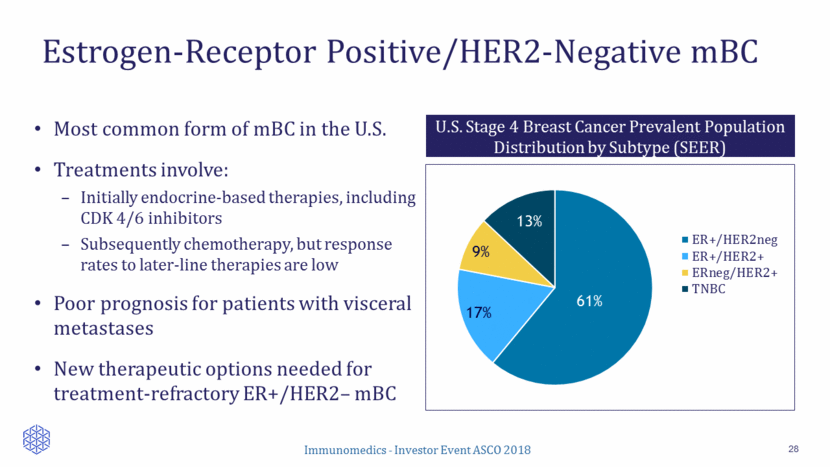
Estrogen-Receptor Positive/HER2-Negative mBC 28 Most common form of mBC in the U.S. Treatments involve: Initially endocrine-based therapies, including CDK 4/6 inhibitors Subsequently chemotherapy, but response rates to later-line therapies are low Poor prognosis for patients with visceral metastases New therapeutic options needed for treatment-refractory ER+/HER2– mBC U.S. Stage 4 Breast Cancer Prevalent Population Distribution by Subtype (SEER) 61% 17% 9% 13% ER+/HER2neg ER+/HER2+ ERneg/HER2+ TNBC
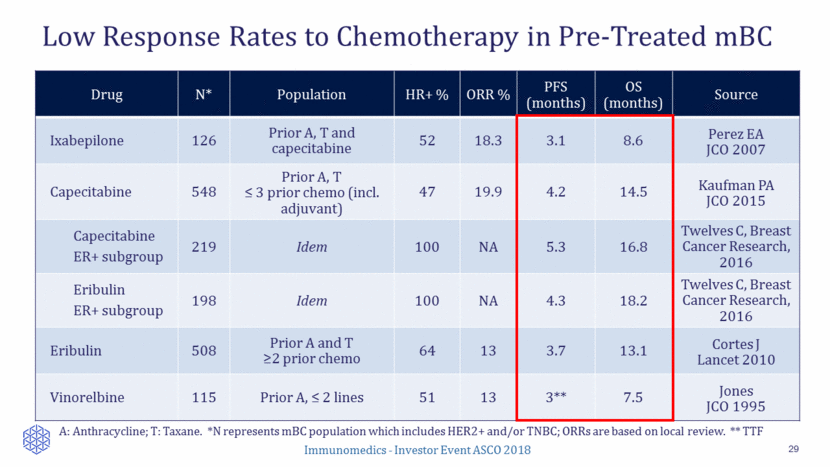
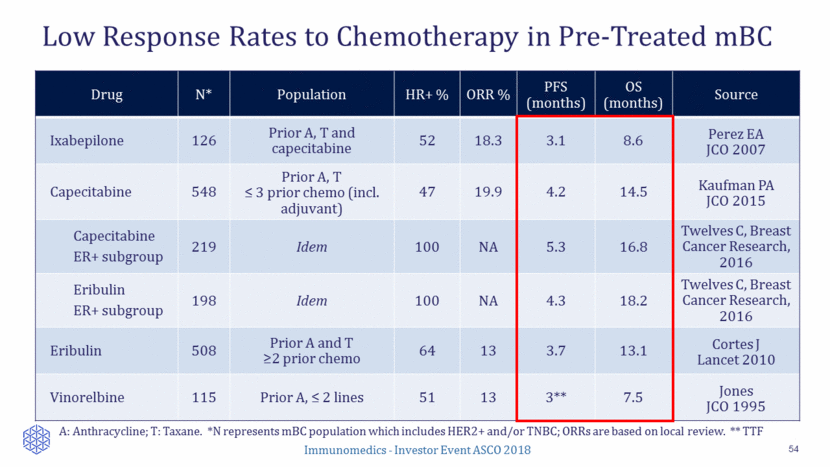
Low Response Rates to Chemotherapy in Pre-Treated mBC 29 A: Anthracycline; T: Taxane. *N represents mBC population which includes HER2+ and/or TNBC; ORRs are based on local review. ** TTF Drug N* Population HR+ % ORR % PFS (months) OS (months) Source Ixabepilone 126 Prior A, T and capecitabine 52 18.3 3.1 8.6 Perez EA JCO 2007 Capecitabine 548 Prior A, T < 3 prior chemo (incl. adjuvant) 47 19.9 4.2 14.5 Kaufman PA JCO 2015 Capecitabine ER+ subgroup 219 Idem 100 NA 5.3 16.8 Twelves C, Breast Cancer Research, 2016 Eribulin ER+ subgroup 198 Idem 100 NA 4.3 18.2 Twelves C, Breast Cancer Research, 2016 Eribulin 508 Prior A and T >2 prior chemo 64 13 3.7 13.1 Cortes J Lancet 2010 Vinorelbine 115 Prior A, < 2 lines 51 13 3** 7.5 Jones JCO 1995
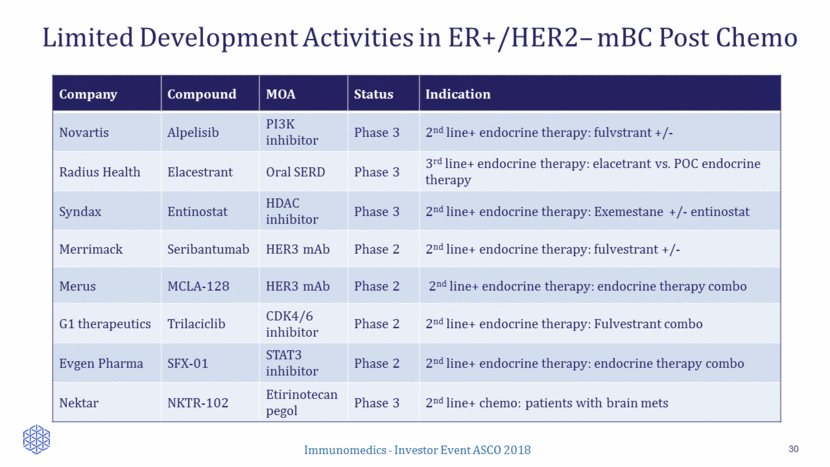
Limited Development Activities in ER+/HER2– mBC Post Chemo 30 Company Compound MOA Status Indication Novartis Alpelisib PI3K inhibitor Phase 3 2nd line+ endocrine therapy: fulvstrant +/- Radius Health Elacestrant Oral SERD Phase 3 3rd line+ endocrine therapy: elacetrant vs. POC endocrine therapy Syndax Entinostat HDAC inhibitor Phase 3 2nd line+ endocrine therapy: Exemestane +/- entinostat Merrimack Seribantumab HER3 mAb Phase 2 2nd line+ endocrine therapy: fulvestrant +/- Merus MCLA-128 HER3 mAb Phase 2 2nd line+ endocrine therapy: endocrine therapy combo G1 therapeutics Trilaciclib CDK4/6 inhibitor Phase 2 2nd line+ endocrine therapy: Fulvestrant combo Evgen Pharma SFX-01 STAT3 inhibitor Phase 2 2nd line+ endocrine therapy: endocrine therapy combo Nektar NKTR-102 Etirinotecan pegol Phase 3 2nd line+ chemo: patients with brain mets
Trop-2 Expression in Primary Breast Cancer 31 Objective: To investigate associations between Trop-2 expression, clinical characteristics, outcomes, and selected genes in primary BC, using microarray data from the neoadjuvant I-SPY 1 study (n=149), METABRIC (n=1992), and TCGA (n=817) datasets I-SPY 1 study – designed to evaluate pCR & tumor volume change measured by MRI in 221 patients receiving neoadjuvant chemotherapy METABRIC – includes breast cancer-specific survival data, whole gene expression & DNA copy-number data of 1992 resected primary breast tumors TCGA – includes mRNA expression, DNA copy-number changes, protein expression, DNA methylation status in 825 primary breast tumors Vidula N, Yau C, and Rugo HS. JCO 2017 35:15_suppl, 1075-1075
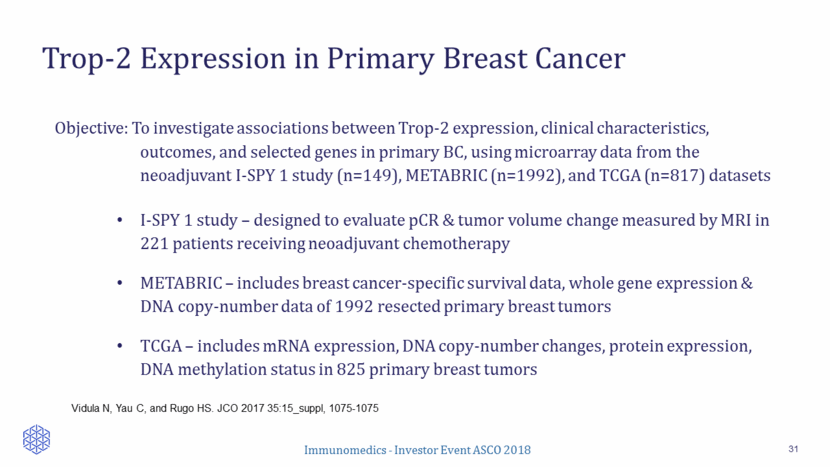
Trop-2 Expression in Primary Breast Cancer 32 In METABRIC and TCGA, Trop-2 expression was significantly lower in HER2+ than HR+/HER2- and TNBC Trop-2 expression was higher in grade I versus II/III BC in METABRIC In all 3 datasets, Trop-2 expression was detectable and had a wide range of expression in all BC subtypes In I-SPY 1, Trop-2 expression did not vary by hormone receptor (HR) and HER2 status, intrinsic subtype, nodal involvement, menopausal status, grade, stage, presence of LVI, or age Similarly, in METABRIC, Trop-2 expression was not significantly associated with age, menopausal status, nodal involvement, or stage
Trop-2 Expression in Primary Breast Cancer 33 Trop-2 expressed in all breast cancer subtypes, and has a wide range of expression Especially in luminal A , basal, and triple negative breast cancer May be higher in lower grade tumors Expression correlates with expression of several genes involved in cell epithelial transformation, adhesion, and proliferation, and inversely with immune genes Consistent with Trop-2’s role in cell proliferation, invasion, and survival, which may contribute to tumor growth Anti-Trop-2 ADC has been studied in triple negative breast cancer with promising outcomes Support use of Trop-2-directed ADC in all breast cancer subtypes Furthermore, based on gene expression profile of Trop-2, rationale drug combinations which target both cell proliferation and the Trop-2 receptor may be considered
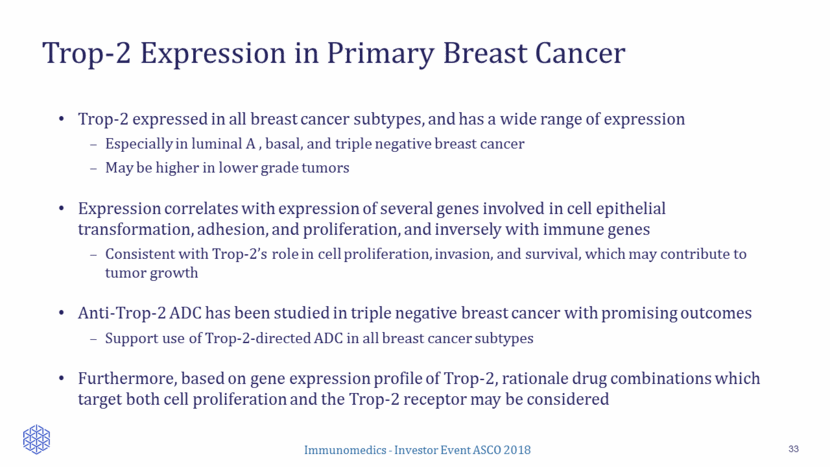
Single-Arm, Open-Label Study Design 34 Evaluations Response by local assessment (RECIST v1.1) Other: safety Sacituzumab govitecan 10 mg/kg IV d1 & 8, every 3 wks Continue treatment until progression/ unacceptable toxicity ER+/HER2– mBC at last biopsy Key Eligibility Criteria Adults, >18 years of age ECOG: 0-1 >1 prior metastatic therapies Measurable disease
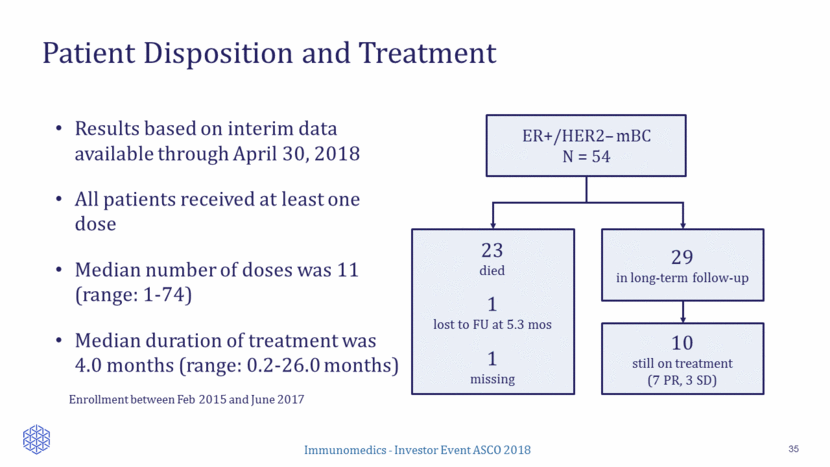
Patient Disposition and Treatment 35 ER+/HER2– mBC N = 54 23 died 1 lost to FU at 5.3 mos 1 missing Results based on interim data available through April 30, 2018 All patients received at least one dose Median number of doses was 11 (range: 1-74) Median duration of treatment was 4.0 months (range: 0.2-26.0 months) 10 still on treatment (7 PR, 3 SD) 29 in long-term follow-up Enrollment between Feb 2015 and June 2017
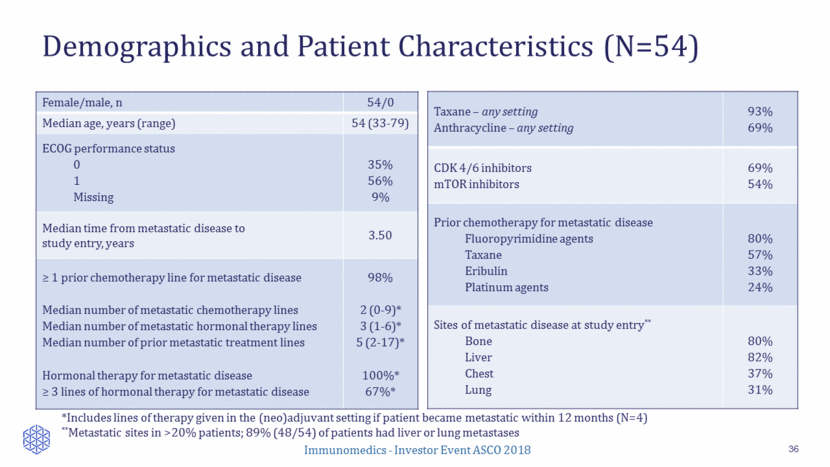
Demographics and Patient Characteristics (N=54) 36 *Includes lines of therapy given in the (neo)adjuvant setting if patient became metastatic within 12 months (N=4) **Metastatic sites in >20% patients; 89% (48/54) of patients had liver or lung metastases Taxane – any setting Anthracycline – any setting 93% 69% CDK 4/6 inhibitors mTOR inhibitors 69% 54% Prior chemotherapy for metastatic disease Fluoropyrimidine agents Taxane Eribulin Platinum agents 80% 57% 33% 24% Sites of metastatic disease at study entry** Bone Liver Chest Lung 80% 82% 37% 31% Female/male, n 54/0 Median age, years (range) 54 (33-79) ECOG performance status 0 1 Missing 35% 56% 9% Median time from metastatic disease to study entry, years 3.50 > 1 prior chemotherapy line for metastatic disease Median number of metastatic chemotherapy lines Median number of metastatic hormonal therapy lines Median number of prior metastatic treatment lines Hormonal therapy for metastatic disease > 3 lines of hormonal therapy for metastatic disease 98% 2 (0-9)* 3 (1-6)* 5 (2-17)* 100%* 67%*
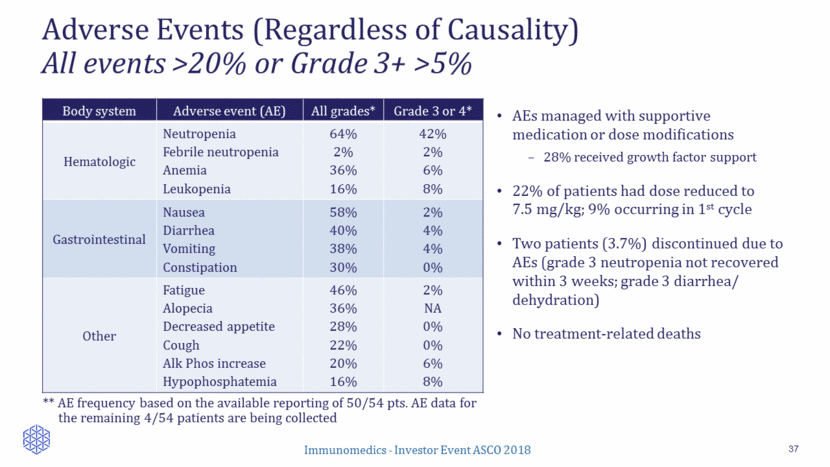
Adverse Events (Regardless of Causality) All events >20% or Grade 3+ >5% 37 ** AE frequency based on the available reporting of 50/54 pts. AE data for the remaining 4/54 patients are being collected Body system Adverse event (AE) All grades* Grade 3 or 4* Hematologic Neutropenia Febrile neutropenia Anemia Leukopenia 64% 2% 36% 16% 42% 2% 6% 8% Gastrointestinal Nausea Diarrhea Vomiting Constipation 58% 40% 38% 30% 2% 4% 4% 0% Other Fatigue Alopecia Decreased appetite Cough Alk Phos increase Hypophosphatemia 46% 36% 28% 22% 20% 16% 2% NA 0% 0% 6% 8% AEs managed with supportive medication or dose modifications 28% received growth factor support 22% of patients had dose reduced to 7.5 mg/kg; 9% occurring in 1st cycle Two patients (3.7%) discontinued due to AEs (grade 3 neutropenia not recovered within 3 weeks; grade 3 diarrhea/ dehydration) No treatment-related deaths
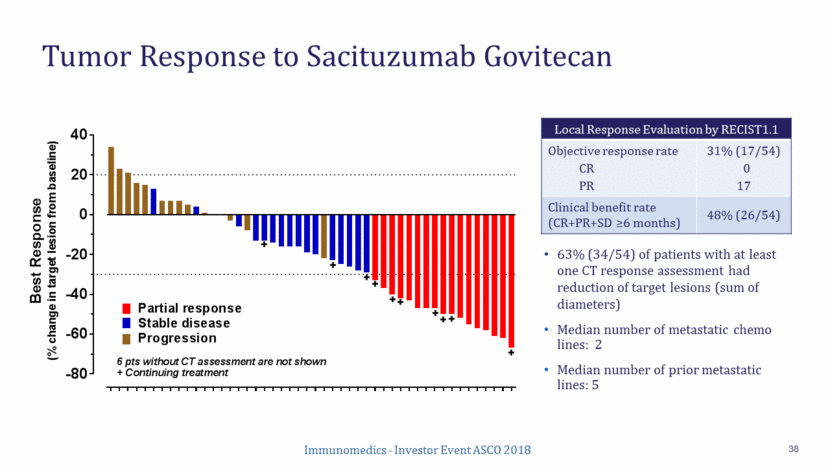
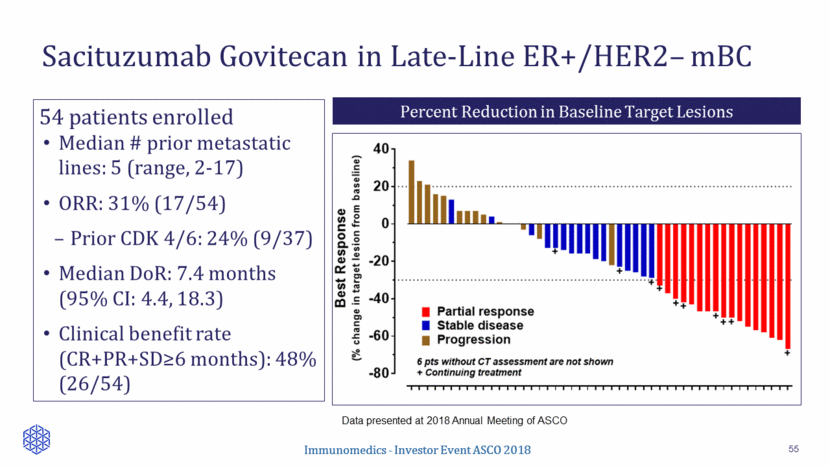
Tumor Response to Sacituzumab Govitecan 38 63% (34/54) of patients with at least one CT response assessment had reduction of target lesions (sum of diameters) Median number of metastatic chemo lines: 2 Median number of prior metastatic lines: 5 Local Response Evaluation by RECIST1.1 Objective response rate CR PR 31% (17/54) 0 17 Clinical benefit rate (CR+PR+SD >6 months) 48% (26/54) Immunomedics - Investor Event ASCO 2018
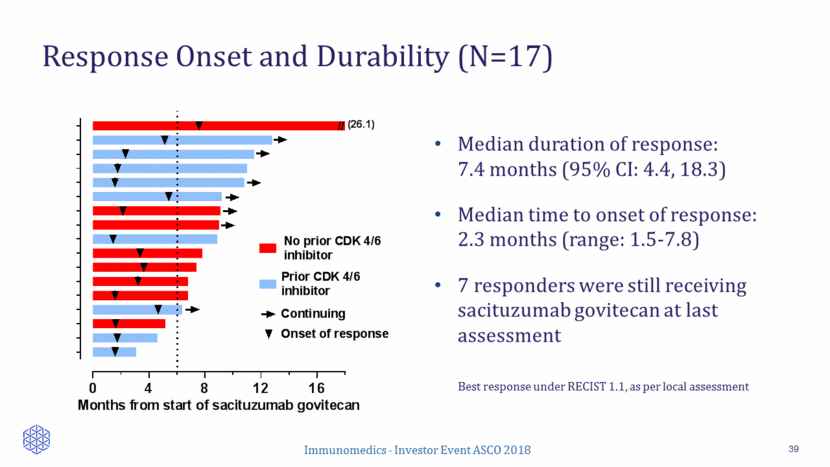
Response Onset and Durability (N=17) 39 Median duration of response: 7.4 months (95% CI: 4.4, 18.3) Median time to onset of response: 2.3 months (range: 1.5-7.8) 7 responders were still receiving sacituzumab govitecan at last assessment Best response under RECIST 1.1, as per local assessment 0 4 8 12 16 Months from start of sacituzumab govitecan Continuing Onset of response // (26.1) Prior CDK 4/6 inhibitor No prior CDK 4/6 inhibitor
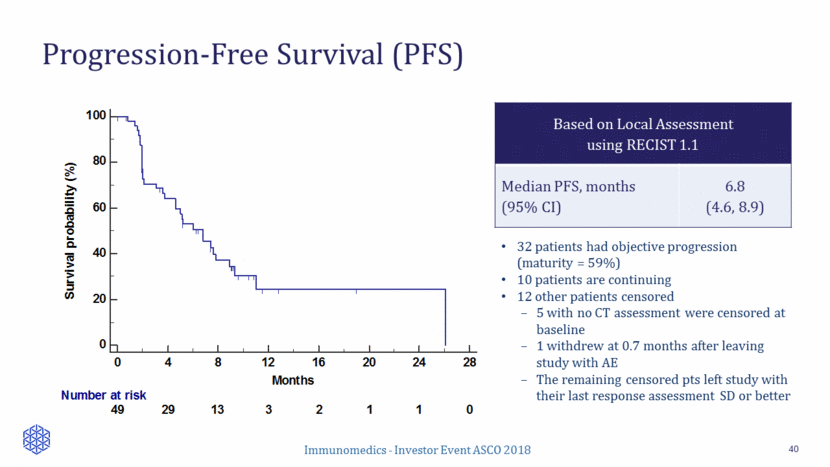
Progression-Free Survival (PFS) 40 Based on Local Assessment using RECIST 1.1 Median PFS, months (95% CI) 6.8 (4.6, 8.9) 32 patients had objective progression (maturity = 59%) 10 patients are continuing 12 other patients censored 5 with no CT assessment were censored at baseline 1 withdrew at 0.7 months after leaving study with AE The remaining censored pts left study with their last response assessment SD or better 0 20 40 60 80 100 0 4 8 12 16 20 24 28 Months Survival probability (%) Number at risk 49 29 13 3 2 1 1 0
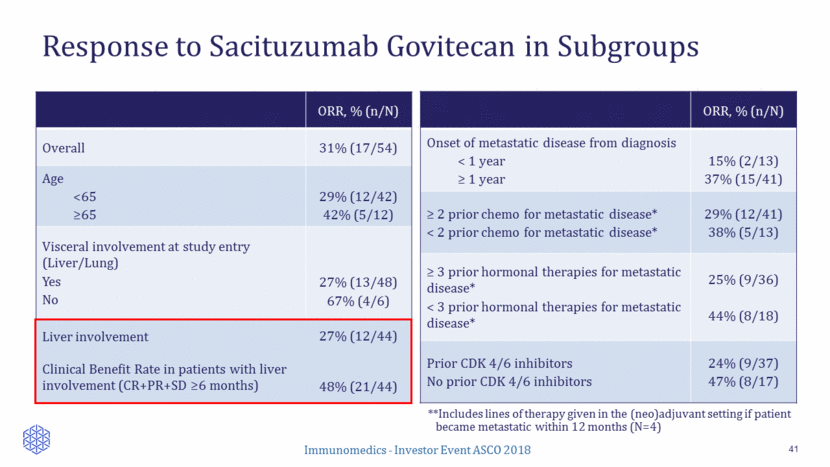
Response to Sacituzumab Govitecan in Subgroups 41 **Includes lines of therapy given in the (neo)adjuvant setting if patient became metastatic within 12 months (N=4) ORR, % (n/N) Onset of metastatic disease from diagnosis < 1 year > 1 year 15% (2/13) 37% (15/41) > 2 prior chemo for metastatic disease* < 2 prior chemo for metastatic disease* 29% (12/41) 38% (5/13) > 3 prior hormonal therapies for metastatic disease* < 3 prior hormonal therapies for metastatic disease* 25% (9/36) 44% (8/18) Prior CDK 4/6 inhibitors No prior CDK 4/6 inhibitors 24% (9/37) 47% (8/17) ORR, % (n/N) Overall 31% (17/54) Age <65 >65 29% (12/42) 42% (5/12) Visceral involvement at study entry (Liver/Lung) Yes No 27% (13/48) 67% (4/6) Liver involvement Clinical Benefit Rate in patients with liver involvement (CR+PR+SD >6 months) 27% (12/44) 48% (21/44)
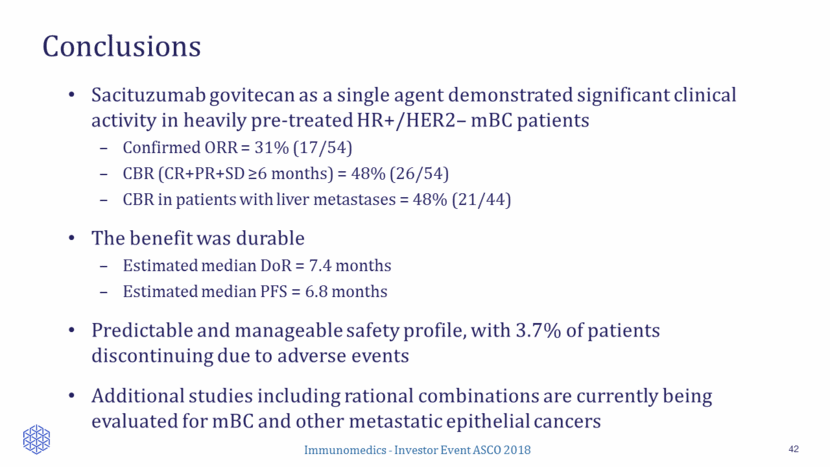
Conclusions 42 Sacituzumab govitecan as a single agent demonstrated significant clinical activity in heavily pre-treated HR+/HER2– mBC patients Confirmed ORR = 31% (17/54) CBR (CR+PR+SD >6 months) = 48% (26/54) CBR in patients with liver metastases = 48% (21/44) The benefit was durable Estimated median DoR = 7.4 months Estimated median PFS = 6.8 months Predictable and manageable safety profile, with 3.7% of patients discontinuing due to adverse events Additional studies including rational combinations are currently being evaluated for mBC and other metastatic epithelial cancers
Sacituzumab Govitecan Development Plan Robert Iannone, M.D., M.S.C.E. Head of Research & Development and Chief Medical Officer
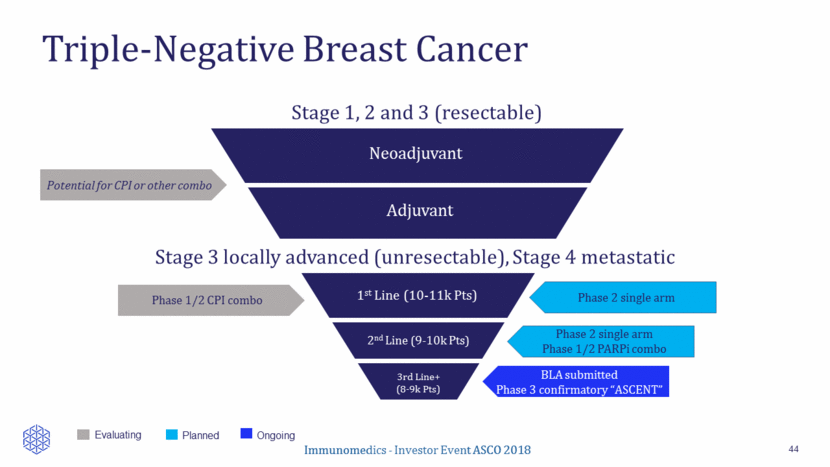
Triple-Negative Breast Cancer 44 BLA submitted Phase 3 confirmatory “ASCENT” Potential for CPI or other combo Planned Ongoing Evaluating Phase 2 single arm Phase 1/2 PARPi combo Neoadjuvant Adjuvant 1st Line (10-11k Pts) 2nd Line (9-10k Pts) 3rd Line+ (8-9k Pts) Stage 3 locally advanced (unresectable), Stage 4 metastatic Stage 1, 2 and 3 (resectable) Immunomedics - Investor Event ASCO 2018 Phase 1/2 CPI combo Phase 2 single arm
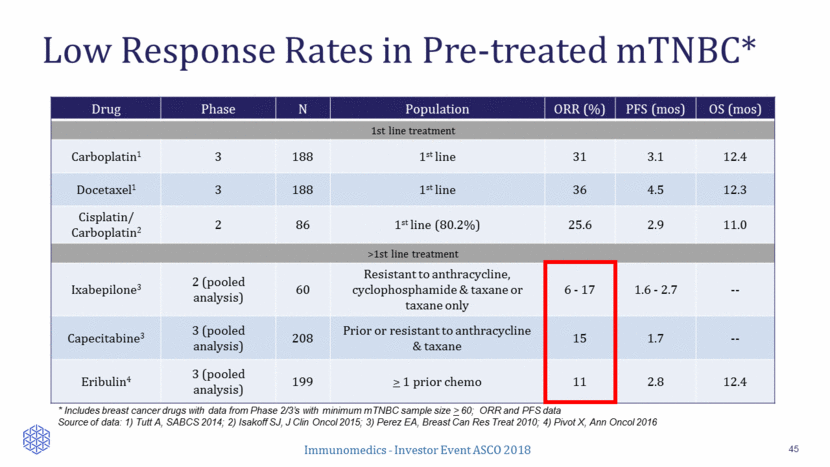
Low Response Rates in Pre-treated mTNBC* 45 Drug Phase N Population ORR (%) PFS (mos) OS (mos) 1st line treatment Carboplatin1 3 188 1st line 31 3.1 12.4 Docetaxel1 3 188 1st line 36 4.5 12.3 Cisplatin/ Carboplatin2 2 86 1st line (80.2%) 25.6 2.9 11.0 >1st line treatment Ixabepilone3 2 (pooled analysis) 60 Resistant to anthracycline, cyclophosphamide & taxane or taxane only 6 - 17 1.6 - 2.7 -- Capecitabine3 3 (pooled analysis) 208 Prior or resistant to anthracycline & taxane 15 1.7 -- Eribulin4 3 (pooled analysis) 199 > 1 prior chemo 11 2.8 12.4 * Includes breast cancer drugs with data from Phase 2/3’s with minimum mTNBC sample size > 60; ORR and PFS data Source of data: 1) Tutt A, SABCS 2014; 2) Isakoff SJ, J Clin Oncol 2015; 3) Perez EA, Breast Can Res Treat 2010; 4) Pivot X, Ann Oncol 2016
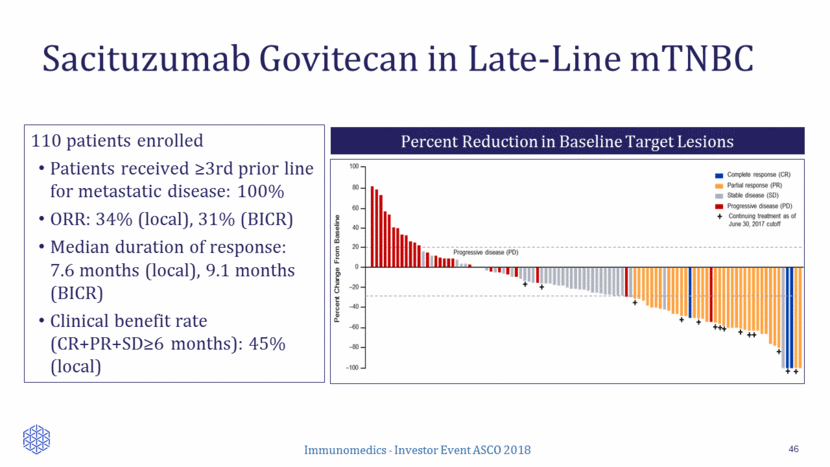
Sacituzumab Govitecan in Late-Line mTNBC 46 110 patients enrolled Patients received >3rd prior line for metastatic disease: 100% ORR: 34% (local), 31% (BICR) Median duration of response: 7.6 months (local), 9.1 months (BICR) Clinical benefit rate (CR+PR+SD>6 months): 45% (local) Percent Reduction in Baseline Target Lesions
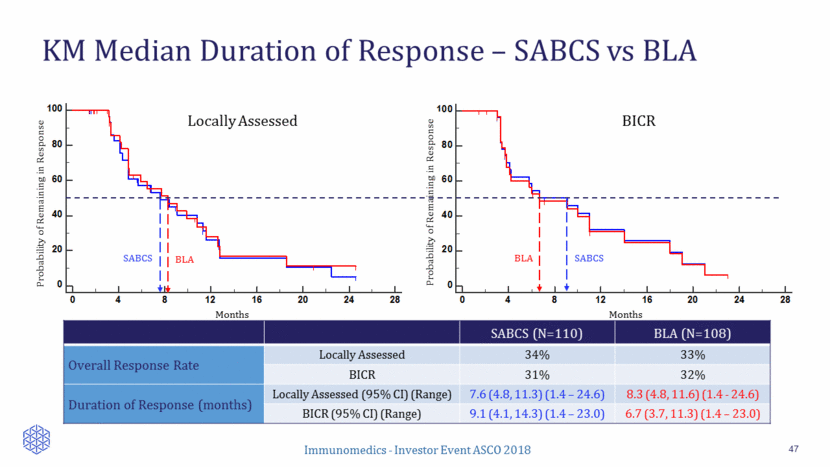
Months Months Locally Assessed BICR KM Median Duration of Response – SABCS vs BLA 47 SABCS (N=110) BLA (N=108) Overall Response Rate Locally Assessed 34% 33% BICR 31% 32% Duration of Response (months) Locally Assessed (95% CI) (Range) 7.6 (4.8, 11.3) (1.4 – 24.6) 8.3 (4.8, 11.6) (1.4 - 24.6) BICR (95% CI) (Range) 9.1 (4.1, 14.3) (1.4 – 23.0) 6.7 (3.7, 11.3) (1.4 – 23.0) Probability of Remaining in Response Probability of Remaining in Response SABCS BLA BLA SABCS 0 20 40 60 80 100 0 4 8 12 16 20 24 28 Months Probability (%) Number at risk Group: 1: SABC (Central) 34 18 11 5 4 2 0 Group: 2: BLA (Central) 35 18 11 5 4 2 0 Duration of Response 1: SABC (Central) 2: BLA (Central) 0 20 40 60 80 100 0 4 8 12 16 20 24 28 Months Probability (%) Number at risk Group: 1: SABC (Local) 37 23 12 5 3 2 1 0 Group: 2: BLA (Local) 36 23 12 5 3 2 1 0 Duration of Response 1: SABC (Local) 2: BLA (Local)
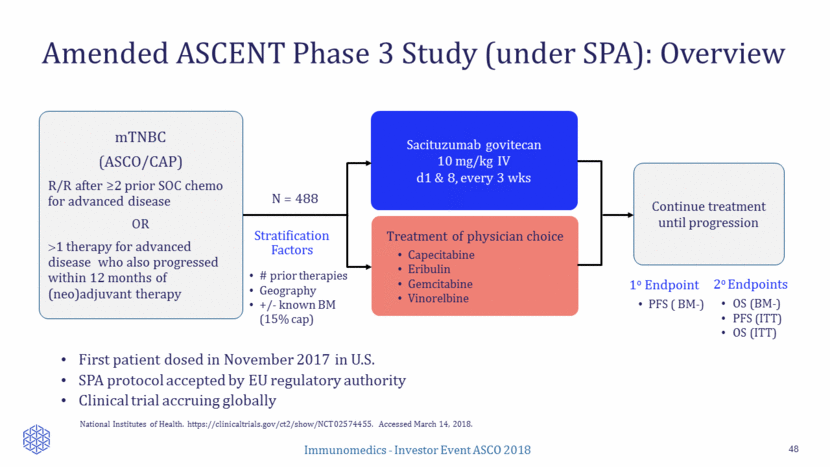
Amended ASCENT Phase 3 Study (under SPA): Overview 48 National Institutes of Health. https://clinicaltrials.gov/ct2/show/NCT02574455. Accessed March 14, 2018. First patient dosed in November 2017 in U.S. SPA protocol accepted by EU regulatory authority Clinical trial accruing globally 1o Endpoint PFS ( BM-) Sacituzumab govitecan 10 mg/kg IV d1 & 8, every 3 wks Treatment of physician choice Capecitabine Eribulin Gemcitabine Vinorelbine Stratification Factors Continue treatment until progression N = 488 mTNBC (ASCO/CAP) R/R after >2 prior SOC chemo for advanced disease OR 1 therapy for advanced disease who also progressed within 12 months of (neo)adjuvant therapy # prior therapies Geography +/- known BM (15% cap) 2o Endpoints OS (BM-) PFS (ITT) OS (ITT)
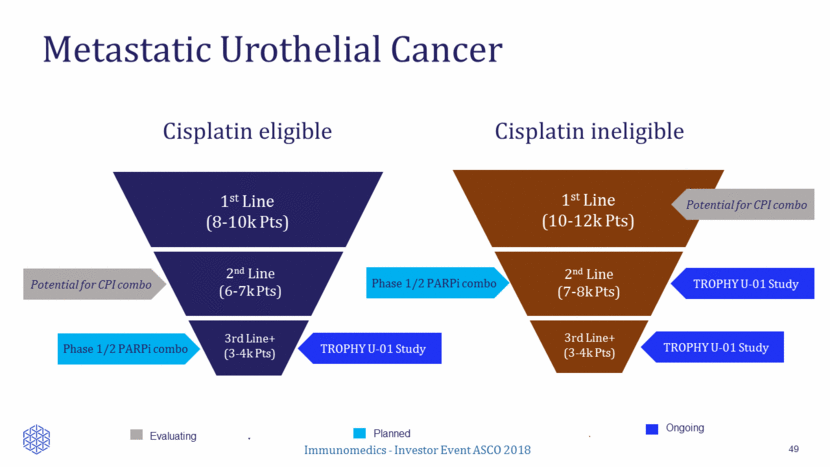
Metastatic Urothelial Cancer 49 Planned TROPHY U-01 Study Phase 1/2 PARPi combo TROPHY U-01 Study Cisplatin eligible Cisplatin ineligible Phase 1/2 PARPi combo 1st Line (10-12k Pts) 2nd Line (7-8k Pts) 3rd Line+ (3-4k Pts) 1st Line (8-10k Pts) 2nd Line (6-7k Pts) 3rd Line+ (3-4k Pts) Ongoing Potential for CPI combo Evaluating Potential for CPI combo TROPHY U-01 Study
Low Response Rates in Relapsed / “Refractory” mUC 50 Treatment Phase ORR PFS (months) OS (months) Source Historical ~10% 3 4-9 Vinflunine 3 8.6% 3.0 6.9 Bellmunt J Clin Oncol 2009 Docetaxel 2 8.9% 2.8 9.2 Petrylak D J Clin Oncol 2016 Docetaxel + Ramucirumab 2 24% 5.4 10.4 Petrylak D J Clin Oncol 2016 Docetaxel 3 14% 2.8 Not Reported Petrylak D Lancet 2017 Docetaxel + Ramucirumab 3 24.5% 4.1 Not Reported Petrylak D Lancet 2017
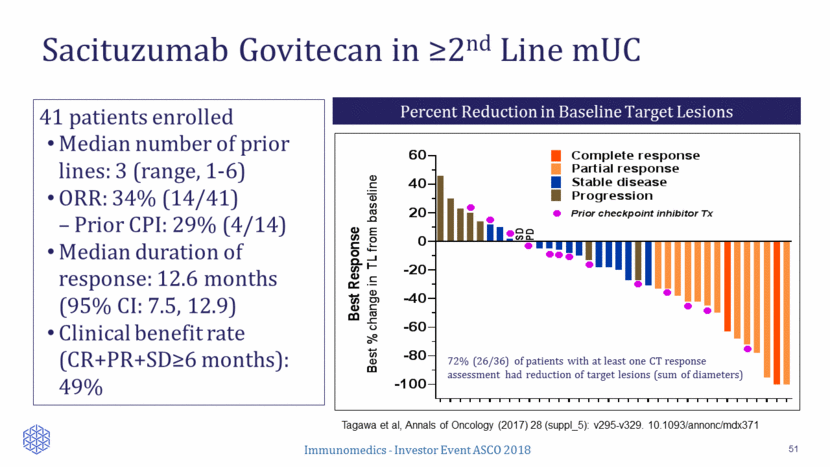
Sacituzumab Govitecan in >2nd Line mUC 51 41 patients enrolled Median number of prior lines: 3 (range, 1-6) ORR: 34% (14/41) Prior CPI: 29% (4/14) Median duration of response: 12.6 months (95% CI: 7.5, 12.9) Clinical benefit rate (CR+PR+SD>6 months): 49% Percent Reduction in Baseline Target Lesions 72% (26/36) of patients with at least one CT response assessment had reduction of target lesions (sum of diameters) Tagawa et al, Annals of Oncology (2017) 28 (suppl_5): v295-v329. 10.1093/annonc/mdx371 -100 -80 -60 -40 -20 0 20 40 60 B e s t R e s p o n s e B e s t % c h a n g e i n T L f r o m b a s e l i n e l l l l l l l l l l l l l S D P D l Complete response Partial response Stable disease Progression Prior checkpoint inhibitor Tx
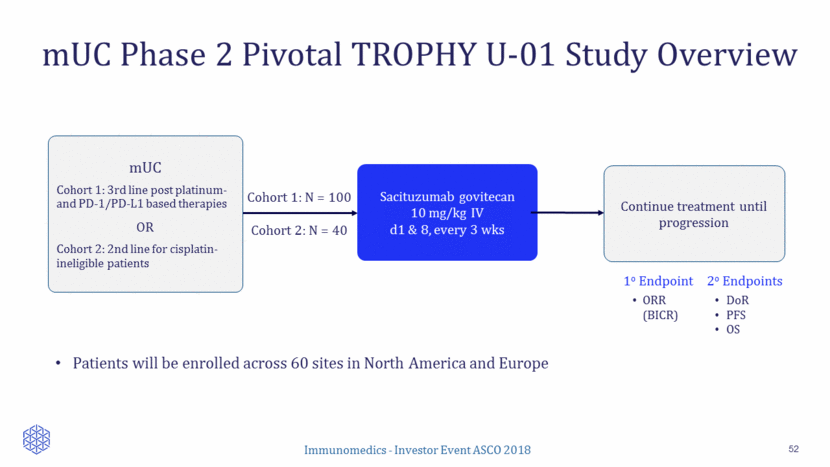
Cohort 1: N = 100 Cohort 2: N = 40 mUC Phase 2 Pivotal TROPHY U-01 Study Overview 52 Patients will be enrolled across 60 sites in North America and Europe 1o Endpoint ORR (BICR) Sacituzumab govitecan 10 mg/kg IV d1 & 8, every 3 wks Continue treatment until progression mUC Cohort 1: 3rd line post platinum- and PD-1/PD-L1 based therapies OR Cohort 2: 2nd line for cisplatin-ineligible patients 2o Endpoints DoR PFS OS
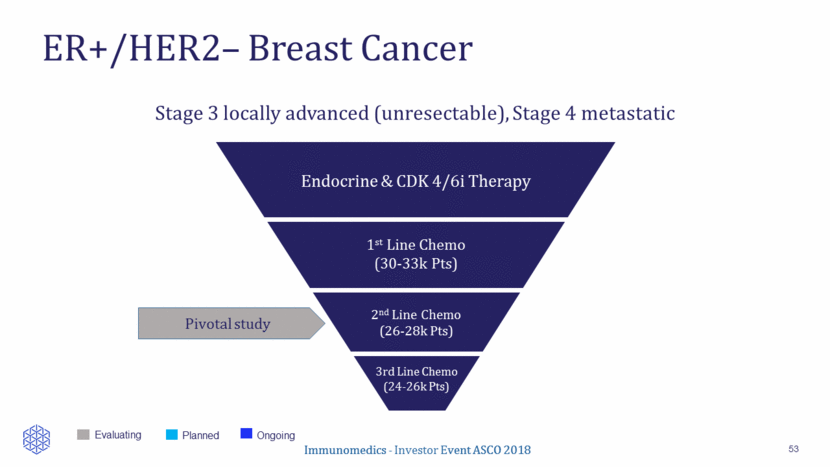
ER+/HER2– Breast Cancer 53 Stage 3 locally advanced (unresectable), Stage 4 metastatic Pivotal study Endocrine & CDK 4/6i Therapy 1st Line Chemo (30-33k Pts) 2nd Line Chemo (26-28k Pts) 3rd Line Chemo (24-26k Pts) Immunomedics - Investor Event ASCO 2018 Planned Ongoing Evaluating
Low Response Rates to Chemotherapy in Pre-Treated mBC 54 A: Anthracycline; T: Taxane. *N represents mBC population which includes HER2+ and/or TNBC; ORRs are based on local review. ** TTF Drug N* Population HR+ % ORR % PFS (months) OS (months) Source Ixabepilone 126 Prior A, T and capecitabine 52 18.3 3.1 8.6 Perez EA JCO 2007 Capecitabine 548 Prior A, T < 3 prior chemo (incl. adjuvant) 47 19.9 4.2 14.5 Kaufman PA JCO 2015 Capecitabine ER+ subgroup 219 Idem 100 NA 5.3 16.8 Twelves C, Breast Cancer Research, 2016 Eribulin ER+ subgroup 198 Idem 100 NA 4.3 18.2 Twelves C, Breast Cancer Research, 2016 Eribulin 508 Prior A and T >2 prior chemo 64 13 3.7 13.1 Cortes J Lancet 2010 Vinorelbine 115 Prior A, < 2 lines 51 13 3** 7.5 Jones JCO 1995
Sacituzumab Govitecan in Late-Line ER+/HER2– mBC 55 Immunomedics - Investor Event ASCO 2018 54 patients enrolled Median # prior metastatic lines: 5 (range, 2- 17) ORR: 31% (17/54) Prior CDK 4/6: 24% (9/37) Median DoR: 7.4 months (95% CI: 4.4, 18.3) Clinical benefit rate (CR+PR+SD>6 months): 48% (26/54) Percent Reduction in Baseline Target Lesions Data presented at 2018 Annual Meeting of ASCO
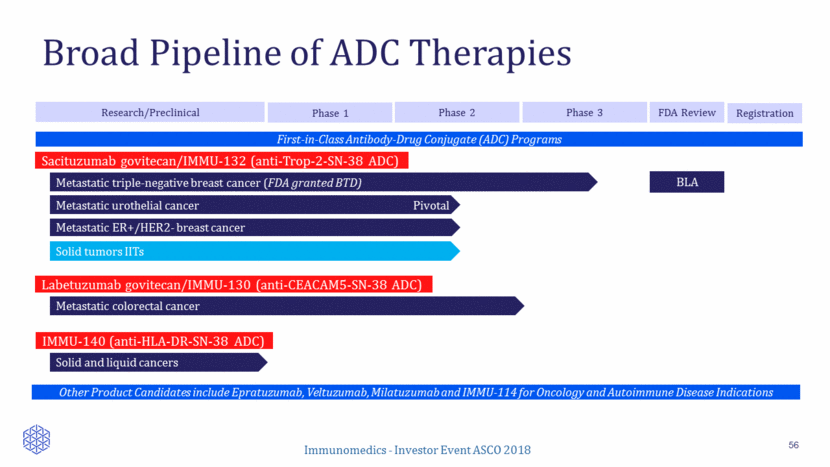
Sacituzumab govitecan/IMMU-132 (anti-Trop-2-SN-38 ADC) Metastatic triple-negative breast cancer (FDA granted BTD) IMMU-140 (anti-HLA-DR-SN-38 ADC) Labetuzumab govitecan/IMMU-130 (anti-CEACAM5-SN-38 ADC) Metastatic urothelial cancer Pivotal Metastatic colorectal cancer Solid and liquid cancers First-in-Class Antibody-Drug Conjugate (ADC) Programs Other Product Candidates include Epratuzumab, Veltuzumab, Milatuzumab and IMMU-114 for Oncology and Autoimmune Disease Indications Research/Preclinical Phase 1 Phase 2 Phase 3 Solid tumors IITs FDA Review Metastatic ER+/HER2- breast cancer Broad Pipeline of ADC Therapies 56 Registration Immunomedics - Investor Event ASCO 2018 BLA
Concluding Remarks Michael Pehl President and Chief Executive Officer
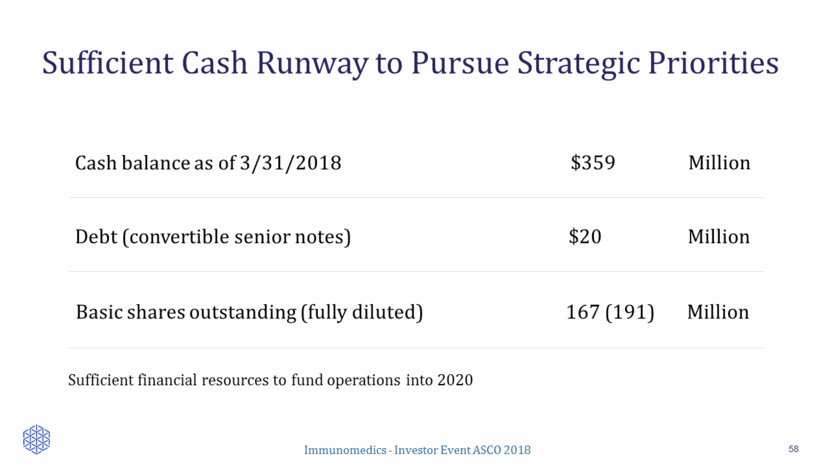
Sufficient Cash Runway to Pursue Strategic Priorities 58 Debt (convertible senior notes) $20 Million Basic shares outstanding (fully diluted) 167 (191) Million Cash balance as of 3/31/2018 $359 Million Sufficient financial resources to fund operations into 2020
Q&A Session
