Attached files
| file | filename |
|---|---|
| EX-99.1 - EX-99.1 - CITIZENS FINANCIAL GROUP INC/RI | d598193dex991.htm |
| 8-K - FORM 8-K - CITIZENS FINANCIAL GROUP INC/RI | d598193d8k.htm |
Franklin American Mortgage Company Acquisition Accelerates mortgage banking platform with enhanced scale and efficiency May 31, 2018 Exhibit 99.2
Forward-looking statements and use of key performance metrics This document contains forward-looking statements within the Private Securities Litigation Reform Act of 1995. Statements regarding potential future share repurchases and future dividends are forward-looking statements. Also, any statement that does not describe historical or current facts is a forward-looking statement. These statements often include the words “believes,” “expects,” “anticipates,” “estimates,” “intends,” “plans,” “goals,” “targets,” “initiatives,” “potentially,” “probably,” “projects,” “outlook” or similar expressions or future conditional verbs such as “may,” “will,” “should,” “would,” and “could.” Forward-looking statements are based upon the current beliefs and expectations of management, and on information currently available to management. Our statements speak as of the date hereof, and we do not assume any obligation to update these statements or to update the reasons why actual results could differ from those contained in such statements in light of new information or future events. We caution you, therefore, against relying on any of these forward-looking statements. They are neither statements of historical fact nor guarantees or assurances of future performance. While there is no assurance that any list of risks and uncertainties or risk factors is complete, important factors that could cause actual results to differ materially from those in the forward-looking statements include the following, without limitation: Negative economic and political conditions that adversely affect the general economy, housing prices, the job market, consumer confidence and spending habits which may affect, among other things, the level of nonperforming assets, charge-offs and provision expense; The rate of growth in the economy and employment levels, as well as general business and economic conditions, and changes in the competitive environment; Our ability to implement our business strategy, including the cost savings and efficiency components, and achieve our financial performance goals; Our ability to meet heightened supervisory requirements and expectations; Liabilities and business restrictions resulting from litigation and regulatory investigations; Our capital and liquidity requirements (including under regulatory capital standards, such as the U.S. Basel III capital rules) and our ability to generate capital internally or raise capital on favorable terms; The effect of changes in interest rates on our net interest income, net interest margin and our mortgage originations, mortgage servicing rights and mortgages held for sale; Changes in interest rates and market liquidity, as well as the magnitude of such changes, which may reduce interest margins, impact funding sources and affect the ability to originate and distribute financial products in the primary and secondary markets; The effect of changes in the level of checking or savings account deposits on our funding costs and net interest margin; Financial services reform and other current, pending or future legislation or regulation that could have a negative effect on our revenue and businesses, including the Dodd-Frank Act and other legislation and regulation relating to bank products and services; A failure in or breach of our operational or security systems or infrastructure, or those of our third party vendors or other service providers, including as a result of cyber-attacks; and Management’s ability to identify and manage these and other risks. In addition to the above factors, we also caution that the amount and timing of any future common stock dividends or share repurchases will depend on our financial condition, earnings, cash needs, regulatory constraints, capital requirements (including requirements of our subsidiaries), and any other factors that our Board of Directors deems relevant in making such a determination. Therefore, there can be no assurance that we will repurchase shares or pay any dividends to holders of our common stock, or as to the amount of any such repurchases or dividends. More information about factors that could cause actual results to differ materially from those described in the forward-looking statements can be found under “Risk Factors” in our Annual Report on Form 10-K for the year ended December 31, 2017, filed with the United States Securities and Exchange Commission on February 22, 2018. Key Performance Metrics: Our management team uses key performance metrics (KPMs) to gauge our performance and progress over time in achieving our strategic and operational goals and also in comparing our performance against our peers. We have established the following financial targets, in addition to others, as KPMs, which are utilized by our management in measuring our progress against financial goals and as a tool in helping assess performance for compensation purposes. These KPMs can largely be found in our periodic reports which are filed with the Securities and Exchange Commission, and are supplemented from time to time with additional information in connection with our quarterly earnings releases. Our key performance metrics include: Return on average tangible common equity (ROTCE); Return on average total tangible assets (ROTA); Efficiency ratio; Operating leverage; and Common equity tier 1 capital ratio.
Accelerates strategic fee income initiative in Home Mortgage(1) Highly-regarded, independent mortgage company Accelerates momentum in important fee income and customer-acquisition business Significantly advances mortgage strategy in servicing and originations Delivers considerable scale in servicing; #11 bank-owned servicer Substantially enhances conforming and purchase origination capabilities Provides immediate channel diversification by adding well-established correspondent and wholesale channels Advances customer-acquisition opportunities beyond the traditional Citizens’ footprint Adds ~200,000 servicing households providing the opportunity to offer additional products and services through use of existing data and analytics capabilities Creates top-15 bank-owned mortgage servicer and originator Strategically compelling Financially attractive(1) Low-risk transaction $511 million all cash transaction reflects ~1.1x tangible book purchase price, and an earnback of less than 3 years(1) Modestly accretive to 2H2018 and ~3% accretive to 2020 earnings per share Lifts fee income ratio by ~200 basis points on a combined basis Improves returns with mid-teens ROIC, an IRR of 20%+ and ROTCE accretion of ~45 bps in 2020 Relatively modest day-1 CET1 reduction of ~18 bps 2020 expense synergies of ~$50 million, largely tied to funding, operational and servicing-related costs Revenue synergies provide potential upside as not included in deal economics Strong cultural fit with alignment in mission and vision Integration straightforward with planning process well underway Low overlap with existing CFG mortgage business model Limited technology integration required Fully outsourced servicing platform Manageable size Annualized servicing portfolio data and origination volumes as of and for the three month period ended March 31, 2018. Combined data as of March 31, 2018. ROTCE, efficiency ratio and EPS accretion data are presented before the impact of an estimated $30-45 million in after-tax integration costs, to be incurred over approximately an 18-month timeframe and reflect Bloomberg consensus estimates for CFG as of May 25, 2018, and management estimates for Franklin American Mortgage. Returns, efficiency, accretion and earnback data reflect impact of an additional ~$70 million tax gross-up payment to the seller given the more favorable asset structure. However, this payment is not included in the TBV multiple given offsetting tax-related benefits and in order to be comparable with other stock transactions. Earnback calculated using the crossover method. Estimated CET1 reduction impact includes estimated day-1 integration costs compared with CFG’s 2Q18 outlook of ~11.2% and reflects 100% RWA treatment for Franklin American Mortgage's mortgage servicing rights as of April 30, 2018. Total combined mortgage servicing portfolio includes loans held on Citizen’s balance sheet. Net book value of assets to be acquired and liabilities as of April 30, 2018. Net book value of assets and liabilities as of the closing date will differ. Expect goodwill and intangibles of ~$95 million at closing. Mortgage rankings as of 4Q17, Inside Mortgage Finance Publications, Inc.
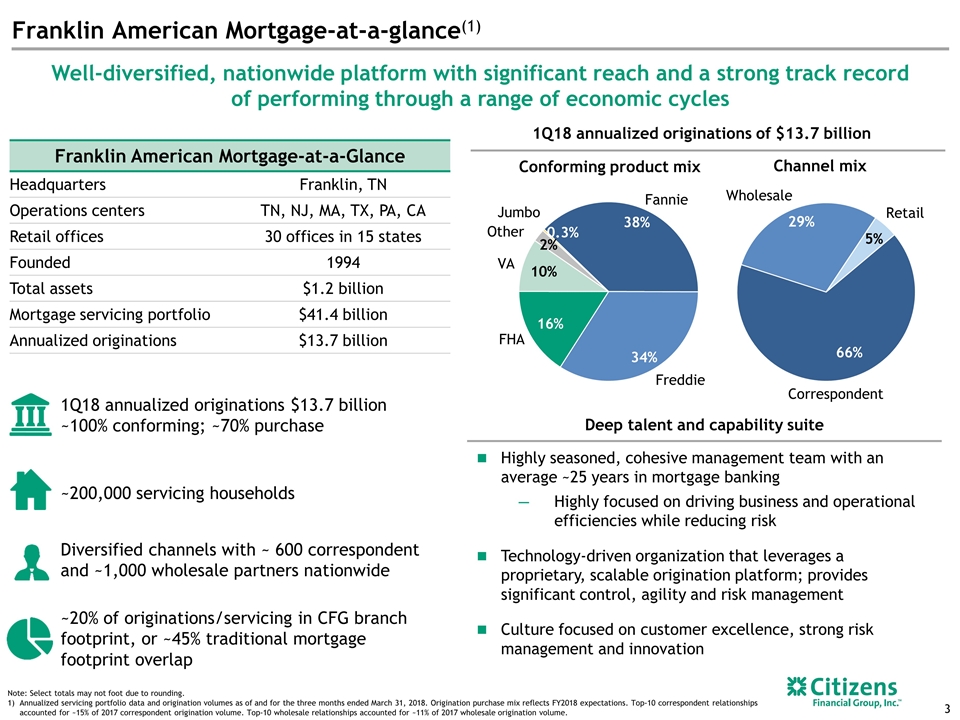
Franklin American Mortgage-at-a-glance(1) Well-diversified, nationwide platform with significant reach and a strong track record of performing through a range of economic cycles Note: Select totals may not foot due to rounding. Annualized servicing portfolio data and origination volumes as of and for the three months ended March 31, 2018. Origination purchase mix reflects FY2018 expectations. Top-10 correspondent relationships accounted for ~15% of 2017 correspondent origination volume. Top-10 wholesale relationships accounted for ~11% of 2017 wholesale origination volume. Franklin American Mortgage-at-a-Glance Headquarters Franklin, TN Operations centers TN, NJ, MA, TX, PA, CA Retail offices 30 offices in 15 states Founded 1994 Total assets $1.2 billion Mortgage servicing portfolio $41.4 billion Annualized originations $13.7 billion Deep talent and capability suite Highly seasoned, cohesive management team with an average ~25 years in mortgage banking Highly focused on driving business and operational efficiencies while reducing risk Technology-driven organization that leverages a proprietary, scalable origination platform; provides significant control, agility and risk management Culture focused on customer excellence, strong risk management and innovation ~200,000 servicing households ~20% of originations/servicing in CFG branch footprint, or ~45% traditional mortgage footprint overlap Diversified channels with ~ 600 correspondent and ~1,000 wholesale partners nationwide 1Q18 annualized originations $13.7 billion ~100% conforming; ~70% purchase Channel mix Conforming product mix Fannie Freddie FHA VA Other Jumbo Correspondent Wholesale Retail 1Q18 annualized originations of $13.7 billion
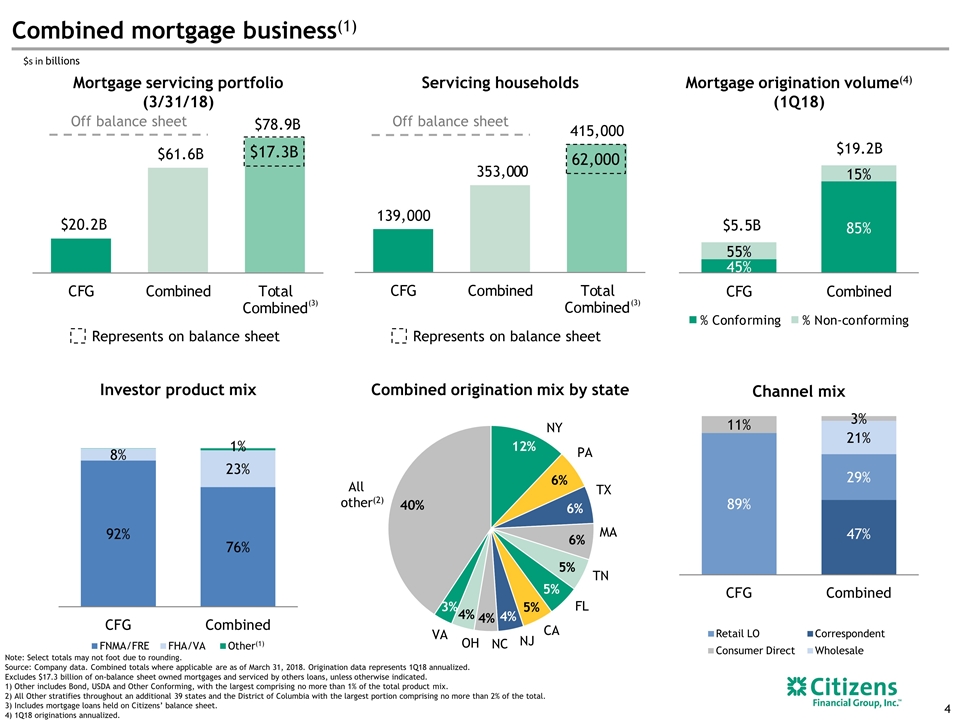
Mortgage servicing portfolio (3/31/18) Mortgage origination volume(4) (1Q18) Combined origination mix by state Investor product mix Channel mix Note: Select totals may not foot due to rounding. Source: Company data. Combined totals where applicable are as of March 31, 2018. Origination data represents 1Q18 annualized. Excludes $17.3 billion of on-balance sheet owned mortgages and serviced by others loans, unless otherwise indicated. 1) Other includes Bond, USDA and Other Conforming, with the largest comprising no more than 1% of the total product mix. 2) All Other stratifies throughout an additional 39 states and the District of Columbia with the largest portion comprising no more than 2% of the total. 3) Includes mortgage loans held on Citizens’ balance sheet. 4) 1Q18 originations annualized. $s in billions Correspondent Retail LO Wholesale Consumer Direct FNMA/FRE FHA/VA Other(1) Combined mortgage business(1) NY PA TX MA TN FL CA NJ NC OH VA All other(2) Servicing households Off balance sheet Off balance sheet (3) (3) $17.3B Represents on balance sheet Represents on balance sheet 62,000
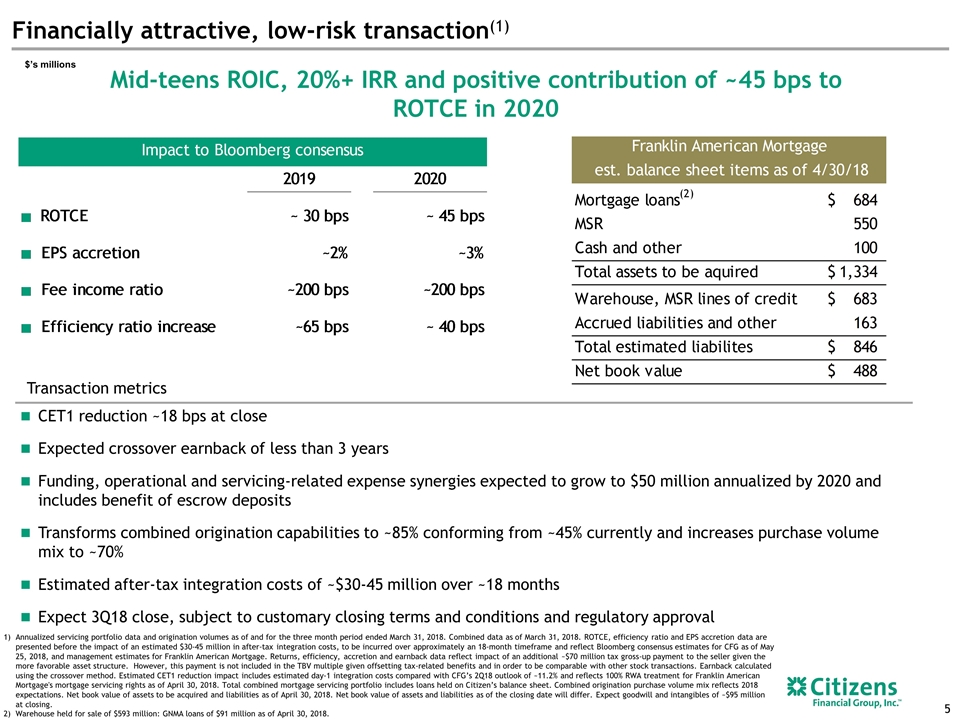
Mid-teens ROIC, 20%+ IRR and positive contribution of ~45 bps to ROTCE in 2020 CET1 reduction ~18 bps at close Expected crossover earnback of less than 3 years Funding, operational and servicing-related expense synergies expected to grow to $50 million annualized by 2020 and includes benefit of escrow deposits Transforms combined origination capabilities to ~85% conforming from ~45% currently and increases purchase volume mix to ~70% Estimated after-tax integration costs of ~$30-45 million over ~18 months Expect 3Q18 close, subject to customary closing terms and conditions and regulatory approval Financially attractive, low-risk transaction(1) Transaction metrics Annualized servicing portfolio data and origination volumes as of and for the three month period ended March 31, 2018. Combined data as of March 31, 2018. ROTCE, efficiency ratio and EPS accretion data are presented before the impact of an estimated $30-45 million in after-tax integration costs, to be incurred over approximately an 18-month timeframe and reflect Bloomberg consensus estimates for CFG as of May 25, 2018, and management estimates for Franklin American Mortgage. Returns, efficiency, accretion and earnback data reflect impact of an additional ~$70 million tax gross-up payment to the seller given the more favorable asset structure. However, this payment is not included in the TBV multiple given offsetting tax-related benefits and in order to be comparable with other stock transactions. Earnback calculated using the crossover method. Estimated CET1 reduction impact includes estimated day-1 integration costs compared with CFG’s 2Q18 outlook of ~11.2% and reflects 100% RWA treatment for Franklin American Mortgage's mortgage servicing rights as of April 30, 2018. Total combined mortgage servicing portfolio includes loans held on Citizen’s balance sheet. Combined origination purchase volume mix reflects 2018 expectations. Net book value of assets to be acquired and liabilities as of April 30, 2018. Net book value of assets and liabilities as of the closing date will differ. Expect goodwill and intangibles of ~$95 million at closing. Warehouse held for sale of $593 million: GNMA loans of $91 million as of April 30, 2018. $’s millions
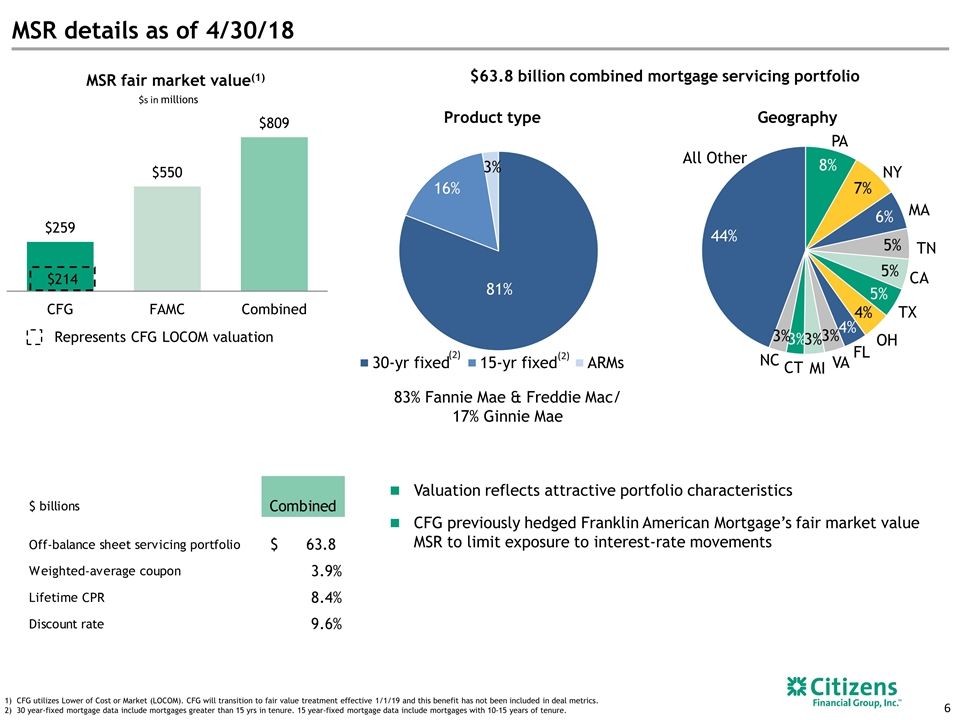
MSR details as of 4/30/18 CFG utilizes Lower of Cost or Market (LOCOM). CFG will transition to fair value treatment effective 1/1/19 and this benefit has not been included in deal metrics. 30 year-fixed mortgage data include mortgages greater than 15 yrs in tenure. 15 year-fixed mortgage data include mortgages with 10-15 years of tenure. $63.8 billion combined mortgage servicing portfolio MSR fair market value(1) Valuation reflects attractive portfolio characteristics CFG previously hedged Franklin American Mortgage’s fair market value MSR to limit exposure to interest-rate movements $214 Represents CFG LOCOM valuation Product type $s in millions PA NY MA TN CA TX OH FL VA MI CT NC All Other (2) (2) 83% Fannie Mae & Freddie Mac/ 17% Ginnie Mae Geography
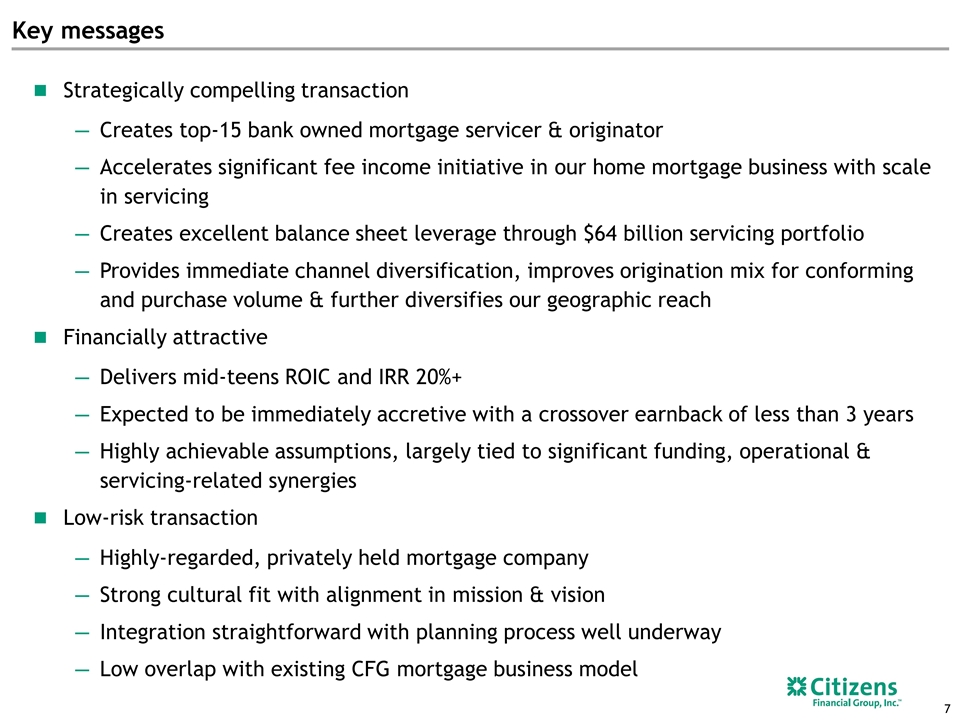
Key messages Strategically compelling transaction Creates top-15 bank owned mortgage servicer & originator Accelerates significant fee income initiative in our home mortgage business with scale in servicing Creates excellent balance sheet leverage through $64 billion servicing portfolio Provides immediate channel diversification, improves origination mix for conforming and purchase volume & further diversifies our geographic reach Financially attractive Delivers mid-teens ROIC and IRR 20%+ Expected to be immediately accretive with a crossover earnback of less than 3 years Highly achievable assumptions, largely tied to significant funding, operational & servicing-related synergies Low-risk transaction Highly-regarded, privately held mortgage company Strong cultural fit with alignment in mission & vision Integration straightforward with planning process well underway Low overlap with existing CFG mortgage business model
