Attached files
| file | filename |
|---|---|
| 8-K - FORM 8-K - Blue Capital Reinsurance Holdings Ltd. | d597027d8k.htm |
Blue Capital Reinsurance Holdings Ltd. (BCRH) Investor Update 1Q18 Exhibit 99.1
Safe Harbor Statement Some of the statements in this presentation may include, and Blue Capital Reinsurance Holdings Ltd. (the “Company” or “BCRH”) and the Company’s manager, Blue Capital Management Ltd. (“Blue Capital”), may make related oral forward-looking statements which reflect our current views with respect to future events and financial performance. Such statements may include forward-looking statements both with respect to us in general and the insurance and reinsurance sectors specifically, both as to underwriting and investment matters. Statements that include the words "should," “would,” "expect," "estimates", "intend," "plan," "believe," "project," “target,” "anticipate," "seek," "will," “deliver,” and similar statements of a future or forward-looking nature identify forward-looking statements in this presentation for purposes of the U.S. federal securities laws or otherwise. We intend these forward-looking statements to be covered by the safe harbor provisions for forward-looking statements in the Private Securities Litigation Reform Act of 1995. All forward-looking statements address matters that involve risks and uncertainties. Accordingly, there are or may be important factors that could cause actual results to differ materially from those indicated in the forward-looking statements. These factors include, but are not limited to, the effects of competitors’ pricing policies, greater frequency or severity of claims and loss activity, changes in market conditions, decreased demand for property and casualty reinsurance, changes in the availability, cost or quality of reinsurance or retrocessional coverage, our inability to renew business previously underwritten or acquired, uncertainties in our reserving process, changes to our tax status, reduced acceptance of our existing or new products and services, a loss of business from and credit risk related to our broker counterparties, assessments for high risk or otherwise uninsured individuals, possible terrorism or the outbreak of war, a loss of key personnel, political conditions, changes in insurance regulation, operational risk, including the risk of fraud and errors and omissions, as well as technology breaches or failure, changes in accounting policies, our investment performance, the valuation of our invested assets, a breach of our investment guidelines, a breach in our underwriting guidelines, potential treatment of us as an investment company or a passive foreign investment company for purposes of U.S. securities laws or U.S. federal taxation, respectively, our dependence as a holding company upon dividends or distributions from our operating subsidiaries, the unavailability of capital in the future, developments in the world’s financial and capital markets and our access to such markets, government intervention in the insurance and reinsurance industry, illiquidity in the credit markets, changes in general economic conditions and other factors described in our Annual Report on Form 10-K for the year ended December 31, 2017. The foregoing review of important factors should not be construed as exhaustive and should be read in conjunction with the other cautionary statements that are included herein and elsewhere, including the risk factors included in the Company’s most recent Annual Report on Form 10-K and other documents on file with the Securities and Exchange Commission. Any forward-looking statements made in this presentation are qualified by these cautionary statements, and there can be no assurance that the actual results or developments anticipated by the Company will be realized or, even if substantially realized, that they will have the expected consequences to, or effects on, the Company or its business or operations. Except as required by law, the Company undertakes no obligation to update publicly or revise any forward-looking statement, whether as a result of new information, future developments or otherwise. Regulation G Disclaimer In this presentation, management has included and discussed certain non-GAAP measures. Management believes that these non-GAAP measures, which may be defined differently by other companies, better explain the Company's results of operations in a manner that allows for a more complete understanding of the underlying trends in the Company's business. However, these measures should not be viewed as a substitute for those determined in accordance with GAAP.
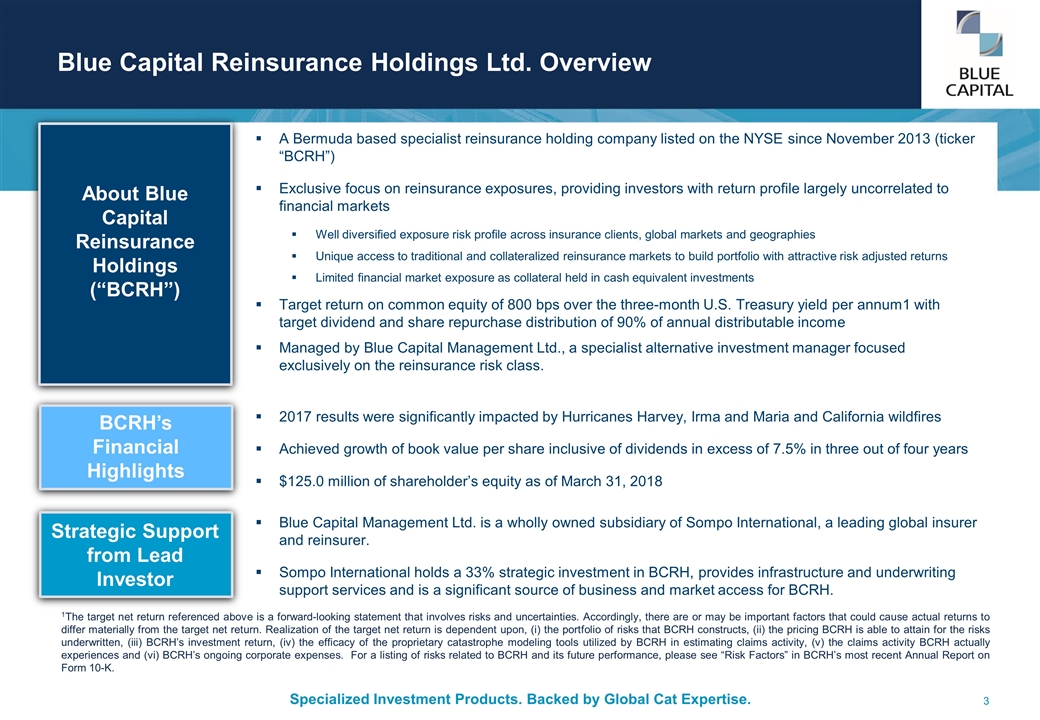
Blue Capital Reinsurance Holdings Ltd. Overview Blue Capital Management Ltd. is a wholly owned subsidiary of Sompo International, a leading global insurer and reinsurer. Sompo International holds a 33% strategic investment in BCRH, provides infrastructure and underwriting support services and is a significant source of business and market access for BCRH. 2017 results were significantly impacted by Hurricanes Harvey, Irma and Maria and California wildfires Achieved growth of book value per share inclusive of dividends in excess of 7.5% in three out of four years $125.0 million of shareholder’s equity as of March 31, 2018 A Bermuda based specialist reinsurance holding company listed on the NYSE since November 2013 (ticker “BCRH”) Exclusive focus on reinsurance exposures, providing investors with return profile largely uncorrelated to financial markets Well diversified exposure risk profile across insurance clients, global markets and geographies Unique access to traditional and collateralized reinsurance markets to build portfolio with attractive risk adjusted returns Limited financial market exposure as collateral held in cash equivalent investments Target return on common equity of 800 bps over the three-month U.S. Treasury yield per annum1 with target dividend and share repurchase distribution of 90% of annual distributable income Managed by Blue Capital Management Ltd., a specialist alternative investment manager focused exclusively on the reinsurance risk class. About Blue Capital Reinsurance Holdings (“BCRH”) BCRH’s Financial Highlights Strategic Support from Lead Investor 1The target net return referenced above is a forward-looking statement that involves risks and uncertainties. Accordingly, there are or may be important factors that could cause actual returns to differ materially from the target net return. Realization of the target net return is dependent upon, (i) the portfolio of risks that BCRH constructs, (ii) the pricing BCRH is able to attain for the risks underwritten, (iii) BCRH’s investment return, (iv) the efficacy of the proprietary catastrophe modeling tools utilized by BCRH in estimating claims activity, (v) the claims activity BCRH actually experiences and (vi) BCRH’s ongoing corporate expenses. For a listing of risks related to BCRH and its future performance, please see “Risk Factors” in BCRH’s most recent Annual Report on Form 10-K.
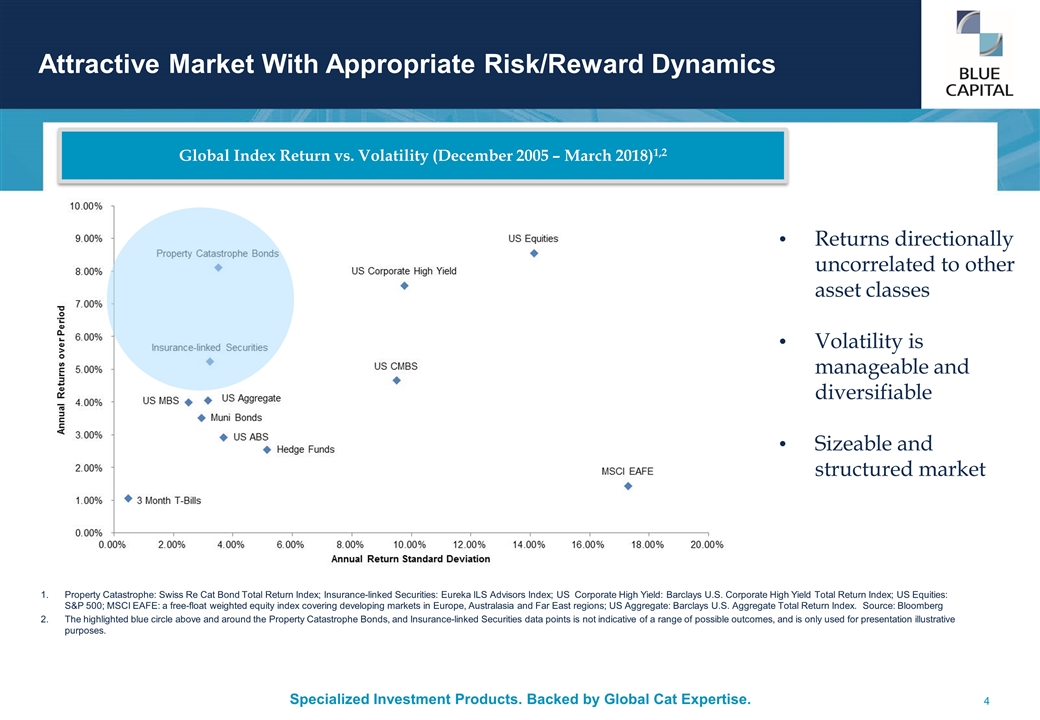
Attractive Market With Appropriate Risk/Reward Dynamics Global Index Return vs. Volatility (December 2005 – March 2018)1,2 Property Catastrophe: Swiss Re Cat Bond Total Return Index; Insurance-linked Securities: Eureka ILS Advisors Index; US Corporate High Yield: Barclays U.S. Corporate High Yield Total Return Index; US Equities: S&P 500; MSCI EAFE: a free-float weighted equity index covering developing markets in Europe, Australasia and Far East regions; US Aggregate: Barclays U.S. Aggregate Total Return Index. Source: Bloomberg The highlighted blue circle above and around the Property Catastrophe Bonds, and Insurance-linked Securities data points is not indicative of a range of possible outcomes, and is only used for presentation illustrative purposes. Returns directionally uncorrelated to other asset classes Volatility is manageable and diversifiable Sizeable and structured market
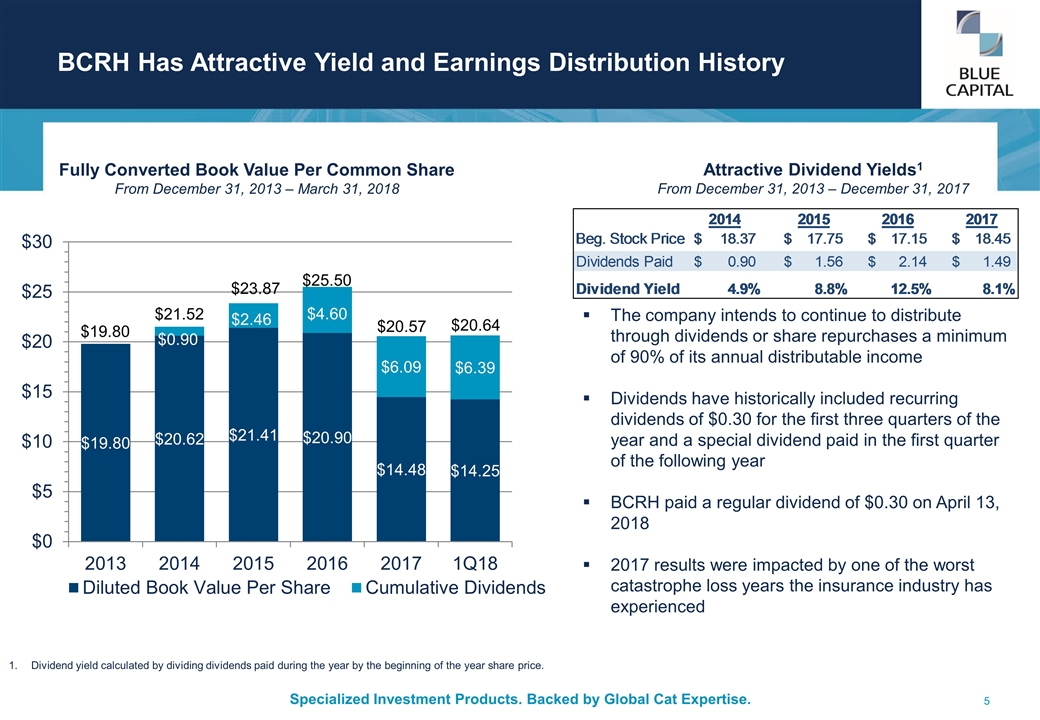
BCRH Has Attractive Yield and Earnings Distribution History Fully Converted Book Value Per Common Share From December 31, 2013 – March 31, 2018 Dividend yield calculated by dividing dividends paid during the year by the beginning of the year share price. The company intends to continue to distribute through dividends or share repurchases a minimum of 90% of its annual distributable income Dividends have historically included recurring dividends of $0.30 for the first three quarters of the year and a special dividend paid in the first quarter of the following year BCRH paid a regular dividend of $0.30 on April 13, 2018 2017 results were impacted by one of the worst catastrophe loss years the insurance industry has experienced Attractive Dividend Yields1 From December 31, 2013 – December 31, 2017
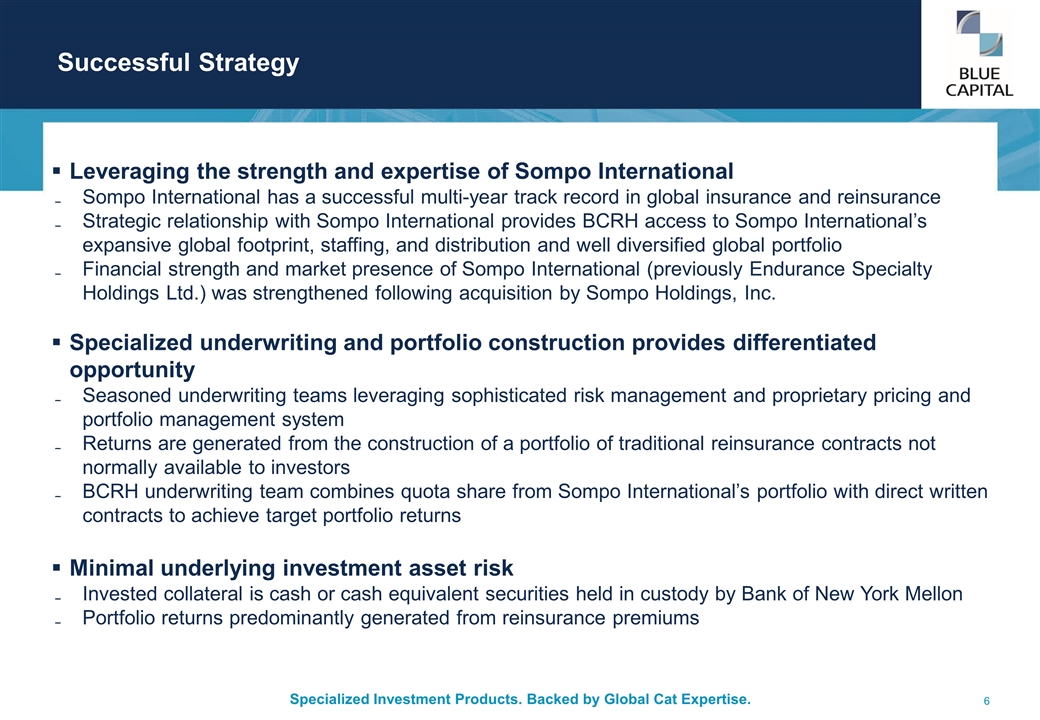
Successful Strategy Leveraging the strength and expertise of Sompo International Sompo International has a successful multi-year track record in global insurance and reinsurance Strategic relationship with Sompo International provides BCRH access to Sompo International’s expansive global footprint, staffing, and distribution and well diversified global portfolio Financial strength and market presence of Sompo International (previously Endurance Specialty Holdings Ltd.) was strengthened following acquisition by Sompo Holdings, Inc. Specialized underwriting and portfolio construction provides differentiated opportunity Seasoned underwriting teams leveraging sophisticated risk management and proprietary pricing and portfolio management system Returns are generated from the construction of a portfolio of traditional reinsurance contracts not normally available to investors BCRH underwriting team combines quota share from Sompo International’s portfolio with direct written contracts to achieve target portfolio returns Minimal underlying investment asset risk Invested collateral is cash or cash equivalent securities held in custody by Bank of New York Mellon Portfolio returns predominantly generated from reinsurance premiums
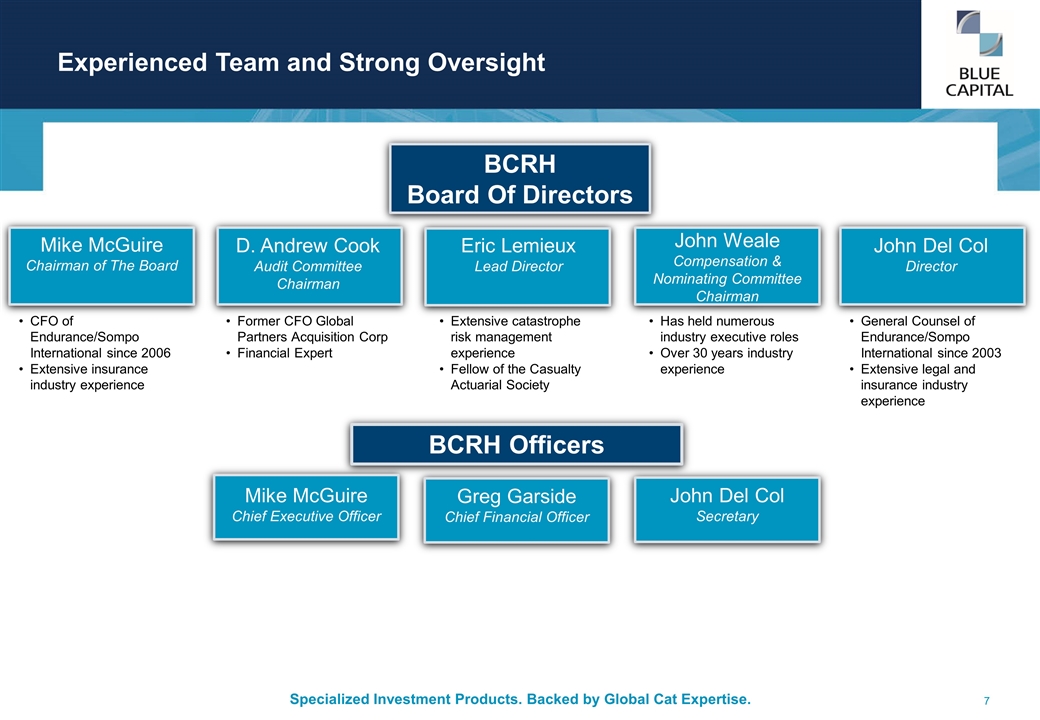
Mike McGuire Chairman of The Board D. Andrew Cook Audit Committee Chairman Experienced Team and Strong Oversight BCRH Board Of Directors John Del Col Director John Weale Compensation & Nominating Committee Chairman Eric Lemieux Lead Director CFO of Endurance/Sompo International since 2006 Extensive insurance industry experience Former CFO Global Partners Acquisition Corp Financial Expert General Counsel of Endurance/Sompo International since 2003 Extensive legal and insurance industry experience Has held numerous industry executive roles Over 30 years industry experience Extensive catastrophe risk management experience Fellow of the Casualty Actuarial Society BCRH Officers Mike McGuire Chief Executive Officer Greg Garside Chief Financial Officer John Del Col Secretary
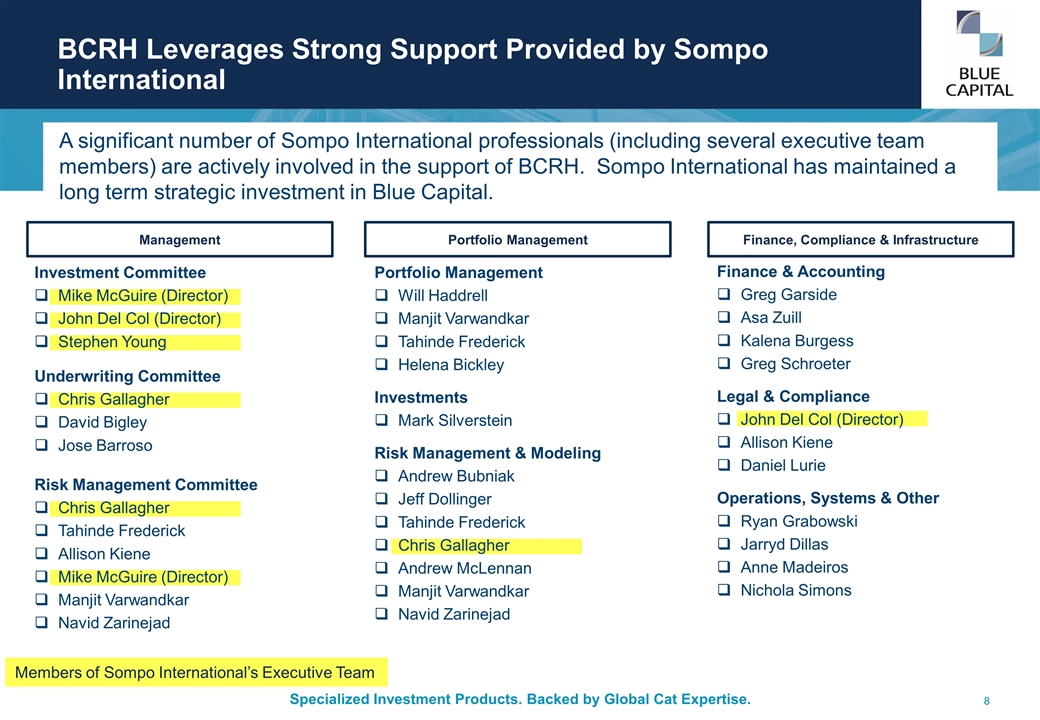
BCRH Leverages Strong Support Provided by Sompo International A significant number of Sompo International professionals (including several executive team members) are actively involved in the support of BCRH. Sompo International has maintained a long term strategic investment in Blue Capital. Management Portfolio Management Finance, Compliance & Infrastructure Members of Sompo International’s Executive Team Investment Committee Mike McGuire (Director) John Del Col (Director) Stephen Young Underwriting Committee Chris Gallagher David Bigley Jose Barroso Risk Management Committee Chris Gallagher Tahinde Frederick Allison Kiene Mike McGuire (Director) Manjit Varwandkar Navid Zarinejad Portfolio Management Will Haddrell Manjit Varwandkar Tahinde Frederick Helena Bickley Investments Mark Silverstein Risk Management & Modeling Andrew Bubniak Jeff Dollinger Tahinde Frederick Chris Gallagher Andrew McLennan Manjit Varwandkar Navid Zarinejad Finance & Accounting Greg Garside Asa Zuill Kalena Burgess Greg Schroeter Legal & Compliance John Del Col (Director) Allison Kiene Daniel Lurie Operations, Systems & Other Ryan Grabowski Jarryd Dillas Anne Madeiros Nichola Simons
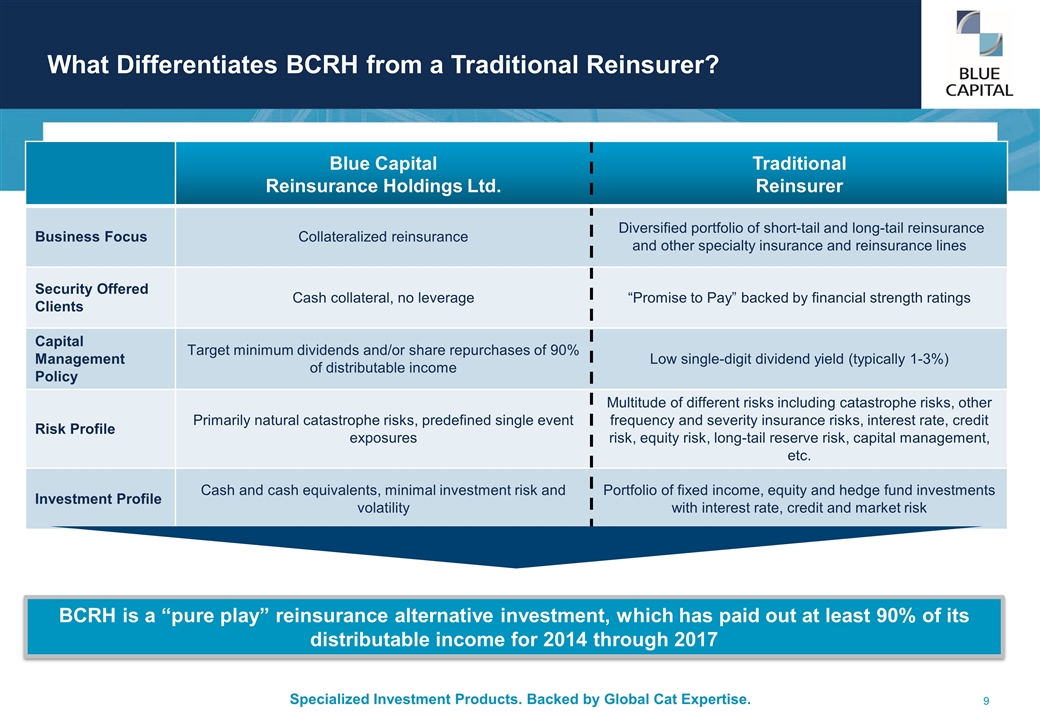
What Differentiates BCRH from a Traditional Reinsurer? Blue Capital Reinsurance Holdings Ltd. Traditional Reinsurer Business Focus Collateralized reinsurance Diversified portfolio of short-tail and long-tail reinsurance and other specialty insurance and reinsurance lines Security Offered Clients Cash collateral, no leverage “Promise to Pay” backed by financial strength ratings Capital Management Policy Target minimum dividends and/or share repurchases of 90% of distributable income Low single-digit dividend yield (typically 1-3%) Risk Profile Primarily natural catastrophe risks, predefined single event exposures Multitude of different risks including catastrophe risks, other frequency and severity insurance risks, interest rate, credit risk, equity risk, long-tail reserve risk, capital management, etc. Investment Profile Cash and cash equivalents, minimal investment risk and volatility Portfolio of fixed income, equity and hedge fund investments with interest rate, credit and market risk BCRH is a “pure play” reinsurance alternative investment, which has paid out at least 90% of its distributable income for 2014 through 2017
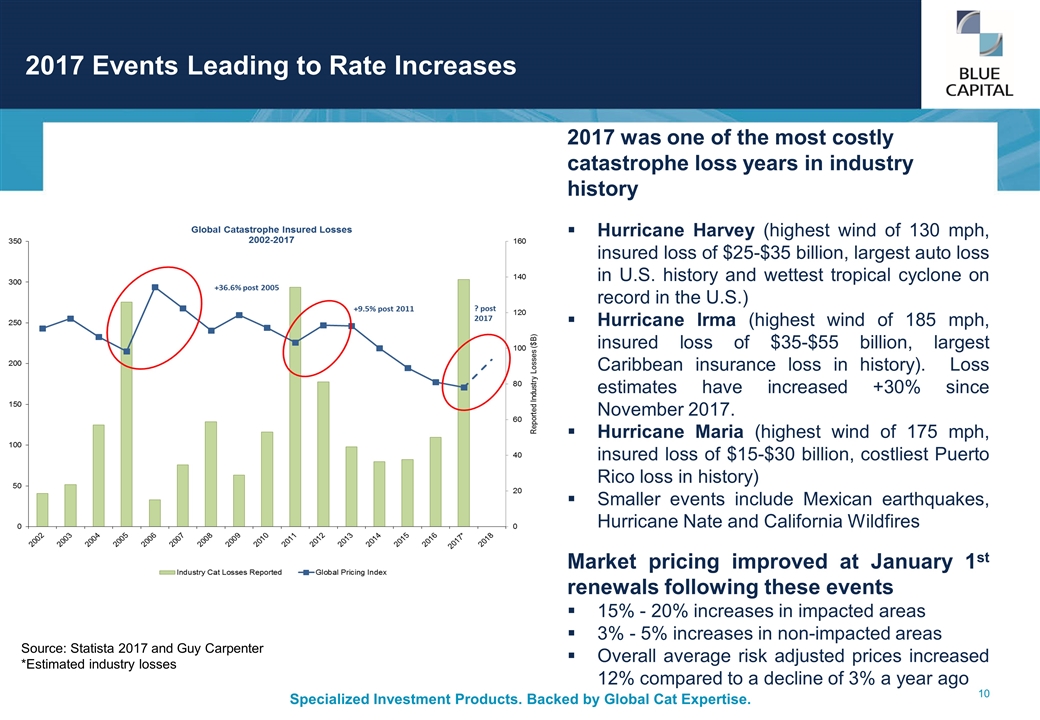
2017 Events Leading to Rate Increases Source: Statista 2017 and Guy Carpenter *Estimated industry losses 2017 was one of the most costly catastrophe loss years in industry history Hurricane Harvey (highest wind of 130 mph, insured loss of $25-$35 billion, largest auto loss in U.S. history and wettest tropical cyclone on record in the U.S.) Hurricane Irma (highest wind of 185 mph, insured loss of $35-$55 billion, largest Caribbean insurance loss in history). Loss estimates have increased +30% since November 2017. Hurricane Maria (highest wind of 175 mph, insured loss of $15-$30 billion, costliest Puerto Rico loss in history) Smaller events include Mexican earthquakes, Hurricane Nate and California Wildfires Market pricing improved at January 1st renewals following these events 15% - 20% increases in impacted areas 3% - 5% increases in non-impacted areas Overall average risk adjusted prices increased 12% compared to a decline of 3% a year ago
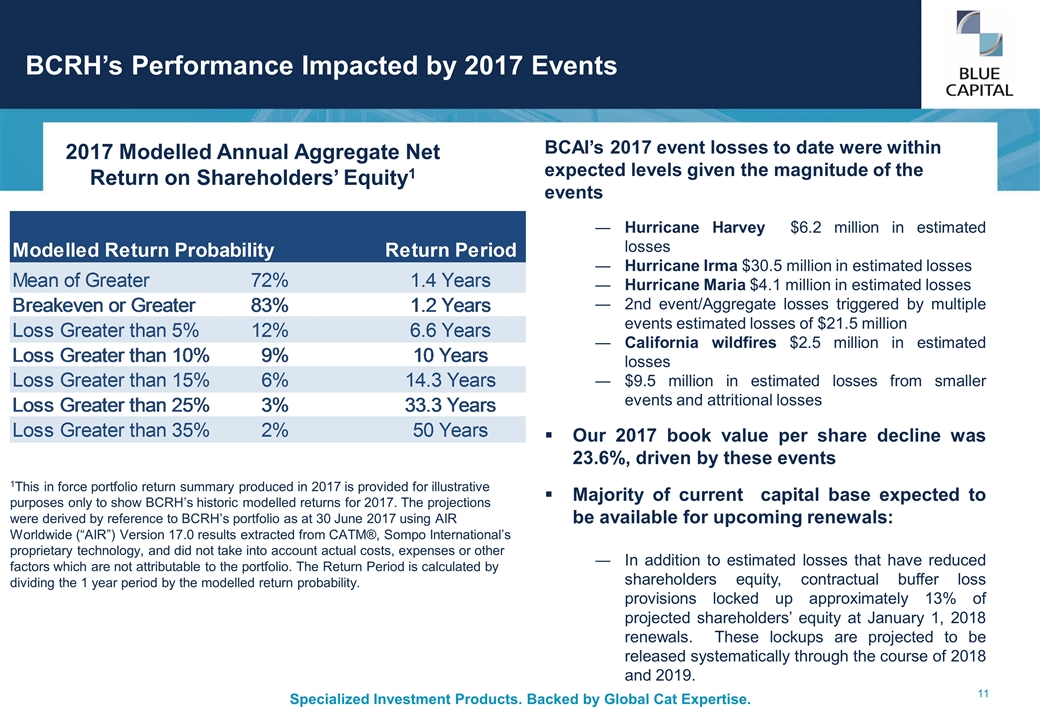
BCRH’s Performance Impacted by 2017 Events BCAI’s 2017 event losses to date were within expected levels given the magnitude of the events Hurricane Harvey $6.2 million in estimated losses Hurricane Irma $30.5 million in estimated losses Hurricane Maria $4.1 million in estimated losses 2nd event/Aggregate losses triggered by multiple events estimated losses of $21.5 million California wildfires $2.5 million in estimated losses $9.5 million in estimated losses from smaller events and attritional losses Our 2017 book value per share decline was 23.6%, driven by these events Majority of current capital base expected to be available for upcoming renewals: In addition to estimated losses that have reduced shareholders equity, contractual buffer loss provisions locked up approximately 13% of projected shareholders’ equity at January 1, 2018 renewals. These lockups are projected to be released systematically through the course of 2018 and 2019. 2017 Modelled Annual Aggregate Net Return on Shareholders’ Equity1 1This in force portfolio return summary produced in 2017 is provided for illustrative purposes only to show BCRH’s historic modelled returns for 2017. The projections were derived by reference to BCRH’s portfolio as at 30 June 2017 using AIR Worldwide (“AIR”) Version 17.0 results extracted from CATM®, Sompo International’s proprietary technology, and did not take into account actual costs, expenses or other factors which are not attributable to the portfolio. The Return Period is calculated by dividing the 1 year period by the modelled return probability.
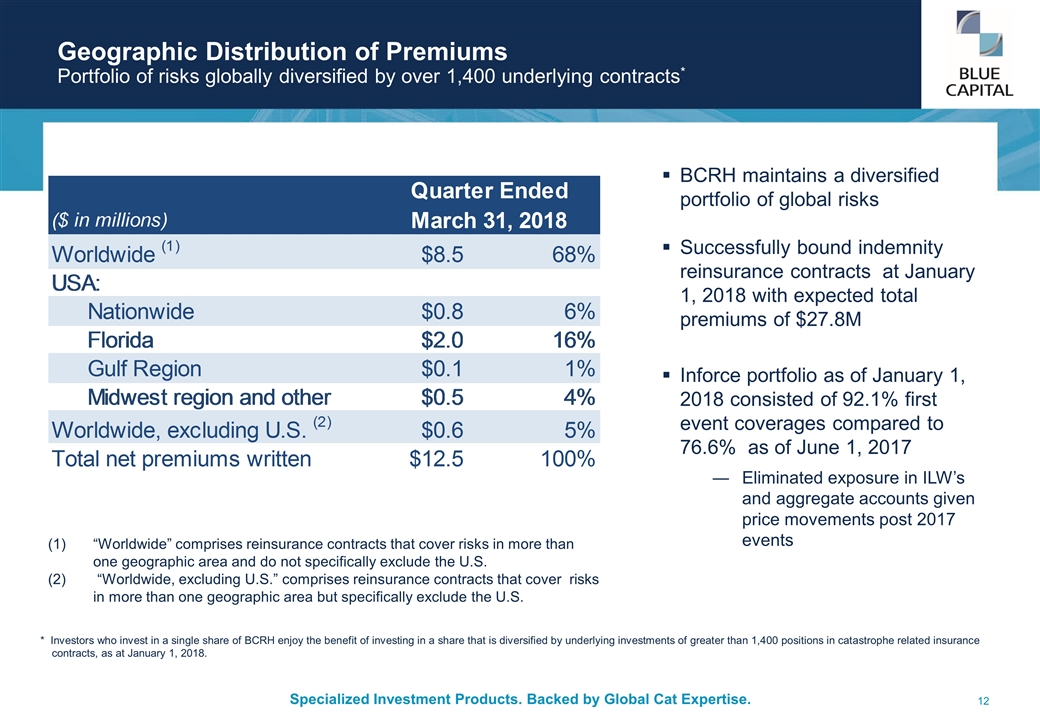
Geographic Distribution of Premiums Portfolio of risks globally diversified by over 1,400 underlying contracts* BCRH maintains a diversified portfolio of global risks Successfully bound indemnity reinsurance contracts at January 1, 2018 with expected total premiums of $27.8M Inforce portfolio as of January 1, 2018 consisted of 92.1% first event coverages compared to 76.6% as of June 1, 2017 Eliminated exposure in ILW’s and aggregate accounts given price movements post 2017 events * Investors who invest in a single share of BCRH enjoy the benefit of investing in a share that is diversified by underlying investments of greater than 1,400 positions in catastrophe related insurance contracts, as at January 1, 2018. “Worldwide” comprises reinsurance contracts that cover risks in more than one geographic area and do not specifically exclude the U.S. “Worldwide, excluding U.S.” comprises reinsurance contracts that cover risks in more than one geographic area but specifically exclude the U.S.
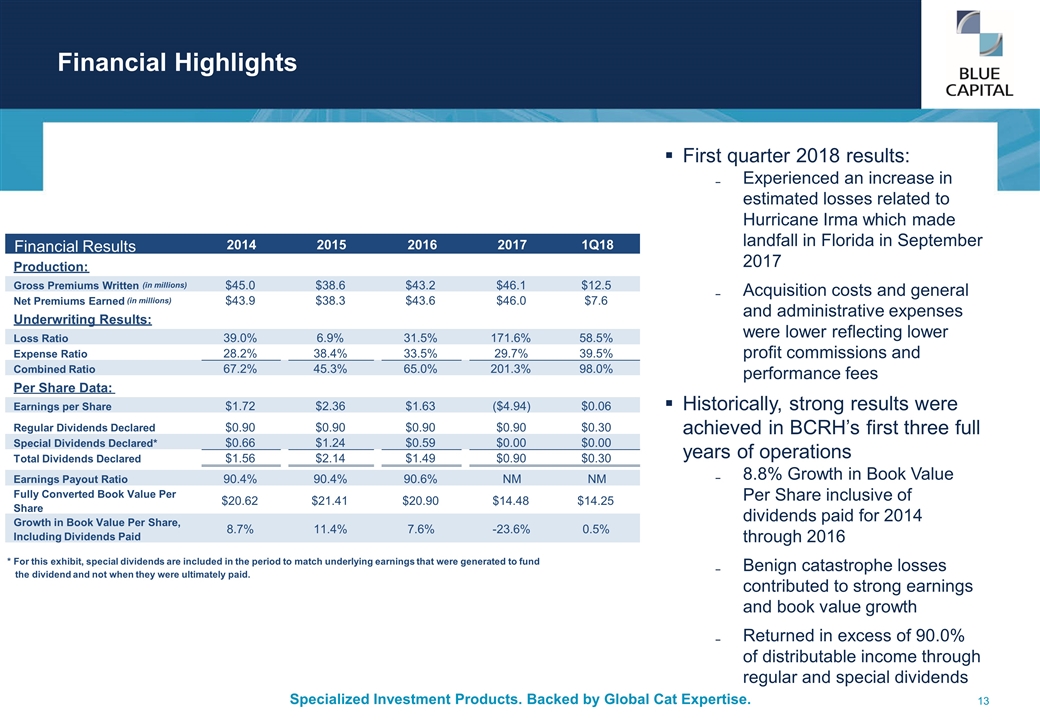
Financial Highlights First quarter 2018 results: Experienced an increase in estimated losses related to Hurricane Irma which made landfall in Florida in September 2017 Acquisition costs and general and administrative expenses were lower reflecting lower profit commissions and performance fees Historically, strong results were achieved in BCRH’s first three full years of operations 8.8% Growth in Book Value Per Share inclusive of dividends paid for 2014 through 2016 Benign catastrophe losses contributed to strong earnings and book value growth Returned in excess of 90.0% of distributable income through regular and special dividends Financial Results 2014 2015 2016 2017 1Q18 Production: Gross Premiums Written (in millions) $45.0 $38.6 $43.2 $46.1 $12.5 Net Premiums Earned (in millions) $43.9 $38.3 $43.6 $46.0 $7.6 Underwriting Results: Loss Ratio 39.0% 6.9% 31.5% 171.6% 58.5% Expense Ratio 28.2% 38.4% 33.5% 29.7% 39.5% Combined Ratio 67.2% 45.3% 65.0% 201.3% 98.0% Per Share Data: Earnings per Share $1.72 $2.36 $1.63 ($4.94) $0.06 Regular Dividends Declared $0.90 $0.90 $0.90 $0.90 $0.30 Special Dividends Declared* $0.66 $1.24 $0.59 $0.00 $0.00 Total Dividends Declared $1.56 $2.14 $1.49 $0.90 $0.30 Earnings Payout Ratio 90.4% 90.4% 90.6% NM NM Fully Converted Book Value Per Share $20.62 $21.41 $20.90 $14.48 $14.25 Growth in Book Value Per Share, Including Dividends Paid 8.7% 11.4% 7.6% -23.6% 0.5% * For this exhibit, special dividends are included in the period to match underlying earnings that were generated to fund the dividend and not when they were ultimately paid.
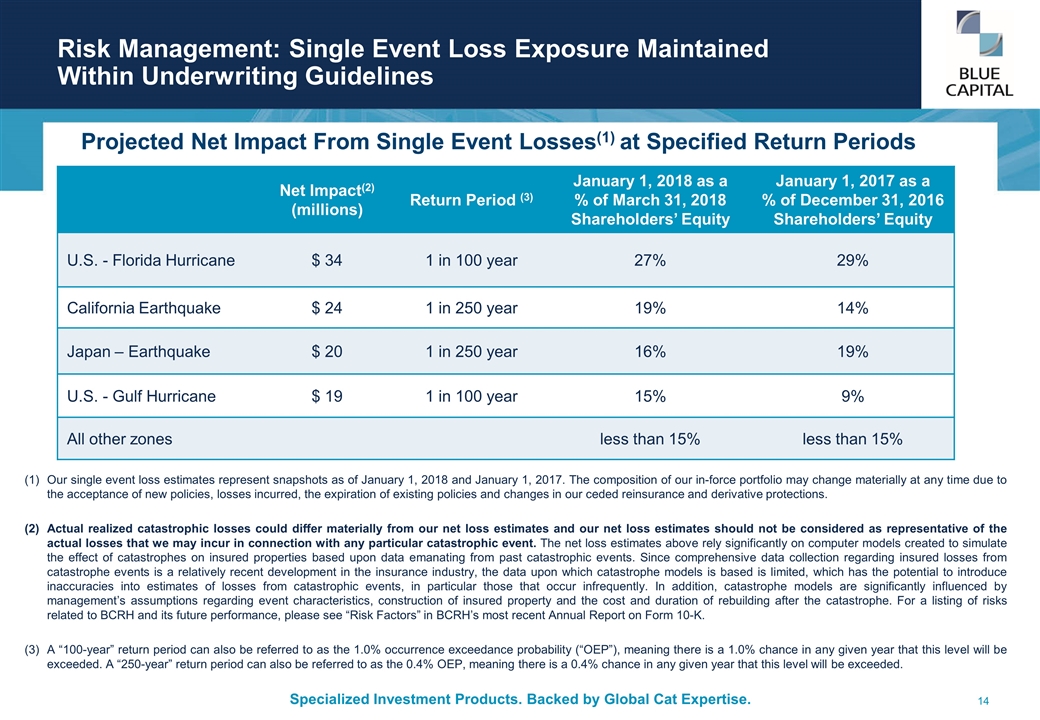
Risk Management: Single Event Loss Exposure Maintained Within Underwriting Guidelines Our single event loss estimates represent snapshots as of January 1, 2018 and January 1, 2017. The composition of our in-force portfolio may change materially at any time due to the acceptance of new policies, losses incurred, the expiration of existing policies and changes in our ceded reinsurance and derivative protections. Actual realized catastrophic losses could differ materially from our net loss estimates and our net loss estimates should not be considered as representative of the actual losses that we may incur in connection with any particular catastrophic event. The net loss estimates above rely significantly on computer models created to simulate the effect of catastrophes on insured properties based upon data emanating from past catastrophic events. Since comprehensive data collection regarding insured losses from catastrophe events is a relatively recent development in the insurance industry, the data upon which catastrophe models is based is limited, which has the potential to introduce inaccuracies into estimates of losses from catastrophic events, in particular those that occur infrequently. In addition, catastrophe models are significantly influenced by management’s assumptions regarding event characteristics, construction of insured property and the cost and duration of rebuilding after the catastrophe. For a listing of risks related to BCRH and its future performance, please see “Risk Factors” in BCRH’s most recent Annual Report on Form 10-K. A “100-year” return period can also be referred to as the 1.0% occurrence exceedance probability (“OEP”), meaning there is a 1.0% chance in any given year that this level will be exceeded. A “250-year” return period can also be referred to as the 0.4% OEP, meaning there is a 0.4% chance in any given year that this level will be exceeded. Projected Net Impact From Single Event Losses(1) at Specified Return Periods Net Impact(2) (millions) Return Period (3) January 1, 2018 as a % of March 31, 2018 Shareholders’ Equity January 1, 2017 as a % of December 31, 2016 Shareholders’ Equity U.S. - Florida Hurricane $ 34 1 in 100 year 27% 29% California Earthquake $ 24 1 in 250 year 19% 14% Japan – Earthquake $ 20 1 in 250 year 16% 19% U.S. - Gulf Hurricane $ 19 1 in 100 year 15% 9% All other zones less than 15% less than 15%
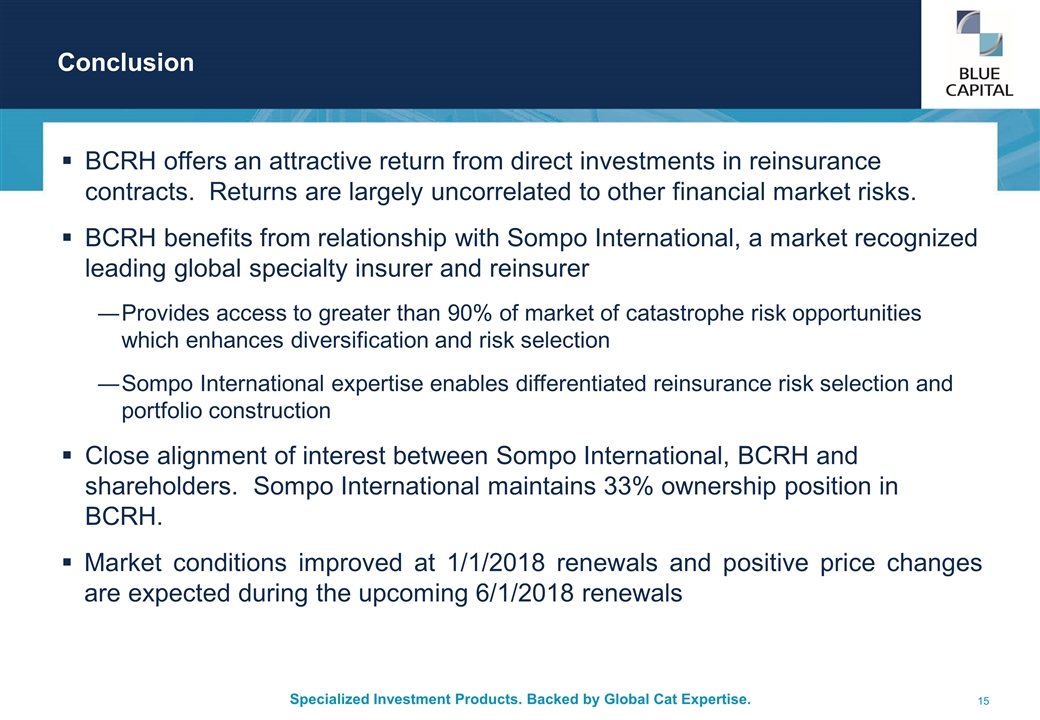
Conclusion BCRH offers an attractive return from direct investments in reinsurance contracts. Returns are largely uncorrelated to other financial market risks. BCRH benefits from relationship with Sompo International, a market recognized leading global specialty insurer and reinsurer Provides access to greater than 90% of market of catastrophe risk opportunities which enhances diversification and risk selection Sompo International expertise enables differentiated reinsurance risk selection and portfolio construction Close alignment of interest between Sompo International, BCRH and shareholders. Sompo International maintains 33% ownership position in BCRH. Market conditions improved at 1/1/2018 renewals and positive price changes are expected during the upcoming 6/1/2018 renewals
Appendix
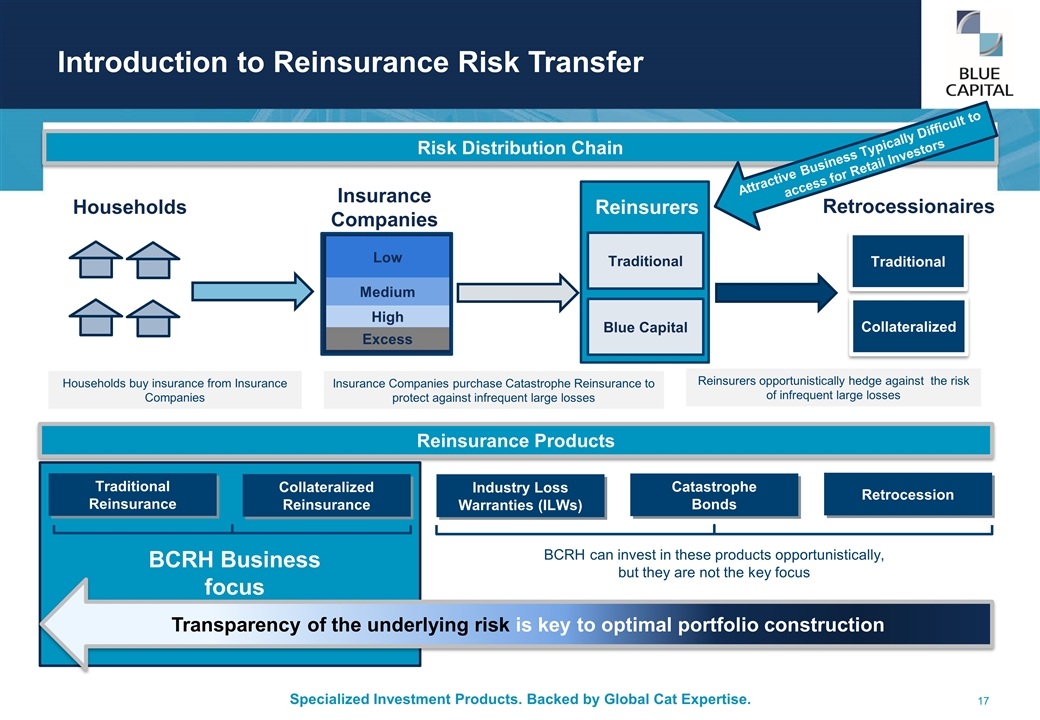
Introduction to Reinsurance Risk Transfer Liquidity Risk Distribution Chain Households buy insurance from Insurance Companies Reinsurers opportunistically hedge against the risk of infrequent large losses Traditional Insurance Companies purchase Catastrophe Reinsurance to protect against infrequent large losses Insurance Companies Reinsurers Retrocessionaires Traditional Collateralized Reinsurance Industry Loss Warranties (ILWs) Catastrophe Bonds BCRH Business focus Reinsurance Products Retrocession BCRH can invest in these products opportunistically, but they are not the key focus Households Traditional Reinsurance Transparency of the underlying risk is key to optimal portfolio construction Excess Low Medium High Collateralized Attractive Business Typically Difficult to access for Retail Investors Blue Capital
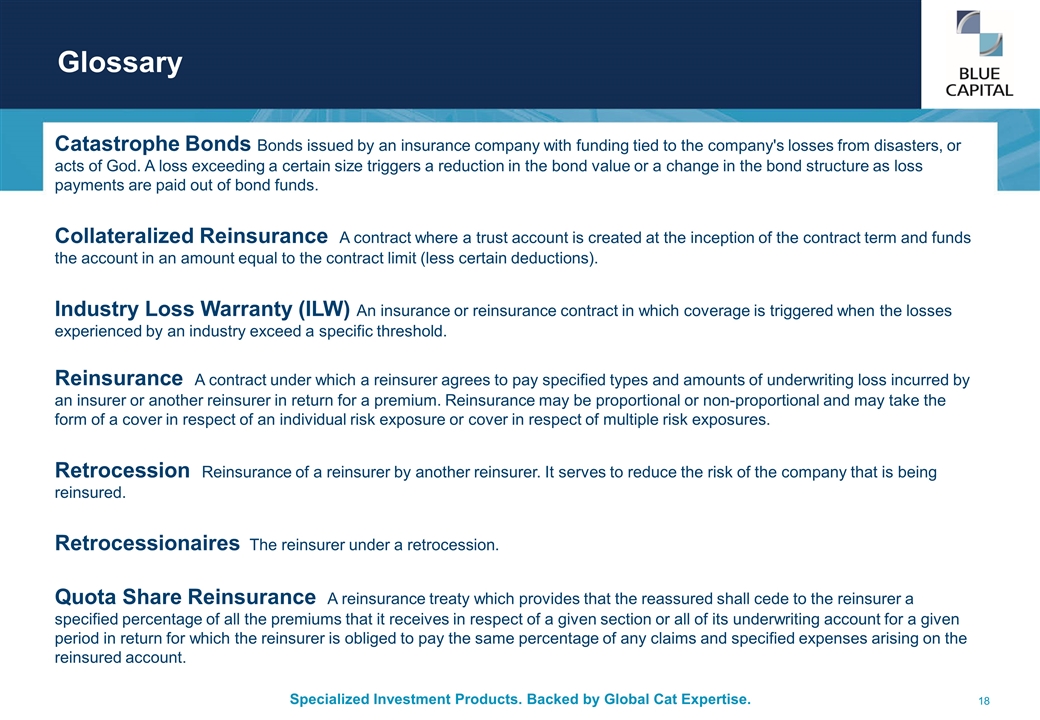
Glossary Catastrophe Bonds Bonds issued by an insurance company with funding tied to the company's losses from disasters, or acts of God. A loss exceeding a certain size triggers a reduction in the bond value or a change in the bond structure as loss payments are paid out of bond funds. Collateralized Reinsurance A contract where a trust account is created at the inception of the contract term and funds the account in an amount equal to the contract limit (less certain deductions). Industry Loss Warranty (ILW) An insurance or reinsurance contract in which coverage is triggered when the losses experienced by an industry exceed a specific threshold. Reinsurance A contract under which a reinsurer agrees to pay specified types and amounts of underwriting loss incurred by an insurer or another reinsurer in return for a premium. Reinsurance may be proportional or non-proportional and may take the form of a cover in respect of an individual risk exposure or cover in respect of multiple risk exposures. Retrocession Reinsurance of a reinsurer by another reinsurer. It serves to reduce the risk of the company that is being reinsured. Retrocessionaires The reinsurer under a retrocession. Quota Share Reinsurance A reinsurance treaty which provides that the reassured shall cede to the reinsurer a specified percentage of all the premiums that it receives in respect of a given section or all of its underwriting account for a given period in return for which the reinsurer is obliged to pay the same percentage of any claims and specified expenses arising on the reinsured account.

CONTACT: Investor Relations +1-441-278-0988 investorrelations@Sompo-Intl.com BLUE CAPITAL MANAGEMENT LTD. Waterloo House 100 Pitts Bay Road Pembroke HM 08 Bermuda
